gaps in completed fertility - tertilt.vwl.uni-mannheim.de
TRANSCRIPT

DISCUSSION PAPER SERIES
ABCD
No. 10355
GENDER GAPS IN COMPLETED FERTILITY
Erica Field, Vera Molitor and Michèle Tertilt
DEVELOPMENT ECONOMICS

ISSN 0265-8003
GENDER GAPS IN COMPLETED FERTILITY
Erica Field, Vera Molitor and Michèle Tertilt
Discussion Paper No. 10355
January 2015 Submitted 06 January 2015
Centre for Economic Policy Research
77 Bastwick Street, London EC1V 3PZ, UK
Tel: (44 20) 7183 8801
www.cepr.org
This Discussion Paper is issued under the auspices of the Centre’s research programme in DEVELOPMENT ECONOMICS. Any opinions expressed here are those of the author(s) and not those of the Centre for Economic Policy Research. Research disseminated by CEPR may include views on policy, but the Centre itself takes no institutional policy positions.
The Centre for Economic Policy Research was established in 1983 as an educational charity, to promote independent analysis and public discussion of open economies and the relations among them. It is pluralist and non‐partisan, bringing economic research to bear on the analysis of medium‐ and long‐run policy questions.
These Discussion Papers often represent preliminary or incomplete work, circulated to encourage discussion and comment. Citation and use of such a paper should take account of its provisional character.
Copyright: Erica Field, Vera Molitor and Michèle Tertilt

GENDER GAPS IN COMPLETED FERTILITY†
† We would like to thank Pascal Schmidt and Inken Toewe for excellent research assistance. We also thank seminar participants at the University of Mannheim for valuable comments. Financial Support from ERC Starting Grant 313719 is gratefully acknowledged.
Abstract
The most commonly used measure of reproductive behavior is the total fertility rate (TFR), which is a measure of the number of children born per woman. However, almost no work exists measuring the fertility behavior of men. In this paper we use survey data from several recent waves of the Demographic and Health Surveys in six developing countries in which men and women were each asked about their reproductive histories. We document a number of interesting differences in fertility outcomes of men and women. First, while one might have thought that average rates for men and women must coincide, we find that this is not the case. Comparing completed fertility by birth cohorts, we find that on average men have more children than women in four out of the six countries we consider. The gaps are large – reaching up to 4.6 children in Burkina Faso for the 1944‐48 birth cohort. We show that positive gaps are possible when populations are growing and men father children with younger women. Such a situation often coincides with polygyny, i.e. men having children with more than one woman. Indeed we find that the size of the fertility gap is positively related to the degree of polygyny in the country. Second, we find a higher variance in fertility rates for men than for women. In other words, women are more similar to each other in reproductive behavior than men are to one another. Third, we find that differences in the desire to have children can largely be explained by differences in realized fertility. This implies that differences in fertility preferences often emphasized in the literature do not necessarily need to cause conflict, as men and women can realize their fertility individually. Finally, we find that for men, the demographic transition started earlier and was steeper than for women. These novel facts are useful when building theories of fertility choice.
JEL Classification: J13 and J16 Keywords: fertility, gender and polygamy
Erica Field [email protected] Duke University and CEPR Vera Molitor vera.molitor@uni‐mannheim.de University of Mannheim Michèle Tertilt tertilt@uni‐mannheim.de University of Mannheim and CEPR

1. Introduction
There is a large literature within demography and population science analyzing fertility pat-
terns and trends. Within economics, the emphasis is placed on understanding fertility choices,
whereby fertility data is a fundamental ingredient to achieve this goal. Almost all of the known
“fertility facts” are based on surveys about the reproductive behavior of women, whereas male
fertility is largely ignored since most surveys ask only women about their child-bearing behav-
ior. Greene and Biddlecom (2000) already emphasized this lack of research on male fertility as
a problem more than a decade ago, pointing to several specific directions of future research on
male reproductive behavior. While this call has stimulated research on the role of men in repro-
ductive behavior (i.e. it is now more common to model reproductive behavior as a bargaining
outcome between two partners), the measurement itself has not changed. Because women may
remember pregnancies and births better than men, it is often believed that measuring fertility
purely based on women’s reproductive behavior is sufficient, and avoids double-counting. In this
paper, we seek to question this view.
Even though each child has two parents, we show that fertility rates of men and women need
not coincide. When populations are growing and large age gaps are common, gender gaps in
fertility are likely. Such a situation typically goes hand in hand with men fathering children
with multiple women.1 This could be due to formal polygyny. But even if polygyny is banned
(as in many countries today), having children with multiple partners (informal polygyny) is still
legal and frequently occurs. Another possibility is remarriage after divorce, separation, or death
– having additional children with the new partner has largely been ignored in the empirical
fertility literature. A traditional household survey only asks women about their reproductive
histories and children are rarely assigned to a particular birth father.
There are a few recent notable exceptions of surveys in which men are asked about their re-
productive histories. The Survey of Family Growth in the U.S. started interviewing men about
their reproductive behavior in 2002. Based on this data, Guzzo and Furstenberg (2007) find that
8% of American men had children with more than one partner. The number among poor African
American men is as high as one third, and 16% of them report children with three or more women.
Recent waves of the World Value Surveys and the Population Acceptance Study also include
questions on male fertility, specifically in European countries.2 The analysis of administrative
register data has become more common in recent years, particularly in Scandinavian countries.
Such data typically include information on fathers and mothers. From population registers, it is
possible to construct fertility measures for fathers separate from mothers. However, this possi-
bility has not been used much in the literature to date. Two notable exceptions are Lappegård1However, as we show in the Appendix, polygyny is not a necessary prerequisite for gender gaps in fertility.2Puur et al. (2008) and Westoff and Higgins (2009) use these data. However, the main research question isquite different from ours, as these papers focus on the relationship between men’s role orientation and fertilityaspirations.
2

and Rønsen (2011) and Kunze (2014), who both use Norwegian register data. Lappegård and
Rønsen (2011) study the importance of multi-partner fertility, finding a u-shaped relationship
between multi-partner fertility and income for men. Kunze (2014) studies how births affect the
earning dynamics of fathers. Boschini et al. (2011) use Swedish register data to analyze the
connection between career and fertility for men and women separately. In this context, they
find that childlessness is more common among men than women. Interestingly, they also find
that male fertility does not differ much by education levels, while female fertility does.
In sum, while very recent surveys sometimes include information on male fertility, so far these
data have been mostly used to analyze the importance of multi-partner fertility. What is lacking
are attempts to explore systematically the extent to which conventional “fertility facts” would
be different if measured based on data from men rather than women. In particular, the extent
to which average fertility could differ has not been explored.
To fill this void, we look at recent waves of the Demographic and Health Surveys (DHS) in
six different countries, primarily in Africa. The recent surveys include a sample of men who are
asked about their reproductive behavior.3 To analyze whether there are any robust patterns
across countries, we conduct the same analysis in each of the six different countries. We base our
analysis on the assumption that the discrepancy between male and female fertility, if it exists,
should be largest in highly polygynous countries and those with the largest gender age-gap in
childbearing. To investigate this hypothesis, we analyze three pairs of countries: two highly
polygynous countries (Senegal and Burkina Faso), two countries with a low level of polygyny
(Malawi and Ethiopia) and two countries where polygyny is almost non-existent (Madagascar
and India). For each country, we piece information together from different waves of the DHS to
compare the completed fertility of men and women of the same birth cohort.
We document some striking facts. First, we find that on average men have more children than
women of the same cohort in four out of the six countries considered. The gaps are large, ranging
from 1.3 children in Ethiopia, 2.1 children in Malawi, 3.1 children in Senegal to 4.6 children in
Burkina Faso, but appear to be decreasing over time. For example, in Burkina Faso, we find a
gap of 4.6 for the 1944-48 birth cohort and a smaller gap of only 2.8 for the 1951-55 birth cohort.
Similarly, the gap in Malawi is 2.1 for the 1946-50 cohort, falls to 1.7 for the 1950-54 cohort
and further decreases to 1.1 for the 1956-60 cohort. Positive gaps mean that men are bearing
children with younger women on average, and that either a larger fraction of women relative to
men remains childless or men are bearing children with multiple women. If men reproduce with
women who are on average younger and population size is growing, gender gaps in completed
fertility will necessarily be positive. Indeed, we find that the size of the gap is positively related
to the gender gap in the age of first birth and the degree of formal polygyny.3A few other studies have used the same data. Agajanian (2002) uses DHS data from Mozambique, in additionto qualitative field work in the Greater Maputo area, to study how men communicate about reproductivebehavior and contraception.
3

Second, we document a larger heterogeneity in fertility outcomes among men than among
women. The coefficient of variation of fertility for women is lower than that for men in all
countries, except India. In other words, with the exception of India, women are more similar
to each other in their reproductive behavior than are men. The gap is largest in the high
polygyny countries Burkina Faso and Senegal. Third, we find that differences in the desire to
have children can be explained to a large extent by differences in realized fertility. Fourth, we
document that the demographic transition started earlier and was steeper when considered from
a male perspective.
We believe that these findings are important for a number of reasons. First, investments in
children heavily depend on the resources of fathers. There is a large body of literature inves-
tigating how inequality becomes amplified through endogenous fertility and child investments.4
The literature shows that it matters how children are spread across families. Given that a large
fraction of wealth worldwide is owned by men, it matters how children are distributed across
men specifically. In other words, since men control the majority of resources, the number of
siblings who share the same father seems more informative than the number of siblings who
share the same mother. A related problem with ignoring children of men outside the household
is the assumption that transfers sent outside of or received into the household do not go towards
supporting parents’ offspring. This can lead to inaccurate measurement in the amount that par-
ents invest in their children when living in multiple partnership settings. Fathers’ investment in
children will be systematically underestimated when their offspring live in multiple households.
Second, it is often emphasized that men desire more children than women (Bankole and
Singh (1998)). Such discordant preferences are thought to lead to conflict and are sometimes
modeled as a bargaining game between spouses (Rasul (2008) and Doepke and Kindermann
(2013)).5 However, our results show that differences in demand for children are often mirrored
in differences in actual achieved fertility, such that there is no innate contradiction surrounding
fertility choices within couples.
Third, much polygyny today is informal, and as such is inadequately captured in survey data
on marital status or marital histories. One might be able to recover some information about the
organization of the family. In particular, by comparing male and female reproductive histories
along with information on the fraction of women that remain childless, we can estimate the
number of different women with which a man bears children (or what we might call “informal
polygany”) in a population. In sum, we believe that these new facts will be useful when building
theories of fertility choice.
In the next section, we describe our data. In Section 3, we document the extent to which
average completed fertility differs by gender. Section 4 analyzes differences in fertility inequality
4See, for example, Kremer and Chen (2002) and De la Croix and Doepke (2003).5See also Voas (2004) on this.
4

for men vs. women. In Section 5, we analyze differences in desired fertility and how it relates to
actual fertility. Section 6 reconsiders the demographic transition from a male perspective, and
Section 7 concludes. The Appendix contains additional data and a simple model.
2. The Data
2.1. Some Preliminaries
There are several different methods that could be used to compare the fertilities of men to those
of women. For example, one could compute the number of births in a given year relative to
the number of women and men of child-bearing age. Alternatively, one could try to construct
measures of the total fertility rate for men and compare it to standard female total fertility rates.
The measure that most closely captures actual fertility choices is the “completed fertility rate”
(or “children ever born”) based on self-reported fertility histories.6 When using this measure
to compare fertility rates over time, one usually compares children ever born by birth cohorts
of mothers. We follow the same approach here, computing completed fertility rates for men
by birth cohorts and comparing them to women of the same birth cohort.7 Although men and
women of the same birth cohort do not necessarily have children with each other, the purpose
of the paper is to investigate the extent to which cohorts of men and women born at the same
time and living during the same years (and hence facing the same economic conditions over their
lifetime) make different fertility choices.
Naturally, there are some challenges with the data. To ensure that people have truly completed
their fertility, one should use data from relatively old people. However, only living people can
be asked about their completed fertility – waiting until people are 70 in countries where the
average life expectancy is around 50 is not very practical. Even more importantly, the oldest
men included in the Demographic and Health Surveys, of which we make use, are 59. Wherever
possible, we measure completed fertility based on men aged 55 to 59. Additionally, women are
only included in the surveys up to age 49. To compare men and women of the same birth
cohort, we thus have to piece together information from different survey years. For example, we
can construct male fertility for the 1941-45 cohort of men by using 55-59 year old men from a
2010 survey. If we used the oldest women from the same survey (45-49 years old), they would
correspond to a different birth cohort. However, we can use data from a second survey (ideally
2000) to compute the fertility rate for the 1941-45 female cohort by analyzing 45-49 year old
women from the earlier survey. Unfortunately, the DHS surveys are not always spaced exactly
10 years apart. Therefore, we sometimes have to use slightly different ages in our comparisons.
The exact combination of data sets, ages and cohorts used in our analysis will be detailed further6This is a commonly used measure, see for example Jones and Tertilt (2008).7In line with the literature, completed fertility rates are computed based on all men and women, including thosewith zero children.
5
below.
One important question one might ask is whether men in their 50s and women in their 40s
truly have completed their reproduction. There is a large literature on this topic within biology
and medicine. McKinlay, Brambilla, and Posner (1992) find that the median age for the onset
of menopause in the U.S. is 51 years. However, female fecundity is already severely reduced in
the pre-menopausal phase, which is supported by the findings of Eijkemans et al. (2014). They
show that the likelihood of sterility dramatically increases after the age of 38 for European and
North American women, reaching almost 90% at the age of 45. Moreover, the onset age of
menopause increases with development (due to better nutrition), so that it likely occurs earlier
in our samples of African and Indian women (see e.g. Sidibe, 2005). We thus believe that we are
not missing many children when computing completed fertility based on our samples of women
older than 40. Male fecundity also decreases with age, but more slowly than for women, and
there is no equivalent to menopause beyond which complete sterility occurs (see for example
Kidd, Eskenazi, and Wyrobek (2001) and Harris et al. (2011)). Thus, to measure completed
male fertility, we survey men at later ages than women, which we do. Nonetheless, because men
can have children beyond their mid-50s, it is important to note throughout that our measures of
male fertility are biased downwards by the age cutoff we choose to employ in order to minimize
the influence of selective mortality.
2.2. The DHS Samples
We use data from six different developing countries. For convenience, we classify them by their
degree of polygyny: Burkina Faso and Senegal both have high rates of polygyny, Malawi and
Ethiopia have lower rates of polygyny, and Madagascar and India experience almost no polygyny.
We use recent waves of the Demographic and Health Surveys (DHS) for our analysis. The
spacing between consecutive waves in the same country is typically five years, although there are
exceptions. Each survey is a representative sample of households.8 To assure representativeness
on national, regional and residence levels, individual sample weights are included, which we use
in our calculations unless otherwise noted.
Even though the DHS is a household survey, not all household members are interviewed.
The main target group is women of reproductive age (15-49 years). However, recent waves also
include interviews with a sub-sample of men (aged 15-54/59). The fraction of men interviewed
varies by country and year, with the fraction of households eligible for male interviews varying
from around every 1.6th to every 4th household. The final ratio of interviewed women and
8In most instances, the sample is based on a stratified two-stage cluster design. The enumeration areas aredrawn from Census files in the first stage and the households in each enumeration area are drawn from anupdated list of households. More detailed information on the sample design can be found on the DHS websitehttp://www.measuredhs.com/What-We-Do/Survey-Types/DHS-Methodology.cfm.
6

men also differs due to (small) differences in non-response rates by gender.9 The sex ratio of
interviewed people for the surveys used are given in Table A2 in the Appendix.
In each of the six countries, we use all DHS waves that include a male sample. Depending on
the country, there are between one (India) and four (Burkina Faso, Senegal and Malawi) waves
that include a male sample. When available, we incorporate an additional earlier wave with only
female interviewees, since, as explained above, we use women from earlier surveys to construct
the fertility rates of the same birth cohorts of men and women. Based on these criteria, we end
up with four different DHS surveys for Burkina Faso, Senegal, Malawi and Madagascar, and
only two different surveys for Ethiopia and India. In Table 1, we provide an overview of the
surveys used.10 The table includes sample sizes by gender, and the age ranges of the interviewed
people. For the majority of countries, the most recent waves of the DHS were conducted in 2010
or 2011. Only for Madagascar and India was the latest data collected in 2008/09 and 2005/06,
respectively.
Table 1 also includes the polygyny rate – measured as the fraction of all married women
with at least one co-wife – and the total fertility rates (TFR). While women who live together
with their partner but are not married are included, we are not accounting for couples who
co-parent but do not live with one another, which may be large in some settings in which men
have children across multiple households. The highest polygyny rates can be found in Burkina
Faso (42% in 2010) and the lowest in India (2% in 2005/06). The same pattern holds true for
the total fertility rates, with Burkina Faso having the highest TFR of 6.0 in 2010 and India the
lowest, with 2.7 in 2005/06. This means that the TFRs and polygyny rates in our sample are
positively correlated – the higher the fraction of women with a co-wife in a country, the higher
the total fertility rates.
As explained in Section 2, the goal is to compare the number of children ever born by birth
cohorts of the parents. Combining men born within a given period of 5 years into one birth
cohort ensures sufficiently large sample sizes. For the reasons discussed above, whenever possible
we use men between the ages of 55 and 59 and compare them to women aged 45 to 49 from a
survey conducted 10 years earlier. However, we sometimes have to deviate from this rule for
two reasons: first, in some cases the oldest men interviewed are only 54 (Malawi and India);
and second, the surveys are not always conducted exactly 10 years apart. Table 2 provides an
overview of which birth cohorts we actually use, from which DHS the information is taken and
the ages at the time of the interview. The table also includes the sample sizes of the relevant
9Overall response rates were high, with household response rates of over 97%. However, not all eligible individualswere interviewed. Depending on the country and year, female response rates are over 92%, while males ratesmay be as low as 85%.
10Note that the Ethiopian calender is different to the Gregorian one, generally being 92 months behind. Forexample, the DHS 2011 is conducted in the Ethiopian year 2003 and the year of birth of the interviewedpeople is provided in the Ethiopian system. For an easy comparison with the other countries, we state theapproximated Gregorian years in the table and throughout the paper (Ethiopian year +8 years).
7

Table 1: DHS Information
Polygyny Country Year Sample size Ages Polyg.1a TFR1b
prevalence DHS women men women men (in %)
High Burkina Faso 2010 17,087 7,307 15-49 15-59 42 6.02003 12,477 3,605 15-49 15-59 48 5.91998-99 6,445 2,641 15-49 15-59 55 6.41993 6,354 1,845 15-49 18-97 51 6.5
Senegal 2010-11 15,688 4,929 15-49 15-59 35 5.02005 14,602 3,761 15-49 15-59 39 5.31997 8,593 4,306 15-49 15-59 47 5.71992-93 6,310 1,436 15-49 20-92 48 6.0
Low Malawi 2010 23,020 7,175 15-49 15-54 14 5.72004-05 11,698 3,261 15-49 15-54 16 6.02000 13,220 3,092 15-49 15-54 17 6.31992 4,849 1,151 15-49 20-54 20 6.7
Ethiopia 2011 16,515 14,110 15-49 15-59 11 4.82000 15,367 2,607 15-49 15-59 14 5.5
Almost No Madagascar 2008-09 17,375 8,586 15-49 15-59 3 4.82003-04 7,949 2,432 15-49 15-59 3 5.21997 7,060 . 15-49 . 3 6.11992 6260 . 15-49 . 4 6.1
India 2005-06 124,385 74,369 15-49 15-54 2 2.71998-991c 89,199 . 15-49 . . 2.8
Notes: Individual sample weights are used for the calculations. Polygyny preval. stands for polygynyprevalence. (1a) Fraction of all women, who are married or live together with their partner, with at leastone cowife, taking out the missing values. (1b) Total fertility rates are taken from the statcompiler which isbased on the corresponding DHS data. (1c) Only ever married women are interviewed.
birth cohorts, which are obviously much smaller than the size of the overall surveys given in Table
1. Note that we used surveys only around 5 years apart to construct data for the same birth
cohorts of men and women in the cases of India and Malawi, given that men were included only
up to the age of 54 in these countries, while the oldest women in the survey are 49. Comparing
surveys 5 years apart leads to the oldest men and women respectively being from the same birth
cohort.
The second reason why we cannot always compare exactly 45-49 year old women to 55-59 year
old men is that the spacing between the surveys is rarely exactly 5 or 10 years. Our procedure
here was to use the oldest men for which data is available and adjust the ages of the women
so that they are from the exact same birth cohort. This logic explains why the women of the
1951-55 cohort in Burkina Faso are aged 42-48, for example, given that the DHS are 11-12 years
apart. This example shows a further complication, since several DHS waves include interviews
from two consecutive years.11 Fortunately, the surveys include a question of the year of birth,11Interviews were typically spread out over several months, which in some cases included December of one year
8

upon which we base our selection of men and women. However, depending on the exact birth
date and the month of the survey, 5 years of birth cohort can include people of more than 5
different ages, as the example of Burkina Faso shows. The final sample sizes are obviously much
smaller than the size of the surveys. They range from 394 (Burkina Faso DHS 1993) to 9,312
(India DHS 1998/99) for women and from 93 (Madagascar DHS 2003/04) to 3,997 (India DHS
2005/06) for men. The small samples size for Madagascar makes inference for the cohort born
in 1945-49 difficult.
The polygyny rates reported in Table 2 are higher for the older cohorts than for the whole
sample (compare with Table 1) for all countries, except for the countries with a low level of
polygyny. This is unsurprising, since polygyny rates have been falling over time and the rates in
Table 1 also include younger couples. In addition, men are asked whether they currently have
more than one wife or partner, which is shown in the last column of Table 2. These rates are in
line with our categorization of the six countries into high, low and almost no polygyny.
Table 2: Summary Statistics
Country Cohort Women2a Men2b
DHS Total Age Poly.2c DHS Total Age Poly.2d
Burkina Faso 1951-55 1998/99 478 42-48 0.69 2010 350 54-59 0.451944-48 1993 394 44-49 0.63 2003 188 54-59 0.55
Senegal 1951-55 1997 693 41-46 0.65 2010/11 233 54-59 0.381946-50 1992/93 495 42-47 0.67 2005 150 54-59 0.49
Malawi 1956-60 2004/05 803 43-49 0.22 2010 401 49-54 0.121950-54 2000 766 45-49 0.14 2004/05 175 50-54 0.161946-50 1992 412 41-46 0.28 2000 186 49-54 0.22
Ethiopia 1952-56 2000 1194 43-48 0.19 2011 541 54-59 0.08Madagascar 1949-53 1997 500 43-48 0.01 2008/09 387 55-59 0.02
1945-49 1992 427 42-47 0.02 2003/04 93 54-59 0.00
India 1951-55 1998/99 9312 42-49 . 2005/06 3997 50-54 0.02Notes: Individual sample weights are used to calculate the statistics. (2a) Information is based on the sampleof women who provide information on the number of born children. (2b) Information is based on the sampleof men who provide information on the number of born children. (2c) Polygyny is measured as the fractionof women, who are married or live together with their partner, with at least one cowife. (2d) Polygyny ismeasured as the fraction of men with more than one wife/partner.
3. Gender Gaps in Fertility
We now compare the average completed fertility for men and women of the same birth cohort.
As Table 3 shows, men have many more children than women in almost all countries that we
consider. The gap is particularly pronounced in countries with high levels of polygyny. In
and January of the following year.
9
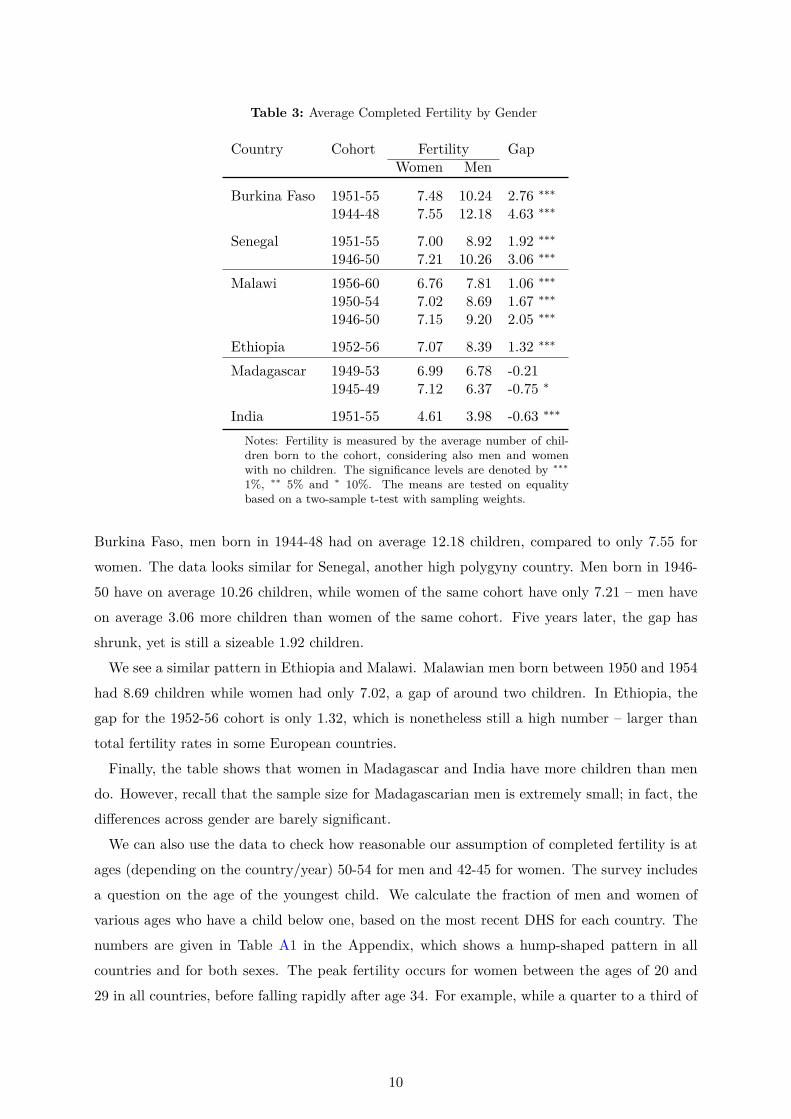
Table 3: Average Completed Fertility by Gender
Country Cohort Fertility GapWomen Men
Burkina Faso 1951-55 7.48 10.24 2.76 ∗∗∗
1944-48 7.55 12.18 4.63 ∗∗∗
Senegal 1951-55 7.00 8.92 1.92 ∗∗∗
1946-50 7.21 10.26 3.06 ∗∗∗
Malawi 1956-60 6.76 7.81 1.06 ∗∗∗
1950-54 7.02 8.69 1.67 ∗∗∗
1946-50 7.15 9.20 2.05 ∗∗∗
Ethiopia 1952-56 7.07 8.39 1.32 ∗∗∗
Madagascar 1949-53 6.99 6.78 -0.211945-49 7.12 6.37 -0.75 ∗
India 1951-55 4.61 3.98 -0.63 ∗∗∗
Notes: Fertility is measured by the average number of chil-dren born to the cohort, considering also men and womenwith no children. The significance levels are denoted by ∗∗∗1%, ∗∗ 5% and ∗ 10%. The means are tested on equalitybased on a two-sample t-test with sampling weights.
Burkina Faso, men born in 1944-48 had on average 12.18 children, compared to only 7.55 for
women. The data looks similar for Senegal, another high polygyny country. Men born in 1946-
50 have on average 10.26 children, while women of the same cohort have only 7.21 – men have
on average 3.06 more children than women of the same cohort. Five years later, the gap has
shrunk, yet is still a sizeable 1.92 children.
We see a similar pattern in Ethiopia and Malawi. Malawian men born between 1950 and 1954
had 8.69 children while women had only 7.02, a gap of around two children. In Ethiopia, the
gap for the 1952-56 cohort is only 1.32, which is nonetheless still a high number – larger than
total fertility rates in some European countries.
Finally, the table shows that women in Madagascar and India have more children than men
do. However, recall that the sample size for Madagascarian men is extremely small; in fact, the
differences across gender are barely significant.
We can also use the data to check how reasonable our assumption of completed fertility is at
ages (depending on the country/year) 50-54 for men and 42-45 for women. The survey includes
a question on the age of the youngest child. We calculate the fraction of men and women of
various ages who have a child below one, based on the most recent DHS for each country. The
numbers are given in Table A1 in the Appendix, which shows a hump-shaped pattern in all
countries and for both sexes. The peak fertility occurs for women between the ages of 20 and
29 in all countries, before falling rapidly after age 34. For example, while a quarter to a third of
10
all 25-34 year olds have a child that was born in the last year, this has declined to 11% or less
by 40-44. Very few women aged 45 or older have children. The highest percentage is in Malawi,
with 3% of 45-49 year old women having a child born during the previous year. Therefore, we
think that it is fairly innocuous to use completed fertility rates of women aged 42 and older as
a proxy for completed lifetime fertility rates.
The corresponding figures for men look somewhat different, particularly in the highly polygy-
nous countries. For men, peak fertility occurs at later ages, between 25 and 49 depending on the
country. In some countries, there is still a large fraction of men in the oldest age group who have
a child aged one or younger, as high as 22% for 55-59 year old men in Senegal. Therefore, it is
difficult to argue that men have truly completed their fertility by this age. However, this finding
biases our results concerning the average fertility of men downwards. In other words, adjusting
for children that men have at even older ages would further increase the male fertility rates and
thereby increase the gender gaps in fertility reported in Table 3. Note also that for countries
with low levels of polygyny, the fraction of men with a child born in the previous year peaks at
an earlier age and is considerably lower for the older ages and thus even less problematic for our
assumption that fertility is completed for men in their mid-50s.
Men achieve these high fertility rates by continuing to have children beyond their mid-40s,
at ages when women are essentially no longer fertile. To observe this, we depict the number of
children born over the life cycle. Since the Demographic and Health Surveys are not panels, but
rather consist of repeated cross sections, we cannot compute fertility rates for the same cohorts
over their life cycle. Instead, we construct an artificial life cycle by piecing together different
cohorts. Figure 1 depicts one life-cycle profile for each country, based on the most recent
DHS wave in each of our six countries. To make it more transparent how these graphs were
constructed, we have labeled them with the birth cohort of the mothers and fathers, respectively.
To convert this into ages, note that these profiles start at the age 15 and continue to 59 for all
countries apart from India and Madagascar, where the highest age is 54. Furthermore, for
women, we have data only until the age of 49. However, female fecundity after the age 49 is
essentially zero.12 Thus, to make the increasing gap between men and women at older ages more
visible, we have added figures for the older cohorts of women to the graphs by assuming that
fertility does not grow after the age of 49.13
The first thing to note from Figure 1 is that men start having children later in life than
women. Accordingly, young women have more children than young men, which is true in all
countries that we consider. For example, in Burkina Faso, women in the 1986 cohort, i.e. those
aged 24 when asked about their children, already have 2 children, whereas men of the same age
have less than one child on average. However, the gap closes as age increases, which is of course12As previously discussed, assuming it is zero thereafter seems a relatively innocuous assumption.13In the graphs, this corresponds to the 1960 cohorts and older for Burkina Faso, Senegal and Malawi, the 1958
cohorts and older for Madagascar, 1961 for Ethiopia and 1955 for India.
11

unsurprising given the age gap in marriage. What is more interesting is that the gap eventually
reverses sign. In other words, men continue to increase their fertility well into their 50s, while
women stop in their mid-40s. This pattern is most pronounced in Burkina Faso and Senegal,
the most polygynous countries. However, we even see the same pattern in Ethiopia, Malawi and
Madagascar, albeit to a lesser degree.
3.1. The Importance of Population Growth and Age Gaps
Large gender gaps in fertility may seem puzzling and one may suspect measurement issues
(which we discuss in the next section). However, in Appendix B we demonstrate in a simple
model, that gender gaps in fertility are perfectly feasible and do not violate any adding up
constraints caused by the fact that each child has a father and a mother. The key ingredient is
that men have children with cohorts of women that are larger than their own. Such a situation
arises naturally when populations are growing and men have children with younger women. A
growing population makes it possible for a large fraction of men to have more than one wife14, or
for a larger fraction of women than men to remain childless, thereby widening the gap between
male and female completed fertility.15 From Figure 2 we see that the fraction of women with
zero children is very small for the countries/cohorts we consider and in most cases not larger
than the fraction of men. Thus, polygyny must be an important factor.
As the model predicts, we do see large age gaps in the countries with large fertility gaps. Table
4 shows the average age at first birth by gender and the resulting age gap for all six countries.
The age gap is highest in the highly polygynous countries.16 For example, the gender age gap
at first birth in Burkina Faso is 8.6 years.
Yet, are the age gaps large enough to quantitatively explain the extremely large fertility gaps?
A simple back of the envelope calculation shows that the age gap is indeed sufficiently large to
give rise to such stark differences in completed fertility across men and women. Consider the
cohort of 1950-1955 in Burkina Faso, and suppose that men are bearing children with women
who are a decade younger.17 The ratio of men ages 30-34 and women ages 20-24 according
to the 1980 census was 0.61. Given that male fertility in this cohort is 10.24, in this example
female fertility should be 6.28 among women a decade younger, and also among women of the
same cohort if fertility rates are relatively constant. The predicted gap of 4 children is even
14This point is also made in Tertilt (2005).15This paper is not concerned with formal marriage; rather, we are interested in those “women a man has fathered
children with.” Since this is a cumbersome expression, we often write “wife” instead. However, this does notmean that she is an official wife or even a cohabiting partner.
16For the low and almost-no polygyny countries, only Madagascar’s age gap for the cohorts born in 1945-49 isat a comparatively high level. However, since the underlying sample size for men is below 93, this age gapshould be interpreted with caution.
17Given that the gender gap in age of first birth is 8.6 for this cohort, this is a reasonable approximation of thegender difference in age of birth, which should generally be larger than the gender difference in age of firstbirth given that men have longer reproductive spans than women.
12

Figure 1: Number of Children Born by Birth Cohorts
02
46
810
959493929190898887868584838281807978777675747372717069686766656463626160595857565554535251
Year of Birth
women (extrapolation for year of birth <1961) men
(a) Burkina Faso0
24
68
10
96959493929190898887868584838281807978777675747372717069686766656463626160595857565554535251
Year of Birth
women (extrapolation for year of birth <1961) men
(b) Senegal
02
46
810
969594939291908988878685848382818079787776757473727170696867666564636261605958575655545352
Year of Birth (Gregorian Calendar)
women (extrapolation for year of birth <1962) men
(c) Ethiopia
02
46
810
95 94 93 92 91 90 89 88 87 86 85 84 83 82 81 80 79 78 77 76 75 74 73 72 71 70 69 68 67 66 65 64 63 62 61 60 59 58 57 56
Year of Birth
women (extrapolation for year of birth <1961) men
(d) Malawi
02
46
810
94939291908988878685848382818079787776757473727170696867666564636261605958575655545352515049
Year of Birth
women (extrapolation for year of birth <1959) men
(e) Madagascar
02
46
810
91 90 89 88 87 86 85 84 83 82 81 80 79 78 77 76 75 74 73 72 71 70 69 68 67 66 65 64 63 62 61 60 59 58 57 56 55 54 53 52 51
Year of Birth
women (extrapolation for year of birth <1956) men
(f) India
13

Table 4: Age at First Birth by Gender
Country Cohort Age at first birth GapWomen Men
Burkina Faso 1951-55 19.8 28.4 8.6 ∗∗∗
1944-48 19.8 . .
Senegal 1951-55 19.6 30.2 10.6 ∗∗∗
1946-50 19.4 28.1 8.7 ∗∗∗
Malawi 1956-60 19.5 24.7 5.2 ∗∗∗
1950-54 19.6 24.6 5.0 ∗∗∗
1946-50 19.9 . .
Ethiopia 1952-56 18.8 26.2 7.4 ∗∗∗
Madagascar 1949-53 19.7 25.5 5.9 ∗∗∗
1945-49 18.6 28.4 9.8 ∗∗∗
India 1951-55 19.4 26.2 6.8 ∗∗∗
Notes: ∗∗∗ 1%, ∗∗ 5% and ∗ 10% significance level. The meansare tested on equality based on a two-sample t-test with sam-pling weights.
larger than the actual fertility difference we observe in the DHS of that cohort (2.76), and falls
almost exactly between the estimates of the gender gap of the cohort of 1944-48 and the cohort
of 1951-55. While the actual fertility difference will depend on the exact matching of partners
across cohorts, which is unobservable in the DHS, this back of the envelope calculation verifies
that our observed gender gaps are close to what we would estimate with available information on
age gaps and cohort sizes, and hence not likely to reflect measurement error in fertility reporting.
What does all of this mean for the essentially monogamous countries India and Madagascar?
Do the negative gaps, i.e. the finding that women have more children than men, imply that
women in these countries have children with multiple men? Even if polyandry is not legal in
these countries, sequential polyandry is of course possible in the sense that women first have
children with one man and then additional children with a second husband after the death of
the first husband or divorce/separation. However, divorce is relatively rare in these countries.
A more likely explanation is again offered by the large age gaps reported in Table 4, whereby
the negative fertility gaps could result from the age gap in combination with the demographic
transition. If men have children with women of a later cohort (due to the age gap) and fertility
is falling over time, then it is necessary for any given cohort that the fertility of women is higher
than that of men.18 Another factor in India is differentially high adult female mortality, which
undoes some of the cohort-size imbalance that gives rise to fertility differentials.19
18As is demonstrated by term ξ in equation (3) in Appendix B.19For instance, in 1970, the population of women 20-24 was almost identical to the population of men 25-29,
despite differences in cohort size at birth due to population growth
14

3.2. Alternative Explanations Based on Measurement Issues
In this section, we explore whether the large gender gaps in fertility could be an artifact of
measurement. First, it is possible that differential mortality biases our estimates of average
fertility. Naturally, by using retrospective fertility outcomes of men and women aged between
40 and 59, we focus on people who survive to that age. If high fertility increased mortality for
women, then we could be systematically missing the high fertility women, which would downward
bias the female fertility estimates. However, we find this an unlikely explanation, because if
women die due to pregnancy-related reasons, they often die when pregnant with their first child.
This would bias results in the opposite direction and could clearly not explain why the fertility
of men is higher than women. Furthermore, the fact that the fertility gap is very different across
countries, and in fact negative for India and Madagascar, makes differential mortality unlikely
to be the main explanation, unless one considered that such differential mortality only existed
in some of the countries.
Second, it could be the case that the DHS is not representative of men and we are system-
atically missing those men who remain childless. As one indicator, we compare the sex ratios
(number of men per woman) based on national census data published by the UN with those in
the DHS. We calculate the ratio of interviewed men and women, adjusting for the fraction of
sampled households in which men are supposed to be interviewed. These sex ratios are presented
in Table 5, with the left two columns presenting the ratios for the age group of 15 to 49 years
and the right two columns only for those aged 45-49. Such a comparison is not possible for older
cohorts (50-59), namely those of relevance for our analysis, since women are only interviewed
until age 49. Even though the DHS sex ratios are systematically lower for the whole age group
15-49 in all countries (indicating that the DHS covers fewer men than would be representative)
this is mainly driven by the younger cohorts. For the cohort aged 45-49, closest to the relevant
group of people, the discrepancies between the sex ratios is less pronounced and even negative
for the surveys in Burkina Faso in 2010 and Senegal in 2010/11. Thus, we do not believe that
the large gender gaps could only be explained by missing men in our analysis.
Third, could there be some systematic over-/underreporting of fertility, differing for men
vs. women? Given that women spend nine months in pregnancy and typically another year or
more nursing, and since giving birth itself can be a long and painful process, it seems unlikely
that a woman would not remember all her children. These arguments do not apply to men.
Moreover, a man can never be absolutely sure that a child is truly his own. Thus, there could
be double-counting of children if several men claimed the same child. Alternatively, there could
be underreporting of male fertility if some children were not attributed to any father. A small
body of literature exists concerning the issue of reporting bias in male fertility. There seems to
be some evidence of male underreporting of fertility (for example, Rendall et al. (1999) find that
15

men tend to severely underreport their non-marital births in data from the US and the UK),
although other papers find no difference in reporting bias between men and women (e.g. Fikree,
Gray, and Shah (1993), based on a small sample of men and women in Vermont). Probably more
relevant for our study is evidence from other African countries. Ratcliffe et al. (2002) analyze
data from the Gambia, a highly polygynous country, finding no difference in the reliability of
male vs. female fertility reports. Similarly, Hertrich (1998) finds no difference in the reliability
of reporting live births between men and women in Mali. Given that none of the studies find
that men overreport fertility, it seems highly unlikely that the gender gaps we find in fertility
are an artifact of male reporting biases.
Table 5: Sex Ratios
Number of Men per WomenAged 15-49 Aged 45-49
Country Year Census DHS Census DHS
Burkina Faso 2010 0.99 0.76 0.86 0.922003 0.97 0.73 0.80 0.66
Senegal 2010/11 0.94 0.74 0.82 0.872005 0.94 0.70 0.84 0.84
Malawi 2010 1.02 0.86 0.92 0.882004/05 0.99 0.79 0.87 0.702000 0.97 0.88 0.91 0.91
Ethiopia 2011 1.0 0.78 0.94 0.87Madagascar 2008/09 0.99 0.88 0.96 0.95
2003/04 0.99 0.83 0.97 0.94
India 2005/06 1.08 0.89 1.08 1.05Source: The Census sex ratios are published by the United Na-tions, Department of Economic and Social Affairs, Population Division(2013), World Population Prospects: The 2012 Revision and based onnational census data.
4. Fertility Inequality Higher for Men
Thus far, we have established that on average men have more children than women in the
countries that we analyze, except for Madagascar and India. Furthermore, we have argued that
it is indeed possible that all men have more children than women in countries with population
growth and high age gaps. In reality, of course, there is significant heterogeneity, as some
people have many children, while others have very few or even none. We now turn to analyzing
the heterogeneity in fertility decisions separately for men and women. Specifically, Table 6
displays two measures of fertility inequality for the six countries: the standard deviation and the
coefficient of variation (CV). The first thing to note is that the standard deviation of fertility of
16

Table 6: Fertility Inequality by Gender
Country Cohort SD CVWomen Men Women Men
Burkina Faso 1951-55 2.63 5.25 0.35 0.511944-48 2.83 6.23 0.37 0.51
Senegal 1951-55 2.91 4.94 0.42 0.551946-50 3.01 5.36 0.42 0.52
Malawi 1956-60 2.87 3.75 0.42 0.481950-54 3.17 3.66 0.45 0.421946-50 3.08 4.20 0.43 0.46
Ethiopia 1952-56 2.81 3.50 0.40 0.42Madagascar 1949-53 3.77 3.82 0.54 0.56
1945-49 4.04 2.61 0.57 0.41
India 1951-55 2.42 2.23 0.52 0.56Notes: SD represents the standard deviation. CV is the coefficient ofvariation, which is the standard deviation divided by the mean.
men is much higher than for women. For example, the standard deviation of the 1951-55 cohort
in Burkina Faso is 5.25 for men, compared to only 2.63 for women.
To better compare fertility inequality across gender and countries with very different means,
the table also includes the coefficient of variation. Even controlling for the fact that mean fertility
is lower for women, we find a larger degree of inequality for men than women in all countries.20
Accordingly, women are more similar to each other in their fertility behavior than men are to
each other in almost every country that we consider. Again considering the example of the
1951-55 cohort in Burkina Faso, we find a CV for men of 0.51 compared to only 0.35 for women.
Interestingly, the coefficient of variation for men is very similar across countries, at around 0.5.
The finding that male fertility inequality is larger than female inequality is strongest in the
high polygyny countries. In Burkina Faso and Senegal, the difference between the male and
female CV is 0.10 or higher, depending on the cohort considered. In the low polygyny countries
(Ethiopia and Malawi), it is only between 0.02 and 0.06.21 Finally, the almost no polygyny
countries (Madagascar and India) only display a gap of 0.02 to 0.04.22 Put differently, high
male heterogeneity in fertility directly translates into high female heterogeneity in monogamous
countries. This is not the case in countries with a high degree of polygyny where men have
another margin of adjustment. Those men who want many children do not necessarily need a
woman who agrees, but rather they can have children with multiple women.
20There are two exceptions, namely the 1950-54 cohort in Malawi and the 1945-49 cohort in Madagascar.21Again, the 1950-54 cohort in Malawi does not follow this pattern, as female fertility inequality is higher than
male.22The 1945-49 cohort in Madagascar shows a higher inequality for women than for men. However, this result
needs to be regarded with caution due to the small male sample size.
17

To gain a better sense of how male and female fertility behaviors differ, Figure 2 displays the
distribution of fertility outcomes. For each country, we have plotted only one distribution, based
on the most recent cohort for which we have data. Each panel includes separate distributions
for men and women. The first thing to note is that the distribution for men is flatter than the
female distribution and shifted to the right. Again, the differences between men and women are
most striking for Burkina Faso and Senegal. While there are no women with more than 14 (16)
children in Burkina Faso (Senegal), many men have higher fertility rates, with some having up
to 27 children. The percentage of men with more children than the highest fertility of women
is quite large, at 19% in Burkina Faso and 10% in Senegal. Figure A1 in the Appendix shows
the fertility distribution, which is censored for the gender with the higher maximum number of
born children at the highest fertility reported by the opposite gender. While 24% (12%) of the
men in Burkina Faso (Senegal) have more than 13 (15) children, only 0.7% (0.2%) of the women
do so.
The pattern in Ethiopia and Malawi is less pronounced but qualitatively similar. In each case,
there is a sizeable fraction of men having more children than the highest fertility women, at 2%
in Ethiopia and 3% in Malawi. What is also interesting is that no large fraction of childless men
is observed in any of the four polygynous countries. One might have thought that high male
fertility inequality means many men with high numbers of wives and children and equally many
with no wives and children, yet this is clearly not the case. On the contrary, the fraction of men
without any children is lower than the fraction of women with no children in both Burkina Faso
and Ethiopia. In Malawi, the fractions are essentially the same. Only in Senegal and India do
we have a higher fraction of childless men than women, although the numbers are still small in
absolute terms, with around 4% of men having no children.
Finally, turning to our no polygyny countries, Madagascar and India, it is striking how similar
the distributions are for men and women.
As a side note, it is interesting to compare the distribution of children across women against
other countries. Jones and Tertilt (2008) provide fertility distributions for a series of cohorts of
U.S. women, from 1826-1830 to 1956-1960. The shape of the distribution substantially changes
over the century, in parallel with the declining average fertility rate. The first cohort (1826-1830)
has the highest completed fertility rate, namely 5.6 children per woman, and thus is closest (in
mean) to the rates of the countries considered in this paper. Nonetheless, the distribution looks
surprisingly different (see Figure 3). First, the fraction of childless women is much higher in
the US. The data analyzed in Jones and Tertilt (2008) shows that this is not an anomaly of
this particular cohort, as the rate of childlessness is above 10% for almost all cohorts, which is
much larger than for the six developing countries analyzed in this paper. Furthermore, the US
distribution is much more concentrated to the left. The fertility distributions are almost flat
at low parities and falling thereafter. In contrast, Figure 2 suggests that the distributions are
18
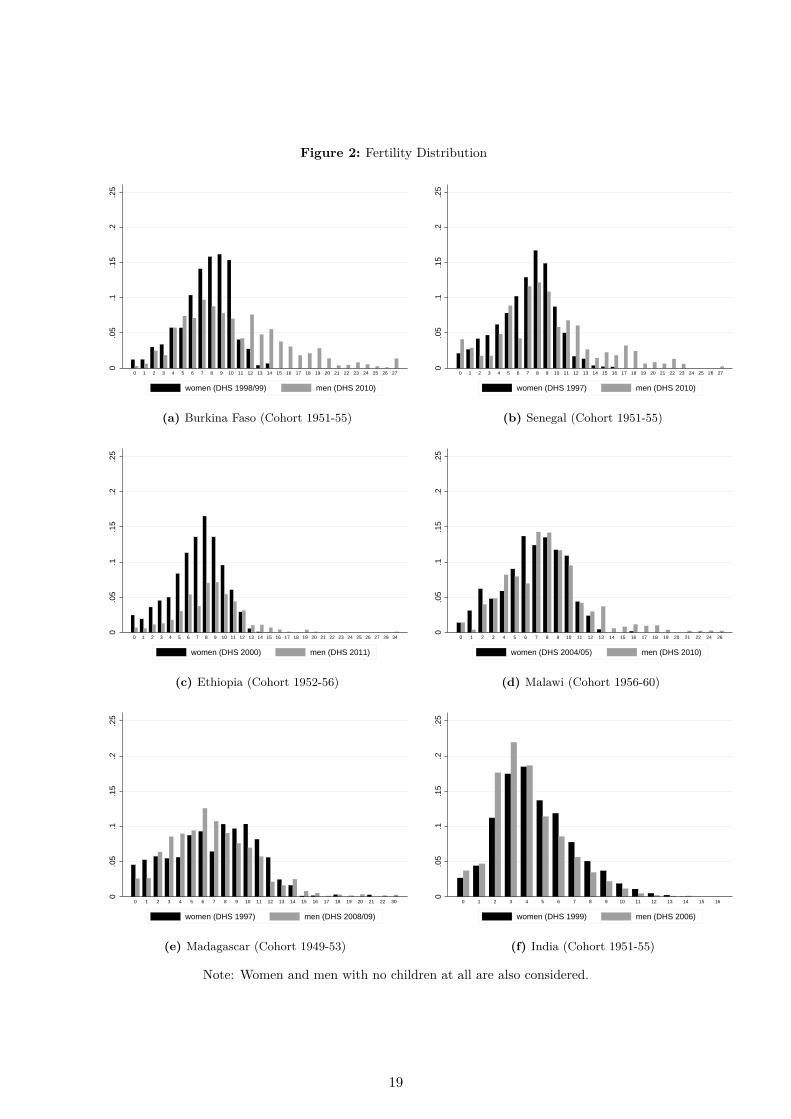
Figure 2: Fertility Distribution
0.0
5.1
.15
.2.2
5
0 1 2 3 4 5 6 7 8 9 10 11 12 13 14 15 16 17 18 19 20 21 22 23 24 25 26 27
women (DHS 1998/99) men (DHS 2010)
(a) Burkina Faso (Cohort 1951-55)0
.05
.1.1
5.2
.25
0 1 2 3 4 5 6 7 8 9 10 11 12 13 14 15 16 17 18 19 20 21 22 23 24 25 26 27
women (DHS 1997) men (DHS 2010)
(b) Senegal (Cohort 1951-55)
0.0
5.1
.15
.2.2
5
0 1 2 3 4 5 6 7 8 9 10 11 12 13 14 15 16 17 18 19 20 21 22 23 24 25 26 27 29 34
women (DHS 2000) men (DHS 2011)
(c) Ethiopia (Cohort 1952-56)
0.0
5.1
.15
.2.2
5
0 1 2 3 4 5 6 7 8 9 10 11 12 13 14 15 16 17 18 19 20 21 22 24 26
women (DHS 2004/05) men (DHS 2010)
(d) Malawi (Cohort 1956-60)
0.0
5.1
.15
.2.2
5
0 1 2 3 4 5 6 7 8 9 10 11 12 13 14 15 16 17 18 19 20 21 22 30
women (DHS 1997) men (DHS 2008/09)
(e) Madagascar (Cohort 1949-53)
0.0
5.1
.15
.2.2
5
0 1 2 3 4 5 6 7 8 9 10 11 12 13 14 15 16
women (DHS 1999) men (DHS 2006)
(f) India (Cohort 1951-55)
Note: Women and men with no children at all are also considered.
19

Figure 3: Fertility Distribution of U.S. Women, born 1826-1830
0 2 4 810 13 16 200
10
20
30
40
Birth Cohort 1828
Number of Children
Per
cent
age
of W
omen
0 2 4 810 13 16 200
10
20
30
40
Birth Cohort 1838
Number of Children
Per
cent
age
of W
omen
0 2 4 810 13 16 200
10
20
30
40
Birth Cohort 1848
Number of Children
Per
cent
age
of W
omen
0 2 4 810 13 16 200
10
20
30
40
Birth Cohort 1858
Number of Children
Per
cent
age
of W
omen
0 2 4 810 13 16 200
10
20
30
40
Birth Cohort 1868
Number of Children
Per
cent
age
of W
omen
0 2 4 810 13 16 200
10
20
30
40
Birth Cohort 1878
Number of Children
Per
cent
age
of W
omen
0 2 4 810 13 16 200
10
20
30
40
Birth Cohort 1888
Number of Children
Per
cent
age
of W
omen
0 2 4 810 13 16 200
10
20
30
40
Birth Cohort 1898
Number of Children
Per
cent
age
of W
omen
0 2 4 810 13 16 200
10
20
30
40
Birth Cohort 1908
Number of Children
Per
cent
age
of W
omen
0 2 4 810 13 16 200
10
20
30
40
Birth Cohort 1918
Number of Children
Per
cent
age
of W
omen
0 2 4 810 13 16 200
10
20
30
40
Birth Cohort 1928
Number of Children
Per
cent
age
of W
omen
0 2 4 810 13 16 200
10
20
30
40
Birth Cohort 1938
Number of Children
Per
cent
age
of W
omen
0 2 4 810 13 16 200
10
20
30
40
Birth Cohort 1948
Number of Children
Per
cent
age
of W
omen
0 2 4 810 13 16 200
10
20
30
40
Birth Cohort 1953
Number of ChildrenP
erce
ntag
e of
Wom
en0 2 4 810 13 16 20
0
10
20
30
40
Birth Cohort 1958
Number of Children
Per
cent
age
of W
omen
Figure A3
Source: Jones and Tertilt (2008), Figure A3
much closer to a normal distribution in the six developing countries analyzed here.
5. Gender Gaps in Desired vs. Actual Fertility
It is well-known that the desired fertility of men and women often does not coincide in survey
data. Especially in developing countries, men tend to say that they desire more children than
women (Bankole and Singh, 1998).23 The typical interpretation is that women bear a higher
share of the cost of child-rearing, which makes children relatively more expensive for women.
For example, one cost is the risk of dying in child birth, which is obviously born by women
only. But, how is this discrepancy in preferences resolved? One could view the actual fertility
outcome as the result of a bargaining game between husband and wife, possibly with asymmetric
information. This is the approach of Doepke and Kindermann (2013), who built a model of
spousal bargaining over fertility outcomes to analyze fertility in Europe, as well as Rasul (2008),
who analyzes discordant fertility preferences in Malaysia.24 The importance of asymmetric
information is emphasized in Ashraf, Field, and Lee (2013), who provide evidence from a field
experiment that women conceal contraceptive use from their husbands if given a chance, reducing
child-bearing.
Our finding of a gender gap in realized fertility allows a novel interpretation of the gender
gap in desired fertility. In particular, it shows that spouses do not need to agree on fertility
outcomes. If men want more children than women, they can do so by having children with
23Although Mason and Taj (1987) find little differences in desired fertility in an older meta-analysis. However,this finding might be due to the paucity of data at the time of this study, almost two decades ago.
24See also Voas (2004) for an analysis in the demography literature.
20

Table 7: Desired Number of Children by Gender
Country Cohort Desired Number Desired ActualWomen Men Gap Gap
Burkina Faso 1951-55 6.48 10.16 3.68 ∗∗∗ 2.76 ∗∗∗
1944-48 6.73 8.75 2.02 ∗∗ 4.63 ∗∗∗
Senegal 1951-55 5.77 9.60 3.83 ∗∗∗ 1.92 ∗∗∗
1946-50 6.48 10.72 4.23 ∗∗∗ 3.06 ∗∗∗
Malawi 1956-60 5.33 5.90 0.57 ∗∗∗ 1.06 ∗∗∗
1950-54 5.63 5.37 -0.26 1.67 ∗∗∗
1946-50 6.35 5.62 -0.73 ∗∗ 2.05 ∗∗∗
Ethiopia 1952-56 6.64 8.56 1.92 ∗∗∗ 1.32 ∗∗∗
Madagascar 1949-53 6.54 6.64 0.10 -0.211945-49 6.78 7.53 0.75 -0.75 ∗
India 1951-55 2.92 2.53 -0.39 ∗∗∗ -0.63 ∗∗∗
Notes: People are asked how many children they would like to have in life.Those who answer, ‘whatever god wants’ or ‘ don’t know’ are not consideredhere. The significance levels are ∗∗∗ 1%, ∗∗ 5% and ∗ 10%. The means aretested on equality based on a two-sample t-test with sampling weights.
multiple women.25 Thus, the question that we analyze in this section is the extent to which the
gap in desired fertility is explained by the gap in actual fertility. If the two gaps coincided, then
no bargaining about babies would be necessary, given that each spouse can realize their desire
individually.
To calculate desired fertility, note that the DHS asks two questions on the issue. If a person
has living children, she/he is asked: “If you could go back to the time you did not have any
children and could choose exactly the number of children to have in your whole life, how many
would that be?” For people without living children, the question is rephrased as: “If you could
choose exactly the number of children to have in your whole life, how many would that be?”
Naturally, these questions are somewhat problematic as they are asked retrospectively. For
example, a person who has many children might be quite reluctant to report having wanted
fewer, although this caveat should apply equally to men and women. Since we are interested in
the difference between men and women, we do not see the reporting bias as a major concern.
As in our previous analysis, we report averages by birth cohorts. In other words, we are not
comparing gaps within couples, but rather analyze average gaps within cohorts of men and
women.
Table 7 shows the mean desired number of children for men and women for all countries and
cohorts under consideration. The first thing to note is that we indeed find a large positive and
significant gap in the desired number of children in six of the cohorts that we consider. However,
25Mott and Mott (1985) make a similar point, specifically for the Yoruba village, Nigeria.
21

Figure 4: Desired vs. Actual Fertility Gaps Across Countries
-1
0
1
2
3
4
5
-1 0 1 2 3 4 5
45-degree line data linear regression
Desired
Fertility
Gap
Actual
Fertility
Gap
Source: DHS and own calcuations, based on Table 7. Notes: all gaps are included, even those that arenot significantly different from zero.
we also observe no significant gap or even a negative one (women wanting more children) in
some countries. In India, we find that women want more children, while this difference is not
significant in Madagascar.26 In Malawi, the results differ by cohort: for the youngest cohort, we
find a significant positive (though relatively small) gap of half a child, while the gap for the older
cohorts is negative or insignificant. Note that the size of the gap again seems quite systematically
related to polygyny. The two high polygyny countries have extremely large gaps. In Burkina
Faso, men of the 1951-55 cohort want on average 3.68 more children than women. Similarly,
in Senegal, men want between 3.8 and 4.2 more children than women, depending on the cohort
considered. We see more mixed results in Malawi and Ethiopia, the two countries with low
levels of polygyny. Here, the gap is never larger than two children, and is either negative or
insignificant for several cohorts. Finally, in Madagascar and India, the countries with almost no
polygyny, we do not see men wanting more children at all. None of the three cohorts considered
displays a significant positive gap.
As argued before, if men have children with multiple women, they can potentially realize their
differential desires. To observe the extent to which this is actually happening, we also included
26Recall that the male sample size of the cohort born in 1945-49 is very small.
22

the gap in realized fertility in the table. Comparing the desired gap with the actual gap, it
becomes clear that a large fraction of the desired gap is actually realized in these countries.
Figure 4 illustrates this visually.27 The desired gap is on the horizontal axis and the actual gap
on the vertical axis. We included the 45-degree line as a benchmark on which all of the desire
gap would be realized. Clearly, there is a strong positive relationship between the desired gap
and the realized gap. Thus, a large part of the disagreement in fertility seems to translate into
men having children with multiple women, although not all of it. The relationship is somewhat
flatter than the 45-degree line, which is largely driven by the curious case of Malawi, where
women want more children than men in two cohorts, yet men have more children than women.
6. Demographic Transition
Conventional wisdom is that the demographic transition in most African countries started rela-
tively late and its pace has been slower than in other regions (see Casterline (2001) and Bongaarts
(2008)).28 Such statements are usually based on total fertility rates (measures of female fertil-
ity). Figure 5 plots total fertility rates for Madagascar, Malawi, Burkina Faso and Senegal over
the second half of the 20th century. With the exception of Madagascar, fertility rates did not
start falling until the late-1980s, and even then, it fell relatively slowly. For example, in Burkina
Faso, total fertility at its peak in the mid-1980s was about 7.2 children per women, before falling
within the next two decades to only 6.1 – a little more than a one child decline over a period of
twenty years.
We believe that it is not only relevant when choices are made (when children are born), but
also who makes those choices. In other words, we would like to know which cohorts of parents
started choosing to have smaller families. Figure 6 plots children ever born by birth cohorts
from the DHS data. The average numbers of children are depicted in red for women and blue
for men. Naturally, due to the limited number of cohorts in our data, the figure does not give
a complete picture of the entire demographic transition.29 Nonetheless, we observe a striking
pattern, even for the short time span that we consider. While there is essentially no visible
decline in fertility in any of the four countries for women born between 1944 and 1960, we see
a sharp decline for men of the same cohorts in all countries but Madagascar. While men of the
1944-48 cohort in Burkina Faso had 12.2 children on average, less than ten years later, this had
declined to 10.2. Similarly in Senegal we see a decline, from 10.3 to 8.9 within only five years.
Finally, in Malawi, the number of children per men fell from 9.2 to 7.8 within ten years. The
only exception to this pattern is Madagascar, a country with almost no polygyny, which has a
27The figure includes all gaps, even those that are not significantly different from zero.28See also Cohen (1998) for a relatively comprehensive overview of the demographic transition on the African
continent.29For Ethiopia and India, the DHS data do not allow for a comparison over time, since we only have fertility data
for one cohort.
23
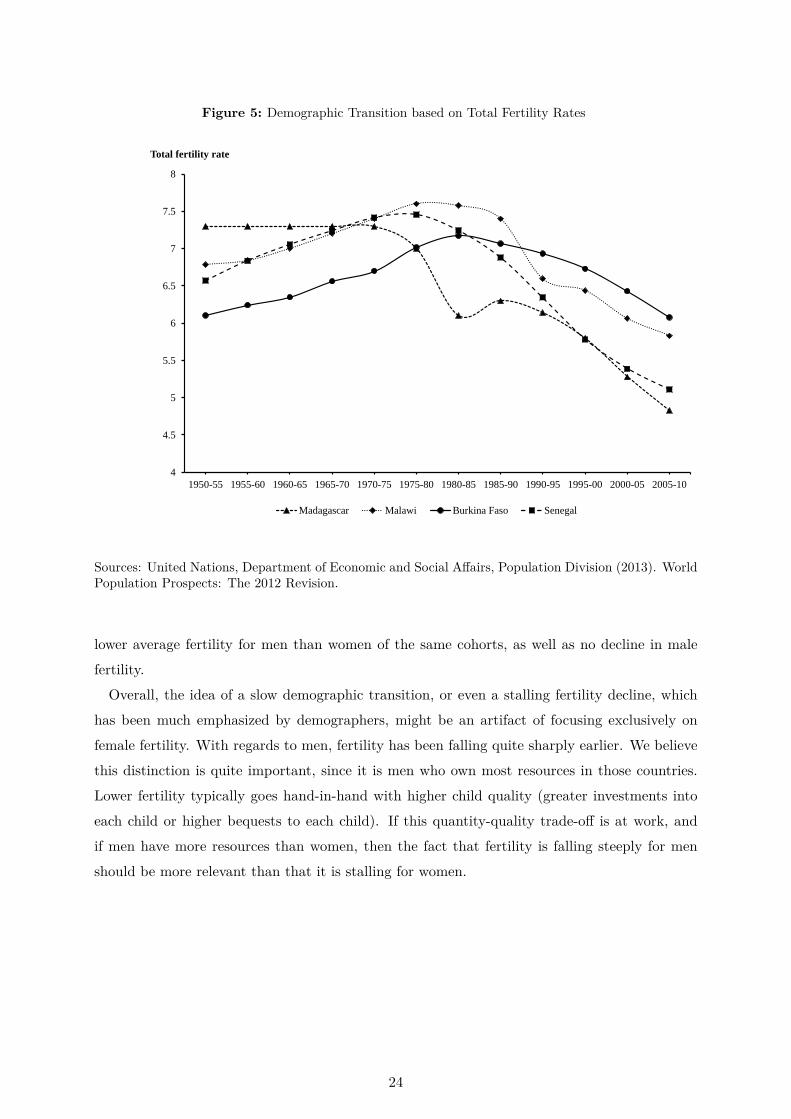
Figure 5: Demographic Transition based on Total Fertility Rates
4
4.5
5
5.5
6
6.5
7
7.5
8
1950-55 1955-60 1960-65 1965-70 1970-75 1975-80 1980-85 1985-90 1990-95 1995-00 2000-05 2005-10
Total fertility rate
Madagascar Malawi Burkina Faso Senegal
Sources: United Nations, Department of Economic and Social Affairs, Population Division (2013). WorldPopulation Prospects: The 2012 Revision.
lower average fertility for men than women of the same cohorts, as well as no decline in male
fertility.
Overall, the idea of a slow demographic transition, or even a stalling fertility decline, which
has been much emphasized by demographers, might be an artifact of focusing exclusively on
female fertility. With regards to men, fertility has been falling quite sharply earlier. We believe
this distinction is quite important, since it is men who own most resources in those countries.
Lower fertility typically goes hand-in-hand with higher child quality (greater investments into
each child or higher bequests to each child). If this quantity-quality trade-off is at work, and
if men have more resources than women, then the fact that fertility is falling steeply for men
should be more relevant than that it is stalling for women.
24

Figure 6: Demographic Transition Based on Children Ever Born by Gender of Parent
6
7
8
9
10
11
12
13
1944 1946 1948 1950 1952 1954 1956 1958 1960
Average Fertility
Birth
Cohort
Burkina Faso (women) Burkina Faso (men) Senegal (women) Senegal (men)
Malawi (women) Malawi (men) Madagascar (women) Madagascar (men)
Source: DHS and own calculations. Notes: Only the middle year of the birth cohort is displayed, e.g. 1946represents the cohort born in 1944-48.
25

7. Conclusion
We use novel data provided by the DHS male questionnaires to analyze differences in completed
fertility by gender. For Burkina Faso, Senegal, Malawi and Ethiopia, we observe on average
higher completed fertility for men than for women of the same birth cohorts. The empirical
analysis shows that this discrepancy is largest in high polygynous countries. While the fertility
gap is large in countries with high polygyny rates (Burkina Faso and Senegal), it is non-existent
or even negative in countries with almost no polygyny (Madagascar and India). We document
that an important factor for the large gender gaps is that men have children beyond their
mid-40s (the onset of menopause for the majority of women). We show that in countries with
growing population and large age gaps, male fertility is necessarily higher than female fertility.
Such a situation typically coincides with men having multiple wives, although this is not strictly
necessary.
Second, for highly polygynous countries, we document a notably higher inequality in male fer-
tility than in female fertility, measured through the variance of fertility. This is less pronounced
in countries with low or almost no polygyny. This means that for (almost) monogamous coun-
tries, heterogeneity in male fertility translates one-to-one into female heterogeneity, while men in
highly polygynous countries have an additional margin of adjustment breaking the link between
male and female heterogeneity.
Third, the difference in average fertility provides a novel explanation for the gender gap in
desired fertility. Existing explanations are based on the assumption that the realized fertility
does not differ between spouses. We show that average realized fertility between men and women
of the same cohort can differ, and that there is a positive relationship between the average desired
and realized fertility gaps. In line with the literature, we find that men want more children than
women in most of the countries. However, a disagreement in these desires can be resolved by
men having children with more than one woman.
Finally, we find that the size and speed of the demographic transition depends on the gender
considered. In Burkina Faso, Senegal and Malawi, the size and speed of the fertility decline have
been much more pronounced for men than for women of the same cohort.
We believe that these results may be important for researchers building theories of fertility
choice. This paper shows that the facts may look somewhat different depending on whether they
are derived from men or from women. Inequality in fertility is a strong example. Our results
show that heterogeneity in fertility outcomes is much larger for men than for women. How does
this affect the resource distribution in the next generation? Historically, the relationship between
income and fertility is negative in most societies – see Jones and Tertilt (2008). Thus, endogenous
fertility leads to an amplification of income inequality over time. Taking the distribution of
children across men into account, this amplification could be even more severe than estimates
26

based on women would suggest. However, if it is the rich men who have the most children
in those societies where men have children with multiple women, then this would mitigate the
endogenous inequality propagation across generations.
In this paper, we have analyzed fertility gaps across gender in six countries. Conducting a
similar analysis for other countries would be very interesting and is left for future research.
Finally, while we speculate that polygyny is the most important factor in explaining gender
gaps in fertility, we have not formally investigated this hypothesis. Other possibilities are non-
marital child-bearing, divorce followed by remarriage, death with subsequent remarriage or
simply large fractions of women remaining childless. Decomposing the observed gender fertility
gaps according to these various possibilities would be an interesting avenue to pursue, although
data constraints will not make this an easy task.
27

References
Agajanian, Victor. 2002. “Men’s Talk About “Women’s Matters” Gender, Communication, and
Contraception in Urban Mozambique.” Gender & Society 16:194–215.
Ashraf, Nava, Erica Field, and Jean Lee. 2013. “Household Bargaining and Excess Fertility: An
Experimental Study in Zambia.” Unpublished Manuscript, Duke University.
Bankole, Akinrinola and Susheela Singh. 1998. “Couples’ Fertility and Contraceptive Decision-
Making in Developing Countries: Hearing the Man’s Voice.” International Family Planning
Perspectives 24 (1):15–24.
Bongaarts, John. 2008. “Fertility Transitions in Developing Countries: Progress or Stagnation?”
Studies in Family Planning 39 (2):105–110.
Boschini, Anne, Christina Håkanson, Åsa Rosén, and Anna Sjögren. 2011. “Trading off or having
it all? Completed fertility and mid-career earnings of Swedish men and women.” Working
Paper Series 2011:15, IFAU - Institute for Evaluation of Labour Market and Education Policy.
URL http://ideas.repec.org/p/hhs/ifauwp/2011_015.html.
Casterline, John B. 2001. “The Pace of Fertility Transition: National Petterns in the Second
Half of the Twentieth Century.” Population and Development Review 27:17–52.
Cohen, Barney. 1998. “The emerging fertility transition in sub-Saharan Africa.” World Devel-
opment 26 (8):1431–1461. URL http://ideas.repec.org/a/eee/wdevel/v26y1998i8p1431-1461.
html.
De la Croix, David and Matthias Doepke. 2003. “Inequality and Growth: Why Differential
Fertility Matters.” American Economic Review 93(4):1091–1113.
Doepke, Matthias and Fabian Kindermann. 2013. “Bargaining over Babies.” Unpublished
Manuscript, Northwestern University.
Eijkemans, Marinus J.C., Frans van Poppel, Dik F. Habbema, Ken R. Smith, Henri Leridon,
and Egbert R. te Velde. 2014. “Too old to have children? Lessons from natural fertility
populations.” Human Reproduction 0 (0):1 – 9.
Fikree, Fariyal F., Ronald H. Gray, and Farida Shah. 1993. “Can Men Be Trusted? A Com-
parison of Pregnancy Histories Reported by Husbands and Wives.” American Journal of
Epidemiology 138 (4):237 – 242.
Greene, Margaret E. and Ann E. Biddlecom. 2000. “Absent and Problematic Men: Demographic
Accounts of Male Reproductive Roles.” Population and Development Review 26:pp. 81–115.
28

Guzzo, Karen Benjamin and Frank F. Furstenberg. 2007. “Multipartnered Fertility among
American Men.” Demography 44:583–601.
Harris, Isiah D., Carolyn Fronczak, Lauren Roth, and Randall B. Meacham. 2011. “Fertility
and the Aging Male.” Reviews in Urology 13 (4):184–190.
Hertrich, Véronique. 1998. “Are men’s and women’s answers to be equally trusted? A dual
collection of birth and marriage histories in a population in Mali.” Population: An English
Selection 10 (2):303–318.
Jones, Larry E. and Michèle Tertilt. 2008. “An Economic History of Fertility in the U.S.:
1826-1960.” In Frontiers of Family Economics, edited by Peter Rupert. Elsevier.
Kidd, Sharon A., Brenda Eskenazi, and Andrew J. Wyrobek. 2001. “Effects of male age on
semen quality and fertility: a review of the literature.” Fertility and Sterility 75 (2):237–248.
Kremer, Michael and Daniel L. Chen. 2002. “Income Distribution Dynamics with Endogenous
Fertility.” Journal of Economic Growth 7 (3):227–258. URL http://dx.doi.org/10.1023/A%
3A1020154031908.
Kunze, Astrid. 2014. “Are All of the Good Men Fathers? The Effect of Having Children on
Earnings.” IZA Discussion Paper Series No. 8113.
Lappegård, Trude and Marit Rønsen. 2011. “Socioeconomic differentials in multi-partner fertility
among men.” Discussion Papers Statistics Norway, Research Department 653.
Mason, Karen Oppenheim and Anju Malhotra Taj. 1987. “Differences between Women’s and
Men’s Reproductive Goals in Developing Countries.” Population and Development Review
13 (4):611–638. URL http://www.jstor.org/stable/1973025.
McKinlay, Sonja M., Donald J. Brambilla, and Jennifer G. Posner. 1992. “The normal menopause
transition.” Maturitas 14:103–115.
Mott, Frank L. and Susan H. Mott. 1985. “Household Fertility Decision in West Africa: A
Comparison of Male and Female Survey Results.” Studies in Family Planning 16(2):88–99.
Neelakantan, Urvi and Michèle Tertilt. 2008. “A Note on Marriage Market Clearing.” Economic
Letters 101:103–105.
Puur, Allan, Livia Sz. Oláh, Mariam Irene Tazi-Preve, and Jürgen Dorbritz. 2008. “Men’s
childbearing desires and views of the male role in Europe at the dawn of the 21st century.”
Demographic Research 19:pp. 1883–1912.
29

Rasul, Imran. 2008. “Household bargaining over fertility: Theory and evidence from Malaysia.”
Journal of Development Economics 86 (2):215–241. URL http://ideas.repec.org/a/eee/
deveco/v86y2008i2p215-241.html.
Ratcliffe, Amy A., Allan G Hill, David P. Harrington, and Gijs Walraven. 2002. “Reporting of
Fertility Events by Men and Women in Rural Gambia.” Demography 39 (3):573 – 586.
Rendall, Michael S., Lynda Clarke, H. Elizabeth Peters, Nalini Ranjit, and Georgia Verropoulou.
1999. “Incomplete Reporting of Men’s Fertility in the United States and Britain: A Research
Note.” Demography 36 (1):135–144. URL http://www.jstor.org/stable/2648139.
Sidibe, E. H. 2005. “La ménopause en Afrique.” Annales d’Endocrinologie 66 (2):105 – 107.
Tertilt, Michèle. 2005. “Polygyny, Fertility, and Savings.” Journal of Political Economy
113 (6):1341–1371.
Voas, David. 2004. “Conflicting Preferences: A Reason Fertility Tends to be Too High or Too
Low.” Population and Development Review 29 (4):627–646.
Westoff, Charles and Jenny Higgins. 2009. “Relationships between men’s gender attitudes and
fertility: Response to Puur et al.’s “Men’s childbearing desires and views of the male role in
Europe at the dawn of the 21st century”.” Demographic Research 21:65–74.
30

A. Data Appendix
Table A1: Indicator for Completed Fertility
Country DHS Fraction with a child of age one or younger15-19 20-24 25-29 30-34 35-39 40-44 45-49 50-54 55-59
BFA 2010 f 0.10 0.26 0.30 0.24 0.20 0.11 0.01m 0.00 0.13 0.36 0.51 0.48 0.46 0.46 0.31 0.21
SEN 2010/11 f 0.08 0.21 0.25 0.23 0.16 0.07 0.02m 0.00 0.03 0.17 0.35 0.41 0.42 0.41 0.25 0.22
MWI 2010 f 0.11 0.29 0.24 0.20 0.16 0.10 0.03m 0.01 0.22 0.46 0.40 0.42 0.35 0.29 0.12
ETH 2011 f 0.06 0.23 0.27 0.23 0.20 0.11 0.02m 0.00 0.10 0.32 0.42 0.40 0.38 0.31 0.17 0.09
MDG 2008/09 f 0.13 0.24 0.23 0.19 0.14 0.07 0.01m 0.02 0.22 0.37 0.35 0.30 0.26 0.16 0.06 0.02
IND 2005/06 f 0.07 0.22 0.15 0.07 0.03 0.01 0.00m 0.01 0.14 0.31 0.29 0.16 0.07 0.03 0.01
Source: Own calculation based on DHS. Notes: The fraction is an unconditional measure, meaning peoplewith no children are also included. BFA: Burkina Faso, SEN: Senegal, MWI: Malawi, ETH: Ethiopia, MDG:Madagascar, IND: India.
Table A2: Sample Implementation
Sampled Households Interviewed PeopleFemale Male
Country DHS Sample Sample Ratio Women Men Ratio
Burkina Faso 2010 14,947 7,475 2.00 17,087 7,307 2.342003 9,470 3,297 2.87 12,477 3,605 3.46
Senegal 2010/11 8,212 3,129 2.62 15,688 4,929 3.182005 7,859 2,614 3.01 14,602 3,761 3.88
Malawi 2010 27,307 9,387 2.91 23,020 7,175 3.212004/05 15,041 5,029 2.99 11,698 3,261 3.592000 15,421 3,872 3.98 13,220 3,092 4.28
Ethiopia 2011 17,817 17,817 1.00 16,515 14,110 1.17Madagascar 2008/09 18,985 9,494 2.00 17,375 8,586 2.02
2003/04 9,295 3,102 3.00 7,949 2,432 3.27
India 2005/06 116,652 73,974 1.58 124,385 74,369 1.67Source: DHS. Notes: The sampled households include the number of households that havebeen sampled for the women’s and men’s questionnaires, respectively. This might differ fromthe acutal responding households. Only the DHSs that we use for the information on men areconsidered. The very right 3 columns represent the people, who have been finally interviewed.
31

Figure A1: Fertility Distribution (censored)0
.05
.1.1
5.2
.25
0 1 2 3 4 5 6 7 8 9 10 11 12 13 >13
women (DHS 1998/99) men (DHS 2010)
(a) Burkina Faso (Cohort 1951-55)
0.0
5.1
.15
.2.2
5
0 1 2 3 4 5 6 7 8 9 10 11 12 13 14 15 >15
women (DHS 1997) men (DHS 2010)
(b) Senegal (Cohort 1951-55)
0.0
5.1
.15
.2.2
5
0 1 2 3 4 5 6 7 8 9 10 11 12 13 14 >14
women (DHS 2000) men (DHS 2011)
(c) Ethiopia (Cohort 1952-56)
0.0
5.1
.15
.2.2
5
0 1 2 3 4 5 6 7 8 9 10 11 12 13 14 15 >15
women (DHS 2004/05) men (DHS 2010)
(d) Malawi (Cohort 1956-60)
0.0
5.1
.15
.2.2
5
0 1 2 3 4 5 6 7 8 9 10 11 12 13 14 15 16 17 18 19 20 >20
women (DHS 1997) men (DHS 2008/09)
(e) Madagascar (Cohort 1949-53)
0.0
5.1
.15
.2.2
5
0 1 2 3 4 5 6 7 8 9 10 11 12 13 >13
women (DHS 1999) men (DHS 2006)
(f) India (Cohort 1951-55)
Notes: For the gender with the higher maximum number of children, the distribution is censored at thehighest number of children reported by the opposite gender. In all countries apart from India, the highestfertility is reported by men. In those cases, the maximum number of children born to women is taken asa censoring point for the male fertility. In India, the reverse is true.
32

B. Fertility Accounting and Marriage Market Clearing
This appendix demonstrates how male and female fertility can differ even though each child
has a father and a mother. It illustrates that male and female fertility need to coincide, not
even on average. We also show that polygyny is likely an important factor (even though it is
theoretically not necessary). We show in a simple equation which factors can break the direct
link. The notation is closely related to Neelakantan and Tertilt (2008).
Let fmt be the fertility rate of men of cohort t and fw
t the fertility rate of women in cohort
t. Let Mkt be the size of the male cohort born in t at age k, i.e. in year t + k. Similarly, W k
t
denotes the number of women of cohort t at age k. Now assume that men on average have
children when they are k years old. Then the total number of children born in year t+ k to all
men is fmt M
kt . Further, assume that men have children with women who are on average g years
younger. Then, the number of children born to all women in year t+ k is fwt+gW
k−gt+g .
Clearly, the aggregate number of children born to all women in year t+ k and the number of
all children fathered in the same year must coincide. Thus, we get the following fertility “market
clearing” condition:
fmt M
kt = fw
t+gWk−gt+g . (1)
Next, we relate the cohort sizes of fathers and mothers to their size at birth. Let πm and πw
be the annual mortality rate of men and women respectively. Then, Mkt = (1− πm)kM0
t , where
M0t is the size of the male cohort t at birth. For women we are interested in cohort t + g at
age k − g (given the age gap between men and women): W k−gt+g = (1 − πw)k−gW 0
t+g. Further,
assume constant positive population growth so that subsequent cohorts are related (at birth)
by a factor γ to each other: M0t+1 = γM0
t and analog for women. Using this, we can express
W k−gt+g as (1 − πw)k−g(1 + γ)gW 0
t . Using the expressions for Mkt and W k−g
t+g , we can then write
the fertility market clearing condition as follows:
fmt
fwt+g
=W k−g
t+g
Mkt
=( 1− πw
1− πm
)k ( 1 + γ
1− πw
)g(W 0
t
M0t
). (2)
This expression shows that, even though each child has a father and a mother, the number
of children born to the average father does coincide with the number of children born to the
average mother in the same year if the cohorts of mothers and fathers are of different sizes. In
particular, if there are more women than men, then men will have a higher fertility rate. The
expression shows that there are several reasons why there might be more women than men.
1. If πm > πw, i.e. if male mortality is higher, for example due to wars.
2. If g > 0 (i.e. if there is a positive age between men and women) coupled with either
population growth (γ > 0) or female mortality (πw > 0).
33
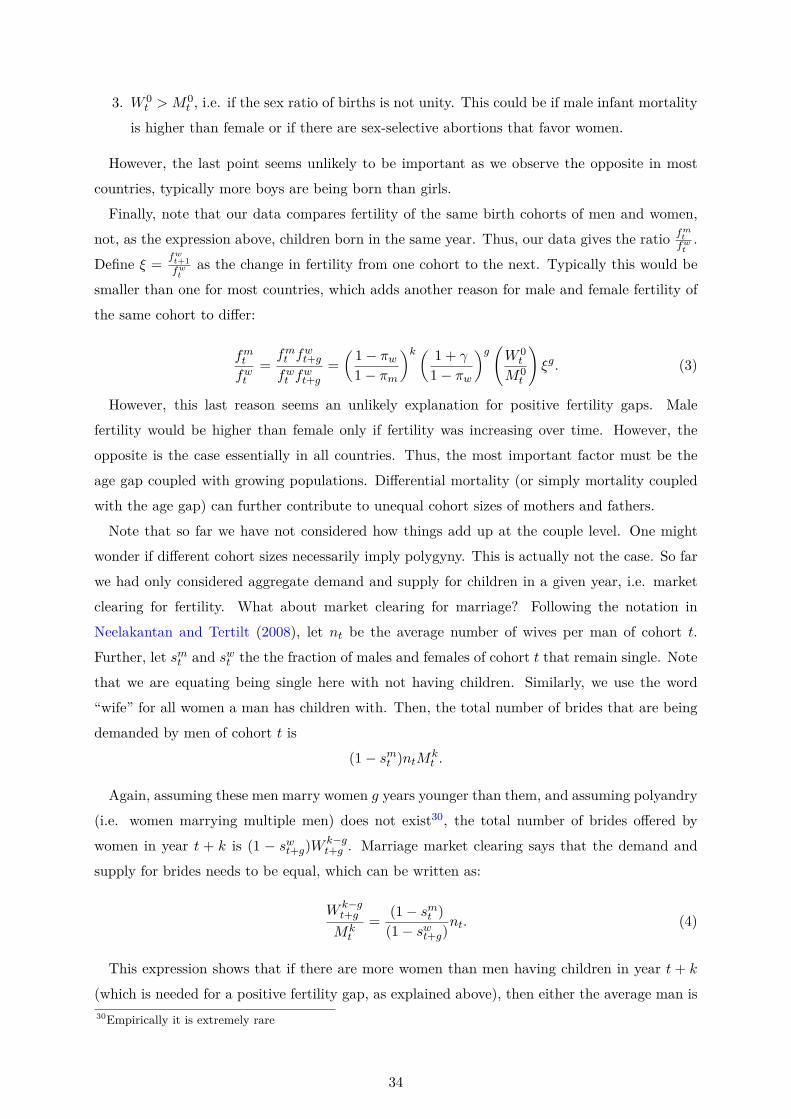
3. W 0t > M0
t , i.e. if the sex ratio of births is not unity. This could be if male infant mortality
is higher than female or if there are sex-selective abortions that favor women.
However, the last point seems unlikely to be important as we observe the opposite in most
countries, typically more boys are being born than girls.
Finally, note that our data compares fertility of the same birth cohorts of men and women,
not, as the expression above, children born in the same year. Thus, our data gives the ratio fmt
fwt.
Define ξ = fwt+1fw
tas the change in fertility from one cohort to the next. Typically this would be
smaller than one for most countries, which adds another reason for male and female fertility of
the same cohort to differ:
fmt
fwt
=fm
t fwt+g
fwt f
wt+g
=( 1− πw
1− πm
)k ( 1 + γ
1− πw
)g(W 0
t
M0t
)ξg. (3)
However, this last reason seems an unlikely explanation for positive fertility gaps. Male
fertility would be higher than female only if fertility was increasing over time. However, the
opposite is the case essentially in all countries. Thus, the most important factor must be the
age gap coupled with growing populations. Differential mortality (or simply mortality coupled
with the age gap) can further contribute to unequal cohort sizes of mothers and fathers.
Note that so far we have not considered how things add up at the couple level. One might
wonder if different cohort sizes necessarily imply polygyny. This is actually not the case. So far
we had only considered aggregate demand and supply for children in a given year, i.e. market
clearing for fertility. What about market clearing for marriage? Following the notation in
Neelakantan and Tertilt (2008), let nt be the average number of wives per man of cohort t.
Further, let smt and sw
t the the fraction of males and females of cohort t that remain single. Note
that we are equating being single here with not having children. Similarly, we use the word
“wife” for all women a man has children with. Then, the total number of brides that are being
demanded by men of cohort t is
(1− smt )ntM
kt .
Again, assuming these men marry women g years younger than them, and assuming polyandry
(i.e. women marrying multiple men) does not exist30, the total number of brides offered by
women in year t + k is (1 − swt+g)W k−g
t+g . Marriage market clearing says that the demand and
supply for brides needs to be equal, which can be written as:
W k−gt+g
Mkt
= (1− smt )
(1− swt+g)nt. (4)
This expression shows that if there are more women than men having children in year t + k
(which is needed for a positive fertility gap, as explained above), then either the average man is30Empirically it is extremely rare
34

fathering children with more than one wife (nt > 1) or more women remain childless than men
(swt+g > sm
t ).
35