gao-04-14, ssa disability decision making: … of gao-04-14, a report to congressional requesters...
TRANSCRIPT
United States General Accounting Office
GAO Report to Congressional Requesters
November 2003 SSA DISABILITY DECISION MAKING
Additional Steps Needed to Ensure Accuracy and Fairness of Decisions at the Hearings Level
GAO-04-14
Highlights of GAO-04-14, a report to congressional requesters
Historically, the proportion of the Social Security Administration’s (SSA) disability benefits claims that were approved has been lower for African-Americans than for whites. In 1992, GAO found that racial differences, largely at the Administrative Law Judge (ALJ) level, could not be completely explained by factors related to the decision-making process. This report examines how race and other factors influence ALJ decisions and assesses SSA’s ability to ensure the accuracy and fairness of ALJ decisions.
GAO recommends that SSA enhance its ALJ quality assurance reviews by • incorporating cases that are
appealed to SSA's Appeals Council in the quality assurance review sample,
• conducting ongoing as well as in-depth analyses of ALJ decisions by race and other factors, and
• publishing these results in its biennial reports.
Further, GAO recommends that SSA • take action, as needed, to
correct and prevent unwarranted allowance differences; and
• establish an expert advisory panel to provide ongoing leadership, oversight, and technical assistance with respect to ALJ quality assurance reviews.
SSA agreed with GAO’s recommendations. www.gao.gov/cgi-bin/getrpt?GAO-04-14.
To view the full product, including the scope and methodology, click on the link above. For more information, contact Robert E. Robertson at (202) 512-7215 or [email protected].
November 2003
SSA DISABILITY DECISION MAKING
Additional Steps Needed to Ensure Accuracy and Fairness of Decisions at the Hearings Level
GAO controlled for factors that are related to the disability decision-making process at the Administrative Law Judge level and found:
• no statistically significant difference in the likelihood of being allowed benefits between white claimants and claimants from other, non-African-American racial/ethnic groups; and between white claimants and African-American claimants who were represented by attorneys;
• statistically significant differences between white and African-American claimants who were not represented by attorneys. Specifically, among claimants without attorneys, African-American claimants were significantly less likely to be awarded benefits than white claimants; and
• other factors—including sex, income, and the presence of a translator at a hearing—also had a statistically significant influence on the likelihood of benefits being allowed.
Due to the inherent limitations of statistical analysis, one cannot determine whether these differences by race, sex, and other factors are a result of discrimination, other forms of bias, or variations in currently unobservable claimant characteristics.
Analytical, sampling, and data weaknesses in SSA’s approach to quality assurance reviews limit its ability to ensure the accuracy and fairness of ALJ decisions. For example:
• Analytic weaknesses: SSA analyzes ALJ decisions by various factors, such as SSA region, but not by the claimant’s race.
• Sampling weaknesses: SSA currently excludes cases that have been appealed to the Appeals Council from the pool of ALJ cases that undergoes the quality assurance review. The exclusion of these cases could mean that the sample used by SSA in its quality assurance review is not representative of all ALJ decisions. While GAO did not find large differences in the sample of cases from 1997 to 2000 that it used for its analysis, the continued, systematic exclusion of cases that are under appeal could in the future result in an unrepresentative sample of all ALJ decisions.
• Data limitations: even if SSA wanted to conduct analyses by race/ethnicity, it would encounter difficulties doing so in the near future because, since 1990, SSA significantly scaled back its collection of race/ethnicity data. Although GAO had sufficient race data for its study, the scaled back collection of race/ethnicity data will impact SSA’s future efforts to study ALJ benefit decisions by race. During GAO’s review, however, SSA decided to collect race/ethnicity data for persons applying for Social Security benefits.

Contents
Letter
Results in Brief BackgroundRace and Other Factors Influence ALJ Decisions for Some
Claimant Groups SSA’s Approach to Quality Assurance Reviews Limits Its Ability to
Ensure the Accuracy and Fairness of ALJ Decisions Conclusions Recommendations Agency Comments
1
5 7
11
18 22 23 24
Appendix I Scope and Methods 26
Section 1: Databases and Information Sources 27 Section 2: Data Reliability Tests 28 Section 3: Weighting and Sampling Errors 38 Section 4: Statistical Analysis 39 Section 5: Limitations of Analysis 58
Appendix II SSA’s Five-Step Sequential Evaluation Process for
Determining Disability
Appendix III Comments from the Social Security Administration
Appendix IV GAO Contacts and Acknowledgments 73
GAO Contacts 73 GAO Acknowledgments 73 Other Acknowledgments 73
Tables
Table 1: Variables Used in Our Model of ALJ Decision Making 4 Table 2: Percentage of Claimants Allowed Benefits at the Hearings
Level by Race and Region, 1997 to 2000 11 Table 3: Data Used in Our Analyses 28
Page i GAO-04-14 SSA Disability Decision Making
60
62

Table 4: Statistically Significant Differences between Responder and Nonresponder Groups, as Estimated with Logistic Regression 36
Table 5: Tabulations of Statistically Significant AdministrativeFactors (from Table 4) for Responders and Nonresponders 37
Table 6: Results of Baseline and Final Models of ALJ Allowance Decisions 43
Table 7: Observed and Estimated Odds Ratios by Attorney Representation and Race 49
Table 8: Computations for Odds Ratios for Different Racial Groups That Are Represented by an Attorney 50
Table 9: Computations for Odds Ratios for Claimants of the Same Race with and without Attorney Representation 51
Table 10: Effect of Attorney Representation on ALJ Decisions for Responders and Nonresponders 53
Table 11: Effect of Attorney Representation on ALJ Decisions for Responders and the Entire Sample 53
Table 12: Effect of Attorney Representation on ALJ Decisions for Responders and Nonresponders, by Race 54
Table 13: Effect of Attorney Representation on ALJ Decisions for Responders and the Entire Sample by Race 55
Table 14: Summary Results of Oaxaca Decomposition 57
Page ii GAO-04-14 SSA Disability Decision Making

Abbreviations
ACAPS Appeals Council Automated Processing System ALJ Administrative Law Judge CCS Office of Hearings and Appeals Case Control System DDHQ Division of Disability Hearings Quality DDS Disability Determination Service DI Disability Insurance EAB Enumeration at Birth HALLEX Hearings, Appeals and Litigation Law Manual MEF Master Earnings File NOSSCR National Organization of Social Security Claimant
Representatives OHA Office of Hearings and Appeals OQA Office of Quality Assurance and Performance Assessment SGA substantial gainful activity SSA Social Security Administration SSI Supplemental Security Income
This is a work of the U.S. government and is not subject to copyright protection in the United States. It may be reproduced and distributed in its entirety without further permission from GAO. However, because this work may contain copyrighted images or other material, permission from the copyright holder may be necessary if you wish to reproduce this material separately.
Page iii GAO-04-14 SSA Disability Decision Making

United States General Accounting Office
Washington, DC 20548
November 12, 2003
The Honorable Charles B. Rangel Ranking Minority Member Committee on Ways and Means House of Representatives
The Honorable Robert T. Matsui Ranking Minority Member Subcommittee on Social Security Committee on Ways and Means House of Representatives
The Honorable Gene Green House of Representatives
Historically, under the Social Security Administration’s (SSA) Disability Insurance (DI) and Supplemental Security Income (SSI) programs, the proportion of benefit claims that were approved for African-Americans has been lower than the proportion that were approved for whites.1 In 1992, GAO conducted a statistical analysis of disability benefit decisions and found that racial differences, largely at the Administrative Law Judge (ALJ) level, could not be completely explained by factors related to the decision-making process, such as certain demographic characteristics of claimants (including age, education, and sex) and their impairment types. In 2001, you asked us to examine the steps SSA had taken to correct and prevent unwarranted racial differences. You also asked us to examine whether unwarranted racial differences currently exist within these programs.
This report is the second of two reports in response to your request. In the first report, published in September 2002, we assessed steps SSA took to investigate and correct potential unwarranted differences, including SSA’s
1In 1992, GAO reported that DI allowance rates between 1961 and 1985 and SSI allowance rates between 1971 and 1989 were consistently lower for African-Americans than whites. See U.S. General Accounting Office, Social Security: Racial Difference in Disability
Decisions Warrants Further Investigation, GAO/HRD-92-56 (Washington, D.C.: Apr. 21, 1992).
Page 1 GAO-04-14 SSA Disability Decision Making
study of racial differences in ALJ decisions.2 For its study, SSA used new data—which we will refer to as enhanced data—developed as part of its recently established and ongoing quality assurance review of ALJ decisions. The enhanced data contain information, previously unavailable to GAO, such as an improved measure of severity of the claimant’s impairment. In our 2002 report, we stated that we were unable to draw firm conclusions about racial differences from SSA’s study because of weaknesses we identified in SSA’s sampling and statistical methods. As a result, we recommended that SSA assess the degree to which its enhanced data are representative of ALJ disability decisions and make any needed changes to its sampling protocol and statistical methods, as part of its ongoing quality assurance review of ALJ decisions.
This report examines (1) how race and other factors influence ALJ decisions and (2) limitations in SSA’s ability to ensure the accuracy and fairness of ALJ decisions. You asked us to examine racial differences in DI and SSI decisions at the ALJ level, including Hispanics and other ethnic groups. However, due to limitations with SSA’s race/ethnicity data, our examination was limited to African-American claimants, white claimants, and claimants from other racial/ethnic groups.3
Given our previously reported concerns about the degree to which the enhanced data are representative,4 we conducted tests at the beginning of this review to determine whether the enhanced data were sufficiently representative and reliable for our analyses.5 Because these tests established that the enhanced data were of sufficient quality for our analysis, we were able to analyze these data to determine whether racial differences currently exist in ALJ benefit decisions and whether
2See U.S. General Accounting Office, SSA Disability Decision Making: Additional
Measures Would Enhance Agency’s Ability to Determine Whether Racial Bias Exists, GAO-02-831 (Washington, D.C.: Sept. 9, 2002).
3Changes in coding schemes over time limit our ability to analyze Hispanic and other ethnic groups separately. Prior to 1980, race data were collected for three categories: white, black, or other. In 1980, SSA adopted new codes: “White,” “Black,” “Hispanic,” “Asian or Pacific Islander,” and “American Indian or Alaskan Native.” Because much of the race data were collected before 1980, and were not recoded into the new categories, “Hispanic,” “Asian or Pacific Islander,” or “American Indian or Alaskan Native,” we were unable to conduct our analyses using these new categories.
4GAO-02-831.
5In conducting these tests, we compared the enhanced data with data from SSA’s administrative files. See appendix I.
Page 2 GAO-04-14 SSA Disability Decision Making
differences in ALJ decisions are explained by factors related to the decision-making process. To do this, we analyzed SSA’s enhanced data from 1997-2000 using statistical models of ALJ decision making that we constructed. Specifically, we used multivariate analysis to determine whether any differences by race/ethnicity could be statistically attributed to factors related to ALJ decision making.6 As shown in table 1, the variables we included in our model can be grouped into three broad sets of factors that are related to the decision-making process: (1) factors that represent the criteria used in the disability decision-making process; (2) factors that represent participants in the decision-making process; and (3) factors that are not part of the decision-making process, but may influence it.7 See appendix I for more information on our statistical methods.
6To construct the models, we reviewed pertinent literature and consulted with SSA officials and outside experts.
7After estimating our initial model of factors affecting ALJ decisions using logistic regression analysis, we identified race, attorney representative, and several other factors that are not part of the criteria used in the decision-making process but that had a statistically significant influence on allowance decisions. We constructed additional models that included combinations of these variables to determine the influence of these variables on allowance decisions. One of these interaction variables—controlling for African-American claimants that had attorney representation—had a statistically significant influence on allowance decisions and was, therefore, included in our final model. To further analyze the relationship between race and attorney representation on allowance decisions, we employed a statistical technique—the Oaxaca decomposition—that is commonly used in analyses of discrimination. See appendix I for a description of this analysis.
Page 3 GAO-04-14 SSA Disability Decision Making

Table 1: Variables Used in Our Model of ALJ Decision Making
Factors representing criteria in the decision-making process
Medical variables
Impairments
Severity of impairment
Alcohol or drug abuse
Consultative examination requested
Number of impairments
Number of severe impairments
Residual functional capacity of claimant
Mental residual functional capacity of claimant
Nonmedical variables
Occupational type
Years of employment
Occupational skill level
Education
Literacy
Age category
Factors representing participants in the decision-making process
Representation (by attorney or other)
Medical expert present at hearing
Vocational expert present at hearing
Translator present at hearing
Claimant present at hearing
Factors not part of the decision-making process, but may influence it
Race
Sex
Earnings
Type of claim
Year of decision
Region
Source: GAO analysis of SSA’s enhanced data.
To obtain information on factors limiting SSA’s ability to ensure the accuracy and fairness of ALJ decisions, we interviewed SSA officials and reviewed documentation concerning the agency’s ongoing quality
Page 4 GAO-04-14 SSA Disability Decision Making

Results in Brief
assurance review of ALJ decisions. We also interviewed officials within the Department of Health and Human Services’ Centers for Medicare and Medicaid Services to discuss their use of SSA race data.
We performed our work from August 2002 to September 2003 in accordance with generally accepted government auditing standards.
When we controlled for factors that are related to the disability decision-making process at the hearings level, including the severity of the claimant’s impairment, whether or not the claimant had attorney representation, and the claimant’s age and work experience, we found no statistically significant differences in the likelihood of being allowed benefits between whites and claimants from other, non-African-American racial/ethnic groups. We did, however, find differences between white and African-American claimants, but only among claimants who were not represented by attorneys. That is, among claimants who were represented by attorneys, white and African-American claimants were equally likely to be allowed benefits, but among claimants who were not represented by attorneys, African-American claimants were significantly less likely to be awarded benefits than white claimants. Moreover, claimants who were represented by persons other than attorneys, such as legal aides, friends or family, were more likely to be awarded benefits than claimants who are not represented; however, among claimants represented by these nonattorneys, African-Americans were less likely to be awarded benefits than whites. Besides race and attorney representation, other factors that are not part of the criteria used in the decision-making process also had a statistically significant influence on the likelihood of benefits being allowed. For example, male claimants, claimants with low incomes, or non-English-speaking claimants who had a translator at a hearing were less likely to be awarded benefits. Due to the inherent limitations of statistical analysis, one cannot determine whether these differences by race, sex, and other factors are a result of discrimination or other forms of bias, or due to variations in currently unobservable claimant characteristics, such as a lack of detailed information on medical evidence needed to buttress impairment claims.
Analytical, sampling, and data weaknesses in SSA’s approach to quality assurance reviews limit its ability to ensure the accuracy and fairness of ALJ decisions. As part of its ongoing quality assurance review, SSA analyzes ALJ decisions by various claimant characteristics such as the claimant’s age and the region where the disability decision was issued, but not by the claimant’s race. This analytic omission limits SSA’s ability to
Page 5 GAO-04-14 SSA Disability Decision Making

identify, correct, and prevent unwarranted racial differences in allowance rates. In addition, weaknesses in the review’s sampling methods present problems. For example, SSA currently excludes cases that have been appealed to the Appeals Council from the pool of ALJ cases that undergoes the quality assurance review. The exclusion of these cases could mean that the sample used by SSA in its quality assurance review is not representative of all ALJ decisions. While we found the sample of cases that we used for our analysis to be sufficiently representative, the continued, systematic exclusion of appealed cases could, in the future, result in an unrepresentative sample of all ALJ decisions. Finally, data limitations restrict SSA’s ability to ensure the accuracy and fairness of ALJ decisions. For example, even if SSA wanted to conduct analyses by race/ethnicity, it would encounter difficulties doing so in the near future because, since 1990, SSA has significantly scaled back its collection of race/ethnicity data. Although we had sufficient race data for our study, the scaled back collection of race/ethnicity data will impact SSA’s future efforts to study ALJ benefit decisions by race. During our review, however, SSA decided to collect race/ethnicity data for disability claimants and other individuals applying for Social Security benefits and has set up a task group to explore implementation issues. In addition, SSA officials recently informed us that they are considering ways to include appealed cases in their quality assurance review.
To better ensure the accuracy and fairness of ALJ decisions by race/ethnicity and other factors not related to criteria used in the decision-making process, we recommend that SSA enhance its ALJ quality assurance reviews by: incorporating cases that are appealed to SSA’s Appeals Council in the quality assurance review sample; conducting ongoing as well as in-depth analyses of ALJ decisions by race and other factors; and publishing these results in its biennial reports. We also recommend that SSA take action, as needed, to correct and prevent unwarranted allowance differences, and establish an expert advisory panel to provide ongoing leadership, oversight, and technical assistance with respect to ALJ quality assurance reviews.
In its written comments to our report, SSA agreed with our recommendations and indicated that it intends to go further as it moves forward with its recently proposed plan to improve the disability determination process. SSA’s comments and its proposed plan to improve the disability determination process are printed in appendix III.
Page 6 GAO-04-14 SSA Disability Decision Making

Background DI and SSI are the two largest federal programs providing cash assistance to people with disabilities. Established in 1956, DI provides monthly payments to workers with disabilities (and their dependents or survivors) under the age of 65 who have enough work experience to qualify for disability benefits. Created in 1972, SSI is a means-tested income assistance program that provides monthly payments to adults or children who are blind or who have other disabilities and whose income and assets fall below a certain level.8 To be considered eligible for either program as an adult, a person must be unable to perform any substantial gainful activity by reason of a medically determinable physical or mental impairment that is expected to result in death or that has lasted or can be expected to last for a continuous period of at least 12 months. Work activity is generally considered substantial and gainful if the person’s earnings exceed a particular level established by statute and regulations.9
In calendar year 2002, about 5.5 million disabled workers (age 18-64) received about $55.5 billion in DI benefits, and about 3.8 million working-age individuals with disabilities received about $18.6 billion in SSI federal benefits.10
To obtain disability benefits, a claimant must file an application online,11
by telephone or mail, or in person at any Social Security office. If the claimant meets the nonmedical eligibility criteria, the field office staff forwards the claim to the appropriate state Disability Determination Service (DDS) office. DDS staff—generally a team comprised of disability examiners and medical consultants—review medical and other evidence provided by the claimant, obtaining additional evidence as needed to assess whether the claimant satisfies program requirements, and make the initial disability determination. If the claimant is not satisfied with this
8SSI also provides income assistance to the aged who have income and assets below a certain level.
9The Social Security commissioner has the authority to set the substantial and gainful activities level for individuals who have disabilities other than blindness. In December 2000, SSA finalized a rule calling for the annual indexing of the nonblind level to the average wage index of all employees in the United States. The current nonblind level is set at $800 per month. The level for individuals who are blind is set by statute and is also indexed to the average wage index. Currently, the level for blind individuals is $1,330 of countable earnings.
10DI beneficiaries with low income and assets can also receive SSI benefits. Of the 5.5 million DI beneficiaries, about .8 million also received SSI in 2002. Thus, there was a total of 8.5 million working-age beneficiaries in 2002, with 9 percent receiving both DI and SSI.
11SSA permits DI, but not SSI, claimants to file for benefits on-line.
Page 7 GAO-04-14 SSA Disability Decision Making
determination, the claimant may request a reconsideration of the decision within the same DDS.12 Another DDS team will review the documentation in the case file, as well as any new evidence the claimant may submit, and determine whether the claimant meets SSA’s definition of disability. In 2002, the DDSs made 2.3 million initial disability determinations and over 484,000 reconsiderations.
If the claimant is not satisfied with the reconsideration, he or she may request a hearing before an ALJ. Within SSA’s Office of Hearings and Appeals (OHA), there are approximately 1,150 ALJs who are located in 140 hearing offices across the country. The ALJ conducts a new review of the claimant’s file, including any additional evidence the claimant submitted after the DDS determination. At a hearing, the ALJ may hear testimony from the claimant, medical experts on the claimant’s medical condition, and vocational experts regarding whether the claimant could perform work he or she has done in the past or could perform other jobs currently available in the national economy.13 ALJs have an obligation to initiate the development of evidence as needed and make every effort to obtain all necessary evidence before the hearing. The hearings are recorded, and the majority of claimants are represented at these hearings by an attorney or a nonattorney representative, such as a legal aide, parent, relative, or social worker. In addition, translators may be used for claimants with limited proficiency in English. In fiscal year 2002, ALJs made over 438,000 disability decisions.
If the claimant is not satisfied with the ALJ decision, the claimant may request a review by SSA’s Appeals Council, which is the final administrative appeal within SSA. The Appeals Council may grant, deny, or dismiss a request for review. If it agrees to review the case, the Appeals Council may uphold, modify, or reverse the ALJ’s action or it may remand the case back to the ALJ level for an ALJ to hold another hearing and issue
12While most claimants may request a reconsideration, at the time of our study, SSA was testing an initiative that eliminates the reconsideration step from the DDS decision-making process. In her September 2003 testimony before Congress, SSA’s Commissioner proposed eliminating reconsideration as part of a large set of revisions to the disability decision-making process.
13According to SSA’s Hearings, Appeals and Litigation Law Manual (HALLEX), Sec. I-2-5-30, the ALJ decides whether the testimony of a medical or vocational expert is needed at a hearing.
Page 8 GAO-04-14 SSA Disability Decision Making

a new decision. In fiscal year 2002, the Appeals Council reviewed over 108,000 disability decisions, about 27,000 of which were remanded.14
SSA’s Office of Quality Assurance and Performance Assessment (OQA) conducts quality assurance reviews of ALJ decisions to promote fair and accurate hearing decisions. These quality assurance reviews include an evaluation of ALJ adjudicative and procedural issues. The findings and information of these reviews are included in biennial reports and assist the OHA in its pursuit of quality by identifying specific areas of concern. These findings also support the “hearings decisional accuracy rate” measure in SSA’s annual performance plans and reports.
To conduct its quality assurance review, OQA selects a random sample each month from the universe of ALJ decisions, stratifying the selection of cases by region and decisional outcome (approval or denial). Then, for each selected decision, SSA requests the case file and a recording of the hearing proceedings from hearing offices and storage facilities across the country.15 To collect the data SSA uses in its review, SSA staff conducts a systematic review of each case, including: a review of the ALJ decision by another ALJ (i.e., a peer review), a review of the medical evidence provided at each level of adjudication performed by one or more medical consultants,16 and a general review of the documentation and decision at each adjudicative level by a disability examiner.
The peer review of an ALJ decision includes a reviewing judge’s assessment of whether the ALJ’s ultimate decision to allow or deny
14If the claimant is not satisfied with the Appeals Council decision, the claimant may appeal to a federal district court. The claimant can continue legal appeals to the U.S. Circuit Court of Appeals and ultimately to the Supreme Court of the United States.
15Obtaining this documentation is complicated by the fact that files are stored in different locations, depending on whether the case involved an SSI or DI claim, and whether the ALJ decision was an allowance or denial. For fiscal years 1999 and 2000, SSA obtained files and tapes for 48 percent of the 33,484 records sampled. The case file contains the application for benefits, disability information provided by the claimant, DDS determinations, claimant’s appointment of an attorney/representative (if applicable), appeal request documentation, medical evidence furnished at each level of the appeal, and the ALJ decision. For ALJ allowance decisions, the file will also contain documentation of benefit computation and payment.
16The number of medical consultants used depends on the number and type of impairments alleged by the claimant.
Page 9 GAO-04-14 SSA Disability Decision Making

benefits is supported by substantial evidence.17 These assessments are referred to in the quality assurance review as support or accuracy rates. The peer review also includes judgments about the fairness of the ALJ hearing, in which the reviewing judge evaluates a number of issues, including abuse of discretion18 and error of law.19 The results of the peer review, as well as the results of the medical and general reviews, comprise SSA’s enhanced data.
Over the years, GAO and SSA have studied SSA’s ability to administer its disability programs in a fair and unbiased manner. In our 1992 report,20 we found that racial differences in ALJ allowance rates were not explained by other factors related to the disability decision-making process. We recommended, and SSA agreed, to further investigate the reasons for the racial differences at the hearings level and act to correct or prevent any unwarranted disparities. In response to our recommendations, SSA conducted its own study of ALJ allowance rates by race, using its enhanced data from 1992 to 1996. Although the results were never published, SSA officials told us that they found no evidence of unwarranted racial differences at the hearings level. In our 2002 report,21
we assessed the steps SSA had taken to study allowance rates by race, and we found that methodological weakness precluded us from drawing conclusions on whether unwarranted racial differences in ALJ allowance rates existed.
17In the peer review process, ALJs use the standard of substantial evidence that means that the ALJ should not overturn a decision if the relevant evidence is what a reasonable mind might accept as adequate to support a conclusion. In the original ALJ hearings process, ALJs use a higher standard of preponderance of evidence that means that more than half of the evidence must support a particular conclusion.
18According to SSA’s HALLEX, Sec. I-3-3-2, abuse of discretion in a judgment or conclusion involves an ALJ acting in a manner that is imprudent, incautious, unwise, against precedent, and clearly against logic.
19According to SSA’s HALLEX, Sec. I-3-3-3, error of law covers six broad issues: (1) misinterpretation of law or regulations; (2) misapplication of the law, regulations, or rulings to the facts; (3) failure to consider pertinent provisions of law, regulations, or rulings; (4) failure to make a finding of fact, or to give reasons for making a finding of fact, on an issue properly before the ALJ; (5) a procedural error that affects due process (e.g., improper notice of hearing, failure to notify the claimant of the right to question witnesses; and (6) failure to rule on an objection raised at the hearing.
20GAO/HRD-92-56.
21GAO-02-831.
Page 10 GAO-04-14 SSA Disability Decision Making

SSA’s enhanced data indicate that racial differences exist in overall allowance rates for disability benefits at the hearings level. As shown in table 2, these differences in allowance rates by race exist to varying degrees in almost every SSA region. However, differences in allowance rates by race do not necessarily point to racial discrimination because claimants from different racial/ethnic groups may have other differences that influence allowance decisions.
Table 2: Percentage of Claimants Allowed Benefits at the Hearings Level by Race and Region, 1997 to 2000
Numbers in percent
Region All White African-
American Other
race/ethnicity
All regions 59 63 49
Region 1 Boston 73 76 66
Region 2 New York 64 72 51
Region 3 Philadelphia 60 62 59
Region 4 Atlanta 60 65 51
Region 5 Chicago 55 59 46
Region 6 Dallas 54 61 39
Region 7 Kansas City 59 61 51
Region 8 Denver 59 61 66
Region 9 San Francisco 53 57 49
Region 10 Seattle 60 62 53
Race and Other Factors Influence ALJ Decisions for Some Claimant Groups
Source: GAO analysis of weighted enhanced data.
When we controlled for a comprehensive range of factors that could affect disability decision making by ALJs, we identified a number of variables, including race, which influence the likelihood that a claimant is allowed benefits.22 Specifically, we found that numerous variables representing medical and nonmedical criteria that are used in the disability decision-making process had a statistically significant influence on ALJ decisions. We also found that participants in the decision-making process, such as attorneys and translators, influenced ALJ decisions. In addition, our statistical model shows that a claimant’s race affects ALJ decisions for some but not all groups of claimants. Finally, other factors that, like race,
22The complete results of our model are presented in appendix I.
Page 11 GAO-04-14 SSA Disability Decision Making
51
62
57
37
61
45
52
45
48
45
51
are not part of the hearings process also affect ALJ decision making. For example, male claimants and claimants with low incomes are less likely to be awarded benefits. However, as with almost all statistical analyses, we cannot be certain whether the differences we identified are due to unequal treatment, limitations in our data, or some combination of the two.
Medical and Nonmedical Criteria Affect ALJ Decision Making
Consistent with SSA’s disability decision-making process, the results of our statistical model show that a number of variables representing key criteria used in the process have a statistically significant effect on the likelihood of allowance. For example, claimants with 3 or more impairments were more likely to be allowed than claimants with 1-2 impairments, and claimants with 1 or more severe impairments were more likely to be allowed than claimants with no severe impairments. Moreover, claimants with the physical capacity to perform light work, sedentary, and less than sedentary work were more likely to be allowed than claimants with the physical capacity to perform heavy work. Furthermore, claimants who did not have the mental capacity to perform unskilled work were more likely to be allowed than claimants with the mental capacity to perform such work. In addition, we found that claimants who were 50 years old or older were more likely to be allowed than claimants who were 18-24 years old. Finally, claimants with 10 or more years of employment were more likely to be allowed than claimants with less than 2 years of employment.
Participants in the Hearings Process also Influence ALJ Decisions
Our statistical analyses also show that the presence of various participants in the hearings process also affects ALJ allowances. For example, claimants who were present at the hearing were more likely to be allowed than claimants who were not present at the hearing. In addition, claimants were less likely to be awarded benefits if a vocational expert testified at their hearing than claimants who did not have a vocational expert testify at their hearing. Also, claimants who had translators at the hearing (i.e., for claimants who do not speak English proficiently) were less likely to be awarded benefits than claimants who did not have translators (i.e., who presumably do speak English proficiently). Finally, claimants who were represented by an attorney or a person who is not an attorney (such as a
Page 12 GAO-04-14 SSA Disability Decision Making

legal aide, relative, or friend) were more likely to be allowed than claimants who had no representative.23
Effect of Race on ALJ Decisions Varies among Claimant Groups
Our statistical analyses also show that, after controlling for a range of factors, a claimant’s race also affects ALJ decisions for some groups of claimants. Specifically, we found no statistically significant difference in the likelihood of being awarded benefits between white claimants and claimants from other, non-African-American racial/ethnic groups. However, this result is likely due to our controlling for the presence of translators at hearings. Before controlling for the presence of translators, claimants from other racial/ethnic groups were less likely to be awarded benefits than white claimants. After controlling for the presence of translators, there is no statistically significant effect of the other race/ethnic claimants’ category on the likelihood of allowance. The relatively high incidence of translators among claimants from other racial/ethnic backgrounds explains why we found no statistically significant differences in the likelihood of being awarded benefits between whites and claimants from other racial/ethnic groups.24
When we compared white claimants with African-American claimants, we found statistically significant differences in the likelihood of allowance, but only among claimants who had no representation.25 For example, among claimants with no representation, the odds of being allowed benefits for African-Americans were about one-half the odds of being
23The category for nonattorney may include representatives from legal aid organizations, which could include attorneys as well as nonattorneys.
24About 25 percent of the claimants from the other racial/ethnic group had translators at their hearings, and our analyses also show that claimants who had translators at the hearing were less likely to be awarded benefits than claimants who did not have translators.
25This discussion pertains only to claimants with no representation as compared with claimants with attorney representation, and does not pertain to claimants with nonattorney representatives such as legal aides, relatives, and friends. Additional analyses showed that among claimants with nonattorney representatives, African-Americans were less likely to be awarded benefits than whites. However, this result may be due to the low number of observations for claimants with nonattorneys.
Page 13 GAO-04-14 SSA Disability Decision Making

allowed for whites.26 In contrast, among claimants with attorney representation, we found no statistically significant difference in the likelihood of allowances between whites and African-Americans.27
In addition, when we compared the effect of having attorney representation with the effect of not having attorney representation, we found that these effects also vary by race. That is, we found that the effect of attorney representation is larger for African-American claimants than it is for white claimants. Specifically, the odds of being allowed benefits for African-American claimants with attorney representation were more than 5 times higher than the odds of being allowed for African-American claimants without attorney representation. In comparison, the odds of being allowed benefits for white claimants with attorney representation were three times higher than the odds of being allowed benefits for white claimants with no representation.28
Finally, we used another statistical technique—the Oaxaca decomposition—to analyze differences in ALJ allowances between African-American and white claimants. Consistent with the results from our other analyses, we found that, among claimants with attorney representation, differences between African-Americans and whites can be explained largely by differences in other factors included in our model, whereas among claimants without attorney representation, differences between African-Americans and whites were explained to a lesser degree by differences in other factors in our model.29 These results are particularly important because a larger percentage of African-American claimants do
26The odds on claims being allowed are related to, but not quite the same as, the probability of claims being allowed. Suppose that among whites, 200 claims were allowed among a total of 300 filed. While the probability of claims being allowed is estimated by dividing the number of claims allowed by the number of all claims (i.e., 200/300= 0.66), odds are estimated by dividing the number of claims allowed by the number of claims not allowed (i.e., 200/100 = 2). If we found that among African-Americans, 50 out of 100 claims were allowed, we would calculate the odds of allowance to be 50/50 = 1.00, and the odds ratio of African-Americans to whites would be 1.00/2.00 = 0.5. This implies that the odds for African-Americans were only one-half those of whites. While probabilities (P) and odds (O) are mathematically related (O = P/[1-P]), odds have certain advantages over probabilities for these statistical purposes, which is why we employ them.
27See appendix I for an explanation as to why this interaction term was created and an explanation of how the specific result was calculated.
28The effect of attorney representation for other race/ethnicity claimants is not significantly different than for white claimants.
29See appendix I for a description and the results of our Oaxaca decomposition analysis.
Page 14 GAO-04-14 SSA Disability Decision Making
not have attorneys (39 percent) in comparison with white claimants (29 percent).
Although several possible explanations exist for why attorney representation increases a claimant’s likelihood of being awarded benefits, we cannot empirically explain why the effect of attorney representation is greater for African-Americans. According to two attorneys affiliated with the National Organization of Social Security Claimant Representatives (NOSSCR), attorneys increase the claimant’s likelihood of being awarded benefits by (1) providing assistance with the development of evidence over and above SSA’s efforts to develop evidence30 and (2) preparing claimants to improve their effectiveness and credibility as witnesses. Another possible explanation for why attorney representation influences the likelihood of being awarded benefits is that attorneys often screen cases to select claimants with strong cases.31 However, given the data available to us, we cannot empirically explain why attorney representation has a stronger effect for African-American claimants than for white claimants.
As mentioned earlier, claimants who are represented by persons other than attorneys—such as legal aides, friends, or family—are also more likely to be allowed than claimants with no representation. When we conducted additional analyses on the effect these nonattorney representatives had on allowances by race, we found, regardless of race, claimants who were represented by nonattorneys had a greater likelihood of being awarded benefits than claimants who were not represented.
30Attorneys’ efforts to obtain medical evidence might result in better medical evidence than that obtained by SSA earlier in the decision-making process because, for example: (1) attorneys often use request forms that are tailored to the disability criteria and the claimant’s impairments to solicit specific information on the claimant’s medical history from medical providers and (2) attorneys pay more for medical records than SSA.
31We were told by attorneys affiliated with NOSSCR that attorneys typically screen their claimants to assess the strength of the claimant’s case. If the attorney believes the evidence does not support an argument for the claimant’s disability, as defined in SSA’s guidelines, the attorney is not likely to take the case. This may mean that claimants with attorneys have stronger cases and are more likely to be approved for benefits regardless of the additional assistance provided by the attorney. Relatedly, ALJs—who may be aware that attorneys choose stronger cases—may be more likely to view a claimant with an attorney as having an impairment with such severity so as to qualify the claimant for benefits.
Page 15 GAO-04-14 SSA Disability Decision Making

Nevertheless, we also found that differences by race persisted after controlling for nonattorney representatives.32
Other Factors Not Part of the Decision-Making Process also Influence ALJ Allowances
Finally, our statistical analyses found that additional factors not part of the decision-making process—including the claimant’s earnings, geographical location, and sex—influence the ALJ allowance decision. For example, we found that claimants with higher levels of earnings were more likely to be awarded benefits than those who have low earnings levels. In particular, the odds of being allowed benefits for claimants who earned over $20,000 per year were 3 times higher than the odds of being allowed benefits for claimants who earned less than $5,000 per year, and the odds of being allowed for claimants who earn $5,000-$20,000 per year were 2 times higher than for claimants who earn less than $5,000 per year. In addition, the odds of being allowed benefits for claimants whose hearings took place in the Boston Region were approximately 2 times higher than for claimants whose hearings took place in other regions, after controlling for other factors.33 Finally, the odds of being allowed benefits for claimants who are men were approximately three-quarters as high as for female claimants.
Data Limitations Prevent Definitive Conclusions Regarding the Cause of Unexplained Racial Differences in ALJ Decisions
The existence of persistent, unexplained differences by race and other factors not used as criteria in the decision-making process—after we controlled for as many factors as the data allowed—means that we cannot rule out the possibility that claimant groups are being treated unequally. However, two limitations, common to almost all multivariate analyses, prevent us from definitively determining whether unexplained differences in allowance decisions by claimant groups are due to discrimination or other forms of bias in the decision-making process. First, differences between claimant groups may be a result of a lack of precision in some of the variables in the model. For example, when the severity of a claimant’s impairment is evaluated by the medical examiners, they are placed in one of five categories. However, the categories may not capture subtle
32Additional analyses showed that among claimants with nonattorney representatives, African-Americans were less likely to be awarded benefits than whites. However, this result may be due to the low number of observations for claimants with nonattorneys.
33The current model compares claimants in the Boston Region with claimants in the New York Region (the reference category). However, when we use any other region as the reference category, claimants from the Boston Region are always significantly more likely to be awarded benefits than claimants from the reference region.
Page 16 GAO-04-14 SSA Disability Decision Making
differences in impairment severity. This is true for many of the categorical variables in the model.34 With more detailed information on severity and other factors, we might have been able to better explain differences by race. Second, differences that we see in the likelihood of being awarded benefits between claimant groups may be the result of a lack of data on certain factors that are relevant for our analysis. For example, data on claimants’ access to medical care are not available. In the past, SSA developed data on the source of the claimant’s medical care—a proxy for the quality of the medical care and a factor that determines the weight that is placed on a given piece of evidence. However, SSA told us that it stopped developing these data due to resource constraints. Other factors such as these, if included in the model, might further explain some of the differences we found in ALJ decisions by race, as well as other differences we found, for example, by sex and income.
In addition, our model’s results concerning the effect of attorney representation on ALJ decisions might be somewhat inflated due to SSA’s systematic exclusion of certain cases—namely, the exclusion of denied ALJ decisions that were appealed to the Appeals Council—from the enhanced data we used for our study. An upward bias of this effect could occur because the denied cases that were appealed (and, therefore, excluded from our dataset) exhibited a higher rate of attorney representation than the denied cases that were not appealed. However, further analyses suggest that our estimates of the different effects of attorney representation by race (that is, the larger effect of attorney representation for African-Americans) are not likely to be inflated. (See appendix I for a detailed discussion of our analyses of this limitation.)
34These variables include number of impairments, number of severe impairments, physical and mental capacity, type of impairment, occupational years, age, occupational categories, occupational skill level, education, literacy, and earnings.
Page 17 GAO-04-14 SSA Disability Decision Making

SSA’s Approach to Quality Assurance Reviews Limits Its Ability to Ensure the Accuracy and Fairness of ALJ Decisions
Analytical, sampling, and data weaknesses in SSA’s approach to quality assurance reviews limit its ability to ensure the accuracy and fairness of ALJ decisions. SSA does not analyze ALJ decisions by race, which limits its ability to identify, correct, and prevent unwarranted racial differences in allowance rates. In addition, weaknesses in the quality assurance review’s sampling methods and data availability present problems.
SSA’s quality assurance review of ALJ decisions includes numerous analyses of ALJ decisions, including analyses of support rates and whether an ALJ abused his or her discretion or committed an error of law.35 In addition, SSA analyzes ALJ decisions by various claimant characteristics such as the claimant’s age and the region where the disability decision was issued.36 However, SSA does not currently analyze ALJ decisions by race.37
By not analyzing ALJ decisions by race as part of its ongoing quality assurance review, SSA is limited in its ability to identify, correct, and prevent unwarranted racial differences in allowance rates. At the time of our review, SSA had no plans to analyze decisions by race as part of its ongoing quality assurance review of ALJ decisions.
Even if SSA decided to analyze ALJ decisions and related data by race, weaknesses in the quality assurance review’s sampling methods would present problems. Specifically, SSA is limited in its ability to conduct certain types of analyses by race because SSA does not take measures to ensure the presence of a sufficient number of claimants in each race/ethnicity category for its quality assurance reviews. As noted in our previous report,38 since 1997, SSA no longer stratifies the selection of ALJ decisions by race (i.e., by African-American and non-African-American) when selecting a random sample of cases—a practice that had helped to ensure that SSA had a sufficient number of cases of African-American
35The quality assurance review of ALJ decisions includes analyses of the accuracy of ALJ decisions, in which the reviewing ALJs assess whether the original ALJ’s ultimate decision to allow or deny is supported by substantial evidence—which is referred to in the quality assurance review as support rates. This review also includes analyses of the fairness of ALJ hearings in which the reviewing ALJs evaluate a multitude of issues, including abuse of discretion and error of law.
36SSA’s analysis of ALJ decisions is limited to descriptive statistics; SSA does not use multivariate techniques—i.e., control for other factors simultaneously—in its analysis of ALJ decisions.
37In addition to not analyzing AJJ decisions by race, SSA does not analyze ALJ decisions by sex or income.
38GAO-02-831.
Page 18 GAO-04-14 SSA Disability Decision Making
claimants in its sample to analyze ALJ decisions by race. Unless SSA over-samples cases for African-Americans and claimants from other racial/ethnic groups, certain analyses by race/ethnicity cannot be performed. For example, due to the low number of African-American claimants in SSA’s enhanced data, we were unable to analyze differences by race/ethnicity for those ALJ decisions that were considered to be unsupported by the reviewing judge. Furthermore, we were unable to analyze by race whether the ALJ followed the appropriate procedures in deciding whether the claimant was eligible for disability benefits.39
Because these analyses for African-American cases would rely on a relatively small number of decisions, conclusions related to race could be statistically unreliable.
SSA also excludes cases that are appealed to the Appeals Council from its quality assurance review—a sampling weakness that affects SSA’s entire quality assurance review process. SSA estimates that about 75 percent of ALJ denials are appealed. By excluding such cases, SSA may be running the risk of using a nonrepresentative sample in its analyses of ALJ decisions and, consequently, drawing incorrect conclusions about the accuracy and fairness of ALJ decisions, although we did not find large differences in the sample we used for our analysis.40 For example, cases are often appealed on the basis of an alleged error of law or abuse of discretion; therefore, SSA may be omitting cases with information that could be valuable in assessing the fairness of ALJ decisions.
According to SSA officials, SSA does not include appealed cases in its ALJ quality assurance review because generally SSA has yet to render a final decision for them. SSA believes that the Appeals Council decision could be inappropriately influenced by information resulting from the quality assurance review of these “live” cases. However, SSA officials informed us that they are considering ways to include appealed cases in their ALJ
39In SSA’s enhanced data that we used for our analysis, only 10 percent of the cases represented unsupported ALJ decisions, and only 13 percent of these were for African-Americans.
40As described in appendix I, we compared the characteristics of claimants in SSA’s enhanced data with the characteristics of claimants that were originally sampled for but, for various reasons, were not included in the enhanced data, and did not find large differences between the two claimant groups. However, our results might be due to the particular cases sampled and/or not included for various reasons during the time period.
Page 19 GAO-04-14 SSA Disability Decision Making
quality assurance review for which final decisions have been rendered.41
According to SSA officials, this would require establishing a special control system so that SSA can recover the files and tapes after the cases have been reviewed at the Appeals Council and have received a final decision.42 SSA officials said this approach would also require removing any information regarding the final decision from the files, so that the reviewing judge can assess the cases without being influenced by this additional information. One concern that SSA has about reviewing appealed cases that have received a final decision is the 1- to 2-year time lag before the quality assurance review could take place.43 SSA officials informed us that reviewing cases 1 to 2 years after the original ALJ decision could affect the quality of the data and the effectiveness of the quality assurance review process.44 Another concern that SSA has regarding this approach is that reviewing judges would know which cases were appealed to the Appeals Council and might analyze appealed cases differently from those cases that were not appealed.
In addition to having analytical and sampling weaknesses, SSA’s quality assurance reviews do not collect certain types of data that could be useful in conducting its analyses of ALJ decisions. For example, SSA does not collect information on the types and sources of medical evidence in the claimant’s file. Types of medical evidence could include treatment records, narrative reports, results of laboratory or clinical tests, and frequency of medical visits, and sources of medical evidence could include treating
41SSA currently envisions selecting several hundred cases that were originally excluded from the sample and reviewing them after the agency has reached a final decision.
42A case is considered final by the agency when a claimant has exhausted his or her right to appeal, and either SSA or the federal courts have rendered a final decision. For example, a decision is considered final when the Appeals Council dismisses cases or upholds, modifies, or reverses the ALJ’s action. If the Appeals Council remands the case back to the ALJ level, the case is not considered final until the ALJ decides on the case. Appeals to the federal court system would further delay the final decision.
43For example, claimants have 60 days to appeal the ALJ decision to the Appeals Council, after which the average number of days for processing and deciding a case at the Appeals Council level is about 225 days. It takes, on average, an additional 250 days to reach a final decision for cases that are remanded by the Appeals Council back to the ALJ.
44The quality of data could be affected when policies and guidance change over time. For example, reviewing ALJs may be using policies and guidance that were not applicable when the original ALJ decided on a case. For corrective action to be effective, it should be taken in a timely manner. For example, if a belated quality assurance review finds that a certain region does not make accurate and fair decisions for a substantial number of its cases, corrective action might occur long after the problem occurred.
Page 20 GAO-04-14 SSA Disability Decision Making

physician, other specialist, hospital (inpatient), and clinic or hospital (outpatient). This kind of information, which was collected by SSA in the past, but is no longer collected, could be used to study the impact of various types and sources of medical evidence on the likelihood that a claimant would be awarded benefits. For example, as part of its quality assurance review, SSA would be able to analyze the relationship between claimants’ access to health care (as measured by the presence of a treating physician or the number or length of doctor visits) and ALJ decisions to allow or deny benefits. SSA would also be able to determine whether the extent of medical evidence in the claimant’s file is affected by attorney representation, or the race, sex, or income of the claimant.
Additionally, since 1990, SSA has significantly scaled back its collection of race/ethnicity data, leaving gaps for certain claimant groups. As we noted in our previous report,45 SSA requests information on race/ethnicity from individuals who complete a form to request a new or replacement Social Security card. The race/ethnicity field on this form is a voluntary field and the data collected are self-reported. Although this process is still in place, only a small portion of SSNs is issued in this manner today. Since 1990, SSA has been assigning SSNs to newborns through its Enumeration at Birth (EAB) program, and SSA does not collect race/ethnicity data through the EAB program. In fiscal year 2002, approximately 90 percent of the 4.2 million original SSN cards issued to U.S. citizens were through the EAB program. Consequently, SSA has not collected race data for those individuals who obtained their SSNs through the EAB program and, under its current approach, SSA would not generally collect these data in the future.46 As future generations obtain their SSNs through the EAB program, the number and proportion of claimants for whom SSA lacks race/ethnicity data are likely to increase.
This lack of race data has implications on SSA’s ability—and the ability of other federal agencies that rely on SSA for race/ethnicity data—to conduct certain types of analyses by race/ethnicity. Although we had sufficient race data for our study,47 SSA’s future ability to identify, correct, and prevent
45GAO-02-831.
46Under current procedures, SSA is unlikely to subsequently obtain information on race and ethnicity for individuals assigned SSNs at birth unless those individuals apply for a new or replacement Social Security card, due to a change in name or a lost card.
47Since SSA’s EAB program began in 1990, and our study used a sample of adult disability claimants from 1997-2000, most claimants in our sample preceded the EAB program. As a result, we had race data for most of the claimants in our sample.
Page 21 GAO-04-14 SSA Disability Decision Making
racial differences in ALJ decisions will be hampered by this growing lack of data for claimants who received their SSNs through the EAB program. This growing lack of data will also affect the ability of other federal agencies that rely on SSA for race/ethnicity data, such as the Centers for Medicare and Medicaid Services, to conduct research and produce reports to ensure the fairness of their programs.
During our review, SSA decided to collect race/ethnicity data on individuals applying for disability or other Social Security benefits at the time of application. Previously, SSA did not collect race data at the point of application for disability benefits since race is not a criterion in the disability determination process. However, during our review, SSA decided to collect data on race/ethnicity because, according to SSA officials, the agency now views collecting and analyzing these data as important for research purposes and to ensure the race neutrality of its programs. SSA recently set up a task group to explore implementation issues. Even though this decision to collect race information has been made, SSA has not set a start date, and SSA officials anticipate that implementation of this endeavor will be a lengthy process.
Conclusions Our analyses of SSA’s enhanced data from its quality assurance reviews show that for claimants who are not represented by attorneys, there are differences in the likelihood of being awarded benefits between African-Americans and whites that cannot be explained by other factors related to the disability decision-making process. Although our empirical results cannot be used as proof that discrimination or some other form of bias exists, the results also do not rule out this possibility. As such, our findings raise important program integrity issues for SSA in terms of its ability to ensure that disability decisions are made accurately and fairly. Relatedly, the results of our analyses raise questions regarding the role and influence that attorney and nonattorney representatives have in the decision-making process; although SSA does not require claimants to have representation, the results of our analysis show that claimants with representation are more likely to be awarded benefits than those without representation. The lower likelihood of being awarded benefits for other claimant groups, including non-English-speaking claimants with translators, claimants with low income, and claimants who are men, also raise questions about the fairness of SSA’s disability decision-making process. These findings point to the need for SSA’s continued efforts to understand racial and other differences in ALJ allowances. While SSA may not have control over the sources of some of these differences, understanding the sources of these differences is the key to taking the necessary steps to demonstrate the
Page 22 GAO-04-14 SSA Disability Decision Making

neutrality of its decision-making process and to eliminate and prevent unwarranted differences in allowance rates.
SSA’s approach to quality assurance reviews has limited its ability to understand these differences and take appropriate action, if necessary, in several ways. For example, because SSA does not over-sample cases for African-Americans and claimants from other racial/ethnic groups and analyze the ALJ decisions by race, it cannot determine whether inaccuracies in ALJ decision making, such as errors of law and abuses of discretion, occur with the same likelihood for claimants of different racial/ethnic backgrounds. Additionally, by not including cases appealed to the Appeals Council with those that undergo an ALJ quality review, SSA’s sample is potentially nonrepresentative of all ALJ decisions. Moreover, the agency misses an opportunity to analyze precisely those cases that are more likely to have had an alleged error of law or abuse of discretion by the ALJ. Finally, SSA no longer collects data on type and source of medical evidence that would allow for more careful analyses of the accuracy and fairness of ALJ decisions. Although SSA has significantly scaled back its collection of race/ethnicity data since 1990, we applaud the agency’s recent decision to begin collecting these data at the point of application for disability and other benefits, which will help to fill some of the gaps in its race/ethnicity data.
To improve SSA’s ability to ensure the accuracy and fairness of ALJ decisions, we recommend that the agency conduct ongoing analyses of ALJ decisions by race/ethnicity, as well as by other claimant groups (such as claimants with attorneys and nonattorneys, with translators, with low incomes, from certain regions and claimants who are men). In doing so, it should take the following steps to enhance its approach to quality assurance reviews:
• Collect data on the types and sources of medical evidence in the claimant’s file to better understand the agency’s and attorney’s role in the development of evidence.
• Analyze differences in support (accuracy) rates, in addition to differences in allowance decisions.
• Over-sample the selection of ALJ decisions by African-American claimants and, to the extent possible, other racial/ethnic groups to ensure that SSA has a sufficient number of cases to conduct analyses of ALJ decisions by race.
• Publish methods used and results as part of its biennial reporting on the findings of its disability hearings quality review process.
Recommendations
Page 23 GAO-04-14 SSA Disability Decision Making

•
Agency Comments
If needed, take actions to correct and prevent any unwarranted differences in allowance and support rates among racial/ethnic and other claimant groups.
To further ensure the accuracy and fairness of ALJ decisions for various claimant groups, we recommend that SSA conduct in-depth investigations of cases (e.g., case studies) to better understand differences in ALJ allowances for certain claimant groups, including claimants with and without an attorney. The results of these investigations should also be published in the biennial reports. If needed, SSA should take actions to correct and prevent any unwarranted differences in allowance rates among these claimant groups.
To ensure that SSA uses a sample that is representative of all ALJ decisions in its quality assurance review, we recommend that the agency restructure its sampling process to incorporate cases that are appealed to SSA’s Appeals Council in the quality assurance review sample. These appealed cases should be analyzed together with, rather than separate from, the rest of SSA’s quality assurance sample.
In light of the methodological complexities associated with analyzing ALJ decisions, we recommend that SSA establish an advisory panel comprised of external experts in a range of disciplines—including statistics/econometrics, design methodology, law, medicine, vocational training, and disability—to provide leadership, oversight, and technical assistance with respect to conducting these and other quality assurance reviews of ALJ decisions.
We provided a draft of this report to SSA for comment. In its written comments, SSA said that our report was useful and timely and agreed with all of our recommendations. SSA also indicated that it intends to go further. For example, SSA noted that, as part of its overall plan to improve the disability determination process, it intends to look at all factors that may produce adverse impacts based on race, ethnicity, national origin, or gender. In addition, SSA is currently developing recommendations on how to collect meaningful data on race and ethnicity. SSA’s comments, as well as its recently proposed plan for improving the disability determination process, are printed in appendix III.
We are sending copies of this report to the Social Security Administration, appropriate congressional committees, and other interested parties. We
Page 24 GAO-04-14 SSA Disability Decision Making

will also make copies available to others on request. In addition, the report will be available at no charge on GAO’s Web site at http://www.gao.gov.
If you or your staff have any questions concerning this report, please call me or Carol Dawn Petersen, Assistant Director, at (202) 512-7215. Staff acknowledgments are listed in appendix IV.
Robert E. Robertson Director, Education, Workforce, and Income Security Issues
Page 25 GAO-04-14 SSA Disability Decision Making
Appendix I: Scope and Methods
To determine whether decisions by Administrative Law Judges (ALJs) to allow disability claims were affected by the race of the claimant, we developed a model of ALJ decision making that tested for racial differences after controlling for other factors related to the disability decision-making process. These factors included (1) factors that represent criteria in the decision-making process; (2) factors that represent participants in the decision-making process; and (3) factors that are not part of, but may influence, the decision-making process. To conduct our analysis, we employed logistic regression models and Oaxaca decomposition methods. We used data from the Social Security Administration’s (SSA) quality assurance review at the hearings level, which we refer to as the enhanced data. The enhanced data contain detailed information—some of which was previously unavailable to GAO—on medical and vocational factors for a sample of 7,908 SSA claimants.
Prior to constructing these models, we conducted analyses related to data quality. Given our previously reported concerns about the degree to which the enhanced data are representative,1 we conducted tests to determine whether the enhanced data were sufficiently representative and reliable for our analyses. Specifically, in these analyses, we sought to determine (1) whether the more detailed medical and vocational information included in the enhanced data set were sufficiently important to justify using this restricted sample of claimants and (2) whether the sample of claimants for which the enhanced data were available was representative of the broader population of claimants.
We developed our analyses and models in consultation with GAO methodologists, expert consultants, and SSA officials.2
This appendix is organized into five sections: Section 1 describes the data that were used in the analysis of potential racial disparities, as well as data
1See U.S. General Accounting Office, SSA Disability Decision Making: Additional
Measures Would Enhance Agency’s Ability to Determine Whether Racial Bias Exists, GAO-02-831 (Washington, D.C.: Sept. 9, 2002).
2We are grateful to four outside experts who assisted us with this study. They are Judith Hellerstein, Associate Professor of Economics at the University of Maryland; Joseph Kadane, Professor of Statistics and Social Sciences at Carnegie-Mellon University; Brent Kreider, Associate Professor of Economics at Iowa State University; and Kajal Lahiri, Professor of Economics at the University at Albany, State University of New York. We take full responsibility for any errors.
Page 26 GAO-04-14 SSA Disability Decision Making

Appendix I: Scope and Methods
Section 1: Databases and Information Sources
that were used in the analyses of data quality. Section 2 describes analyses and results related to our tests of data quality and reliability. Section 3 provides background on the weighting scheme used in the analysis, as well as details on sampling errors. Section 4 describes the variables that were included in our baseline and final models and presents the results of these final models and the Oaxaca decomposition analysis. Finally, Section 5 presents the limitations of our analyses.
We used two types of SSA data to conduct our analyses: (1) the enhanced data, which were derived from a sample of SSA claimants, and (2) administrative data, which were derived from the universe of claimants.
The enhanced data are compiled by the Division of Disability Hearings Quality (DDHQ) within SSA’s Office of Quality Assurance (OQA). These data are compiled as part of an ongoing quality assurance review of the decision-making accuracy of ALJs. The review involves an examination of the initial, reconsideration, and hearings level decisions by a medical consultant, a disability examiner, and an ALJ.
The administrative data were obtained from several sources. For each adjudicative level (the initial and reconsideration, hearings, and Appeals Council levels), SSA has an electronic file that contains a limited amount of data for each claimant. In addition to these three datasets, we used earnings data from SSA’s Master Earnings File (MEF).
We used these data for the various analyses that are described more fully in later sections. In brief, we used the enhanced data for our “severity analysis,” which sought to determine whether the enhanced data contained variables that were better measures of the claimant’s medical severity than the variables contained in SSA’s administrative files. We used the administrative data for our “nonresponder analysis,” which sought to determine whether the enhanced data were representative. Based on the results of the severity and nonresponder analyses, we decided to use the enhanced data for our analysis of potential racial disparities.
Table 3 presents the datasets that we used in our analyses, the decision-making level to which the particular dataset pertains, the analyses for which we used the particular dataset, and the years of data and the specific variables that were used in our analyses.
Page 27 GAO-04-14 SSA Disability Decision Making

Appendix I: Scope and Methods
Table 3: Data Used in Our Analyses
Decision-making levels to which data generally Analyses Years used in
Dataset pertain conducted analyses Information that was used in analyses
Enhanced data Hearings levela Final analysis and Oct. 1997-Sept. severity analysis 2000
Claimant’s impairments, severity of impairments, alcohol or drug abuse, consultative exam requested, number of impairments, number of severe impairments, residual functional capacity of claimant, mental residual functional capacity of claimant, occupational type, years of employment, occupational skill level, years of education, literacy, age, type of representation, other hearing participants (vocational expert, medical expert, translator, and claimant), sex, race, claim type, year of decision, region, and the allowance decision at the hearing level.
831 datab Initial and reconsideration Nonresponder 1990-2000 Claimant’s age, sex, race, body systems levels analysis affected by the impairment(s) alleged at the
initial and reconsideration levels, occupational years, years of education, whether the claimant obtained a consultative exam, and claim type.
Office of Hearings Hearings level Nonresponder Oct. 1997-Sept. Claimant’s body system affected by the and Appeals Case analysis 2000 impairment(s) alleged at the hearing level, Control System type of representation, other hearing (CCS) datab participants (vocational expert, medical expert,
translator and claimant), and the allowance decision at the hearing level.
Appeals Council Appeals Council level Nonresponder 1997-2002 Indicator of whether claimant appealed the Automated analysis allowance decision at the hearing level and Processing System allowance decision at the Appeals Council (ACAPS)b level.
Master Earnings Fileb N/A Final analysis 1948-2002 Yearly individual earnings.
Source: Social Security Administration.
aThe enhanced data also contain variables pertaining to conditions or actions taken at the initial and reconsideration levels for a sample of claimants who have appealed to an Administrative Law Judge.
bThe use of this database was restricted to only those observations that had matches with the SSNs that were included in the enhanced data or in the sample from which the enhanced data were developed.
Section 2: Data To ensure that the SSA data were sufficiently reliable for our analyses, we conducted detailed data reliability assessments of the five datasets that we
Reliability Tests used. We restricted these assessments, however, to the specific variables and records that were pertinent to our analyses. We found that all of the datasets were sufficiently reliable for use in our analyses.
Page 28 GAO-04-14 SSA Disability Decision Making

Appendix I: Scope and Methods
Enhanced Data Our reliability assessment of the enhanced data included two steps. First, to assess the general reliability of the enhanced data that we used in our analysis, we interviewed officials from SSA’s DDHQ about procedures to ensure the enhanced data’s reliability. On the basis of discussions with DDHQ officials, we concluded that careful data entry controls and processing procedures are applied in maintaining the reliability of the enhanced data. Second, to assess the completeness of the enhanced data that we used in our analyses, we conducted frequency analysis of relevant fields. On the basis of the results of our frequency tests of relevant data elements and our interviews with SSA officials, we concluded that the enhanced data were sufficiently complete and accurate for use in our final analyses.3
SSA Administrative Files Our assessment of the reliability of the relevant data from SSA’s administrative files (831, CCS, and ACAPS) also involved several steps. For each dataset, we assessed the general reliability of relevant data (i.e., the specific variables and records that we would use in our analyses) by interviewing SSA officials on their processes and procedures to ensure data quality. To determine the completeness of the data, we conducted frequency analyses of relevant fields. Finally, to assess the accuracy of the relevant fields, we matched the enhanced data with the data from the administrative files and compared the values of the fields common to both data sets.
On the basis of our review of existing information, we concluded that, while not optimal, adequate quality controls are in place to ensure the reliability of the specific variables from SSA’s administrative files that we used in our analysis, and the results of our frequency tests and our examination of matched data confirmed that we had sufficiently complete and accurate data for use in our nonresponder analyses.4
With respect to earnings data from the MEF, SSA provided us with complete earnings data for each person included in the enhanced data. We were unable to test the accuracy of earnings data from the MEF because comparable data were not available in the enhanced data. However, SSA’s
3See below for a discussion of the representativeness of the enhanced data.
4In conducting these tests, we found that only one data field (occupation from the 831 administrative file) did not pass all 3 of these tests and was, therefore, excluded from the subsequent nonresponder analyses.
Page 29 GAO-04-14 SSA Disability Decision Making
Appendix I: Scope and Methods
OQA annually reviews the accuracy of the MEF earnings data by extracting individual earnings from the reports submitted by employers and self-employed individuals and by then comparing the reported earnings to earnings posted to the MEF. To further ensure the accuracy of these data, SSA also now mails Social Security statements to individuals who have earnings and are age 25 years or older to inform individuals about their earnings.
Additional Tests of Enhanced Data
For our final analyses, the enhanced data have some significant advantages over SSA’s administrative files. Most importantly, the enhanced data contain information on medical severity5 that are not available in SSA’s administrative files and were not available to GAO when our agency issued a report in 1992 concerning similar analyses.6 Data on medical severity are important because severity is a key factor in the disability allowance decision. This and other variables in the enhanced dataset are developed from a sample of hearings claimants. However, as highlighted in our 2002 report, we were concerned that the sample from which the enhanced data are developed had the potential for being unrepresentative of the population of hearings claimants.7
The enhanced data may not be representative because SSA uses only a fraction of the files that it selects for its sample of ALJ decisions. SSA selects the sample for the enhanced data using an automated system that selects a stratified random sample every month from the population of claimants who had a hearing.8 However, over the period that we examined (1997-2000), roughly 50 percent of the files that were selected to be in the sample were not obtained. There were three primary reasons for why files were not obtained:
5The data on medical severity in the enhanced data are developed during DDHQ’s disability examiner/medical consultant review—a process that is independent from SSA’s disability decision-making process. The medical severity variables are proxies for information that the judge would have seen during the hearing, but are not developed by the judge. Thus, they are appropriate for use in a regression estimating the judge’s allowance decision.
6U.S. General Accounting Office, Social Security: Racial Difference in Disability
Decisions Warrants Further Investigation, GAO/HRD-92-56 (Washington, D.C.: Apr. 21, 1992).
7GAO-02-831.
8Specifically, 140 decisions from each region were selected per month. Of the 140 decisions, 70 were denials and 70 were allowances.
Page 30 GAO-04-14 SSA Disability Decision Making
Appendix I: Scope and Methods
• The files were still in use because claimants appealed the ALJ decision to the next level, that is, to the Appeals Council.9
• The files were misplaced or misfiled.
• The files were still in use because there were still pending payment decisions for cases that were allowed.
In addition, not all of the files that were obtained underwent the three reviews needed to be included in our sample (i.e., reviews by an ALJ, a medical consultant, and a disability examiner). According to SSA officials we interviewed, this was due to time and budget constraints. After the monthly sample was selected, DDHQ requested the files from various storage facilities and regional offices. As the files came in, they were chosen to be reviewed by a medical team on a “first come, first serve” basis—that is, files were selected until a sufficient number (as deemed by DDHQ) of files for a given time period was reached. The remaining files were not reviewed by a medical team. Additionally, some of the files that were supposed to be reviewed by an ALJ were not reviewed. In the end, of the 50,022 that were sampled from 1997 through 2000, only 9,082 files underwent all three reviews. For purposes of exposition, we will call the sample of 9,082 files that underwent all three reviews the “responders” and the sample of files that were not obtained the “nonresponders.”10
Given our concerns about the degree to which the enhanced data were representative, before we decided to use the data, we needed to determine (1) whether the additional information contained in the enhanced data were critical to our analyses (in terms of obtaining the best possible estimates of the variables in our model of ALJ decisions)11 and, if so, (2) whether the enhanced data were representative of the population of claimants at the hearings level. To answer these questions, we conducted (1) a “severity analysis” to assess whether the additional information contained in the enhanced data were critical to our analyses and (2) a “nonresponder analysis” to test whether the enhanced data are
9This usually occurs for cases that were denied, but can also occur for allowances such as when the claimant disputes the date of onset.
10The nonresponders also include the sample of files that were obtained, but did not undergo all three reviews.
11By best possible estimates, we mean unbiased estimates, combined with small standard errors.
Page 31 GAO-04-14 SSA Disability Decision Making
Appendix I: Scope and Methods
Severity analysis
representative. We developed these statistical tests in consultation with our methodologists, our external expert consultants, and SSA officials. The results of these analyses indicated that the enhanced data were critical for our study and were of sufficient quality for analyses of ALJ allowance decisions.
The goal of our severity analysis was to determine which data would allow us to obtain the best possible estimates of the variables in our model of ALJ decisions. Ensuring that we obtain such estimates requires that we use data that are as precise as possible (i.e., those that best capture the actual characteristics of the claimant and the case). Imprecision in the measurement of variables that are statistically significantly related to the disability determination process could result in estimates of the differences between racial categories in allowances that are inappropriately larger or smaller than the real difference.
To determine whether variables in the enhanced data more precisely measured severity and other factors that influence ALJ decisions than variables in the 831 and CCS data, we conducted our severity analysis.12
The specific objective of this test was to determine (using regression analysis) whether the severity data in the enhanced data increased the explanatory power of the model. If it did not, we could use the severity data from SSA’s administrative files, which are available for all claimants, thus avoiding any problems of representativeness.
To conduct our severity analysis, we compared two models of the ALJ’s disability decision (that is, the dependent variable is the ALJ’s decision to allow or deny disability benefits) for the same group of claimants. Specifically:
• Model A contained only those independent variables from the enhanced data that are also available in SSA’s 831 and CCS files.13
12Other factors that are available in the enhanced data, but are not available in the administrative data, include variables on the claimant’s occupational skill level and whether the claimant is literate.
13The enhanced data contain variables that are equivalent (or very similar) to the variables in SSA’s administrative files, such as occupation, but are likely to be more complete and accurate than administrative data, per our data reliability assessments. We used the enhanced data for this analysis so that we would capture only the added value of the variables that are available in the enhanced data in our comparison. If we had used the 831 and CCS data in Model A and the enhanced data in Model B, then Model B might also capture the effect of the higher quality of the enhanced data.
Page 32 GAO-04-14 SSA Disability Decision Making

Appendix I: Scope and Methods
Nonresponder analysis
• Model B contained all of the independent variables in Model A, plus several variables that are only available in the enhanced data, including variables that measure medical severity at the hearings level (impairment severity, number of impairments, number of severe impairments, and residual functional capacity) as well as variables that measure the occupational skill level of the claimant and whether the claimant is literate.14
To determine whether the additional variables in the enhanced data improved our ability to explain allowance rates, we used logistic regression analysis to estimate both of these models. We then compared the predictive power of each model and the significance of the additional variables in Model B.
In summary, we found that Model A (which excluded the additional variables that are available in the enhanced data) explained roughly 27 percent of the variation in allowances, while Model B (which included those additional variables) explained over 40 percent. The results of this analysis show that the additional variables that are included in Model B increase the overall explanatory power of the model. Furthermore, the additional variables in Model B—such as the degree of medical severity, the number of impairments, the number of severe impairments, and measures of the claimant’s residual functional capacity and mental residual functional capacity—were all highly, statistically significant predictors of the ALJ allowance decision.
To determine whether the enhanced data were sufficiently representative, we conducted our nonresponder analysis, which tested whether the responders’ cases (those that were included in SSA’s enhanced data) were statistically significantly different from the nonresponders’ cases (those that were excluded from SSA’s enhanced data). It is important to note that we can only compare the responders and nonresponders on
14This model was the preliminary model of the ALJ decision-making process, from which our final model was derived.
Page 33 GAO-04-14 SSA Disability Decision Making

Appendix I: Scope and Methods
characteristics that are observable (that is, for which data are available).15
Since we are controlling for many of these same variables in our final model, differences we see in observable characteristics in our nonresponder analysis are not critical in and of themselves. However, if few differences exist between responders and nonresponders in observable characteristics, it is more likely (though not guaranteed) that few differences exist between them in unobservable characteristics. Thus, if the nonresponder analysis reveals little or no differences between the two groups we are afforded some measure of confidence that the two groups are similar in unobservable characteristics.
Our nonresponder analysis consisted of a series of tests to compare responders and nonresponders with respect to (1) the allowance decision and (2) characteristics that are related to the allowance decision, including claimant characteristics and characteristics related to administrative processes. To conduct these tests we used data available from SSA’s administrative files (831, CCS, and ACAPS).16 We conducted both regression analyses and bivariate tests. Regression methods and related test statistics were used to estimate differences between responders and nonresponders after simultaneously controlling for other factors that could influence nonresponse. Chi-squared tests and t-tests were used to evaluate the differences in specific characteristics when other characteristics were ignored. These differences were estimated first for responders and nonresponders overall, and then for responders and nonresponders within categories of race, and then for responders and nonresponders within categories of claimants who were allowed or denied at the hearings level.
15Specifically, the variables that we compared include demographic factors such as age, sex, and race; vocational factors such as years employed and years of education; medical variables such as the body system involved in the claimant’s impairment (at the DDS level and at the ALJ level) and whether they had a consultative exam; and administrative variables including claim type, hearing participants (attorney representation, nonattorney representation, vocational expert present, medical expert present), ALJ allowance decision, the final allowance decision (including Appeals Council decision if claimant was denied at the ALJ level and appealed to the Appeals Council), and regulation basis codes (indicating the step of sequential disability decision-making process at which claimant was allowed or denied).
16We did not use the enhanced data to conduct this analysis because they were not available for nonresponders. Had we used the enhanced data for nonresponders and SSA’s administrative data for nonresponders, it would have been difficult to separate the differences between responders and nonresponders in characteristics with the differences between the enhanced data and SSA’s administrative data in quality.
Page 34 GAO-04-14 SSA Disability Decision Making
Appendix I: Scope and Methods
The regression analysis showed no statistically significant differences between responders and nonresponders in many factors that are related to the decision-making process. Specifically, responders were not statistically significantly different from nonresponders in most medical, vocational, and demographic characteristics including body system, age, sex, and race. However, the results of the regression also showed that responders differed from nonresponders in some administrative characteristics. Specifically, claimants who had attorney or nonattorney representation or who had a medical expert testify at the hearing, or had consultative exams were significantly less likely to be responders. We also found small, but statistically significant, differences in the year of the decision and the region. Table 4 summarizes the results of the nonresponder regression analysis, and presents these comparisons for (1) all responders and nonresponders, (2) African-American responders and African-American nonresponders, and (3) white responders and white nonresponders.
Page 35 GAO-04-14 SSA Disability Decision Making
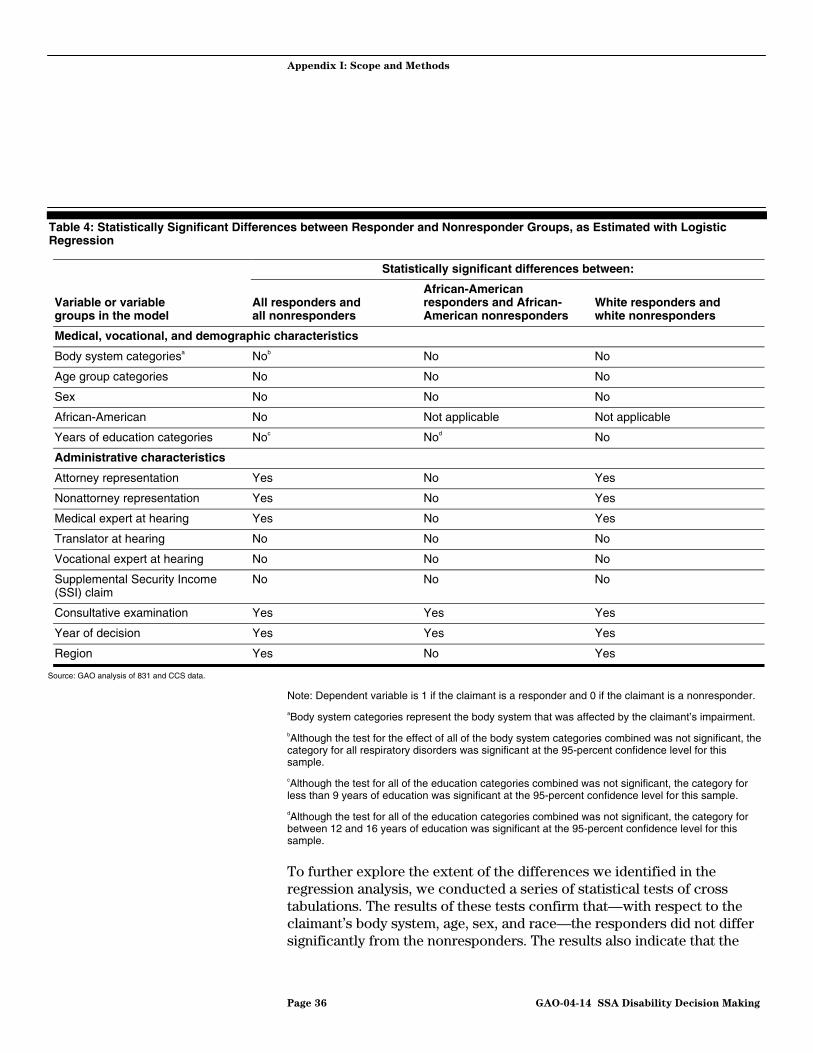
Appendix I: Scope and Methods
Table 4: Statistically Significant Differences between Responder and Nonresponder Groups, as Estimated with Logistic Regression
Statistically significant differences between:
African-American Variable or variable All responders and responders and African- White responders and groups in the model all nonresponders American nonresponders white nonresponders
Medical, vocational, and demographic characteristics
Body system categoriesa Nob No No
Age group categories No No No
Sex No No No
African-American No Not applicable Not applicable
Years of education categories Noc Nod No
Administrative characteristics
Attorney representation Yes No Yes
Nonattorney representation Yes No Yes
Medical expert at hearing Yes No Yes
Translator at hearing No No No
Vocational expert at hearing No No No
Supplemental Security Income No No No (SSI) claim
Consultative examination Yes Yes Yes
Year of decision Yes Yes Yes
Region Yes No Yes
Source: GAO analysis of 831 and CCS data.
Note: Dependent variable is 1 if the claimant is a responder and 0 if the claimant is a nonresponder.
aBody system categories represent the body system that was affected by the claimant’s impairment.
bAlthough the test for the effect of all of the body system categories combined was not significant, the category for all respiratory disorders was significant at the 95-percent confidence level for this sample.
cAlthough the test for all of the education categories combined was not significant, the category for less than 9 years of education was significant at the 95-percent confidence level for this sample.
dAlthough the test for all of the education categories combined was not significant, the category for between 12 and 16 years of education was significant at the 95-percent confidence level for this sample.
To further explore the extent of the differences we identified in the regression analysis, we conducted a series of statistical tests of cross tabulations. The results of these tests confirm that—with respect to the claimant’s body system, age, sex, and race—the responders did not differ significantly from the nonresponders. The results also indicate that the
Page 36 GAO-04-14 SSA Disability Decision Making

Appendix I: Scope and Methods
statistically significant differences between responders and nonresponders in allowances and several administrative variables were not large in magnitude. Table 5 shows that responders differed from nonresponders with respect to statistically significant administrative factors from table 3 by 0 to 4 percentage points.
Table 5: Tabulations of Statistically Significant Administrative Factors (from Table 4) for Responders and Nonresponders
Percent of Percent of responders nonresponders
Variable in this category in this category
Attorney representation 70
Nonattorney representation 11
Medical expert at hearing 15
Consultative examination requested 70
Year of decision
1997 8
1998 36
1999 33
2000 22
Region
1. Boston 12
2. New York 10
3. Philadelphia 10
4. Atlanta 9
5. Chicago 11
6. Dallas 10 10
7. Kansas 11 10
8. Denver 10 10
9. San Francisco 9 10
10. Seattle 9 11
Source: GAO analysis of 831 and CCS data.
When we repeated the above analysis for subgroups of the sample— African-American claimants, non-African-American claimants, claimants who were allowed benefits, and claimants who were denied benefits—our findings were generally consistent across most subgroups. That is, when we compared responders and nonresponders who were African-American, non-African-American, and who were allowed benefits, we found virtually
Page 37 GAO-04-14 SSA Disability Decision Making
73
11
16
73
8
33
33
26
10
10
10
10
10

Appendix I: Scope and Methods
no differences in demographic, medical, and vocational characteristics, and only small differences in administrative characteristics.
However, among the sample of claimants who were denied benefits, we found a substantial difference in the rates of attorney representation among responders and nonresponders. Specifically, 59 percent of responders who were denied benefits were represented by attorneys and 67 percent of nonresponders who were denied benefits were represented by attorneys. This means that claimants who were denied benefits and had attorneys are underrepresented in the sample. Such under-representation could result in inflated estimates of the effect of attorney representation on allowances. Further analysis of denied responders and nonresponders by race did not reveal variations in the differences in attorney representation between responders and nonresponders by race. (See below for our further analysis of this effect by race.) Therefore, we are confident that, even though denied claimants with attorneys are under-represented overall, our finding indicating that the effect of attorney representation is greater for African-American claimants than for white claimants is valid.
Ultimately, the small differences we found between responders and nonresponders on only administrative factors, and the similarity of the differences in responders and nonresponders for African-Americans and whites, makes us reasonably confident that our estimates of the effects of the factors on ALJ decisions are not severely biased by nonresponse. At the same time, the statistical significance of the associations between nonresponse and a number of administrative characteristics as well as the cumulative effect of a number of small differences between responders and nonresponders may be nontrivial. 17
We conducted all of our analyses of the enhanced data using probability weights because the enhanced data were based on a stratified sample rather than the universe of hearings claimants. The weight for each claimant equals the inverse probability of the claimant being selected into the sample. To control for the effect of the stratified sampling scheme on the estimates, we conducted all of our regression analysis using computer software that adjusts the estimates according to the weighting scheme.
Section 3: Weighting and Sampling Errors
17We conducted the nonresponder analysis with and without probability weights. The results of both sets of analysis were consistent.
Page 38 GAO-04-14 SSA Disability Decision Making
Appendix I: Scope and Methods
Section 4: Statistical Analysis
Because the analysis was based on a sample, the reported estimates have sampling errors associated with them.18 Sampling errors for the estimates of allowance rates for whites, African-Americans, and claimants from other racial/ethnic groups were calculated at the 95-percent confidence level. This means that in 95 out of 100 chances, the actual percentage would fall within the range defined by the estimate, plus or minus the sampling error. For example, the estimate that 63 percent of claims filed by whites were allowed at the hearing level has a sampling error of 2 percent. This means that a 95-percent chance exists, or we can be 95-percent confident, that the actual percentage falls between 61 percent and 65 percent. Similarly, for each variable in our logistic regression model, a standard error was computed that reflects the precision of the estimated odds ratio. The odds ratio for each variable in the logistic regressions was considered to be significantly different from 1.0 (1.0 implies no difference in the odds) when the 95-percent confidence interval around the estimate of the odds ratio did not contain 1.0. For example, the 95-percent confidence interval for the variable indicating that a translator was present at the hearing was 0.39 to 0.90. This interval did not contain 1.00 and, therefore, the translator variable is considered statistically significant.
To choose the appropriate variables for our model of ALJ decision making, we reviewed pertinent literature and consulted with SSA officials and outside experts.19 The final model included variables that are either measures or approximate measures for (1) factors that represent criteria used in decision-making process, (2) factors that represent participants in the decision-making process, (3) factors that are not part of the decision-making process but may have an influence on it, and (4) interaction variables reflecting the relationship between factors that are not criteria used in the decision-making process.
18A sampling error is a variation that occurs by chance when a model/analysis relies on a sample that was surveyed rather than the entire population. The size of the sampling error reflects the precision of the estimate—the smaller the sampling error, the more precise the estimate.
19Four outside experts reviewed our methods and preliminary results and provided us with helpful feedback. They are Judith Hellerstein, Associate Professor of Economics at the University of Maryland; Joseph Kadane, Professor of Statistics and Social Sciences at Carnegie-Mellon University; Brent Kreider, Associate Professor of Economics at Iowa State University; and Kajal Lahiri, Professor of Economics at the University at Albany, State University of New York.
Page 39 GAO-04-14 SSA Disability Decision Making

Appendix I: Scope and Methods
A number of variables in our model are measures for medical and nonmedical criteria used in 4 of the 5 steps of the disability decision-making process.20 Specifically, the medical factors that we controlled for included type of medical impairment (such as disorders of the back and musculoskeletal disorders), the degree of impairment severity, alcohol or drug abuse alleged,21 consultative examination requested, number of impairments, number of severe impairments, residual functional capacity, and mental residual functional capacity. The nonmedical factors that we controlled for included occupational categories (blue collar, white collar, and service sector), years employed, occupational skill level, educational level, literacy, and age.
We also controlled for factors that represent participants in the decision-making process. These variables include whether the claimant was represented by an attorney or a nonattorney, such as a relative, legal aide, or friend; whether a medical and/or vocational expert testified at the hearing; whether a translator attended the hearing, and whether the claimant attended the hearing.
Finally, we controlled for factors that are not part of the decision-making process, but for which we have reason to believe may influence the disability decision-making process. These variables include the claimant’s claim type,22 the year of the hearing decision, and the SSA region.23 Other factors that we controlled for include demographic factors such as sex,
20See appendix II for a description of the 5-step decision-making process.
21In 1996, the Contract With America Advancement Act provided that individuals could not be found disabled for purposes of DI or SSI if drug addiction or alcoholism was a “contributing factor material to the determination of disability.” Drug addicts and alcoholics who were disabled as a result of other causes would still be eligible.
22Claim type includes SSI claims, DI claims, and concurrent claims for both SSI and DI.
23The year of the decision might capture changes in decision making that have occurred over time due to changes in national policy or in the economic health of the country. In addition, region might capture regional differences in culture, social norms, court decisions or geographic variation in SSA’s practices. In “A Structural Model of Social Security’s Disability Determination Process,” in The Review of Economics and Statistics, May 2001, 83(2): 348-61, Jianting Hu, Kajal Lahiri, Denton R. Vaughan, and Bernard Wixon found evidence that allowance rates at the initial level differed significantly by region at Step 2 and 4 of the disability decision-making process. In “Disability Insurance: Applications, Awards, and Lifetime Opportunity Costs,” Journal of Labor Economics, Oct. 1999, 784-827, Brent Kreider found a significant relationship between region allowance rates and the likelihood of allowance for an individual claimant.
Page 40 GAO-04-14 SSA Disability Decision Making
Appendix I: Scope and Methods
race, and earnings.24 Although these factors are not part of the ALJ decision-making process,25 we included these variables in our analysis to find out whether they are related to ALJ allowance decisions.
After estimating our initial model, we found several variables that did not represent criteria but that had a statistically significant influence on ALJ decisions. To investigate whether the effects of these variables on ALJ decisions differed by the claimant’s race, we incorporated interaction terms into our model and tested their significance, both simultaneously and sequentially. Specifically, to test whether racial groups are treated differently when they are represented by attorneys, we included an interaction term between race and attorney representation. Similarly, we included an interaction term to test whether racial groups are treated differently when they are represented by persons other than attorneys. We also included interaction terms between race and the following variables: sex, earnings, translator, year of the decision,26 and region.
Logistic Regression We used logistic regression to estimate the model—an appropriate technique when the dependent variable is binary, or has two categories, such as benefits being allowed or denied.
On the basis of our initial analyses, we found that the interaction term for race and attorney representation was the only statistically significant interaction term in the model. We removed the remaining insignificant interaction terms from the model because removing them had little effect
24GAO/HEHS-94-94 found significant differences in allowance decisions at the initial level by sex. GAO/HRD-92-56 found significant differences in allowance decisions at the hearings level by race. Additionally, in “A Structural Model of Social Security’s Disability Determination Process,” in The Review of Economics and Statistics, May 2001, 83(2): 348-61, Jianting Hu, Kajal Lahiri, Denton R. Vaughan, and Bernard Wixon found that sex and race played a statistically significant role in Step 2 of the decision-making process. In SSA’s initial comments on our analysis, they suggested that we incorporate a variable that controls for the claimant’s earnings into our model.
25Although earnings are used in Step 1 of the decision-making process to determine whether the claimant’s earnings exceed the limit required for eligibility (and to determine whether the claim type is SSI or DI), earnings are not considered in Steps 2-5, which pertain to the ALJ disability decision-making process.
26Although we had no compelling theoretical or empirical reason for testing this particular interaction, we believed it would be useful to determine whether any racial differences that we found in our initial model were larger at the beginning of the 4-year period for which we had data than they were at the end of the 4-year period.
Page 41 GAO-04-14 SSA Disability Decision Making

Appendix I: Scope and Methods
on our estimates of the variables left in the model. We did not, however, remove insignificant variables that were not interaction terms from our models since our primary objective was to estimate the effect of race “net” of other factors we believed could potentially influence the allowance decision, regardless of how small or statistically insignificant they were.
The results of two of our models—our baseline model and our final model containing the significant interaction term—are presented in table 6. The first numerical column in table 6 presents the percentage of claimants within each variable category. The second and third columns present odds ratios that are estimated for each variable in our baseline and final models, respectively.27 The interpretation of the odds ratio for a particular variable depends on whether the variable is a dummy variable or a categorical variable. For dummy variables, a statistically significant odds ratio that is greater/less than 1.00 indicates that claimants with that characteristic are more/less likely to be allowed than claimants without it. For categorical variables, a statistically significant odds ratio that is greater/less than 1.00 indicates that claimants in that category are more/less likely to be allowed than the claimants in the comparison category.28
27Odds (O) are mathematically related to but not the same as probabilities (P), that is O = P/[1-P]. For further explanation of how to interpret odds and odds ratios, see text after table 6.
28Comparison categories can be identified because they have an odds ratio of exactly 1.00 and in our report, with the exception of region, are presented first among the categories of a variable.
Page 42 GAO-04-14 SSA Disability Decision Making

Appendix I: Scope and Methods
Table 6: Results of Baseline and Final Models of ALJ Allowance Decisions
Weighted percent of Predicted odds Predicted
Explanatory claimants in ratio for baseline odds ratio for Categories for explanatory variables variables this category model final model
Factors that represent criteria in the decision-making process
Medical criteria
Impairments (dummy variables)
Disorders of the back 31% 0.83
Osteoarthritis and allied disorders 10% 0.84
Other musculoskeletal disorders 18% 0.63** 0.64**
Mental retardation 1% 0.83
Mood disorders 24% 0.92
Schizophrenia 2% 0.97
Other mental disorders 17% 0.59** 0.59**
Diabetes 9% 1.16
Other endocrine disorders 4% 1.13
Ischemic heart 4% 1.17
Hypertension 5% 0.58** 0.57**
Other cardiovascular disorders 4% 0.92
Neurological disorders 14% 1.11
Respiratory disorders 7% 0.93 0.93
Neoplasms 2% 2.94** 2.85**
Other disorders 17% 1.39* 1.39*
Severity of impairment (categorical variable)
Not severe 11% 1.00 1.00
Moderate 55% 1.30 1.26
Moderately severe 20% 2.52** 2.46**
Meets listing 11% 49.31** 48.97**
Insufficient medical evidence 3% 3.71** 3.65**
Drug abuse (dummy variable)
Alcohol or drug abuse 1% 0.62 0.62
Page 43 GAO-04-14 SSA Disability Decision Making
0.83
0.84
0.80
0.92
1.00
1.14
1.11
1.17
0.93
1.11

Appendix I: Scope and Methods
Weighted percent of Predicted odds Predicted
Explanatory claimants in ratio for baseline odds ratio for Categories for explanatory variables variables this category model final model
Source of medical care (dummy variable)
Consultative examination requested 15% 1.07
Number of impairments (categorical variable)
1-2 impairments 36% 1.00
3-4 impairments 39% 1.49** 1.49**
5 or more impairments 25% 2.08** 2.08**
Number of severe impairments (categorical variable)
No severe impairments 14% 1.00
1 severe impairment 47% 1.77* 1.81*
2 severe impairments 26% 2.33** 2.40**
3 or 4 severe impairments 13% 2.36** 2.43**
Residual functional capacity (categorical variable)
Heavy or medium 17% 1.00
Light (nonexertional restrictions) 26% 1.89** 1.91**
Light (exertional restrictions) 7% 3.53** 3.49**
Sedentary 9% 2.42** 2.42**
Less than sedentary 8% 13.69** 13.74**
Not applicable (mental RFC or not severe) 29% 1.30 1.31
Not determinable 4% 1.80* 1.81*
Mental residual functional capacity (dummy variable)
Does not meet mental demands of unskilled work 8% 30.97** 31.97**
Nonmedical criteria
Occupational categories (categorical variable)a
White collar 28% 1.00 1.00
Service sector 23% 0.97 0.96
Blue collar 37% 1.06 1.07
No occupation 11% 1.08 1.09
Page 44 GAO-04-14 SSA Disability Decision Making
1.06
1.00
1.00
1.00

Appendix I: Scope and Methods
Weighted percent of Predicted odds Predicted
Explanatory claimants in ratio for baseline odds ratio for Categories for explanatory variables variables this category model final model
Occupation not determinable 1% 2.52
Years of employment (categorical variable)
Less than 2 years of employment 22% 1.00
2-4 years of employment 21% 1.26
5-9 years of employment 22% 1.34
10 or more years of employment 32% 1.56** 1.56**
Not determinable 3% 0.73
Occupational skill level (categorical variable)
Skilled 30% 1.00
Semiskilled 37% 0.88
Unskilled or has no skill 32% 0.84
No skill information available 1% 1.07
Education (categorical variable)
Under 6 years of education 5% 1.00
6-11 years of education 31% 1.00
12 years of education 45% 0.92
Greater than 12 years of education 18% 1.02
Not determinable 0.3% 0.91 0.95
Literacy (categorical variable)
Literate 96% 1.00 1.00
Illiterate 3% 1.20 1.19
Literacy not determinable 1% 1.25 1.22
Age categoryb (categorical variable)
18-24 years old 2% 1.00 1.00
25-44 years old 44% 1.13 1.14
45-49 years old 21% 1.28 1.29
Page 45 GAO-04-14 SSA Disability Decision Making
2.60
1.00
1.25
1.34
0.74
1.00
0.88
0.85
1.04
1.00
0.99
0.91
1.02

Appendix I: Scope and Methods
Weighted percent of Predicted odds Predicted
Explanatory claimants in ratio for baseline odds ratio for Categories for explanatory variables variables this category model final model
50-54 years old 20% 2.28** 2.31**
55 years old or over 13% 2.18** 2.19**
Factors that represent participants in the decision-making process
Representation (categorical variable)
No representation 21% 1.00
Attorney c representation 67% 3.31** 2.93**
Other representation 12% 2.78** 2.75**
Other hearing participants (dummy variables)
Medical expert 13% 1.01
Vocational expert 47% 0.41** 0.41**
Translator 4% 0.59* 0.59*
Claimant present at hearing 99% 2.51** 2.55**
Factors that are not part of the decision-making process
Sex (dummy variable)
Male 47% 0.73** 0.72**
Race (categorical variable)
White 65% 1.00
Other racial/ethnic groups 11% 0.84 0.90
dAfrican-American 24% 0.73** 0.50**
Earningse (categorical variable)
Less than $5,000 per year 49% 1.00 1.00
$5,000-$20,000 per year 37% 1.96** 1.97**
Greater than $20,000 14% 3.24** 3.22**
Claim type (categorical variable)
Supplemental Security Income (SSI) 27% 1.00 1.00
Concurrent claim 34% 1.15 1.16
Disability Insurance (DI) 39% 1.12 1.13
Page 46 GAO-04-14 SSA Disability Decision Making
1.00
1.00
1.00

Appendix I: Scope and Methods
Weighted percent of Predicted odds Predicted
Explanatory claimants in ratio for baseline odds ratio for Categories for explanatory variables variables this category model final model
Year of decision (categorical variable)
1997 9% 1.00
1998 39% 1.22
1999 33% 1.33
2000 19% 1.35
Region (categorical variable)
1. Boston 3% 2.32** 2.31**
2. New York 12% 1.10
3. Philadelphia 11% 1.15
4. Atlanta 26% 1.02
5. Chicago 14% 1.08
6. Dallas 14% 0.94
7. Kansas 4% 1.05
8. Denver 3% 1.06
9. San Francisco 12% 0.89
10. Seattle 3% 1.00
Interaction variables
Race/attorney interaction term (dummy variables)
White claimant with attorney 46% N/A 1.00
Claimant from other racial/ethnic group with attorney 6% N/A 0.87
African-American claimant with attorney 14% N/A 1.76**
Source: GAO analysis of weighted enhanced data.
Notes: The dependent variable is 1 if the claimant is allowed and 0 if the claimant is not allowed. Variables with an odds ratio of 1.00 represent the excluded category.
* Indicates that the variable is statistically significant at the 95-percent confidence level.
** Indicates that the variable is statistically significant at the 99-percent confidence level.
aWhite collar includes professional, technical, or managerial and clerical and sales occupations. Service includes service occupations. Blue collar includes all other occupations.
bAge reflects the age of the claimant on the hearing date.
Page 47 GAO-04-14 SSA Disability Decision Making
1.00
1.23
1.33
1.35
1.11
1.15
1.02
1.08
0.93
1.05
1.05
0.88
1.00

Appendix I: Scope and Methods
cIn the baseline model, the variable for attorney representation indicates that, on average, the odds of allowance for claimants with attorney representation are 3.3 times higher than those for claimants with no representation. In the final model, the variable for attorney representation indicates that the odds of allowance for white claimants with attorney representation are 2.93 times higher than the odds of allowance for white claimants without attorney representation. The interpretation of the variable for attorney representation changes in the final model because interaction terms between race and attorney representation have been included in the final model. Section 4 explains the interpretation of the interaction terms in greater detail.
dIn the baseline model, the variable for African-Americans indicates that, on average, the odds of allowance for African-Americans are 0.73 times as high as the odds of allowance for white claimants. In the final model, the variable for African-American indicates that the odds of allowance for African-Americans without attorneys are 0.50 times as high as the odds of allowance for white claimants without attorneys. The interpretation of the variable for race changes in the final model because interaction terms between race and attorney representation have been included in the model. Section 4 explains the interpretation of the interaction terms in greater detail.
eEarnings are computed as an average of the claimant’s earnings for the 5 years preceding the hearings level decision date.
Due to the presence of the interaction term between attorney representation and race in the final model, one cannot interpret the effect of race and attorney representation independent of each other. Tables 7, 8, and 9 show how to derive and interpret odds ratios for different race and attorney representation subgroups. Table 7 shows that, first, the odds of
allowance are computed for every race subgroup. The odds of allowance are equal to the number of claims allowed divided by the number of claims denied for a particular group. For example, using the weighted enhanced data, we find that among white claimants who were not represented by an attorney, 54,981 were allowed and 57,667 were denied. Thus, the odds of being allowed for a white claimant that was not represented by an attorney were 0.95 (54,981/57,667).
The observed odds ratio compares the odds of one group against another. The ratio is computed by dividing the odds of allowance of one group by the odds of allowance for another group. For example, the odds of allowance for African-American and white claimants who were not represented were 0.49 and 0.95, respectively. Thus, the observed odds ratio of an African-American claimant who was not represented compared with a white claimant who was not represented was 0.52 (0.49/0.95). The column entitled observed odds ratios presents these ratios for each group, as they compare to whites. Both the odds of allowance and the observed odds ratio are computed without controlling for other factors that influence the allowance decision.
If we control for the other factors that influence the allowance decision using regression analysis, we can estimate the odds ratios “net” of the influence of other factors—the estimated odds ratio. These are presented in the last column of table 7 and come from the estimated odds
Page 48 GAO-04-14 SSA Disability Decision Making
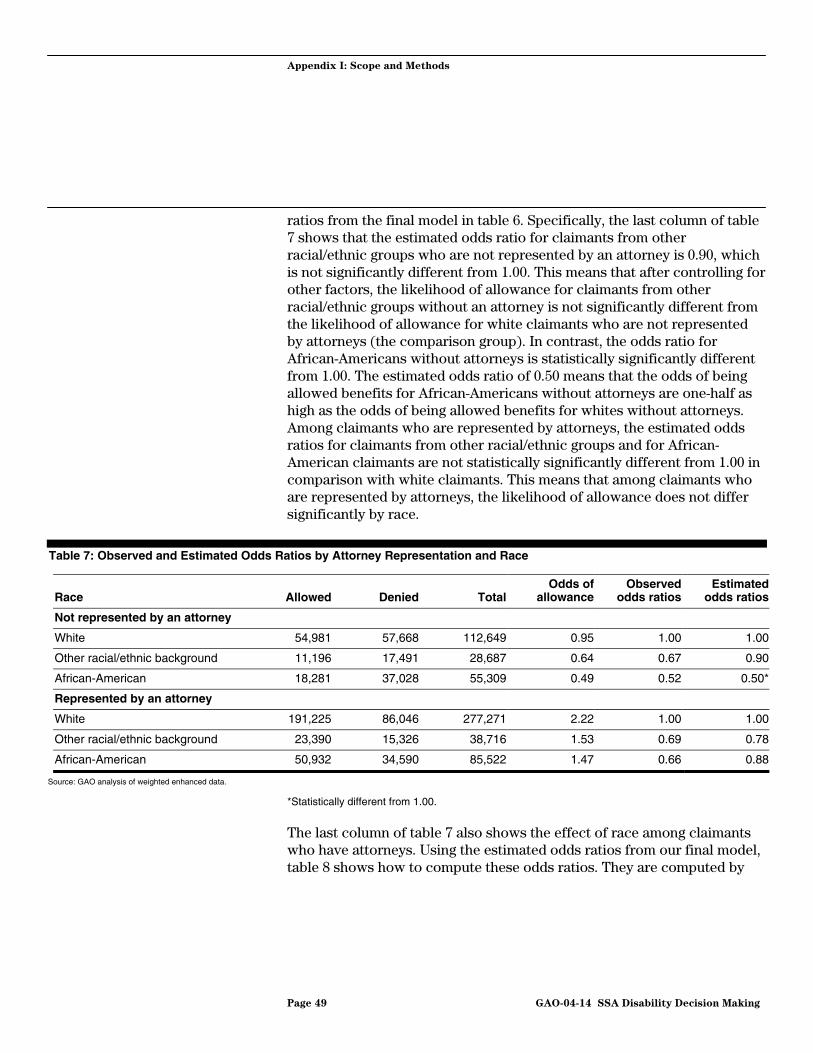
Appendix I: Scope and Methods
ratios from the final model in table 6. Specifically, the last column of table 7 shows that the estimated odds ratio for claimants from other racial/ethnic groups who are not represented by an attorney is 0.90, which is not significantly different from 1.00. This means that after controlling for other factors, the likelihood of allowance for claimants from other racial/ethnic groups without an attorney is not significantly different from the likelihood of allowance for white claimants who are not represented by attorneys (the comparison group). In contrast, the odds ratio for African-Americans without attorneys is statistically significantly different from 1.00. The estimated odds ratio of 0.50 means that the odds of being allowed benefits for African-Americans without attorneys are one-half as high as the odds of being allowed benefits for whites without attorneys. Among claimants who are represented by attorneys, the estimated odds ratios for claimants from other racial/ethnic groups and for African-American claimants are not statistically significantly different from 1.00 in comparison with white claimants. This means that among claimants who are represented by attorneys, the likelihood of allowance does not differ significantly by race.
Table 7: Observed and Estimated Odds Ratios by Attorney Representation and Race
Odds of Observed Estimated Race Allowed Denied Total allowance odds ratios odds ratios
Not represented by an attorney
White 54,981 57,668 112,649 0.95 1.00
Other racial/ethnic background 11,196 17,491 28,687 0.64 0.67
African-American 18,281 37,028 55,309 0.49 0.52 0.50*
Represented by an attorney
White 191,225 86,046 277,271 2.22 1.00
Other racial/ethnic background 23,390 15,326 38,716 1.53 0.69
African-American 50,932 34,590 85,522 1.47 0.66
Source: GAO analysis of weighted enhanced data.
*Statistically different from 1.00.
The last column of table 7 also shows the effect of race among claimants who have attorneys. Using the estimated odds ratios from our final model, table 8 shows how to compute these odds ratios. They are computed by
Page 49 GAO-04-14 SSA Disability Decision Making
1.00
0.90
1.00
0.78
0.88
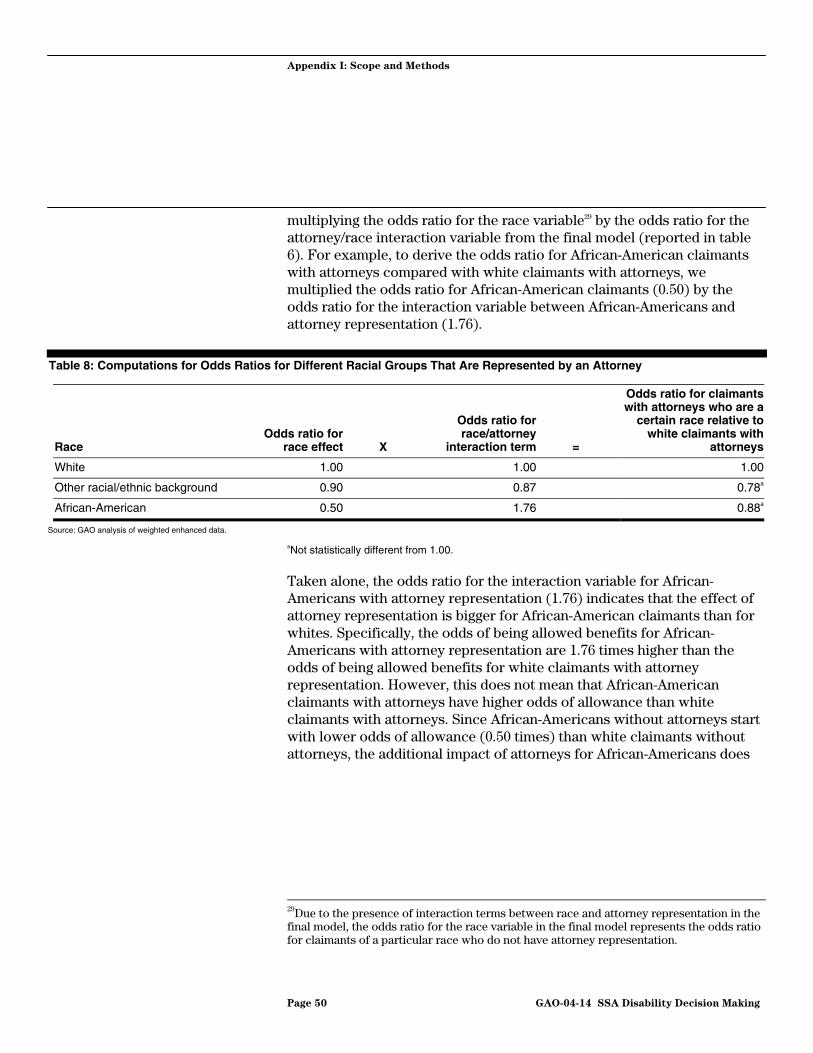
Appendix I: Scope and Methods
multiplying the odds ratio for the race variable29 by the odds ratio for the attorney/race interaction variable from the final model (reported in table 6). For example, to derive the odds ratio for African-American claimants with attorneys compared with white claimants with attorneys, we multiplied the odds ratio for African-American claimants (0.50) by the odds ratio for the interaction variable between African-Americans and attorney representation (1.76).
Table 8: Computations for Odds Ratios for Different Racial Groups That Are Represented by an Attorney
Odds ratio for claimants with attorneys who are a
Odds ratio for certain race relative to Odds ratio for race/attorney white claimants with
Race race effect X interaction term = attorneys
White 1.00 1.00
Other racial/ethnic background 0.90 0.87 0.78a
African-American 0.50 1.76 0.88a
Source: GAO analysis of weighted enhanced data.
aNot statistically different from 1.00.
Taken alone, the odds ratio for the interaction variable for African-Americans with attorney representation (1.76) indicates that the effect of attorney representation is bigger for African-American claimants than for whites. Specifically, the odds of being allowed benefits for African-Americans with attorney representation are 1.76 times higher than the odds of being allowed benefits for white claimants with attorney representation. However, this does not mean that African-American claimants with attorneys have higher odds of allowance than white claimants with attorneys. Since African-Americans without attorneys start with lower odds of allowance (0.50 times) than white claimants without attorneys, the additional impact of attorneys for African-Americans does
29Due to the presence of interaction terms between race and attorney representation in the final model, the odds ratio for the race variable in the final model represents the odds ratio for claimants of a particular race who do not have attorney representation.
Page 50 GAO-04-14 SSA Disability Decision Making
1.00

Appendix I: Scope and Methods
not boost their odds of allowance above the odds of allowance for white claimants with attorneys.30
Using the estimated odds ratios from our final model, table 9 shows how to compute the effect of attorney representation within a particular race group—to compare the odds of allowance between claimants of the same race who have attorneys with those that do not have attorneys. For example, to derive the odds ratio for African-American claimants with attorneys compared with African-American claimants without attorneys, we multiply the odds ratio for attorney representation (2.93) by the odds ratio for the interaction variable between African-Americans and attorney representation (1.76). The product (5.16) means that the odds of being allowed benefits for African-American claimants with attorneys are 5.16 times higher than the odds of being allowed benefits for African-American claimants without attorneys. In contrast, the odds of being allowed benefits for white claimants with attorneys are 2.93 times higher than the odds of being allowed benefits for white claimants without attorneys.
Table 9: Computations for Odds Ratios for Claimants of the Same Race with and without Attorney Representation
Odds ratio for claimants with attorneys who are a certain
Odds ratio for race relative to claimants Odds ratio for attorney race/attorney without attorneys from the
Race representation X interaction term = same race
White 2.93 1.00 2.93*
Other racial/ethnic background 2.93 0.87 2.55*
African-American 2.93 1.76 5.16*
Source: GAO analysis of weighted enhanced data.
*Statistically different from 1.00.
In addition, the average effect of attorney representation is measured with the odds ratio for the attorney representation variable in the baseline model (before the interaction terms were added). Table 6 shows that, on average, the odds of being allowed benefits for claimants with attorney
30The odds ratio for the interaction variable for claimants from other racial/ethnic groups with attorney representation is not significant. This indicates that the effect of attorney representation on the odds of allowance for claimants from other racial/ethnic backgrounds is not significantly different from the effect of attorney representation on the odds of allowance for white claimants.
Page 51 GAO-04-14 SSA Disability Decision Making

Appendix I: Scope and Methods
representation are 3.3 times higher than the odds of being allowed benefits for claimants without attorney representation.
Due to the lower rates of attorney representation among denied claimants in our sample, our estimate of the effect of attorney representation may be inflated. Specifically, we found that the rate of attorney representation was lower among responders who were denied benefits (59 percent) than among nonresponders who were denied benefits (66 percent).31 This difference in rates of attorney representation between denied responders and denied nonresponders could result in an overestimation of the effect of attorney representation on ALJ decisions. This can be shown with an analysis comparing the influence of attorney representation on ALJ decisions for responders and nonresponders. Table 10 shows that among the responders, the odds of allowance for claimants with and without attorneys were 1.97 and 0.69, respectively. The observed odds ratio comparing responders with attorneys to responders without attorneys is 2.88—which means that, the odds of allowance for responders with attorneys were 2.88 times higher than the odds of allowance for responders without attorneys. Similarly, among the nonresponders, the odds of allowance for claimants with and without attorneys were 1.75 and 0.87, respectively. The observed odds ratio comparing nonresponders with attorneys to nonresponders without attorneys is 1.90. When we compare the size of the effect of attorney representation for these two groups—that is, 2.88 for responders compared with 1.90 for nonresponders—we find that the effect of attorney representation is 1.51 times higher among responders than among nonresponders. Consequently, we conclude that, by analyzing only responders, we are overestimating or inflating the effect of attorney representation.
31This difference probably results from SSA’s systematic exclusion of cases that are appealed to the Appeals Council from the enhanced data. According to attorneys that represent SSA claimants, attorneys usually advise claimants who are denied at the ALJ level to appeal to the Appeals Council. Therefore, claimants who are denied at the ALJ level and appeal to the Appeals Council are likely to have higher rates of attorney representation than claimants who are denied at the ALJ level and do not appeal.
Page 52 GAO-04-14 SSA Disability Decision Making

Appendix I: Scope and Methods
Table 10: Effect of Attorney Representation on ALJ Decisions for Responders and Nonresponders
Odds of Observed odds Ratio of odds Attorney representation Allowed Denied allowance ratio of allowance ratios
Responder
Has attorney 71,259 36,092 1.97 2.88
No attorney 17,442 25,427 0.69
Nonresponder
Has attorney 325,249 196,796 1.65 1.90
No attorney 87,825 101,085 0.87
Source: GAO analysis of weighted CCS data.
A precise estimate of how greatly the size of the effect of attorney representation is inflated by nonresponse would require complete information about nonresponders, which we lack. Our best estimate without more complete information on nonresponders is that the actual effect of attorney representation in our sample of responders is higher than in the entire sample (including responders and nonresponders), by a factor of about 1.4. (See table 11.)
Table 11: Effect of Attorney Representation on ALJ Decisions for Responders and the Entire Sample
Odds of Observed odds Ratio of odds Attorney representation Allowed Denied allowance ratio of allowance ratios
Responder
Has attorney 71,259 36,092 1.97 2.88
No attorney 17,442 25,427 0.69
Entire Sample
Has attorney 396,508 232,888 1.70 2.05
No attorney 105,267 126,512 0.83
Source: GAO analysis of weighted CCS data.
In order to determine the extent to which this overestimation affects our finding that African-American claimants without attorneys were less likely to be allowed than white claimants without attorneys, we compared the effect of attorney representation on allowance decisions for responders and nonresponders by race. As shown in table 12, among African-Americans claimants, the observed odds ratio for responders with attorneys versus responders without attorneys is 3.40 (in other words, the odds of allowance for responders with attorneys were 3.40 times higher than the odds of allowance for responders without attorneys), whereas the
Page 53 GAO-04-14 SSA Disability Decision Making
1.51
1.41
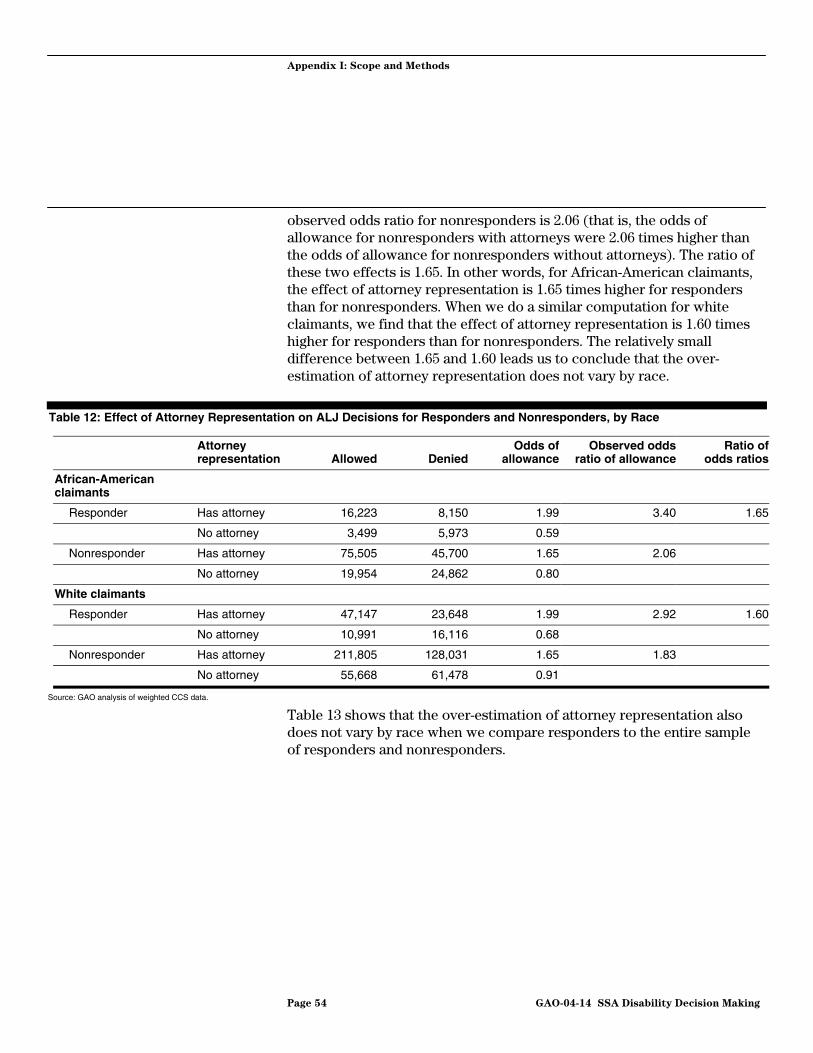
Appendix I: Scope and Methods
observed odds ratio for nonresponders is 2.06 (that is, the odds of allowance for nonresponders with attorneys were 2.06 times higher than the odds of allowance for nonresponders without attorneys). The ratio of these two effects is 1.65. In other words, for African-American claimants, the effect of attorney representation is 1.65 times higher for responders than for nonresponders. When we do a similar computation for white claimants, we find that the effect of attorney representation is 1.60 times higher for responders than for nonresponders. The relatively small difference between 1.65 and 1.60 leads us to conclude that the over-estimation of attorney representation does not vary by race.
Table 12: Effect of Attorney Representation on ALJ Decisions for Responders and Nonresponders, by Race
Attorney Odds of Observed odds Ratio of representation Allowed Denied allowance ratio of allowance odds ratios
African-American claimants
Responder Has attorney 16,223 8,150 1.99 3.40
No attorney 3,499 5,973 0.59
Nonresponder Has attorney 75,505 45,700 1.65 2.06
No attorney 19,954 24,862 0.80
White claimants
Responder Has attorney 47,147 23,648 1.99 2.92
No attorney 10,991 16,116 0.68
Nonresponder Has attorney 211,805 128,031 1.65 1.83
No attorney 55,668 61,478 0.91
Source: GAO analysis of weighted CCS data.
Table 13 shows that the over-estimation of attorney representation also does not vary by race when we compare responders to the entire sample of responders and nonresponders.
Page 54 GAO-04-14 SSA Disability Decision Making
1.65
1.60

Appendix I: Scope and Methods
Table 13: Effect of Attorney Representation on ALJ Decisions for Responders and the Entire Sample by Race
Attorney Odds of Observed odds Ratio of representation Allowed Denied allowance ratio of allowance odds ratios
African-American claimants
Responder Has attorney 16,223 8,150 1.99 3.40
No attorney 3,499 5,973 0.59
Entire sample Has attorney 91,728 53,850 1.70 2.24
No attorney 23,453 30,835 0.76
White claimants
Responder Has attorney 47,147 23,648 1.99 2.92
No attorney 10,991 16,116 0.68
Entire sample Has attorney 258,952 151,679 1.71 1.99
No attorney 66,659 77,594 0.86
Source: GAO analysis of weighted CCS data.
Based on this analysis, we conclude that (1) our estimates of the effect of having an attorney on the likelihood to be allowed may be inflated, but (2) our estimates of the relative effects of attorney representation by race on the likelihood to be allowed should not be biased.
Oaxaca decomposition To further test whether differences in allowance rates between African-American and white claimants are the result of differences in their race or in other characteristics, we employed a statistical technique—the Oaxaca decomposition—that is commonly used in analyses of discrimination.32
The goal of this technique is to separate the difference in allowance rates between African-Americans and whites into two components: one that results from differences in characteristics between African-Americans and whites and the second that results from differential treatment by race.
Several steps were taken to develop the results for our final Oaxaca decomposition analysis:
• First, we estimated two versions of our baseline model—one with only the African-American claimants in the sample and one with only the white claimants in the sample. This step provided us with two sets of estimated
32For details on this technique see “Male-Female Wage Differentials in Urban Labor Markets,” by Ronald Oaxaca, in International Economic Review, Volume 14, Issue 3 (Oct. 1973), 693-709.
Page 55 GAO-04-14 SSA Disability Decision Making
1.52
1.47

Appendix I: Scope and Methods
regression coefficients—one set of coefficients for African-Americans and the other set for whites.
• Second, we applied the estimated coefficients from the model for African-Americans to the values of each variable for African-Americans to produce a probability of allowance for African-Americans. We did the same with the estimated coefficients for whites and the values of each variable for whites to produce a probability of allowance for whites. These estimated probabilities of allowance are similar to the allowance rates for African-Americans and whites based on observed (or actual) data; but, because the probabilities are predicted, they deviate slightly from the observed allowance rates.
• Third, we used the coefficients from the model of whites and the actual values for each variable for African-Americans to produce a new probability of allowance. This probability reflects what the probability of allowance would have been for African-Americans had they been treated the same as whites in the allowance decision.
For our final Oaxaca decomposition analysis, we compared the results of the steps above. Specifically, we compared (1) the African-American probability of allowance predicted using the African-American model, with (2) the African-American probability of allowance predicted using the white model, with (3) the white probability of allowance predicted using the white model. To the extent that the African-American probability of allowance predicted using the white model departs from the white probability of allowance predicted using the white model, we can conclude that the difference between African-Americans and whites can be explained by differences in characteristics. To the extent that the African-American probability predicted using the white model departs from that predicted using the African-American model, we conclude that (1) the two models reflect different treatment of African-Americans and whites and (2) the difference between African-Americans and whites cannot be fully explained by differences in characteristics. We performed these analyses on (1) the entire sample of claimants, (2) the sample of claimants with attorney representation, and (3) the sample of claimants without attorney representation. Table 14 presents the results of these analyses for each sample.
Page 56 GAO-04-14 SSA Disability Decision Making
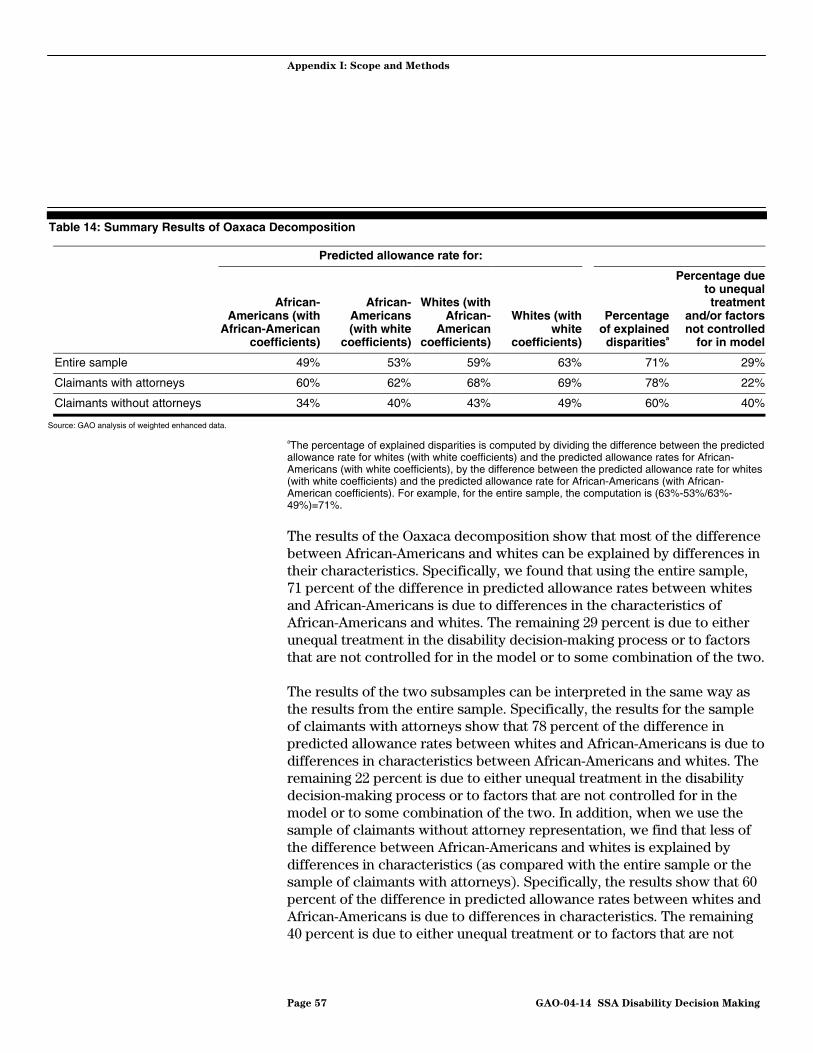
Appendix I: Scope and Methods
Table 14: Summary Results of Oaxaca Decomposition
Predicted allowance rate for:
Percentage due to unequal
African- African- Whites (with treatment Americans (with Americans African- Whites (with Percentage and/or factors
African-American (with white American white of explained not controlled coefficients) coefficients) coefficients) coefficients) disparitiesa for in model
Entire sample 49% 53% 59% 63% 71% 29%
Claimants with attorneys 60% 62% 68% 69% 78% 22%
Claimants without attorneys 34% 40% 43% 49% 60% 40%
Source: GAO analysis of weighted enhanced data.
aThe percentage of explained disparities is computed by dividing the difference between the predicted allowance rate for whites (with white coefficients) and the predicted allowance rates for African-Americans (with white coefficients), by the difference between the predicted allowance rate for whites (with white coefficients) and the predicted allowance rate for African-Americans (with African-American coefficients). For example, for the entire sample, the computation is (63%-53%/63%-49%)=71%.
The results of the Oaxaca decomposition show that most of the difference between African-Americans and whites can be explained by differences in their characteristics. Specifically, we found that using the entire sample, 71 percent of the difference in predicted allowance rates between whites and African-Americans is due to differences in the characteristics of African-Americans and whites. The remaining 29 percent is due to either unequal treatment in the disability decision-making process or to factors that are not controlled for in the model or to some combination of the two.
The results of the two subsamples can be interpreted in the same way as the results from the entire sample. Specifically, the results for the sample of claimants with attorneys show that 78 percent of the difference in predicted allowance rates between whites and African-Americans is due to differences in characteristics between African-Americans and whites. The remaining 22 percent is due to either unequal treatment in the disability decision-making process or to factors that are not controlled for in the model or to some combination of the two. In addition, when we use the sample of claimants without attorney representation, we find that less of the difference between African-Americans and whites is explained by differences in characteristics (as compared with the entire sample or the sample of claimants with attorneys). Specifically, the results show that 60 percent of the difference in predicted allowance rates between whites and African-Americans is due to differences in characteristics. The remaining 40 percent is due to either unequal treatment or to factors that are not
Page 57 GAO-04-14 SSA Disability Decision Making
Appendix I: Scope and Methods
Section 5: Limitations of Analysis
controlled for in the model or to some combination of the two. The results of this technique buttress the conclusions we draw from our final model, that is, among claimants without attorney representation, substantial differences between African-Americans and whites cannot be explained by differences in other factors.
Due to inherent limitations with our data and methods, we cannot definitively determine whether unexplained differences in allowance rates by race are due to unequal treatment during the decision-making process.
First, many of the variables we used in our analyses had some degree of measurement error, and this can be a potentially serious problem when continuous variables are redefined and collapsed into categorical variables. For example, the severity of the claimant’s impairments ranges along a very broad continuum. However, the data available for these analyses rank the severity of claimant’s impairments and place them in a limited number of categories. Within a particular category, however, there may be subtle and important variations in severity that are completely unmeasured. Second, some variables were measured imprecisely. For example, the earnings variable was derived using the average of employment income earned by the claimant during the 5 years previous to the hearings decision. This earnings variable did not include investment income or earnings from other family members. Hence, it does not necessarily reflect the claimant’s total household income, data that were not available.
Third, several factors, for which data were not available, could not be controlled for in our model. For example, we were unable to control for the extent to which claimants may differ in their access to and quality of healthcare. Differences in access to and quality of healthcare are reflected in, and thus related to, the quality of medical evidence in the claimant’s file—an important component of the decision-making process. Credibility is also a key factor in the ALJ disability decision-making process. However, we did not include a proxy for credibility in our model because we did not have an independent assessment of the claimant’s credibility.33
33The original ALJ’s assessment of the claimant’s credibility cannot be used as an independent variable because it is too highly correlated with the final allowance decision and could distort other results in our model.
Page 58 GAO-04-14 SSA Disability Decision Making

Appendix I: Scope and Methods
Finally, the choice of whether or not to appeal has a theoretical potential to affect the analysis. However, due to a lack of data at the initial level, we were unable to estimate, or control for, the claimant’s likelihood of appealing to the ALJ level.
Improving the precision of some of the variables that were included in our model and including additional variables to control for other factors might have improved our ability to account for the variation in ALJ decisions. Although these limitations could have resulted in biased estimates of our coefficients, the enhanced data we used were the best data available for examining potential racial disparities in ALJ disability decision making.
Page 59 GAO-04-14 SSA Disability Decision Making

Appendix II: SSA’s Five-Step Sequential Evaluation Process for Determining Disability
SSA’s regulations provide for disability evaluation under a procedure known as the “sequential evaluation process.” For adult claimants, this process requires a sequential review of the claimant’s current work activity, the severity of his or her impairment(s), and if necessary, the claimant’s residual functional capacity, his or her past work, and his or her age, education, and work experience.1
Step 1. Is the claimant working? If the claimant is working and the claimant’s average monthly countable earnings are above the substantial gainful activity (SGA) level,2 SSA will find the claimant not disabled, regardless of the claimant’s medical condition, age, education, and work experience, and deny the claim. If the claimant’s average monthly countable earnings are at or less than the SGA level, SSA will look at the claimant’s medical condition (step 2).
Step 2. Is the claimant’s condition “severe?” The claimant’s impairment must significantly limit his or her physical or mental ability to do basic work activities, such as walking, sitting, seeing, and remembering. If it does not, SSA will deny the claim, regardless of the claimant’s age, education, and work experience. If it does, SSA will look further at the claimant’s medical condition (step 3).
Step 3. Is the claimant’s medical condition in the list of “disabling”
impairments? If the claimant has an impairment that meets the duration requirement and is on SSA’s listing of impairments,3 the claimant is considered “disabled” without considering age, education, and work experience. If the medical condition is not on the list, SSA considers
1For children applying for SSI, the process requires sequential review of the child’s current work activity (if any), the severity of his or her impairment(s), and an assessment of whether his or her impairment(s) results in marked and severe functional limitations.
2The 2003 SGA level for claimants who are not blind is $800. The 2003 SGA level for persons who are blind is $1,330.
3SSA’s Listing of Impairments describes, for each major body system, impairments that are considered severe enough to prevent an adult person from doing any gainful activity (or in the case of children under age 18 applying for SSI, cause marked and severe functional limitations). Most of the listed impairments are permanent or expected to result in death, or a specific statement of duration is made. For all others, the evidence must show that the impairment has lasted or is expected to last for a continuous period of at least 12 months. The criteria in the Listing of Impairments are applicable to evaluation of claims for disability benefits under both the Social Security DI and SSI programs.
Page 60 GAO-04-14 SSA Disability Decision Making

Appendix II: SSA’s Five-Step Sequential
Evaluation Process for Determining Disability
whether the condition is of equal severity to an impairment on SSA’s list. If so, the claim is approved. If not, SSA considers additional factors (step 4).
Step 4. Can the claimant perform past relevant work? If the medical condition is severe, but not at the same or equal severity as an impairment on SSA’s list, then SSA will review the claimant’s residual functional capacity, and the physical and mental demands of work performed in the past. If the claimant can do work performed previously, SSA will deny the claim. If not, SSA considers other factors (step 5).
Step 5. Can the claimant perform other types of work? If the claimant cannot perform past work, SSA will consider the claimant’s residual function capacity, age, education, and past work experience to determine whether he or she can perform other work that is available in the national economy. If the claimant cannot perform other work, SSA will approve the claim. If the claimant can perform other work, SSA will deny the claim.
Page 61 GAO-04-14 SSA Disability Decision Making
Appendix III: Comments from the Social Security Administration
Page 62 GAO-04-14 SSA Disability Decision Making

Appendix III: Comments from the Social Security Administration
Page 63 GAO-04-14 SSA Disability Decision Making

Appendix III: Comments from the Social Security Administration
Page 64 GAO-04-14 SSA Disability Decision Making

Appendix III: Comments from the Social Security Administration
Page 65 GAO-04-14 SSA Disability Decision Making
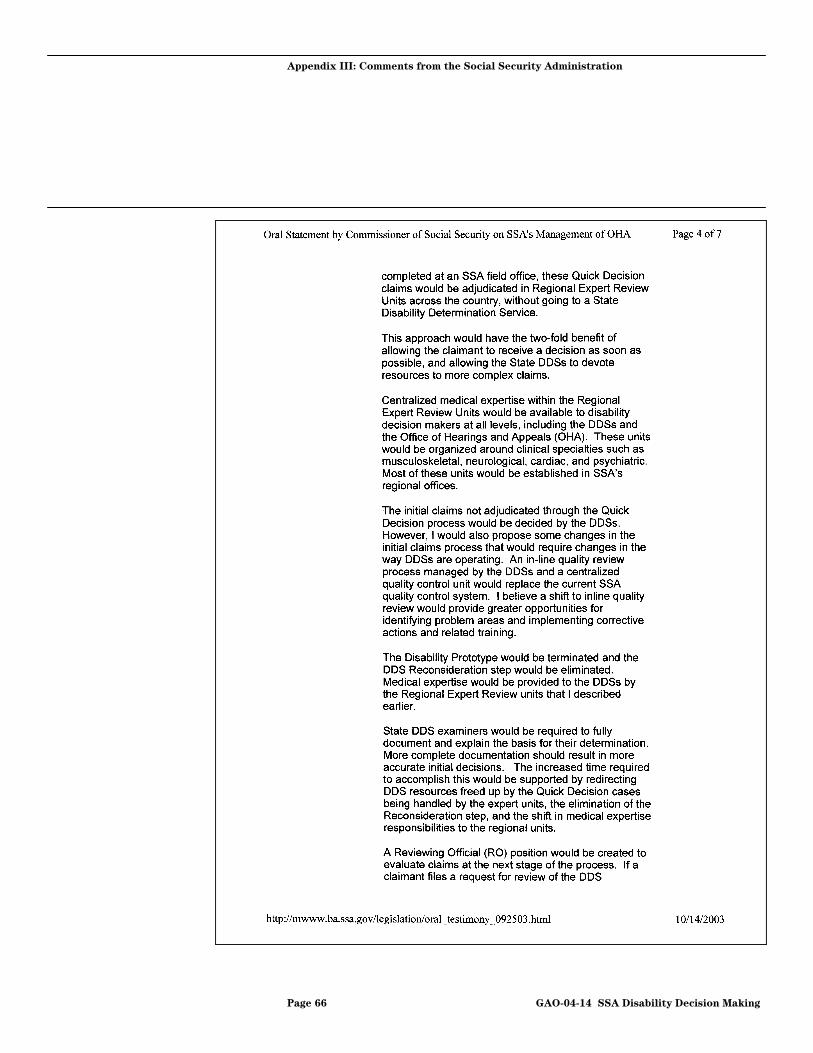
Appendix III: Comments from the Social Security Administration
Page 66 GAO-04-14 SSA Disability Decision Making

Appendix III: Comments from the Social Security Administration
Page 67 GAO-04-14 SSA Disability Decision Making
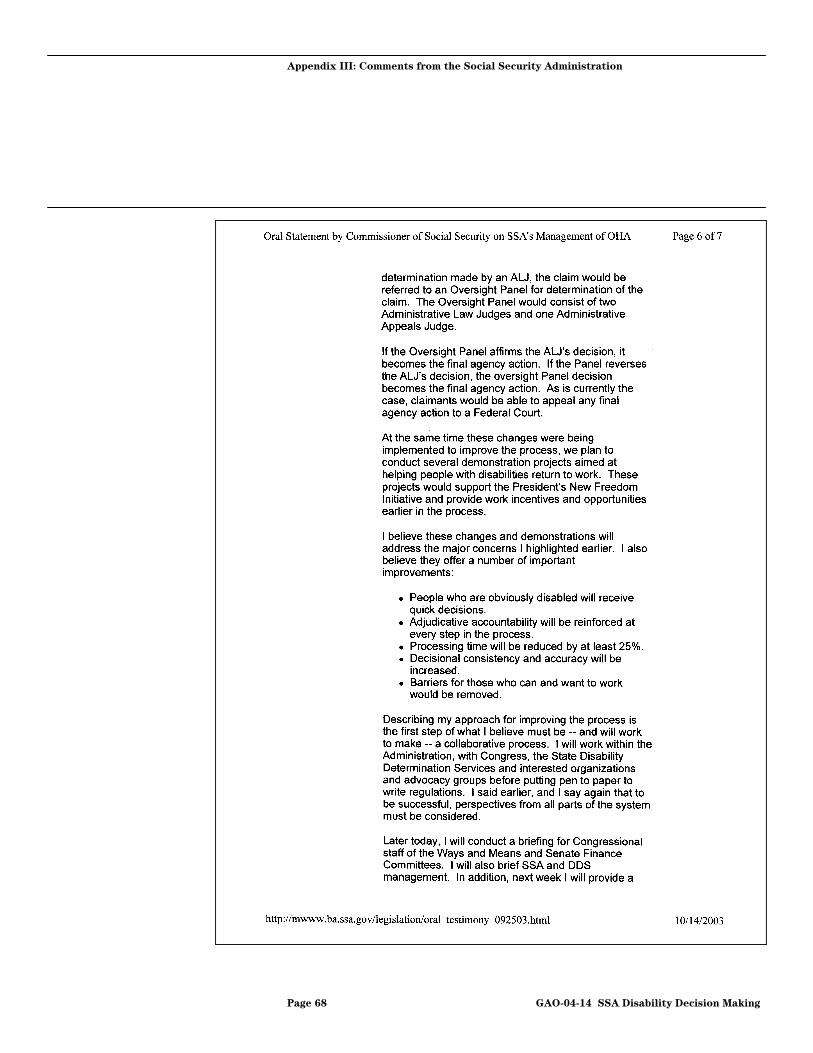
Appendix III: Comments from the Social Security Administration
Page 68 GAO-04-14 SSA Disability Decision Making

Appendix III: Comments from the Social Security Administration
This flowchart is printed on pages 70-72.
Page 69 GAO-04-14 SSA Disability Decision Making

Appendix III: Comments from the Social Security Administration
Page 70 GAO-04-14 SSA Disability Decision Making

Appendix III: Comments from the Social Security Administration
Page 71 GAO-04-14 SSA Disability Decision Making

Appendix III: Comments from the Social Security Administration
Page 72 GAO-04-14 SSA Disability Decision Making

(130198)
Appendix IV: GAO Contacts and Acknowledgments
GAO Contacts
GAO Acknowledgments
Robert E. Robertson, (202) 512-7215 Carol Dawn Petersen, (202) 512-7215
In addition to those named above, the following GAO staff made significant contributions to this report: Mark de la Rosa, Erin Godtland, Michele Grgich, Stephen S. Langley III, and Ann T. Walker, Education, Workforce, and Income Security Issues; Doug Sloane, Applied Research and Methods. Also contributing to the report were: Gene Kuehneman andJill Yost, Education, Workforce, and Income Security Issues; Jessica Botsford, Richard Burkard, David Plocher, and Dayna Shah, General Counsel; Wendy Turenne and Shana Wallace, Applied Research and Methods; Scott Farrow, Chief Economist; Robert Parker, Chief Statistician; Ron Stroman, Office of Opportunity and Inclusion.
Other Acknowledgments
(130198)
We contracted with the following individuals for technical assistance:
• Judith Hellerstein, Associate Professor of Economics, Department of Economics, University of Maryland.
• Joseph Kadane, University Professor and Professor of Statistics and Social Sciences, Department of Statistics, Carnegie-Mellon University.
• Brent Kreider, Associate Professor of Economics, Department of Economics, Iowa State University.
• Kajal Lahiri, Professor of Economics, and Professor of Health Policy, Management and Behavior, Department of Economics, University at Albany, State University of New York.
Page 73 GAO-04-14 SSA Disability Decision Making
GAO’s Mission
Obtaining Copies of GAO Reports and Testimony
The General Accounting Office, the audit, evaluation and investigative arm of Congress, exists to support Congress in meeting its constitutional responsibilities and to help improve the performance and accountability of the federal government for the American people. GAO examines the use of public funds; evaluates federal programs and policies; and provides analyses, recommendations, and other assistance to help Congress make informed oversight, policy, and funding decisions. GAO’s commitment to good government is reflected in its core values of accountability, integrity, and reliability.
The fastest and easiest way to obtain copies of GAO documents at no cost is through the Internet. GAO’s Web site (www.gao.gov) contains abstracts and full-text files of current reports and testimony and an expanding archive of older products. The Web site features a search engine to help you locate documents using key words and phrases. You can print these documents in their entirety, including charts and other graphics.
Each day, GAO issues a list of newly released reports, testimony, and correspondence. GAO posts this list, known as “Today’s Reports,” on its Web site daily. The list contains links to the full-text document files. To have GAO e-mail this list to you every afternoon, go to www.gao.gov and select “Subscribe to e-mail alerts” under the “Order GAO Products” heading.
Order by Mail or Phone The first copy of each printed report is free. Additional copies are $2 each. A check or money order should be made out to the Superintendent of Documents. GAO also accepts VISA and Mastercard. Orders for 100 or more copies mailed to a single address are discounted 25 percent. Orders should be sent to:
U.S. General Accounting Office 441 G Street NW, Room LM Washington, D.C. 20548
To order by Phone: Voice: (202) 512-6000 TDD: (202) 512-2537 Fax: (202) 512-6061
Contact:To Report Fraud, Web site: www.gao.gov/fraudnet/fraudnet.htmWaste, and Abuse in E-mail: [email protected]
Federal Programs Automated answering system: (800) 424-5454 or (202) 512-7470
Jeff Nelligan, Managing Director, [email protected] (202) 512-4800Public Affairs U.S. General Accounting Office, 441 G Street NW, Room 7149 Washington, D.C. 20548