gangasource: aiyar, india today (new delhi), 9 june 2003 urban water privatisation is divorced from...
TRANSCRIPT

GangaCommon Heritage or
Corporate Commodity?
VANDANA SHIVA
KUNWAR JALEES
NAVDANYA/RFSTEA-60, Hauz Khas, New Delhi - 110 016

Ganga:Common Heritage or Corporate Commodity?
© Navdanya, 2003
Published by
NavdanyaA-60, Hauz Khas,New Delhi - 110 016INDIA
Tel. : 0091-11-26853772, 26532460Fax : 0091-11-2685 6795Email : [email protected]
Printed by
Systems Vision, A-199 Okhla Phase- INew Delhi - 110 020

Contents
I INTRODUCTION................................................................................................ 1
II SACRED GANGA .............................................................................................. 6
III THE GANGA RIVER BASIN ........................................................................... 13
IV PRIVATIZATION OF GANGA ......................................................................... 19
V TEHRI DAM PROJECT ..................................................................................... 25
VI THE UPPER GANGA CANAL ........................................................................ 37
VII WATER PRIVATISATION .................................................................................. 42
WTO and Water .................................................................................... 45
Externally Aided Projects in UrbanWater Supply and Sanitation in India ............................................. 46
Some Myths and Reality ..................................................................... 46
Elements of Water Supply Privatisation .......................................... 49
Bolivian Experience in Water Privatisation ..................................... 49
Failure of Water Privatisation in Manila ......................................... 51
Indian Experience: Agitation in Sivaganga ..................................... 52
Water Privatisation in Palakkad District of Kerala ....................... 52
Privatisation of water: The Tiruppur Case ..................................... 53
VIII A PUBLIC FULL COST RECOVERY CAMPAIGN:THE DEBT SUEZ OWES THE PEOPLE OF INDIA .................................... 56
References ............................................................................................................. 58
Appendices ........................................................................................................... 60

1
.....................................................................................................................................
Water has become the biggest problem of 21st
century. People died in India during therecent past, crying for water. And the problem isworsening day by day.
Global consumption of freshwater increased sixfold during 1900-95, at a faster rate greater thantwice the rate of population growth. And ifpresent trend continues, two out of every threepeople on earth will have to live in water stressedcondition by the year 2025. A recent World WaterDevelopment Report corroborates this. About 20per cent of the world’s population do not haveaccess to safe drinking water and 40 per cent donot have sufficient water for adequate living andhygiene. The report expects that by 2050, waterscarcity will affect 2 to 7 billion people out of total9.3 billion, depending on factors like populationgrowth and measures taken by political leaders totackle the crisis. The report also found that morethan 2.2 million people die each year fromdiseases related to contaminated drinking waterand poor living conditions, faced with waterscarcity (Baxi and Sharma, 2003).
If we have to halve the number of people withoutaccess to safe water and sanitation by 2015, theworld will have to spend up to $180 billionannually, more than double that is spent today(Toepfer, 2003).
As for India, the problem is more acute, as the
population growth is spurring a demographicchange, especially as towns become cities andcities become mega cities. This can be seen fromthe fact that the 23 million-plus cities in India in1990 grew to 42 in 2000 and are expected to growto 63 by 2010. Also, there are serious concerns onthe availability of freshwater, as India with 16 percent of the world’s population has only 2.45 percent of the world’s land resources and 4 per centof the fresh water resources. The per capitaavailability of fresh water in the country hasdropped from an acceptable 5,177 cubic metres in1951 to 1,820 cubic metres in 2001. It is estimatedthat it would further decline to 1,341 cubic metresby 2025 and 1,140 cubic metres by 2050 (table 1.1).This is alarming as the threshold per capita valuefor water stress is 1,000 cubic metres. Total wateravailability is 1,122 billion cubic metres as shownin table 1.2.
India ranks a poor 120 in a list of 122 countriesranked for their water quality as also their abilityand commitments to improving its quality, in aWorld Water Development Report. In terms ofwater availability, India has not fared well.She is ranked lowly 133 in a list of 180 countries.India’s neighbours, Bangladesh, Sri Lanka,Nepal and Pakistan have fared better thanIndia, occupying the 40th, 64th, 78th and 80th slotsrespectively (The Indian Express, New Delhi,6 March 2003).
I
INTRODUCTION

2
.....................................................................................................................................
quantum of freshwater. Due to water shortage,over 200 million people are vulnerable to waterwars. In Neemuch (Madhya Pradesh), oneperson was killed and six injured in May 2003,when people fought for water with swords andknives. Such sporadic incidents could becomeroutine.
Table 1.3: Need and Shortfall of Water in12 Major Cities
City Need (million Shortfall (millionlitres/day) litres/day)
Delhi 3,830 880
Lucknow 560 120
Kolkata 2,258 690
Jaipur 349 313
Jabalpur 239 945
Bhopal 335 70
Indore 318 134
Visakhapatnam 305 146
Mumbai 4,000 1,030
Hyderabad 956 186
Chennai 300 105
Bangalore 840 135
Source: Aiyar, India Today (New Delhi), 9 June 2003
Urban water privatisation is divorced from reality.It is obvious that the privatisation protagonistsforgot to take into consideration the myriadcomplexities of the India’s Water ManagementSystem that are deeply embedded in the country’ssociety, politics and economy.
According to Prof. A. V. Vaidyanathan, waterexpert with Madras Institute of DevelopmentStudies in Chennai: “It is not correct to describewater as a commodity. It is a public utility whichcan be priced, but within certain socio-economicparameters.”
However, Municipal Corporations under thepressure of privatisation lobby have proposed ahuge tariff hike (table 1.4). For Delhi, the watercost will increase manyfold.
Contrary to popular perception, water shortage isnot just an urban problem but is, in fact, worse in
India’s population, recording a current annualincrease by 15.5 million, has to inevitably face thegreatest challenge of conservation and equitabledistribution of the limited freshwater resources.And its management is inextricably intertwinedwith future growth and poverty alleviation.
Table 1.1: Population Growth and Per CapitaWater Availability
Year Population Per Capita Water(million) Availability (cubic metres)
1951 361 5,177
1955 395 4,732
1991 846 2,209
2001 1,027 1,820
2025 1,394 1,341
2050 1,640 1,140
Source: Ministry of Water Resources, Government of India
Table 1.2: National Water Resources Potential
Precipitation 4,000 BCM
Average Rim-off in rivers 1,869 BCM
Utilizable Surface Water 690 BCM
Replenishable ground water 432 BCM
Total Water Availability 1,122 BCM
Irrigation Potential 140 million hectares
Hydropower Potential (L) 84,000 MW @ 60per cent
Source: Ministry of Water Resources, Government of India
Water is the biggest crisis facing India in terms ofspread and severity, affecting one in every threepersons. Even in Chennai, Bangalore, Shimla andDelhi, water is being rationed and India’s foodsecurity is under threat. With the lives andlivelihood of millions at risk, urban India isscreaming for water. For instance, water is rationedtwice a week in Bangalore, and for 30 minutes aday in Bhopal; 250 tankers make 2,250 trips toquench Chennai’s thirst. Mumbai routinely livesthrough water cuts from January to June, whensome areas get water once in three days inHyderabad (Aiyar, 2003).
As shown in table 1.3, a study of 12 majorcities reveals that they do not get the required

3
.....................................................................................................................................
Table 1.4: Privatisation of Water to Spawn a SteepTariff Hike
City Current Tariff Likely Extra(Rs/kl) Burden (Rs/kl)
Hyderabad 6.00 4.00
Kolkata 3.00 7.00
Surat 2.00 8.00
Tiruppur 5.00 5.00
New Delhi 0.35 9.65
Mumbai 4.00 6.00
Bangalore 6.50 3.50
Source: Down to Earth, New Delhi, 15 September 2002
rural India. And as basins and rivers dry up, it alsothreatens the country’s food security. According tothe data available with the Ministry of WaterResources, eight of the 20 river basins are waterdeficit, threatening the lives and livelihoods ofover 200 million people.
Water precedes roti, kapada aur makan. The peopleof Antarnesh in Patan district of Gujarat stillremember the pitiful sight of an eight-year old girldying of thirst. Women had gone to collect gumfrom the trees. The child was thirsty but there wasno water to give. The water source was 6 kmsaway. She died crying for water (Saksena, 2003).
According to Shabana Azmi, the actress andnominated Member of Parliament, when thegovernment social programme ran into a fierceopposition from the women, an NGO was calledto break the impasse. When asked by the NGO,‘what was their biggest problem?’ all the womenin one voice said “water.” It turned out that theyhad to walk miles for water because their handpumps had broken down and the men of thevillages could not repair it (D’ Monte, 2003).
Indeed, judicious use is what is needed. Also inmany areas, it is not how to save more water, buthow not to waste water. In urban India, 12 to 15litres of water is flushed per use. Experts believeit should not be more than 5 litres as practised insome western countries. Per household use ofwater should be brought down drastically. Alsowhat is needed immediately is to find out new
cropping patterns to save water. For instance, riceand sugarcane are high water intensive crops andwe must look for alternatives.
Besides the management of water supply, there isalso the need for technology to increase efficiency.It is time India should shift from the concept ofyield per hectare to yield per cubic metre of water.
According to Ashok Khosla, president of theNGO, Development Alternatives, demandmanagement now means “redesigning andrestructure demand” to suit the emerging pictureof need and availability. Should Andhra Pradeshgrow paddy? Is sugarcane the right crop forMarathwada (Khosla, 2003)?
The National Water Policy passed in 2002 alsoaddresses some of the concerns of the three mainstakeholders (rural, urban and industrial) andidentifies measures for developing and conservingthe nation’s water resources. In fact, to increaseand optimise water availability in agriculture, itis important to use it optimally by adoptingmethods like water harvesting and rechargingand recycling of water. Therefore, adopting moderntechniques like deep and sprinkler irrigationwould enable efficient utilization of the availablewater.
Water conservation programmes need to beinitiated to generate awareness on conservationmethodology by involving local communities.Industries also need to be encouraged to adopt thelatest technologies available for effluent treatment.In urban areas, much water is lost due to technicallosses by public water utilities.
About 70 per cent of the world’s water is used forgrowing crops. The agricultural sector in India isthe single largest user of water resourcesaccounting for as much as 80 per cent of the totalannual withdrawals. With India having the highestirrigated area in the world at 55.14 million hectare,out of total 255.46 million hectare, there is anurgent need for the efficient use of the availablewater resources. Also, as the population increases,there will be greater need for augmenting foodproduction to achieve food security, and this in

4
.....................................................................................................................................
turn will put greater pressure on water supply forirrigation.
Looking 30 years into the future, FAO estimatedthat feeding the world’s population would require60 per cent more food. Most of this increase willhave to come from intensified agriculture,supported by irrigation. But water is alreadyscarce in many countries and competition forwater from industrial and domestic users continuesto grow.
In irrigation, it is estimated that more than 60 percent of the water seep from the distributionchannels and are lost by evaporation. Moreover,seepage causes water logging and salinisation inirrigated lands, resulting in significant reductionof crop yield. And also, the rainfall shows greatvariation, unequal seasonal distribution as well asunequal geographical distribution and frequentdepartures from the normal. As much as 21 percent of the area of the country receive less than750 mm of rain annually, while 15 per cent receiverainfall in excess of 1500 mm. Annual rainfall ofless than 500 mm is experienced in WesternRajasthan and adjoining parts of Gujarat, Haryanaand Punjab. This shows the need for undertakingthe measures, which are water prudent.
Groundwater today supplies as much as 80 percent of the domestic water supply in rural areasand around 50 per cent of the urban and industrialneeds. As per estimates, over 70 per cent of thevalue of irrigated products could depend onground water resources. Groundwater is said tocontribute 51 per cent of the irrigation potentialcreated in the country through more than fourmillion dug wells, five million shallow tube wellsand some nine thousand public tube wells. Theover exploitation of ground water is leading to adrop in ground water levels in many parts of thecountry.
According to forecasts by the Ministry of WaterResources and presentations by the Ministry ofAgriculture, 11 river basins including the Gangawill be water deficit by 2025, threatening 900million lives. The symptoms are already visible.Tungabhadra river, fed by the high rainfall
catchment area of the Sahayadri range, has alreadygone dry, but is not yet put on the list of deficitbasins.
Instead of focusing on long-term solutions, everygovernment has found it easier to allowexploitation of groundwater. While for thegovernment it meant less investment, for thefarmer it was free water to irrigate his land. True,India’s food security was propelled by the “tubewell revolution,” but it led to long-term damageas the pump culture has wrought havoc on thehydrological cycle. Groundwater levels haveplunged in 206 districts in the country. NineStates, including Rajasthan, Maharashtra, Gujarat,Haryana, Karnataka and Punjab, are facing majorwater deficits, where demand exceeds supply.With 3.5 million hand pumps and 56 lakh tubewells in operations, pumping of undergroundwater is now nearly double the rate of aquiferrecharge from rainfall.
Industrial sector alleges that agriculture consumeswater most inefficiently; however, as illustrated intables 1.5, 1.6 and 1.7, the industry is not leftbehind in the misuse of water. Not only this,industry pays a pittance for the water (Bhushan,2003).
Table 1.5: Industrial Use of Water
Sectors Water Proportionconsumed consumed
(MLD) (per cent)
Thermal Power Plants 82,194 87.87
Engineering 4,722 5.05
Pulp and paper 2,118 2.26
Textiles (cotton) 1,940 2.07
Iron and steel 1,208 1.29
Sugar 509 0.54
Fertilizers 456 0.49
Distilleries 172 0.18
Organic chemicals 114 0.12
Others 111 0.12
Source: Central Pollution Control Board and Ministry of Environment
and Forests (2002): Water Quality in India – Status and Trends(1990-2001)

5
.....................................................................................................................................
In India, of all the categories of water use,industrial water use is rising fastest. According tothe Central Pollution Control Board (CPCB),water consumption by industry accounts forabout 8 per cent of the total national use. By 2050,industry will need almost four times the currentwater use of industry.
Industry’s use of water acts as a double-edgedsword: by putting immense pressure on localwater resources on one hand, and by devastatingenvironment through wastewater discharges on
the other. Essentially used as input, mass and heattransfer media and for other miscellaneouspurposes, a very small fraction of the water isactually consumed. About 90 per cent of the waterused in major water-consuming industries isultimately discharged as wastewater. Accordingto the CPCB, Indian Industry consumed 40 km3 ofwater and discharged 30.31 km3 of wastewater in2001.
Industry doesn’t only use up a huge amount ofwater; it does so in an extremely inefficientmanner. Compared to globally acceptablestandards, the water consumption efficiency (waterconsumed to produce a unit product) of Indianindustry is dismal (table 1.6). Thermal powerplants are the major consumers, accounting for astaggering 88 per cent of the total water consumedby industry (table 1.5). In a scenario where theavailability of water is dipping alarmingly, this isa recipe for disaster.
One of the main reasons that Indian industrywastes water wilfully is because it costs almostnothing. Companies pay a ridiculous 10 paise for1,000 litres of water, while people in some citiesend up paying Rs.10 to 50 for the same quantity.Recently, the government amended the Water(Prevention and Control of Pollution) Cess Act,1977 and introduced a revised water cess forindustry. The revised cost of water is still so lowthat it is imbecilic to expect industry to be pushedby it to improve its water-use efficiency.
T. R. Balu, Union Minister of Environment andForests, while presenting the Bill in Parliament,proclaimed that the new cess would augment theresources of Central and State Pollution ControlBoards, promote economy in the use of water, andstop its pollution by industries. The new rates,explained Mr. Balu, are about three times higherthan the existing rates. But as shown in table 1.7,industry pays a pittance; an increase of 1-15 paiseper 1,000 litres will not make any difference.
Table 1.6: Indian Industry as the InefficientConsumer
Sectors Average Water Global standardConsumption
Thermal power About 80 m3/MWh Less than 10m3/plant electricity MWh electricity
Textiles 200-250m3/tonne Less than 100 m3/cotton tonne cotton
Pulp and paper:i. Wood-based
mills 150-200m3/tonne 50-75m3/tonneii. Waste paper-
based mills 75-100m3/tonne 10-25 m3/tonne
Integrated iron 20-25 m3/tonne of 5 m3/tonne ofand steel plant finished product finished product
Source: Down to Earth (New Delhi), 15 June 2003, p. 28
Table 1.7: Industry Pays a Pittance
Water Consumed Old Rate New Rate
Industrial cooling, 5 paise/ 10 paise/spraying in mine kilolitre (kl) kilolitre (kl)pits or feeding boilers
Domestic purposes 2 paise/kl 3 paise/kl
Processing (waste waterwith biodegradable,non-toxic wastes) 10 paise/kl 20 paise/kl
Processing (waste waterwith non-biodegradable,toxic wastes) 15 paise/kl 30 paise/kl
Source: Ministry of Environment and Forests: Water (Preventionand Control of Pollution) Cess (Amendment) Act, 2003

6
.....................................................................................................................................
River systems have been the birthplace ofcivilization all over the world. They are
woven into the social and economic fabric ofsociety and penetrate deep into the psyche of thepeople living around them. Nowhere is this moreevident than in India where the Ganga, Indus,Narmada and other rivers possess the culturalidentity transmitted down the ages through oursacred literature, the Puranas and the Vedas, aswell as through popular myths and legends(Paranjpye, 1990).
The Ganga, most sacred and important river ofIndia, is regarded as the cradle of Indiancivilisation. In Bhagwad Gita, Lord Krishna says,“Amongst rivers I am the Ganga.” Several pilgrimcentres have existed on its banks for centuries.Millions take holy dip in the river during religiousfestivals, especially during the Kumbh celebrations(Mehta, 1993).
In the words of Valmiki, “Let the pure murmuringwaters of the Ganga, which removes evil, destroyssin, having pierced through the depth of theHimalayas, and flowing in waves to far distances,cleanse us ever.”
For Emperor Akbar, Ganga was “the water ofimmortality.” He had people stationed on thebanks of the river to dispatch water in sealed jarsto wherever he was.
Barring the period of Harappan civilization, theGanga basin shaped mythology, history and the
people of India. It was in this plain that the greatKingdoms of India, namely Guptas and Mughalsfound their home. It was in this region that thegreat religions of the world, Hinduism, Buddhism,Jainism and Sikhism were established.
Ganga or Ganges is perhaps the most widelywritten about and worshipped of all the renownedrivers throughout the world. Although a numberof rivers feature in human civilization in prehistoryand ancient history, Ganga is the most sacred andmythology related. The story of Ganga is the storyof Indian civilization and culture. It is the symbolof Indian traditions and values providing physicaland spiritual nourishment to millions of devotees.There are extensive classical and folk literaturesrelated to this heavenly river known by many asdivine river or “Devnadi.” Down the ages,people of all walks of life have worshipped thisgoddess of benevolence. There are a number oftemples, maths, ashrams and cities along Ganga,descending from Rishikesh, Haridwar, Allahabad(Prayag), to Benares (Varanasi) that developedthrough centuries of cultural development of ourcountry.
For millennia, Indian civilization has made theGanga its centre of activity. As the root of ancientcivilization in northern India, Ganga has beenintegrated from time immemorial into the canonof Hindu literature, finding her place in the greatepics, the Ramayana and the Mahabharata as wellas Puranic texts. Her hagiography varies from text
II
SACRED GANGA

7
.....................................................................................................................................
to text, but her most popular myth is the celebrationof her descent to earth to purify the souls of men.
In the popular version, the great king Sagara’ssixty thousand sons are burnt to ashes aspunishment for disturbing the meditation of thesage Kapila. Bhagiratha, son of Sagara, was ableto, through the heat of his austerities, propitiateGanga and she descended on the earth to purifyand wash away the ashes of Sagara’s sons andpurify their souls by washing away their misdeeds.Before arriving in this world, however, Lord Shivahad to act as a landing pad, for the strength of herfall would have been too great for this world toendure. Catching her in his matted locks, LordShiva mediated and tamed the flow of Gangafrom the heavens into this world. Thus, the riverrepresents a gateway to purify and absolution forthe believers of Hindu religion. In its flow can befound a means to heavenly ascent (Yadav, 2002).
Because the Ganga descends from heavens, she isa sacred bridge to the divine. The Ganga is a tirtha,a place for crossing over from one place to another.The Gangastothra-sata-namavali is an ode to theriver, and reveals the profound effect of the riverin India. The salute has 100 and odd sacred namesfor the river. The Ganga’s role as mediatorbetween this world and the divine is embodied indeath rituals among Hindus. The ashes of ourancestors and kin are immersed in the Ganga, sothat, like the sons of Sagar, they too will beensured a passage to the heavens (Shiva, 2002).
At an altitude of 10,500 feet stands the Gangotri,where a temple is dedicated to Mother Ganga,who is worshiped as both a sacred river and agoddess. The Bhagirath Shila, a stone upon whichKing Bhagirath supposedly meditated to bring theGanga to the earth, is situated a few steps from theGanga temple. The shrine opens every year onAkshaya Tritiye, which falls during the last week ofApril or the first week of May. On this day, farmersprepare to plant their new seeds. The Gangatemple closes on the day of Deepavali (Diwali),the festival of lights, and the shrine of the goddessGanga is then taken to Haridwar, Prayag andVaranasi.
Fourteen miles beyond Gangotri is Gaumukh, aglacier formed like the snout of a cow that givesrise to the Ganga. The Gaumukh glacier, which is24 kilometres in length and six to eight kilometresin width, is receding at a rate of 15 metres per year.The receding glacier of the Ganga, the lifeline formillions of people in the Gangetic plains, hasserious consequences for the future of India(Pandey, 2003).
It is “Ganga Ma” that is mother Ganga, as millionsof Indians address her, that mercifully providesfor the people each year with her swelling levelsas she sweeps through the principal cities ofnorthern India, such as Allahabad, where it joinsthe Yamuna river at a place called “sangam,”Varanasi, the oldest living city of the world, andPatna, the erstwhile Pataliputra, to name a few. Asthe river winds through the pastoral countrysideof Uttar Pradesh, Indians receive her with greatblessings and appreciation; village farmers benefitgreatly from the fertile silt and soil that the greatGanga brings along and leaves behind. Seasonal
Man performing last rites on the bank of Ganga

8
.....................................................................................................................................
flooding leaves small pools and lakes that arediverted to irrigate crops in an otherwise dry land.It is Ganga that gives life, renewal, and fertility tothe people of the Gangetic basin, one of the mostfertile and densely populated areas in the world.
Shri Veer Bhadra Mishra, a recognized mahant(high priest), as well as a professor of HydraulicEngineering at Benares Hindu University (BHU)at Varanasi founded the “Sankat MochanFoundation” to maintain the purity of Ganga. ShriMishra tells the devotees about the GoddessGanga, that their loved one is polluted and nolonger sacred. He knows that any policy andaction involving the Ganga must utilize andrecognize the religious idiom that constitutes theGanga for the rest of India. Western science andHinduism, along with local perceptions, must co-operate. Specialized research conducted byoutsiders must be balanced by localized responseand action. He illustrates the modern dilemma forHindus and their practices, as he observes: “Thereis a struggle and turmoil inside my heart. I want
to take a holy dip. I need it to live. The day doesnot begin for me without the holy dip. But, at thesame time, I know what is BOD and I know whatis fecal coliform.” He is also convinced thatscience and religion have to match if the Gangahas to be saved (Yadav, 2002).
The late Rajiv Gandhi, the then Prime Ministerwas moved, seeing the plight of Ganga. In hisinaugural speech on the occasion of launching ofthe ‘Ganga Action Plan’ at Varanasi on 14 June1986, he said: “The Ganga Action Plan is not justa government Plan. It has not been prepared forthe Public Works Department or the governmentofficial alone. It is a plan for all the people of India,in which they can come up forward and participate.It is up to us to clean the whole of the Ganga andrefrain from polluting it.”
Unfortunately what Rajiv Gandhi said did notprove to be true. Ganga Action Plan became thevictim of red tape-ism.
Ganga water has the unique property for
Women from the interior villages of Rajasthan arriving to take holy dip in Ganga

9
.....................................................................................................................................
purification, as the bacteria decompose everythingin Ganga ecosystem. The quality of river watergreatly depends upon the concentration andquality of bacteria. They cause efficient and rapiddisintegration of animal and plant tissues andother organic matter, introduced in the riversystem in the form of sewage, sullage andindustrial waste. Bacterial concentration of Gangawater varies with the organic load, season, watercontent, depth and nature of pollutants. Water inHimalayan ranges from Gangotri to Rishikesh haslower bacterial count, whereas in plains it ishighest in Kanpur followed by Varanasi.
Giving “Value” to Water
The worth of water rests on its role and functionas a life force for animals, plants and ecosystemsin communities where water is considered sacred.However, commodification of water reduces itsvalue only to its commercial value.
The water crisis results from an erroneousequation of value with monetary price. However,resources can often have very high value whilehaving no price. Sacred sites like sacred forestsand rivers are examples of resources that havevery high value but no price. Oceans, rivers, andother bodies of water have played important rolesas metaphors for our relationship to the divine.Diverse cultures have different value systemsthrough which the ethical, ecological, and economicbehaviour of society is guided and shaped.Similarly, the idea that life is sacred puts a highvalue on living systems and prevents theircommodification.
Protection of vital resources cannot be ensuredthrough market logic alone. It demands a recoveryof the sacred and a recovery of the commons. Andthese recoveries are happening. Lakhs of pilgrimsused to walk from villages across north India toHaridwar and Gangotri to collect Ganga water forShivratri, the birthday of God Shiva. Carryingkavads (yokes from which two jars of holy waterdangle and are never allowed to touch theground), the kavdias now number in the millions.Villages and towns put up free resting and eating
places along the entire pilgrimage route. Thebrightly decorated kavads containing Ganga waterare dedication to the sacred (Shiva, 2002).
No market economy could make millions walkhundreds of kilometres in the muggy heat ofAugust to bring the blessings of the sacred watersto their village. The 30 million devotees who wentto bathe in the sacred Ganga for the Kumbh Meladid not see the value of the water in terms of itsmarket price but in terms of its spiritual worth.States cannot force devotees to worship the watermarket.
Sacred waters carry us beyond the market placeinto a world charged with myths and stories,beliefs and devotion, culture and celebration. Weare all Sagar’s children, thirsting for water thatliberate and give us life – organically andspiritually. They struggle over the kumbh, betweenGods and demons, between those who protect andthose who destroy, between those who nurtureand those who exploit. Each of us has a role inshaping the creation of the future. Each of us isresponsible for the kumbh, the sacred water pot.
Water and religion are inextricably woven in thepattern of Indian life. One starts the day with aSurya Pranam, standing waist deep in water.Before marriage, womenfolk of the house go to thewater to make offerings. On birth of a child,offerings are made to the river; and on death oneis cremated on the bank of river (Maitra, 2003).
Sradh, performed in some of the special locationssuch as Haridwar and Varanasi absolves one of allmortal bonds with the world and enhancesMoksha. Similarly, it is believed that cremation onthe banks of Ganga and particularly at Manikarnikain Varanasi sends one to heaven. Such beliefs arestill very alive in the minds of Indian population,and disrespect to such beliefs is consideredsacrilegious.
Several religious festivals, Sankrantis, new moonand full moon days, eclipses, special poornimassuch as Kartik, Rush and Buddha drawphenomenal crowds to some of the towns on thebanks of the rivers. A dip in the river at these

10
.....................................................................................................................................
locations is considered holiest of the holy, and sois the desire of every Hindu to do the same.
According to Vedas, the fire at the ‘shamshanghat’ on the bank of Ganga in Varanasi has to keepburning always. As belief goes, Lord Shiva carriesfire inside his third eye. That is why the bodiesburnt at either Manikarnika ghat or the HarishChandra ghat is supposed to be relieved of anybondage whatsoever and the soul attains ‘Moksha’(Salvation), ticket to heaven. It is this belief, whichdrives the faithful to arrive, and hope to die hereonly.
According to Prof. Rana P. B. Singh of BHU, theGanga river front spreads in Varanasi over the arcline of 6.4 kms where lies 84 ghats between theconfluence of the Asi in the south and the Varunain the North. In arch-type connotation, each ghatrepresents one lakh organic species as describedin Hindu mythologies. Further, the 12 zodiac signsmultiplied by seven layers of atmosphere cometo 84. Thus the annual cycle of the cosmic journeyis complited with the sacred at the 84 ghats(Sen, 2000).
Prof. Rana also states: “There are 98 sacred waterfronts. These form the cosmic frame linking 14bhavana kosa of the human body and the sevenlayers between earth and the heaven, thus theproduct of 14 with seven comes to 98.”
Among the 84 ghats, five are considered moreauspicious. These are Asi, Dashashwamedha,Manikarnika, Panchganga and Adikeshava. Thesefive ghats, called panchatirthas are eulogised andare still popular sites to visit. These five ghatssymbolise the microcosmic body of Vishnu. Asi isthe head, Dashashwamedha the chest, Manikarnikathe navel, Panchganga the thighs and Adikeshavathe feet. This tells us that Vishnu first placed hisholy feet in Varanasi on the banks of Ganga, andthat is why the banks are said to symboliseVishnu’s body.
The river introduces a dynamic element in theurban-scape of a city, and thus pre-industrial citiesopened on to the river. Ghats (stepped platformsleading to water) facilitating safe access to water
became part of urban architecture in India,particularly at Varanasi where the architectureand activities of the people form an intricate weband provide a spectacular architectural form.
Due to the flat Indo-Gangetic terrain and the wideseasonal variation in flow pattern, the carriage ofthe river is very wide, and over the years thecourse of the river has shifted. Particularly Ganga’scourse has shifted considerably resulting inincrease of the distance between the river and thehuman settlements, and ghats at Kanpur andPatna have been rendered infructuous. Yamuna,on the other hand has a deeper carriage and ghatsat Mathura and Vrindavan provide rarearchitectural ensembles. Delhi, in Daniel’spaintings, depicts a close relation with the river,when it flowed along the walls of the Lal Quila(now removed by about ½ km). Some efforts havebeen made recently to create safe ghats in Haridwarduring Kumbh Mela where virtually new citieshave to be developed temporarily for a month orso, or for even a lesser period.
In the last few years, the Ganga has shifted itscourse away from Patna due to large-scalepollution and huge sand and soil deposits alongits banks. The Bihar government has embarkedupon an ambitious project to bring the Gangaback to the city. The 28 crores rupees projectinvolves digging three-metre deep and 40 metrewide trench along the nine km route of the riverfrom Digha to Mahendru.
Environmentalists had warned that the changedcourse of the river could spell ecological disasterfor the State, which has depended so much on itsince time immemorial. The residents of the cityhave been facing acute hardship due to thevanishing Ganga. They have to walk up to 4-5 kmsto cremate the bodies on the banks of the river. Thecity’s water level has also gone down, causingsevere water crisis in many locations.
Synonymy of the River Ganga
The river Ganga has acquired several synonyms.Following list of such names is taken from WaterWars written by Dr. Vandana Shiva (Shiva, 2002).

11
.....................................................................................................................................
No. Name Meaning
1 Ganga Ganga
2 Visnu-padabja-sambhuta Born from the lotus-like foot ofVishnu
3 Hara-vallabha Dear to Hara (Siva)
4 Himancalendra-tanaya Daughter of the Lord ofHimalaya
5 Giri-mandala-gamini Flowing through the mountaincountry
6 Tarakarati-janani Mother of the demon Taraka’senemy
7 Sagaratmaja-tarika Liberator of the 60,000 sons ofSagar who had been burnt toashes by the energy glance ofsage Kapila
8 Sarasvati-samayukta Joined to the river Sarasvati(said to have flowedunderground and joined theGanga at Allahabad)
9 Sughosa Melodious, Noisy
10 Sindhu-gamini Flowing to the ocean
11 Bhagirathi Pertaining to the saintBhagirath (whose prayersbrought the Ganga down fromheaven)
12 Bhagyavathi Happy, fortunate
13 Bhagiratha-rathanuga Following the chariot ofBhagirath (who led the Gangadown to purify the ashes ofSagara’s Sons)
14 Trivikaram-padoddhuta Falling from the foot of Vishnu
15 Trilka-patha-Gamini Flowing through the threeworlds (i.e., heaven, earth, andthe atmosphere or lowerregions)
16 Ksira-subhra White as milk
17 Bahu-ksira A cow which gives much milk
18 Ksira-vtksa-samakula Abode of “milk-trees,” i.e.,Naya-grodha (Banyan),Udumbara (glamorous figtree), and Madhuka (BassiaLatofolia)
19 Trilocana-jata-vasini Dwelling in the matted locksof Siva
20 Traya vimochini Releasing from the three debts,viz. 1. Brahma-carya (studyof the Vedas) to the Trilocana-traya-vimochini rishis, 2.Sacrifice to and worship of thegods 3. Procreation of a son
No. Name Meaning
21 Tripurari-siras-cuda The tuft on the head of theenemy of Tripura or Siva(Tripura was a triplefortification, built in sky, airand earth of gold, silver andiron respectively, by Maya forthe Asuras, and burnt by Siva)
22 Jahnavi Pertaining to Jahnu who drankup the Ganges in a rage afterit had flooded his sacrificialground, but relented, andallowed it to flow from his ear.
23 Nata-bhiti-hrt Carrying away fear
24 Avyaya Imperishable
25 Nayananda-dayini Giving delight to the eyes
26 Naga-putrika Daughter of the mountain
27 Niranjana Not painted with collyrium(i.e., colourless)
28 Nitya-suddha Eternally pure
29 Nira-jala-pariskrta Adorned with a net of water
30 Savitri Stimulator
31 Salila-vasa Dwelling the water-drops
32 Sagaranbusa-medhini Swelling the water of theocean
33 Ramya Delightful
34 Bindu-saras River made of water-drops
35 Avyakta Un-manifest, un-evolved
36 Vrndarka-samasrita Resort of the eminent
37 Uma-sapatni Having the same husband (i.e.,Siva) as Uma (Parvati)
38 Subhrangi Having beautiful limbs (orbody)
39 Srimati Beautiful, auspicious,illustrious
40 Dhavalambara Having a dazzling whitegarment
41 Akhandendu-vana-vasa Having Siva as a forestdweller (hermit)
42 Khandendu-drta-sekhara Having the crescent moon ascrest
43 Amrtakara-salila Whose water is of nectar
44 Lila-lamghita-parvata Leaping over mountains insport
45 Virinci-kalasa-vasa Dwelling in the water-pot ofBrahma (or Vishnu or Siva)
46 Triveni Triple-braided; Consisting ofthe water of three riversGanga, Yamuna, and Sarasvati
47 Trigunatmika Possessing the three gunas

12
.....................................................................................................................................
No. Name Meaning
48 Sangataghaugha-samani Destroying the mass of sins ofSangata
49 Sankha-dundubhi-nisvana Making a noise like a conch-shell and drum
50 Bhiti-hrt Carrying away fear
51 Bhagya janani Creating Happiness
52 Bhinna-brahmanda-darpini Taking pride in the broken eggof Brahma
53 Nandini Happy
54 Sighra-ga Swift-flowing
55 Siddha Prefect, holy
56 Saranya Yielding shelter, help orprotection
57 Sasi-sekhara Moon-crested
58 Sankari Belonging to Sankara (Siva)
59 Saphari-puran Full of fish (especially carp ofCyprinus Saphore, a kind ofbright little fish that glistenswhen darting about in shallowwater)
60 Bharga-murdha-krtalaya Having Bharga’s (Siva’s) headas an abode
61 Bhava-priya Dear to Bhava (Siva)
62 Satya-sandha-priya Dear to the faithful
63 Hamsa-svarupini Embodied in the forms ofswans
64 Bhagiratha-suta Daughter of Bhagiratha
65 Anatra Eternal
66 Sarac-candra-nibhanana Resembling the autumn moon
67 Om-kara-rupini Having the appearance ofsacred syllable,
Om
68 Atula Peerless
69 Krida-Kallola-karini Sportively billowing
70 Svarga-sopana-sarani Flowing like a staircase toHeaven
71 Sarva-deva-svarupini Embodies about thecontinuance of peace
72 Ambhah-prada Bestowing water
73 Duhkha-hantri Destroying Sorrow
74 Santi-santana-karini Bringing about the continuanceof peace
75 Daridrya-hantri Destroyer of poverty
76 Siva-da Bestowing happiness
77 Samsara-visa-nasini Destroying the poison ofillusion
No. Name Meaning
78 Prayaga-nilaya Having Prayaga (Allahabad) asan abode, name of the easternbranch of the four mythicalbranches
79 Sita “Furrow” heavenly angles,supposed to divide afterfalling on Mount Menu
80 Tapa-traya-vimocini Releasing from the ThreeAfflictions
81 Saranagata-dinarta-paritrana Protector of the sick andsuffering who come to you forrefuge
82 Sumukti-da Giving complete spiritualemancipation
83 Siddhi-yoga-nisevita Resorted to (for the acquisitionof success or magic powers)
84 Papa-hantri Destroyer of sin
85 Pavanangi Having a pure body
86 Parabrahma-svarupini Embodiment of the SupremeSpirit
87 Purna Full
88 Puratana Ancient
89 Punya Auspicious
90 Punya-da Bestowing merit
91 Punya-vahini Possessing or producing Merit
92 Pulomajarcita Worshipped by Indrani, wifeof Indra
93 Puta Pure
94 Puta-tribhuvana Purifier of the Three Worlds
95 Japa Muttering, Whispering
96 Jangama Moving, alive
97 Jangamadhara Support or substratum of whatlives or moves
98 Jala-rupa Consisting of water
99 Jagad-d-hita Friend of benefactor of whatlives or moves
100 Jahnu-putri Daughter of Jahnu
101 Jagan-matr Mother of what lives or moves
102 Jambu-dvipa-viharini Roaming about or relighting inRose-apple-tree Island (India)
103 Bhava-patni Wife of Bhava (Siva)
104 Bhisma-matr Mother of Bhisma
105 Siddha Holy
106 Ajnana-timira-bhanu A light amid the darkness ofignorance

13
.....................................................................................................................................
This section is based mostly on the booklet TheImpact of River Linking Project (Shiva and
Jalees, 2003).
Course of the River
Ganga river system along with tributaries is thesingle largest river system in India. The mightyriver emerges from Gaumukh in the 25 kms longGangotri glacier. The point of origin is shaped likethe mouth of cow, and hence the name Gaumukh.The three Bhagirathi peaks maintain the eternalflow, where chunks of ice keep on falling in therunning water of Bhagirathi, which is only fewfeet wide. At Devprayag, it assumes the nameGanga after meeting with river Bhilangana atTehri and river Alakananda at Devprayag itself.The Gangotri shrine is about 22 kms down thestream from Gaumukh.
The Bhagirathi Ganga takes many twists andturns from Gangotri downwards traversing about240 km long rocky path in Garhwal Himalaya.Then it comes to Rishikesh taking turn furthersouthwards for a distance of about 30 kms,coming down to Indo-Gangetic plains at Haridwarleaving the Shivaliks. The river suddenly changesits profile at this point widening to an extent of 750metres. There are numerous tributaries meetingthe mainstream, the chief among them being theDedar Ganga, Rudraganga and Jahnavi in UpperGanga Valley. From Haridwar downwards, theriver passes through various cities, towns and
villages of UP, Bihar and West Bengal beforereaching finally to Bay of Bengal, covering vastdistance of about 2,525 kms.
Major Religious Places and Towns
There are 692 towns and cities distributed over theten Gangetic States. During such a long journey inplains it embraces many small torrents andtributaries, the first major tributary being RamGanga at Kannauj followed by Yamuna atAllahabad and the united stream thus movestowards Varanasi. Uttarkashi, Devprayag,Rudraprayag, Karanprayag, Rishikesh, Haridwar,Allahabad and Benares are the important religiousplaces on the banks of Ganga. It also flows pastGarhmukteshwar in Ghaziabad district of UP, thevery place where Goddess Ganga is said to haveappeared to Shantanu (ancestor of Pandavas).From Haridwar to Allahabad the Ganga flowsparallel to the Yamuna, another important riverflowing through North India
Allahabad is a sacred place with soul-cleansingpowers, particularly so because the mythical riverSaraswati is said to join the Ganga and Yamunaat the point – a spot of white sand known assangam. In Vedic times, there was a settlement atthis confluence, known then as Prayag, where theVedas were written. Brahma himself is said tohave performed a sacrifice here. Huen Tsang, thefamous Chinese traveller, visited Prayag in 634AD. It was under Mughal Emperor Akbar, that
III
THE GANGA RIVER BASIN
14
.....................................................................................................................................
Prayag was renamed Illahabad, later changed toAllahabad.
It is difficult to describe Varanasi. As ShriRamakrishna once said, “one may as well try todraw a map of the universe as attempt to describeVaranasi.” It was already well known in the daysof Buddha, some 2500 years ago. It finds constantmention in ancient literature and has all alongbeen the pilgrimage centre, sacred to Shiva.Hindus consider it an auspicious place to die, forthem one goes straight to heaven. Surprisingly,Varanasi does not mark one of Ganga’s greatconfluences, but is named after two small riversthat join here, the Varuna and Asi.
Crossing the vast Gangetic plain, the Ganga flowspast Patna, the famous Pataliputra of yore. Sheflows past Mokamah, famous as the place wherethe great hunter-conservationist Jim Corbettworked for several years. It flows past FarakkaBarrage, built to divert more water from Ganga toHooghly to prevent the later from silting. Soon
thereafter, the Ganga splits into numeroustributaries that form the Ganga delta. Hooghly isone of these tributaries. The main channel proceedsto Bangladesh as the river Padma, so dearly lovedby Rabindranath Tagore, and famous for hilsafish.
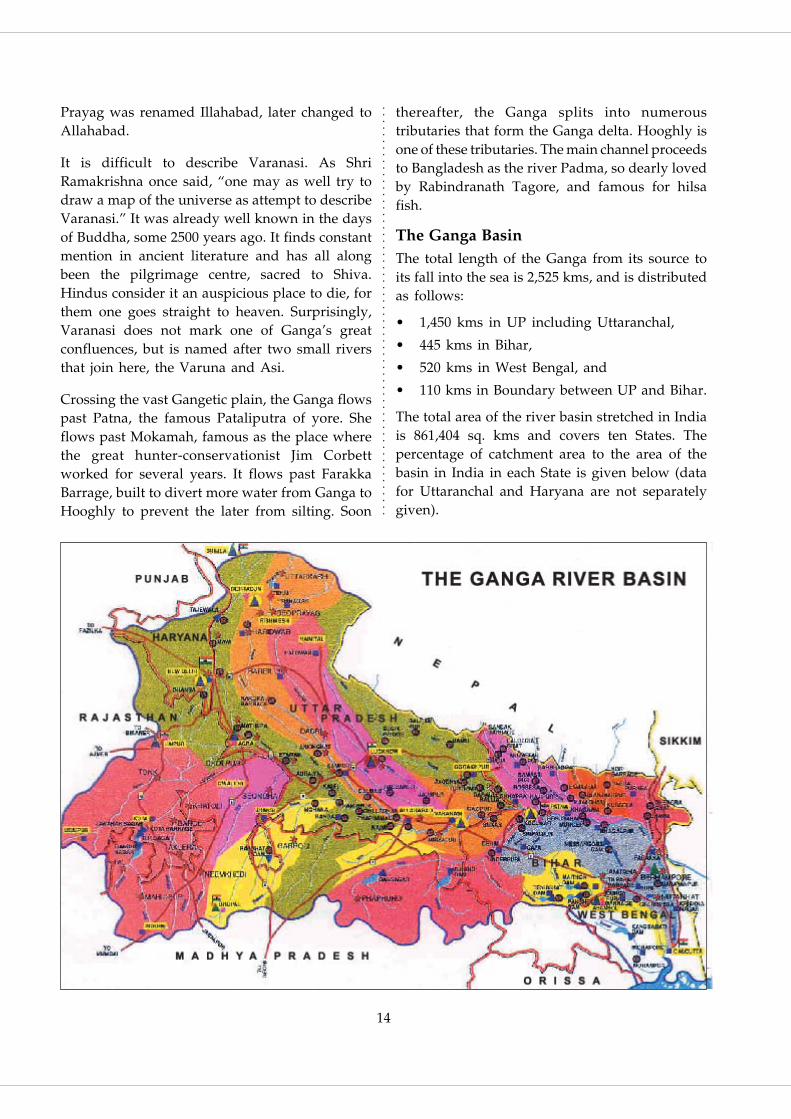
The Ganga BasinThe total length of the Ganga from its source toits fall into the sea is 2,525 kms, and is distributedas follows:
• 1,450 kms in UP including Uttaranchal,
• 445 kms in Bihar,
• 520 kms in West Bengal, and
• 110 kms in Boundary between UP and Bihar.
The total area of the river basin stretched in Indiais 861,404 sq. kms and covers ten States. Thepercentage of catchment area to the area of thebasin in India in each State is given below (datafor Uttaranchal and Haryana are not separatelygiven).

15
.....................................................................................................................................
Name of the State Percentage
i & ii) Uttar Pradesh & Uttaranchal 34.2
iii) Himachal Pradesh 0.5
iv & v) Punjab & Haryana 4.0
vi) Rajasthan 13.0
vii) Madhya Pradesh 23.1
viii) Bihar 16.7
ix) West Bengal 8.3
x) Delhi 0.2
The basin area of Ganga is slightly more than onefourth (26.3%) of Indian geographical area and isthe biggest in the country. Some tributaries likethe Ghaghra, the Gandak and the Kosi drain areasin Nepal amounting to 190,000 sq. kms. TheMahananda has 9,000 sq. kms of catchment areain Bangladesh. Thus, the total drainage basin ofthe Ganga is over 1,060,000 sq. kms.
The Ganga basin is the largest and most importantwater shed of India covering a total drainage areaof about 1,28,411 sq. kms. The main features of theGanga basin are summarized in table 3.1.
Population
The Ganga basin contributes to about 37 per centof the total population of the country, of whichabout 84 per cent inhabit in rural areas and 16 percent in towns and cities. The average density ofpopulation in the Ganga basin is 297 persons persq. kms, while it is 196 persons per sq. kms for thewhole of India. The growth rate of population hasmore than doubled causing a lot of pressure on theavailable resources.
Land use pattern in Ganga Basin
The Ganga basin is one of the most highlycultivated land areas in the country. It coversabout 509,994 sq. kms constituting almost 62.5 percent of the total area of basin, the non-arable landbeing 23.2 per cent. Over 5 per cent of thegeographical area of basin is used for humansettlements. The net sown area constitutes about52 per cent, with substantial portion being underdouble cropping and little portion even for triplecropping.
Table 3.1: Main Features of Ganga Basin
Features Measurements
Area of the river basin 861,404 sq. kms
Percentage in India 85 per cent
Surface water availability 446 million acre feet (MAF)
Total cultivable area 21,109 sq. kms
Irrigation Potential 27,350 thousand hectares
Hydel Potential 11,579 mega watts(At 60 per cent load factor)
Average annual rainfall 364 cm (total). 78 cm in theupstream, 104 cm in themiddle course and 182 cmin the lower delta
Cultivable net area 0.6 x 10⁶ hectarescovering 10 Indian States (600,000 hectares)
Potential sites for dam 52 (total); 29 Completed,23 proposed
Total flow availabilitya. Dry season (Nov.-May) 50 MAFb. Wet season (June-Oct.) 322 MAF
Sediment Load 2.4 billion metric tonsper year
Temperature gradient 10-40 C
Annual discharge 459,040 million cubicmetres
Drainage Area 128,411 sq. kms
Total Catchment Area 1,060,000 sq. kms(Tributaries flowing inNepal amounts to 190,000sq. kms and Mahanandahas 9,000 sq. kms inBangladesh).
The third category of land use is of land underforest cover, which is highly variable. Only about14.3 per cent of total basin area is under forestranging from 2.43 per cent in Haryana to about59.4 per cent in Himachal Pradesh. The comparabledata on land use in Ganga basin and the wholecountry (presented in table 3.2) clearly indicatethat the forest cover in Ganga basin has fastdepleted due to pressure on land from grazing inhigh reaches and cultivation practices and humanhabitation in lower hills and plains. There is anurgent need for precautionary measures to checksuch degradation.

16
.....................................................................................................................................
Table 3.2: Land Use Pattern (in per cent)
Area Cultivated Non- Human Forest Netarable Settlement Sown
GangaBasin 62.45 23.2 5.35 14.3 52.4
India 47.87 22.5 3.49 20.4 42.6
Major Tributaries
There are seven important tributaries from thenorth, six joining from the south and five joiningthe river in the last reaches of the Hooghly. Someimportant tributaries of Ganga are describedbelow.
The Ramganga
The Ramganga River rises at an attitude of 3,110metres in the Garhwal district and emerges fromthe hills into the plains at Kalagarh, the boundaryof the district. After traversing through some moredistricts of UP, it joins the Ganga at Kannauj. Itstotal length is 596 kms. The basin covers an areaof 32,493 sq. kms.
The Gomti
The Gomti rises at an elevation of 200 metres, froma point about 3 kms east of Pilibhit town in UP.It drains the area between the Ramganga and theGhaghra systems. Its tributaries are the Gachai,the Sai, the Jomki and the Chuha. Lucknow islocated on the banks of Gomti; the length of theriver is 940 kms, and it drains a total area of 30,437sq. kms.
The Ghaghra
The Ghaghra is called Manchu and Karnali inNepal and has its source near Lake Mansarovar.Its total catchment area is 127,950 sq. kms of which45 per cent is in India. Its important tributary isthe Sarda or Chauka, which forms the boundarybetween India and Nepal. The other tributary inIndia is the Saryu, famous for the location ofAyodhya (the capital of Dasharath’s kingdom) onits banks. It spills and causes flooding every yearin Azamgarh and Ballia districts of UP. Othertributaries are the Rapti, and the Little Gandakthat starts as an old channel of the Gandak at an
elevation of 300 metres and joins the Ghaghra inShajahanpur district of UP. The Ghaghra joins theGanga a few kms downstream of Chapra in Bihar.The length of the Ghaghra is 1,080 kms and itcarries more water than the Ganga before itsconfluence.
The Gandak
The Gandak is also known as the Kali in Nepaland rises at 762 metres in Tibet near the Nepalborder overlooking the Dhaulagiri peak. Itsdrainage area is 46,300 sq. kms, of which 7,620kms are in India. In Nepal, there are a number oftributaries like the Mayandadi, the Bari and theTrisuli. The Gandak debouches into the plains atTribeni in Bihar. At this site, a barrage has beenconstructed and canals take off on either side toirrigate 1.5 million hectares in India and Nepal.Gandak flows for another 300 kms before it joinsthe Ganga near Patna.
The Burhi Gandak
The Burhi Gandak, known as the Sikrahana in theupper reaches, rises in Champaran districts ofBihar at an elevation of 300 metres. It has adrainage area of 10,150 sq. kms and a length of 320kms. It joins the Ganga opposite Monghyr town.
The Bagmati
The Bagmati rises in the Shivpuri hills of Nepal atan elevation of 1,500 metres, cuts across theMahabhrata range of hills and enters India inMuzaffarpur district of Bihar. On the banks of thisriver is the famous temple of Pasupatinath inNepal. The waters of Bagmati have a high fertilityvalue as they carry nitrous silt. It joins the Kosi inthe lower reaches.
The Kosi
The Kosi is formed by the confluence of threerivers, the Sun Kosi, the Arun Kosi and the TamurKosi in Nepal. The total drainage area is 74,500 sq.kms, of which 11,000 sq. kms lie within India. TheSun Kosi contributes 44 per cent, the Arun Kosi 37per cent and the Tamur Kosi 19 per cent of the totalwater. The Tamur Kosi has the steepest slopes.
17
.....................................................................................................................................
Mount Everest and Mount Kanchenjunga lie in thecatchment of the Arun Kosi.
The Kosi has been causing a lot of destruction bylateral movement like the Yellow River of China.As its waters carry heavy silt load and the riverhas a steep gradient, there is a tendency for it tomove sideways. Thus, in about 200 years, the riverhas moved laterally 112 kms from Purnea to itspresent position.
The Mahananda
The Mahananda rises in the hills of Darjeelingdistrict at 2,100 metres with a number of tributaries,viz. Balsan, Mechi, Ratna and Kankai. The Kankaiis an erratic stream, as it rises in Nepal Hills andcarries a lot of silt. The total drainage area ofMahananda is 20,600 sq. kms, of which 11,530 sq.kms lie in India. The river forms a boundarybetween India and Bangladesh in the last reaches,before it enters Bangladesh to join the Ganga atGodagiri.
The total catchment area of the northern tributariesof the Ganga is approximately 420,000 sq. kmswhile that of the southern tributaries is 580,000 sq.kms. The drainage area of the tributaries joiningthe Bhagirathi-Hooghly is 60,000 sq. kms. Due toheavier intensity of rainfall, the annual run offfrom the region north of the Ganga is 0.75 m whilethat from the south is only 0.3 m. This shows theimportance of the contribution of the flows fromthe Himalayan plain north of the Ganga to themain river. Nearly 60 per cent of the water flowingin the Ganga come from the drainage areas, northof the river.
Basin Data
The Ganga basin has by far the largest gross sownarea of nearly 58 million hectares. The Gangeticbasin has approximately one third of the cultivatedarea in the north of the river, and the rest is insouth of the river. The percentage of grosscultivated area to cultivable area is about 95 percent. Only a third of this area is irrigated, the restbeing rain-fed. The important data such as thepercentage cultivable area, sown area and irrigatedarea are given in table 3.2 and box 3.1.
Box 3.1: GANGA AT A GLANCE
Length: 2,525 sq. kmsSource: Gaumukh (Gangotri glacier) at4,100 metres above MSLGanga basin: more than one million sq. kms(1,060,000 sq. kms)Drainage area: 861,404 sq. kms (26.2 per cent ofIndia’s total geographical area)
Break up
Uttar Pradesh: 294,413 sq. kmsMadhya Pradesh: 201,705 sq. kmsBihar: 144,410 sq. kmsRajasthan: 107,382 sq. kmsWest Bengal: 72,010 sq. kmsHaryana: 34,200 sq. kmsHimachal Pradesh: 5,799 sq. kmsDelhi: 1,485 sq. kmsTOTAL: 861,404 sq. kms
Annual Flow: 468.7 billion cubic metres(25.2 per cent of India’s total water resources)
Flow at Rishikesh: 27 billion cubic metres
Important Stations on the Ganga and distancefrom source:
Rishikesh 250 kms, Balawali 330 kms,Garhmukteshwar 440 kms,Kachla Bridge 510 kms, Fatehgarh 670 kms,Kanpur 800 kms, Allahabad 1,050 kms,Mirzapur 1,170 kms, Varanasi 1,295 kms,Buxar 1,439 kms, Patna 1,600 kms,Baharampur 2,175 kms, Nabadwip 2,285 kms.
The soils in the northern portion of the basin aremainly of three types. In the hills, brown soilprevails. In the area just at the foot of the hills,Terai soils are found. In the rest of the plains, thesoils are rich fertile alluvial soils. The depth of thesoil is also variable throughout the basin dependingon the flow, rainfall and agricultural practices. TheHimalayas, being young mountain range, remainsprone to soil erosion; the Lower Peninsula receivesthe thick layer sediment while soil of variousthickness is found in Southern Plateau. The highrate of siltation reduces the water holding capacityof the Ganga resulting in devastating floodsalmost every year, causing innumerable sufferingsto the inhabitants.

18
.....................................................................................................................................
In the southern region, Vindhya Plateau soilprevails. They are upland, plain and lowlandsoils:
i) Vindhya upland coarse gravel, red, shallowand poor in nutrients.
ii) Vindhya plains contain fine grain materialand can retain moisture.
iii) Vindhya low land soils, which are alluvial.
iv) Besides those in the hills, there are forest soils.
v) In some districts, lateritic soils prevail.
The basin has a high water potential and the totalwater flow in the surface of the basin is 493thousand million cubic metres. The four distinctregions in the Ganga Basin are:
i) Bhabhar area,
ii) Terai,
iii) Ganga plain, and
iv) Southern flat areas.
In the Bhabhar area, the aquifers are located deepbut occur under confined conditions, but in Teraiareas, which are lower than the Bhabhar areas,where till recently water table occurred near thesurface and there were excellent groundwaterresources. The irrigated area in the Ganga basin is19.5 million hectares. Average annual flow in theGanga and its tributaries is given in table 3.3.
Table 3.3: Average Annual Flow in theGanga and its Tributaries
Name of the Sub-basin Average annualflow in million
cubic metres
Yamuna at Allahabad 93,020
(a) Chambal (30,050)
Ganga at Allahabad 58,980
(a) Ramganga (including Deoha) (15,258)
Ganga at Allahabad afterconfluence with Yamuna 152,000
Ganga at Patna 364,000
(a) Tons (5,910)
(b) Sone and other basinsbetween Tons and Sone (31,800)
(c) Gomti (73,090)
(d) Ghaghra (94,400)
(e) Gandak (52,200)
Ganga at Farakka 459,040
(a) Burhi Gandak (7,100)
(b) Kosi (61,560)
Ganga at Confluence belowthe Haldi 493,400
(a) Dwarka (4,687)
(b) Ajoy (3,207)
(c) Damodar (12,210)
(d) Rupnarayan (4,400)
(e) Haldi (5,300)

19
.....................................................................................................................................
This section is largely drawn from the work,Corporate Hijack of Water by Dr. Vandana
Shiva and others (Shiva et al, 2003).
In response to a request from the United Statesgovernment for the purchase of land fromindigenous people for colonists who were arrivingthick and fast from Europe and further east, ChiefSeattle in 1852 wrote a moving piece of prose, sopoetic and metaphoric of rivers and worth quoting.Chief Seattle wrote:
The shining water that moves in the streams and riversis not just water, but the blood of our ancestors. Each
Ganga or Brahmaputra. The words also conveythe agony, anguish and the loss of livelihood, if therivers are privatised or if their waters are divertedfor sale for profit, at the behest of thirsty corporatehouses and MNCs.
Suez: Privatising the Ganges to createwater markets in Delhi
On 9 August 2002, on the eve of the Quit IndiaDay, more than 5,000 farmers of Muradnagar andadjoining areas of Western Uttar Pradesh gatheredin a rally at village Bhanera to protest the layingof a giant 3.25 metre-diameter pipeline to supply
IV
PRIVATIZATION OF GANGA
ghostly reflection in theclear waters of the lakestells of events andmemories in the life of mypeople. The water’smurmur is the voice of myfather’s father. The riversare our brothers. Theyquench our thirst. Theycarry our canoes and feedour children. So you mustgive to the rivers thekindness you would giveany brother (Davies andDay, 1998).
The words of ChiefSeattle are relevant forany river of India, be it
Shri Sunderlal Bahuguna, Shri Rajendra Singh, Dr Vandana Shiva and Oscar Olivera (Bolivia)
discussing strategy to save Ganga

20
.....................................................................................................................................
water from the river Ganga to the Sonia Viharwater Plant in Delhi. The project, which has beencontracted to Suez-Ondeo Degremont of Franceby the Government of Delhi, will deprive therichest farmlands of India of irrigation water.
The Sonia Vihar water treatment plant, inauguratedon 21 June 2002 by the Chief Minister of Delhi, isdesigned for a capacity of 635 million litres a dayon a 10 year BOT (Build, Operate and Transfer)basis, at a cost of 1.8 billion rupees (approximately50 million dollars). The contract between Delhi JalBoard (the Water Supply Department of the DelhiGovernment) and the French company OndeoDegremont (subsidiary of Suez Lyonnaise desEaux Water Division – the water giant of theworld) is supposed to provide safe drinking waterfor the city.
The water for the Suez-Degremont plant in Delhiwill come from Tehri Dam through the UpperGanga Canal up to Muradnagar in Western UtterPradesh and then through the giant pipeline toDelhi. The Upper Ganga Canal, which starts atHaridwar and carries the holy water of Ganga upto Kanpur via Muradnagar, is the main source ofirrigation for this region.
The rally at Bhanera village on 9 August 2002 wasthe culmination of the 300 kilometre-longmobilization drive along the Ganga by the farmersof Garhwal and inhabitants of the devastated cityof Tehri to liberate the river from being privatised.The rally was launched from Haridwar – one ofthe oldest and holiest cities of India built on thebanks of Ganga – where hundreds of farmers,together with priests, citizens and worshippers ofGanga announced that “Ganga is not for sale,”and vowed to defend the freedom of this holyriver. Thousands of farmers and others in villagesalong the route joined the rally to declare that theywould never allow Suez to take over Gangawaters.
More than 300 people from across the country,representing over a hundred grassroots groups,intellectuals, writers and lawyers joined therallyists, at the three-day Convention on EarthDemocracy – People’s Rights to Natural Resources,
Mother Ganga Is Not For SaleThe Haridwar Declaration
Today, the 8th of August 2002, on the eve of the 60th
Anniversary of the “Quit India Movement,” we allhave gathered here to pledge that:
We will never let the river Ganga to be sold to anyMultinational Corporations. Ganga is revered as amother (Ganga Maa) and prayed to, and on itsbanks important ceremonies starting from birth tilldeath are performed (according to Hindu religiouspractices). We will never allow our mother or itswater to be sold to Suez-Degremont or any othercorporations.
The sacred waters of the Ganga cannot be theproperty of any one individual or a company. Ourmother Ganga is not for Sale.
We boycott the commodification and privatisationof the Ganga and any other water resources.
We pledge to conserve and judiciously use ourregional water resources to save our environmentand ecology, so that we would gift our cominggeneration a clean and beautiful environment aswell as safeguard their right to water resources.
We pledge and declare that the local communitywill have the right over the local water resources.It is the duty of the local community to conserveand sensibly utilize their resources. Anyone fromoutside the community whether an individual, anorganization or a corporation have to takepermission of the Gram Sabha for utilizing theseresources.
The river Ganga was brought upon the face of earthby Bhagirath through his yagna (prayers) to sustainthe existence of life on Earth. The Ganga is nowintrinsic to our culture and a part of our heritageand our civilization. Our life and progress over themillennia has been dependent upon the sacredwaters of Ganga. We will fight any multinationalcompany trying to take away our rights to life byprivatising Ganga waters.
The “Water Liberation Movement” will continuetill we liberate the sacred waters of Ganga from theclutches of corporations, like Suez-OndeoDegremont.

21
.....................................................................................................................................
organized by Navdanya from10 to 12 August 2002, at IndianSocial Institute, New Delhi.The Convention sought toprovide evidence of the state’sviolent appropriation ofpeople’s land, water andbiodiversity, and evolvecommon action plans andstrategies to defend collectivecommunity rights to resources.
“There is only one struggleleft - the struggle for the rightto life,” said Magsaysay Awardwinning writer MaheshwataDevi. Eminent authorArundhati Roy and Dr.Vandana Shiva stressed theurgent need to take collective
call for tenders, this 2 billion rupees contract is thefirst contract of this size in India, after Bombay, forDegremont.
Construction of the giant 3.25 metre-diameterpipe on a stretch of 30 kilometres from Muradnagarto Sonia Vihar is going on, and till date about 10kilometres of the pipeline has been laid.
The disastrous impact of this project on thefarmers of Western UP is evident from the fact thatthis area is totally dependent upon the canal forirrigation. Even before being operationalised todivert 630 million litres of water per day fromirrigation, farmers are already feeling the impactof corporate greed for profit – the Upper Ganga
Dr Vandana Shiva, Rajendra Singh and Oscar Olivera in a festive mood
united action to defend people’s rights to land,water and biodiversity.
Suez-Degremont Water Plant at SoniaVihar
Ondeo Degremont, a subsidiary of Suez Lyonnaisedes Eaux Water Division, has been awarded a 2billion rupees contract (almost 50 million USdollars) for the design, building and operation (for10 years) of a 635 million litres per day DrinkingWater Production Plant at Sonia Vihar in NewDelhi to cater 3 million inhabitants of the capital.
Won through the collaboration of all the groupcompanies, within the context of an international
Sign Boards showing water diversion from Upper Ganga Canal at Muradnagar to Sonia Vihar in Delhi

22
.....................................................................................................................................
Canal is being lined to prevent seepage into theneighbouring fields (an important source ofmoisture for farming) and recharge of groundwater, and farmers are being prevented fromdigging wells even as they are reeling undersevere drought.
The lining of the canal to prevent recharging ofgroundwater has terrified the farmers of thewhole region of Western UP. At a meetingorganized by Navdanya on 21 July at Chaprauli,the land of Choudhury Charan Singh, ex-PrimeMinister, farmers stated, “we will not allow theCanal to be lined and supply water to Delhi.Instead the government should link the UpperGanga Canal to the Yamuna Canal through thisarea to tackle the severe drought.”
Being developed on a basis of BOT contract for afixed period of ten years, the profit of the SoniaVihar Treatment Plant is guaranteed by thegovernment during the period. In an interview toa national magazine, a senior manager withDegremont said, “right now, we are happy witha profit of Rs. 10 crores per annum. Othercompanies may be content with managing andoperating existing plants owned by individualcivic bodies. But we don’t want to dabble in that.We have very strict quality control and would liketo maintain our image as quality providers to ourclients” (Joshi, 2003).
However, the Multinationals like Suez-Degremontare notorious to build poor infrastructure with nocompliance to safety norms. On 25 June 2003, fivepeople including one engineer died at the Rithala
Sewage Treatment Plant (STP) in Delhi, which ismanaged by Suez-Degremont (Hindustan Timesand Indian Express, New Delhi, 26 June 2003).According to Sanjay Sharma, union leader ofDelhi Jal Board (DJB), this is the fourth incidentin six months killing a total of eleven persons.Workers at the site are not provided with even thebasic safety gear. There are no gloves, workers arenever given gas masks or oxygen cylindersdespite the air around the flotation units beingfoul; they have just rope.
The Rithala plant treats 80 million gallons per day(MGD) of sewage. DJB manages half of the sewageand the other half by Degremont. The Degremont,plant had been inaugurated by the Chief MinisterMs. Sheila Dikshit in October 2002.
With such a poor record of safety and maintenance,the Suez-Degremont Sonia Vihar Plant has nolegitimacy or justification.
The pipeline of Suez Degremont to supply waterfrom Upper Ganga Canal (near Muradnagar) toDelhi has been laid through the following villagesin Ghaziabad district.
1. Kushalya 7. Mehrauli
2. Masoori 8. Vijaynagar
3. Nahal 9. Duraheda
4. Kallu Garhi 10. Chhajarsi
5. Dasna 11. Makanpur
6. Qazipura 12. Gazipur
After great agitation, the farmers whose land hasbeen acquired are offered meagre amount ofRs.47,000 to Rs.61,000 per bigha, that too inseveral instalments.
Who is Paying for Corporate Profit?
Privatisation of water has been justified on theground that full cost must be paid when watergiants get water markets, whereas with waterprivatisation they demand a full price from thepeople. As the case of the Delhi Water Plantshows, the corporate giants get the water for freewithout paying for full social and environmental
Pipeline from Muradnagar to Sonia Vihar

23
.....................................................................................................................................
cost to those rural communities from whom thewater is taken.
The country has got into huge debt for the loanstaken from World Bank for the Ganga Canal. Atthe same time, the giant 3.25 metre-diameter pipeis being built through public finances. In effect,the public pays the price while transnationalcompanies make the profit.
Delhi Jal Board claims that they have no intentionof raising the water rates for the time being.However, as has been seen in the case of Enronwith electricity, the Orissa Lift IrrigationCorporation in Orissa, and other cases,privatisation leads very quickly to a steep rise inthe price of water and electricity. With regards toconcession to the poor, DJB said there would beno such proposal. DJB will continue to deliver thewater to Delhites and maintain infrastructure, i.e.,burst water pipes, billing, etc. Thus, the people ofDelhi will not just be paying Suez and the JalBoard for the water directly, they will be payingthrough taxes to maintain the infrastructure, thusfreeing the corporation of any expenses, whichmight detract from their profits.
Water Requirement and Source of Waterin Delhi
Delhi is experiencing increasing pressure to meetdemand for its water resources. Growingurbanization, improvements in living standards,exploding population are just some of thecontributing factors. The population of Delhi hascrossed 15 million by the end of 2003. The city, atthe moment, requires 3,324 million litres of watera day (MLD) while what it gets stands closer to2,634 MLD. Average water consumption in Delhiis estimated at being 240 litres per capita per day(lpcd), the highest in the country. The large-scaleextraction of groundwater is a result of thiswidening gap between the demand and supply ofwater. And still worse, serious doubts are beingraised about both the quality and quantity ofgroundwater, which has gone down by abouteight metres in the last 20 years due tounsustainable demand and use.
Delhi’s Water and Wastewater Management iscontrolled by the Delhi Jal Board, which hassigned the contract with Suez Degremont. Withthe demand-supply gap projections for water setto increase in the next ten years, DJB has identifiednew raw water sources including Tehri, Renukal,and Kishau Lahawar dams. Plans also centre onthe construction of new and existing sewagetreatment plants (STPs), which will enable anincrease in treatment capacity. Rainwaterharvesting is another option that DJB isconsidering.
A wall writing saying stop water privatization by multinationals
and stop the sale of Ganga
A wall writing asking the people to save water

24
.....................................................................................................................................
Corruption related to Delhi Jal Board’sSuez Degremont Plant
The process for allotment of contract for the SoniaVihar Plant to Ondeo Degremont has not beenwithout controversy and objections by senior DJBmembers. Of the three companies that bid for thetender, Ondeo Degremont was chosen despitebeing higher in cost than the two other contenders,and allegedly with an inferior technology. It wasalso known that Ondeo Degremont had alreadyexperienced problems with previous contracts inSurat and Delhi (Okhla) where they were slow inthe projects by two years.
Jagdish Anand, a member of the opposition party,has accused senior politicians of trying to bribehim into silence. He said: “Earlier also I hadexposed the irregularities committed by the JalBoard and its officials with regard to the allotmentof Sonia Vihar 140 MGD plant …(they) approachedme on more than one occasion. They independentlyrequested me not to expose the working of theDelhi Jal Board… They also tried to tempt me withsuitable reward and my adjustment in lieu of mynot exposing the irregularities being committed
by Delhi Jal Board (The Hindu, New Delhi, 28November 2002).
Yet another accusation against the politicians andsenior DJB members was of pushing through acontract to Larsen and Toubro for laying of waterpipeline in Sonia Vihar at a cost that wasapproximately more by Rs.30 crores than thejustified amount. The clear water transmissionmains will supply water from Sonia Vihar WaterTreatment Plant to different parts of Trans-YamunaDelhi.
Former Mayors of Delhi, Yog Dhyan Ahuja andShakuntala Arya (both members of DJB) said thatthough the appropriate amount for laying the33.948 km long water pipeline within Delhi wasabout Rs.85 crores, the contract has been awardedfor Rs.111.31 crores.
Out of the four firms that were short-listed,two did not even submit their tenders and thelowest tender bid was as high as Rs.148 crores.Though Larsen and Toubro made a final offerof Rs.111.31 crores on 27 February 2001, thetechnical committee had already given its approvala month earlier.

25
.....................................................................................................................................
The Geological Survey of India conceived theTehri project in 1949. The Tehri site was
considered suitable, provided that sub-surfaceinvestigations did not reveal any adverse factors.However, it was only in 1963 that the detailedinvestigation was made. The site was finallyconfirmed, after the visit of the then UnionMinister for Irrigation and Power, K. L. Rao in1965. By 1967, several Indian and foreign expertsvisited the dam site and recorded their opinions(Paranjpye, 1988).
Apprehension was expressed with regard tothe geological vulnerability of the area at andaround the site – the unstable hill slopes thatwould constitute the reservoir run areas and theseismic danger at the site. The preliminaryinvestigations by the Geological Survey of Indiahad revealed a riverbed fault at the dam siteand this strengthened the decision to opt for aconcrete dam.
Tehri Dam is a gigantic multipurpose projectbeing built on the Ganga at Tehri in the GarhwalHimalaya. The cost of 260.5 metre high damproject which was originally estimated at aboutRs.197.29 crores in 1972 has now escalated toRs.10,000 cores. The dam has been surrounded bycontroversy since its very inception. The mainreasons why the citizens of Tehri Garhwal,several scientists and ecologists have opposed theTehri dam are the following (Matu-People’sOrganisation, 2002) :
i) The uprooting of more than one lakh people,directly and indirectly from their homes inTehri town and surrounding villages.
ii) The high risk of dam failure, whether by anearthquake of higher intensity than what thedam design provides for, or by other factors;in the case of such event the acute threat todense urban and rural habitations in thedownstream area, including the culturallyimportant towns of Dev Prayag, Rishikeshand Haridwar.
iii) The threat of RIS or reservoir inducedseismicity, after the creation of the huge newartificial reservoir, to the people living aroundthis reservoir, a threat that arises from theheight of the dam and other factors favourableto RIS found at and around the dam site.
iv) The threat of rapid siltation of reservoirs dueto the high erosion in the catchment areas.Some experts assess the present life of thereservoir at only 60 years.
v) The project has been steeped in financial wasteand corruption. The Comptroller and AuditorGeneral has raised disturbing questions aboutthis project.
vi) Adverse impact on fisheries, other fauna andflora, and various other adverse effects.
The 260.5 m high dam is more than two-thirds theheight of the Empire State Building, and is on the
V
TEHRI DAM PROJECT

26
.....................................................................................................................................
river Bhagirathi, a tributary of the mighty Ganga,India’s holiest river. The most worrying feature ofthis reservoir is that it is being constructed in theHimalayas, one of the most geologically unstableand earthquake prone regions on the earth, as thesubcontinent of India continues to slip and grindits way northwards into central Asia. Indeed, it iswell known in engineering circles that the massiveartificial water bodies created by dams have atendency to increase the frequency, and perhapsthe intensity of earthquakes (Davies and Day,1998).
The Tehri dam will impound 3.22 million cubicmetre of water. The reservoir will extend up to 45kms in the Bhagirathi valley and 25 kms in theBhilangana valley with a water spread area of 42.5sq. kms. The reservoir is expected to irrigate270,000 hectares of land. The turbines in thepowerhouse at Tehri have an installed capacity of1,000 MW, so that they can operate essentially tosatisfy the peak power requirements of UttarPradesh Power Grid.
Besides, the Tehri dam is also expected to supply500 cusec of drinking water to Delhi.
While cost has increased from 200 crores in 1972to about Rs.10,000 crores, the benefit componentwill not change in real terms because the heightof the dam, and therefore the water available forirrigation will remain constant. Similarly, as therewill be no change in the water-head, there can beno change/increase in power generation. This willmake the cost benefit ratio even worse.
An important aspect of the Tehri Dam is itsproximity to the Chinese border. We cannot ignorethe fact that we had war with China and in futureif there is war, Tehri dam might be an attractivetarget for Chinese bombers. It is a well-known factthat during the Second World War, the Alliedforces and Nazi Germany busted each other’sdams without any qualms. Since then, it has beenwisely decided by most countries not to builddams too close to unfriendly borders. A dam atTehri, barely 100 kms from the border, isstrategically vulnerable.
However, the main controversy surrounds the all-important feature of seismicity at the Tehri location.It is feared that if an earthquake of intensity equalto eight or more on the Richter scale were to occur,the dam would collapse, and the catastrophewould lead to consequences that would greatlyoutweigh the benefits from development.
Galileo (17th century) stated: “I had less difficultyin the discovery of motion of heavenly bodies inspite of their astonishing distances than in theinvestigation of movement of flowing waterbefore our eyes.” The significance of Galileo’sstatement acquires even greater relevance todaywhen one is dealing with a river like the Bhagirathi,which originates at an attitude of 12,000 ft. froma glacier, which is 26 km long and is fed by someof the highest mountains in the world. TheBhagirathi has a catchment area of 7,511 sq. kmsout of which almost one third, i.e., 2,328 sq. kms,is snow bound as it lies above an attitude of 16,000feet above mean sea level.
In 1969, the project authorities had estimated therate of sedimentation as 1.7 acre-feet per sq. mileof catchment area per year. At this rate, the life ofthe dam was estimated as 100 years. However, asempirical data started coming, the annual rate ofsedimentation went up substantially, i.e., 2.8 acre-feet per sq. mile by 1980 or 13.5 hectares per 100sq. kms per year. Subsequently, at this rate ofsiltation, the expected life of the dam would bereduced to 61.4 years.
In case the Tehri dam collapses, the impact would beas given in table 5.1. As seen in the table, in less thanan hour and a half the water would hit Rishikesh andHaridwar and wipe out these two cities. This is certainbecause the height of the water would be 260 metres and232 metres respectively. This would result in horrificloss of life and property. In order to assess how this canbe minimized and to what extent, a disaster managementplan is essential. This plan would also prescribe thecommunications and personnel networks that wouldneed to be in position and the costs involved in all this.These costs would have to be calculated as a part of thecost benefit analysis of the project (Singh andBanerjee, ed. 2002).

27
.....................................................................................................................................
Table 5.1: Impact on cities if theTehri dam collapses
Place Distance Arrival Depth offrom Dam Time for Surge
(kms) Surge (hrs) (metres)
Dam 0 ApproximateTime of Empting
of Reservoir =22 (minutes) 260.00
Rishikesh 80 0.63 260.00
Haridwar 104 0.80 232.00
Bijnor 179 4.45 17.72
Meerut 214 7.25 9.85
Hapur 246.5 9.50 8.78
Bulandshahar 286.5 12.00 8.50
Source: Singh, Shekhar and Pranab Banerjee (ed., 2002): Large
Dams in India: Environmental, Social and Economic Impacts, Indian
Institute of Public Administration, New Delhi.
Jal Yatra Meeting at Bahuguna’s Kuteer and excavation work in background
It needs to be noted that Tehri Dam Project is onlyone of the over 40 hydel multipurpose projects,which have been constructed, or beingconstructed/ investigated in the Garhwal region.These projects include big, medium and smallprojects (Paranjpye, 1988).
The cost benefit ratio
B/C ratio = Annual Benefits/Annual Costs =21007.47/37539.31 = 0.56.
The annual benefit per cost rateis calculated as 56 per cent. Inother words, for every rupeeput on Tehri project, only 56paise will be recovered(Paranjpye, 1988).
The project has also not madeany provisions for ruralelectrification schemes in thesurrounding areas, even thoughthe dam will submerge about100 villages in two districts ofTehri Garhwal and Uttarkashi.On the other hand, the projectwill supply enough to largeindustries and urban areas inthe plains of Uttar Pradesh.
Table 5.2: The Tehri Project at a Glance
Location Tehri, Uttaranchal
Catchment Area 7511 km2
Snowbound area in the catchment 2328 km2
Average annual rainfall 101.6 cm to 263 cm
Annual run-off on 90 per centavailability 5.59MAF
Maximum Recorded Flood 3800m3/S
Adopted maximum flood fordiversion during monsoon 8120 m3/S
Type of the dam Rock fill, clay core
Height of the dam fromdeepest foundation level 260.5 m
Height of the dam fromriver-bed level 239.5 m
Installed capacity 1000 MW
Firm Power 346 MW
Area Irrigated 2.7 lakh ha.
Dead-storage capacity 5 MAF-at 720 mabove MSL
Outlet for releasing water At 730 m abovefor irrigation MSL
Head-Race-Channels for leading Four tunnels atwater to the turbines 720 m above MSL
Source: Paranjpye, Vijay (1988): Evaluating the Tehri Dam:An Extended Cost Benefit Appraisal, Studies in Ecology and
Sustainable Development, Series No. 1, INTACH, New Delhi.
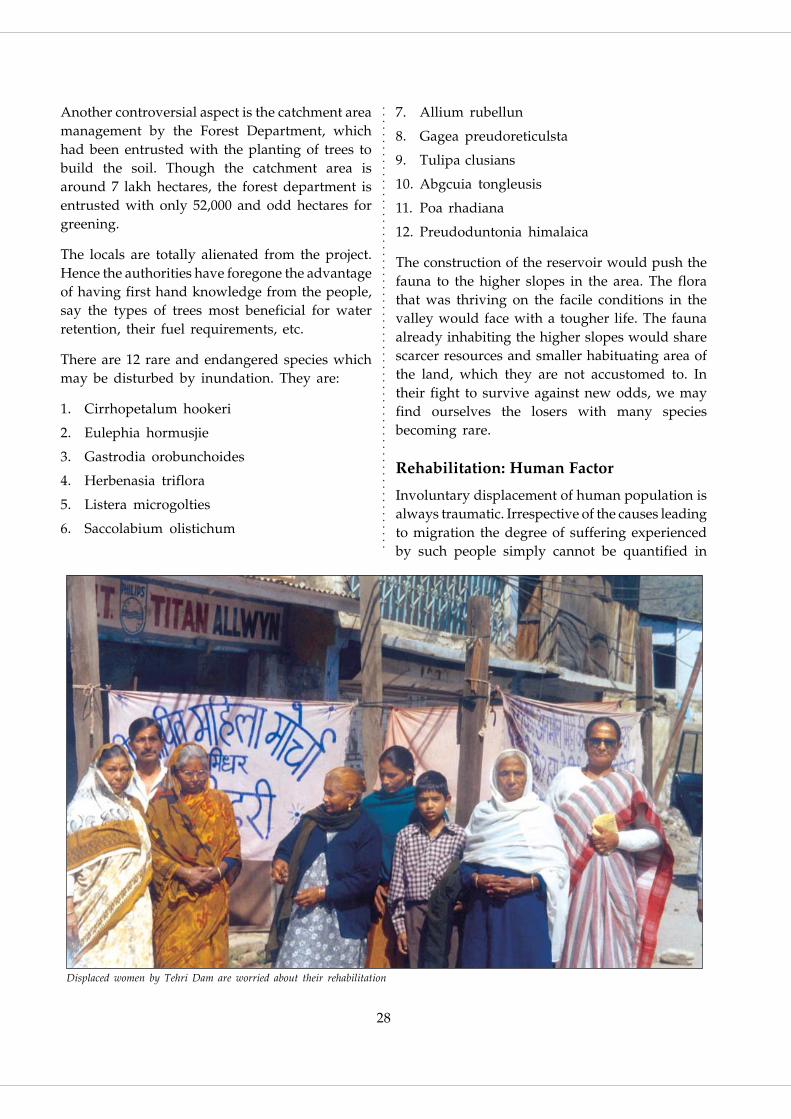
28
.....................................................................................................................................
Another controversial aspect is the catchment areamanagement by the Forest Department, whichhad been entrusted with the planting of trees tobuild the soil. Though the catchment area isaround 7 lakh hectares, the forest department isentrusted with only 52,000 and odd hectares forgreening.
The locals are totally alienated from the project.Hence the authorities have foregone the advantageof having first hand knowledge from the people,say the types of trees most beneficial for waterretention, their fuel requirements, etc.
There are 12 rare and endangered species whichmay be disturbed by inundation. They are:
1. Cirrhopetalum hookeri
2. Eulephia hormusjie
3. Gastrodia orobunchoides
4. Herbenasia triflora
5. Listera microgolties
6. Saccolabium olistichum
7. Allium rubellun
8. Gagea preudoreticulsta
9. Tulipa clusians
10. Abgcuia tongleusis
11. Poa rhadiana
12. Preudoduntonia himalaica
The construction of the reservoir would push thefauna to the higher slopes in the area. The florathat was thriving on the facile conditions in thevalley would face with a tougher life. The faunaalready inhabiting the higher slopes would sharescarcer resources and smaller habituating area ofthe land, which they are not accustomed to. Intheir fight to survive against new odds, we mayfind ourselves the losers with many speciesbecoming rare.
Rehabilitation: Human Factor
Involuntary displacement of human population isalways traumatic. Irrespective of the causes leadingto migration the degree of suffering experiencedby such people simply cannot be quantified in
Displaced women by Tehri Dam are worried about their rehabilitation

29
.....................................................................................................................................
money values and even in words; it can bedescribed only inadequately. In the case of naturalcalamities and wars one notices a sense ofhelplessness because the causes and consequencesare so diverse and widespread that compensationand restoration become either intractable orapologetic. However, this need not be the casewhen the displacement is the consequences of pre-planned developmental projects undertaken bythe government or other public authorities. But,unfortunately ousting of people likely to besubmerged under irrigation or hydel power damis a classic case where hardships are imposed onpeople, in spite of the ‘pro-people’ laws andpolicies proclaimed by the government.
The history of this phenomenon in India datesback to 1884 when the British Government passedthe Land Acquisition Act, and legitimised thedisplacement of people whose lands were to beacquired for “public purposes.” The Act wasbased on the general philosophy that the interestand well being of a few could be subsumed by thelarger interest of the society, which, in practicalterms amounts to the interest of the state.
The Act however was very clear on the point thatsuch displacement does not indeed cause greatsacrifice and therefore, such people should befully compensated for all the losses, and that ifsuch land acquisition is not voluntary, an extra 15per cent of the total compensation be paid inaddition.
Over the years, experience, however have shownthat almost all the displaced persons become therefugees in their own country, and end uppenniless, landless and homeless.
The Tehri Dam Project has affected around 125villages including the old Tehri Township. Thirty-nine villages are going to be fully affected andanother 86 villages (number may possibly increase)would be partially affected. Wherever less than 75per cent of the families are in the displacedcategory and have to be rehabilitated, all thosevillages have been categorized as partially affected.That means that even where 74 families out of atotal population of 100 families are eligible for
rehabilitation, they have been classified asbelonging to partially affected villages.
According to a new estimate made by theRehabilitation Directorate, around 5,291 urbanand 9,238 rural families would be affected due toconstruction of Tehri dam. 3,810 rural familieshave been partially affected by the dam. In reality,however, the number of affected families is muchhigher. As of now, the number of urban familiesdisplaced by the dam has reached 5,500 and thenumber of rural displaced families is more than12,000 (Matu-People’s Organisation, 2002).
The State Government has deliberately submittedlower figures of the displaced families in theaffidavits filed in the Supreme Court of India in2002 ignoring the ground situation. TheGovernment has not still compiled the aggregatestatistics of the affected people. However, if it isassumed that each urban family has roughly fivemembers and each rural family consists of sevenmembers, the total number of affected persons,may in fact, be more than 1 lakh. Even 1,605families of government employees have beencategorized as displaced families (Matu-People’sOrganisation, 2002).
The report published by Peoples Union for CivilLiberties highlighted rampant corruption andother irregularities prevailing in the Tehri DamProject. For instance:
• Out of a total outlay of Rs.582 crores forrehabilitation measures, only Rs.94 croreshave been earmarked for the displaced people.
• Out of the budget for rehabilitation, residentialpremises for District Magistrate and theSuperintendent of Police were earmarked at acost of Rs.47 lakhs and Rs.43 lakhs respectively.A sum of Rs.2 crores was earmarked for a fieldhostel, though no amount was spared forbuilding Dharamshalas.
• Sale of residential flats by the rehabilitationauthorities like builders.
• Rehabilitation becomes the business ofmoneybags.

30
.....................................................................................................................................
• Lack of clear rehabilitation policy and disregardfor Government Orders.
• Significant recommendations of Dr.Hanumantha Rao Committee were notaccepted.
• Flawed evaluation of socio-economic structureof the community.
• Exodus of people rather than meaningfulrehabilitation is happening in Tehri.
In the rural areas, there are only two categories ofdisplaced families, namely, landowners andlandless agricultural labourers; and no estimate isdone (table 5.3). Whereas, in the urban areas thereare many other categories made for rehabilitation.Even government employees and organisationshave been categorized as displaced families.
Table 5.3: Categories of Displaced Families
Townships Villages
1 Landowners 1,766 1 Farmers with land
2 Tenants 442 2 LandlessAgriculturalLabourers
3 Benap 384
4 Employee 1,605
5 Organisation 653
6 House on Fathers’ Land 140
7 Three villages displacedby New Tehri 269
8 Others 32
Partial Submergence: UnrealisticDemarcation
Eighty-six villages would be partially submergedby the Tehri Dam Project. This includes thosevillages where 70-75 per cent of families and landare going to be affected. However, eligibility forthe status of a fully affected village has beendetermined as affecting 75 per cent or morefamilies and land. Even those villages, where 25-30 families would remain after submergence, havebeen affected. Although denomination of villagesas partially affected has been done on amathematical formula (wherever the land of 75per cent of the families is involved), no estimates
have been prepared to take into account theexistence of link roads, grazing places, localmarkets, civic amenities, ‘ghats’ along the banksof the river drains, and the disintegration of sociallife. If the people were deprived of all theamenities in villages where only 25 to 30 per centof the people would be left (in some villages thenumber is as less as 5-10 families), how are thesepeople be expected to retain their existence andidentity as part of the village society?
Cut off Area
Around 80,000 people are going to be indirectlyaffected by the construction of the dam. The areais in Pratapnagar tehsil. This area has beendependent on Tehri Township for various civicamenities. Due to the construction of the dam andthe resultant reservoir, six bridges (two motorableand four pedestrian) on the Bhagirathi andBhilangana river would be submerged, therebycompletely disrupting the roads connecting thedistrict, block, state and national capital and otherareas. As a result, the distance to be traversedbetween these places would increase by 100 to 150kms. A large part of the cut off area falls in the rimarea of the dam and partially submerged area.
Benefits and costs, loss of output on submergedland, loss of output on the land for rehabilitationand comparison of revenue are given in tables 5.4,5.5, 5.6 and 5.7 respectively.
The Secret Reports of Geological Surveyof India
The idea to construct a big Dam in the unstableand geologically sensitive mid-Himalayan regionhas been mired by innumerable controversies. Thegovernment, on the other hand, claims that thedam design has been prepared keeping in viewthe geological aspects. Yet many questions arise.What would be the impact of the reservoir on themountain habitations?
The Geological Survey of India has identified asunstable large tracts above the rim area, whichmay face land slides in future due to the reservoir.Many villages are located in this area. Though the

31
.....................................................................................................................................
Table 5.4: Benefits and Costs of the Tehri Dam
Item Value calculated by Values arrived atthe Tehri dam project after calculations
authorities made by us
Energy generated annually on 90 per cent availability 3,029 x 106 kwh 3,029 x 106 kwh
Energy available to the final consumer Not calculated
Cost of power 35 paise per unit 73 paise per unit
Revenue return (with sale rate of 48 paise) 11.52 per cent 6.89 per cent
Net benefits due to increase in agricultural production Rs. 15,774 lakhs Rs. 6,467 lakhs
B/C ratio for agriculture 3.49:1 1.28:1
B/C ratio for the whole project Not calculated 0.56:1
Forest area lost due to the project 1,600 ha. 4,705 ha.
Number of displaced persons 46,000 85,600
Useful life of the dam 100 yrs. 62 yrs.
Source: Paranjpye, Vijay (1988): Evaluating the Tehri Dam: An Extended Cost Benefit Appraisal, Studies in Ecology and Sustainable
Development, Series No. 1, INTACH, New Delhi.
Table 5.5: Loss of output on Land to be submerged
Crop Area Average yield Total Produce Rate/qtl (Rs.) Vale of output(ha) (quintals/ha.) (Quintals) (lakh Rs.)
Rice 443 17.23 7,633 400 30.53
Wheat 603 12.82 7,730 201 15.54
Minor Millets 258 10.33 2,665 150 4.00
Barley 56 6.90 386 149 0.58
Other Kharif 240 8.67 2,081 200 4.16
Total 1,600 20,495 54.81
Total value of output 54.81
Less cost of inputs @ Rs. 1,250 per hectare (1,600 ha x Rs. 1,250/ha.) - 20.00
Net Output 34.81
Source: Paranjpye, Vijay (1988): Evaluating the Tehri Dam: An Extended Cost Benefit Appraisal, INTACH
Table 5.6: Loss of Output on Land Acquired for Rehabilitation
Crop Area Average Total produce Rate/qtl (Rs.) Value of output(ha) yield/ha (quintals) (lakh Rs.)
(in quintals)
Rice 349 17.23 6,013 400 24.05
Minor Millets 204 10.33 2,107 150 3.16
Wheat 476 12.82 6,102 201 12.27
Other Kharif 189 8.67 1,639 200 3.28
Barley 44 6.90 304 149 0.45
Total 1,262 16,165 43.21
Source: Paranjpye, Vijay (1988): Evaluating the Tehri Dam: An Extended Cost Benefit Appraisal, INTACH

32
.....................................................................................................................................
report has been classified as secret, many significantissues highlighted by the report have becomepublic.
When subsurface explorations were carried out onadvice of the Geological Survey of India in the1960s, a major fault was found at the dam site thathas been fully or partially proved. In the GSIreport it has been stated: “in the area encompassingthe rock fill dam, the rocks exposed are themassive phyllitic quartzites, the schistose andsheeted phyllites of grade III and IV quality andnumerous, cross as well as foliation sheet-zones ofgrade V quality. These alternative bands ofphyllites and quartzites are of the Chandpurseries, and at some places up to 20 bands canbe counted.” And finally, it said, “the riverbedsheet-zone has been proved by drill holes and thetrue thickness of this zone below the core of therock fill dam has been established to be 11.6metres.”
About the seismicity, the Geological Survey ofIndia reports that the proposed project site fallsbetween isoseimals VIII and IX of KangraEarthquake (1905). In the vicinity of the Tehridam, the following tectonic features exist:
1. The Srinagar Thrust is located about 4 kmsfrom the dam-site, which brings the rocks ofthe Bharat Series against the Shimla and theChandpur phyllites.
2. The Gadolia Tear Fault was traced fromvillage Paukhal to village Nelda.
3. The Tehri Tear Fault has been traced nearNandgaon.
4. The Tehri Tear Fault has proved the existenceof a fault running along the river course, andit represents the just older branch of the TehriTear Fault.
5. The Deul Tear Fault passes through terracegravel and there is a scarp about 15 m highalong its inferred trace.
The GSI Report further states: “The seismicity ofthe thrust and faults is not known as noseismographic data exists in this connection.” Andin the Tehri dam detailed project (1983), it is statedthat epicentres of 77 earthquakes lay within aradial distance of 320 kms from the proposed damsite. The nearest epicentre was located 35-40 kmsnortheast from the site. Most of these quakes hada magnitude of 5-7 on the Richter scale.
Tehri (Historical Trihari)
The biggest township, which is going to besubmerged in India, is perhaps Tehri. Instead ofaugmenting its own prosperity after independence,the Tehri township is being devastated in the nameof oft-repeated national development. This is anancient land, which is being submerged anddevastated on the pretext of developmental projects.
Table 5.7: Comparison of Revenue Estimation by TDPA & ExpertsEstimated in 1988
SN. Item TDPA Values Our Values
1. Total Working Expenses per year Rs. 2,143.00 lakhs Rs. 2,418.19 lakhs
2. Total annual energy available for sale 3,029.18 X106 KWH 2,423.16 X106 KWH
3. Cost of the power component Rs. 107,650 lakhs Rs. 126,431.34 lakhs
4. Interest charges Rs. 8,612 lakhs Rs. 15,171.7 lakhs
5. Total charges per year (1+4) Rs. 10,755.0 lakhs Rs. 17,589.95 lakhs
6. Cost of generation per KWH 35 paise 73 paise
7. Gross annual revenue assuming sale rate of 48 paise (0.48 x 2) Rs. 14,540 lakhs Rs. 14,540 lakhs
8. Net Revenue (7-1) Rs. 12,379.06 Lakhs Rs. 12,121.81 Lakhs
9. Revenue Return (8/5) 11.52 per cent 6.89 per cent
Source: Paranjpye, Vijay (1988): Evaluating the Tehri Dam: An Extended Cost Benefit Appraisal, INTACH

33
.....................................................................................................................................
The place where Tehri Dam is being constructed,finds a mention as ‘Dhanushtirth’ in the ‘SkandhaPuran.’ The confluence of Bhagirathi andBhilangana rivers is just 500 m from the main gateof the dam. This confluence is known as ‘GaneshPrayag,’ also known as Trihari – the confluence ofthree rivers and later called Tehri. Swami Ramtirth,the founder of ‘Practical Vedanta,’ adopted Triharias an abode of meditation and ‘nirvana.’
The king of Garhwal, Sudarshan Shah belongingto Panwar dynasty, built Tehri township as thenew capital of the state in 1815 AD. Prior to this,the capital was Srinagar Garhwal, which had beencaptured by the East India Company. The capitalTehri built by King Sudarshan Shah witnessedroyal grandeur for almost 133 years.
The Garhwal state however witnessed declineafter the reign of the sixth king. Till the state’sdecline, Tehri continued to be the capital. Beingthe capital, Tehri became the hub of education,literature, culture and politics. Even afterindependence, Tehri retained its importance. Itwas the centre of peoples’ movements. Chipko,Prohibition and Uttarakhand movementsreverberated in the streets and markets of Tehriand chronicle the grandeur of the township.
Shri Dev Sumar had undertaken a marathon 84-day old hunger strike, which is only second induration in the world history. The fast had beenundertaken to gain freedom from the royal rule.After 84 days, Shri Dev Suman passed away andbecame a martyr.
After visiting Yamunotri and Gangotri, most ofthe pilgrims heading for Kedarnath and Badrinathhave to pass through Tehri. Even when there wasno motorable road, Tehri was the traditional routeof the pilgrims.
Unlike in other places, where construction ofdams has taken place, the displaced belong tohighly educated middle class families. Accordingto the 1992 statistics of the National LiteracyMission, the literacy rate in Tehri had reached 98per cent.
Besides education and literacy, the economic
condition in the township was admirable. Only5.54 per cent of the houses were thatched. AlthoughNarendranagar was the district headquarters,more than 40 government offices were locatedthere including the District Court. All civicamenities were available for the residents at adistance of 2-3 kms. Since Tehri was the centralpoint and the nearest market for the adjoining 200villages, there was lots of hustle bustle and theplace used to be quite crowded.
The Historical and Cultural Heritage ofTehri Region
In Tehri, there are religious, cultural andarchaeological places and monuments ofimportance, which require conservation efforts.However, there is no plan for conserving theheritage in the submergence area of the reservoir.
In fact, some Dharamshalas (places of residencefor the pilgrims), rock scriptures, and uniquecraftsmanship on wood and stone still exist in theprecincts of Badrinath Temple complex. Nearby,the staircases of ghats reaching the innermostdepths of the confluence of Bhagirathi andBhilangana rivers still exist.
The Badrinath complex consists of a large numberof intricate high-domed mosque like templestructures having unique, expansive metalsculptures of presiding deities like ‘SatteshwarShivling,’ ‘Bhairav Panchmukhi Hanuman,’ ‘RajRajeshwari,’ ‘Laxmi Narayan,’ ‘Ranganath,’ ‘GangaDakshin Kali,’ ‘Shitala Mata’ – all these still exist.
The ‘Ashtavakra Rishi Shilas,’ ‘Gopeshwari Ling’and ‘Raktavarna Ganesh Shila’ on the confluenceof Bhagirathi and Bhilangana rivers including the‘Shish Mahal’ in Simalsu have already beensubmerged under the spate of water and sand.
In one of the Hindu Hymns, “Kedarkhand,’ Tehriand the important adjoining places find mention,and these places are tragically in the submergencearea of the Dam.
Legend has it that Aadi Sankaracharya had beenresponsible for building the ancient temple inMalidewal village of Bhagirathi valley.

34
.....................................................................................................................................
New Tehri
As the entire Tehri township was going to besubmerged once the Tehri Dam was constructed.The idea of New Tehri Township took shape inorder to settle the residents of the area. Table 5.8shows the population of old and new Tehri towns.
It was designed to build New Tehri Townshipbelow Bauradi (which is 1950 m above sea level),but now it is being built in the area above Bauradi.As compared to Tehri, there is a marked differencein terms of climate and weather conditions here.There is also a marked difference in the geo-morphological make up. Bauradi village is situatedon the elevated southwest side of Tehri at adistance of 25 kms.
Table 5.8: Population Figures – Tehri andNew Tehri
Year Tehri New Tehri
1991 15,730 4,496
2001 14,954 10,471
Hydel and multipurpose projects inGanga Yamuna Valleys, Garhwal
Following are the hydel and multipurpose projectsbeing built and/or proposed in Garhwal region(Bharat Dogra, “Dams, Barrages and Future ofGarhwal,” in Friends of Chipko, undated, IgnoringReason, Inviting Disaster: Threat to Ganga-Himalaya,New Delhi).
A. Bhagirathi river projects
1. Bhairon Ghati Hydel Scheme I2. Bhairon Ghati Scheme II
3. Loharinag Hydel Scheme
4. Pala Maneri Scheme5. Maneri Bhali Hydel Scheme I
6. Maneri Bhali Hydel Scheme II
7. Tehri Dam Project8. Koteshwar Dam Project
B. Alaknanda River projects
9. Rishi Ganga Scheme
10. Lata Tapovan Scheme11. Markur Lata Scheme
12. Tapovan Vishnu Gad Scheme
13. Vishnuprayag Scheme14. Vishnu Gad Pipalkoti Scheme
15. Bovla Nandprayag Scheme
16. Karnaprayag Dam Project17. Utyasu Dam Project
18. Srinagar Dam Project
19. Bhagoli Dam Project20. Padli Dam Project
C. Ganga River Projects
21. Kotlibhel Dam Project
22. Rishikesh Chilla Scheme
D. Projects on Yamuna, Tons and Tributaries
23. Hanuman Chatti – Saina Chatti hydelscheme
24. Saina Chatti – Gangnani Scheme
25. Barkot – Kuwa Hydel Scheme
26. Kuwa Damta Hydel Scheme27. Lakhwar Dam Project
28. Vyasi Dam Project29. Kala Pathar Scheme
30. Karkot Tuni Hydel Scheme
31. Hanol Tuni Scheme32. Tuni Palasu Scheme
33. Kishau Dam Project
34. Devara – Mori Hydel Scheme35. Sidri Dewara Hydel
36. Taluka Sinkri Scheme
37. Jokhol Sikri Scheme38. Ichari Dam Project or Yamuna Hydel
Scheme II39. Dakpathar Project or Yamuna Hydel
Scheme I40. Asan Scheme or Yamuna Hydel Scheme
Part IV41. Kahara Hydel Project
The Tehri Dam Project: A Chronology
Following are some of the important dates in theTehri dam project (Matu-People’s Organisation,2002; Bharat Dogra, “Dams, Barrages and Future

35
.....................................................................................................................................
of Garhwal,” in Friends of Chipko, undated,Ignoring Reason, Inviting Disaster: Threat to Ganga-Himalaya, New Delhi).
1972 Rs.197.29 crores dam at Tehri togenerate 600 mega watts of powermooted. N. D. Tiwari, the then UPChief Minister, pressurises thePlanning Commission and gets theproject cleared.
1978 People of Tehri go to the PetitionsCommittee of Parliament against thedam. Tehri Bandh Virodhi SangharshSamiti formed.
1980 Mrs. Gandhi asks the Department ofScience and Technology to review theproject. Mr. Sunil Roy appointed theChairman.
1986 Mr. Roy submits report and says thatseismic risk too great and Dam shouldnot be constructed. The Environmentand Forest Ministry refuses clearance.Yet, the government enlarges theproject to Rs.3,000 cores scheme forgenerating 1,000 mega watts in phaseone and another 1,400 mega watts inphase two. Construction continueswithout clearance. On his visit toIndia, Mr. Mikhail Gorbachev grantsassistance to the fund starved Tehriproject, but not before the Committeeof Secretaries directs the CentralWater Commission to convene ameeting of experts to report on thedam’s safety.
Oct. 1986 Clearance granted. The report says adam in this region could withstandan earthquake of magnitude 5.9 andpeak ground acceleration of 0.25 g.Environmentalists do not givecredence to the report, as it wasnot based on field studies byseismologists.
Aug. 1989 Project submitted to PublicInvestment Board, Planning
Commission. The StandingEnvironment Committee underDr. D. R. Bhurmal rejects Tehriproposal on all counts. Says there isevidence of an earthquake of over 8points on the Richter scale in thelifetime of the dam. Subverting thisreport, the committee of secretariessets up a high-level panel, headed byDr. D. Daundyal, to look into theseismicity. Another member, Dr. V. K.Gaur, Secretary, Department of OceanDevelopment asks for a review.
June 1990 The Committee defers decision onclearing the project, followingobjections raised by Dr. Gaur. At thesame time, newspapers report theon-schedule completion ofpreliminary construction of the dam.
July 1990 The Ministry of Environment clearsproject while stipulating that theproject authorities must get safetyaspects approved by an expertcommittee. Leadingenvironmentalists assail clearance.
Jan. 1991 The Central Government gives go-ahead signal and says it would notallow further delay in the project’scompletion.
July 1991 The Indian National Trust for Art andCultural Heritage (INTACH) urgesnot signing the dam due to possibleearthquake of 8.5 magnitude.
Aug. 1991 The Union Ministry of Environmentlays down stringent conditions whileissuing clearance, following warningby an experts committee on the“environmental appraisal” of theproject that dam site is located in‘seismic gaps,’ where a majorearthquake could be imminent.
Oct. 1991 Disaster strikes, bringing thesimmering controversy to a boil.‘Greater disaster in store,’ say experts.

36
.....................................................................................................................................
Sept. 1996 A twelve member Expert Committeeunder the Chairmanship of Dr.Hanumantha Rao was constituted tostudy the environmental andrehabilitation aspects of the project.
Nov. 1997 Dr. Hanumantha Rao Committeesubmits its report to the CentralGovernment.
Dec. 1998 The Central Government takesdecision on the Group of ExpertsCommittee report. The Governmentaccepted the recommendation
regarding safety of the dam design,but it rejected two otherrecommendations.
2001 A Committee was constituted underthe Chairmanship of Dr. MurliManohar Joshi to study the safety ofthe dam and the importance of Gangawater in the aftermath of Bhujearthquake.
Dec. 2001 Diversion Tunnels T3 and T4 of thedam closed down. Dr. JoshiCommittee is yet to submit its report.

37
.....................................................................................................................................
Since the days of its construction, Upper GangaCanal had been known as the backbone of
agriculture in North Western Provinces (mainlyWestern UP of present day). Today the agriculturalprosperity in Western UP is largely attributed toUpper Ganga Canal.
The vulnerability of indigenous agriculture hasoccupied the greater part of attention of therevenue administration since the famine of 1837-38, and its heavy toll of relief, remission andsuspensions had pointed out the need for remedialaction. Massive assistance was believed to be thesolution through the application of the latestprinciples of British Civil Engineering to tap theneglected resources of the Ganga and Yamuna fora gigantic network of canals to irrigate the thirstysoil of the traditionally highly productive Doaband provide navigation channels for the speedierdistribution of its greatly increased produce.
In a little over twenty years from the opening ofthe pioneer Ganga Canal in 1854, the secondlargest canal system in India and the world, some5,601 miles of main lines and distributaries hadbeen constructed, commanding an estimatedirrigated area, in 1877-78 of nearly 1,500,000 acresin the western districts at a capital cost of nearly4,500,000 pounds sterling (Whitecomb, 1971).
Local reaction to the introduction of the canalssymbolized their benefits. Al least, one folk poem,
still current a few decades ago in Aligarh districtraised Sir Proby Cautley, the master designer ofthe Ganga system to divine status in a variant onthe myth of Bhagirath. The story is told how thepeasants had initially opposed all interferencewith the sacred river, but turned to keepingpraises on Cautley’s head as he led the waters ofthe Ganga down into the parched fields of theirneighbourhood. It was common usage along theWest Yamuna Canal in nearby Punjab, for example,to refer to the subordinate, local official of thecanal administration as ‘Naib-Khuda’ or ‘DeputyGod.’
Irrigation in the grand manner began, with theGanga Canal. Water was admitted into the canalin 1854, and irrigation commenced the followingyear. In 1861-62, the area irrigated by the canalswas officially set at 372,000 acres; the areacontracted to 350,000 acres in 1864-65. By 1864-65,the canals as completed comprised its main line(181 miles), the Fatehgarh Branch (82.5 miles), theBulandshahar Branch (45 miles), the KanpurBranch (170 miles), and the Etawah Branch (170miles) – a total length of 648.5 miles with 2,266miles of distributaries.
Initial discharge of water in the canal was 6,750cusecs. In 1951, after some modification thecapacity was increased to 10,500 cusecs. Today thecanal irrigates about 9.24 lakh hectares of land infollowing districts:
VI
THE UPPER GANGA CANAL

38
.....................................................................................................................................
• Haridwar • Roorkee • Shaharanpur• Muzaffarnagar • Meerut • Ghaziabad• Gautam Buddh Nagar • Bulandshahar• Aligarh • Mathura • Hathras • Mainpuri• Etah
At Nanu (Aligarh) the canal is bifurcated into twobranches. One goes to Kanpur and the other toEtah. From Nanu, it functions as a supply channel.By the time it reaches to Kanpur, it becomesabundant.
Some other facts regarding Upper GangaCanal
The data based information pertaining to UpperGanga Canal in respect of some districts is givenin tables 6.1 to 6.6.
Table 6.1: Land and irrigation data (GHAZIABAD)
Particulars Hectares/No.
Total Land Area 201,005
Total Sown Area 142,113
Total Irrigated Area 141,986
Total Forest Area 2,470
Total Barren Land 3,703
Total Waste Land Area 9,089
Total Non-Agricultural Area 5,489
Total number of Villages 556
Table 6.2: Block level data on canals and tube wells(GHAZIABAD)
Name of Block Length of the No. of TubeCanal (kms) wells
Bhojpur 111 23
Muradnagar 156 25
Rajapur 56 21
Loni 53 20
Dhaulana 24 24
Hapur 12 50
Simbhaoli 12 20
Garhmukteshwar 72 42
Total in Rural Area 496 225
Total in Urban Area 100 —
Total 596 225
Table 6.3: Block level data on canal-irrigated land(GHAZIABAD)
Name of Block Net Irrigated Area (Hectares)
Bhojpur 3,101
Muradnagar 4,308
Rajapur 1,499
Loni 213
Dhaulana 4,983
Hapur 281
Simbhaoli 2,048
Garhmukteshwar 4,271
Table 6.4: Data on well-irrigation (GHAZIABAD)
Particulars Net IrrigatedArea (Hectares)
State Owned Tube wells 15,812
Private (Individually owned)Tube well 99,428
Wells 4,897
Ponds Nil
Table 6.5: Land and irrigation data(MUZAFFARNAGAR)
Total number of Villages Irrigatedby Ganga Canal 350
Total Irrigated Land Area(Hectares) 71,440 Hectares
Total Length of Ganga Canalin the District 23,792 Kms
Major Distributaries 41,015 Kms
Rajvahi 68,111 Kms
Minor 112,449 Kms
Total Length of Distributaries 55,676 Kms
Table 6.6: Land and irrigation data (MEERUT)
Total number of Blocks irrigated byGanga Canal 10
Total number of Villages irrigated byGanga Canal 427
Total Irrigated Land Area (Hectares) 24,259
Total Irrigated Land Area duringRabi Crop (Hectares) 19,270
Total Amount of Water Used forIrrigation during Rabi Crop (Cusecs) 50,934

39
.....................................................................................................................................
Impact of fortnightly closure of Gangacanal
The upper Ganga Canal is a boon for all thosevillages, which are dependent on it for irrigationthroughout the year. Sudden closure of the canalin the last fortnight of April 2003 was a matter ofgreat controversy among the villagers who facedthe consequences. Some of the major impacts oftemporary closure of the canal are summarizedbelow.
• Delay in sowing of crops like sugarcane,fodder related crops, and maize
• Scarcity of water for livestock in these villages
• Temporary Drought conditions due to non-availability of water for irrigation
• Production of seasonal vegetables is affected
• Price hike in seasonal vegetables
In Meerut, the richest of the Doab districts,irrigation prior to the introduction of canals hadnaturally coincided very much with the characterof the soils. As a general conclusion from thePragna reports, it was clear that wells could bedug more easily and lasted longer, in proportionto their distance from the great natural drainagelines, as “the best well tracts were on watersheds.”It was precisely these tracts, which the new canalscovered most extensively.
The main line of the Ganga Canal was opened in1855 and ran through the centre level tractbetween the Hindon and Kalinadi, while itsAnupshahar Branch was opened five years later,and the latter fed the comparatively narrow butfertile strip between the Kalinadi and the Ganga.The division between areas with high proportionsof better soil and the poorer tracts intensified. Theextensions of irrigation through the naturallyfertile areas, for example, the central tracts ofpragna Jalalbad and Baghpat, were reported bythe end of 1860s to have produced immediate andextraordinary increase in production. Thesuppression of well by the canals, whichimmediately commanded a much greater areawas said to have saved Kotana and neighbouringpragnas, the core of the opulent Estate of Begum
Sumroo from the ravages of famine in 1860-61.Indeed, the proprietor made enormous profitsfrom the grain trade. In the south, pragna “Dasna”benefited similarly from the Ganga Canal.
Elsewhere, however disadvantages and evendeleterious effects of the canals were alreadybecoming noticeable by the end of 1860s. Forexample, in Chhaprauli, which used to be thefinest in the district, the inroads of canals had leftmost wells in disuse and the well maintenancewas almost entirely abandoned. The canal enabledSardhana pragna to grow sugarcane and othercash crops in abundance.
The immediate impact on ecological conditionswas more disturbing. The burden on the landthrough persistent heavy cropping under thestimulus to cultivate the ‘valuable’ produceincreased the threat of deterioration in fertility,noticeable earlier in the century wherever theintensification of agriculture, particularly in mid-Doab regions, had brought over-cropping in itswake. Most serious of all, however was the effectof the canals on the delicate mechanism of thehydrological cycle.
Cropping patterns of staples followed the naturalconditions of each locality. In this respect, theobservation reported from Mathura district in1879 can be taken as representative of the provincesas a whole. It is clear how the variety of the soilsand the extent to which irrigation was readilyavailable determined the basic patterns ofagricultural production. Following patterns werefound common.
1. Where water was far from the surface andirrigation consequently difficult, Kharif cropsoutnumbered the Rabi; a small area only wassown with wheat, a corresponding large areawas sown with grain.
2. Where the natural soil conditions were good,of the staple Kharif millets jawar was grownextensively and bajra only nominally.
3. Where no jheels (lakes formed by rainfallcollecting in hollows in the ground) existedand the climate was generally dry, paddy wasnot grown.

40
.....................................................................................................................................
4. Where water available for irrigation wasbrackish, sugarcane was rarely grown.
For the successful exploitation of the above saidconditions, one fact was paramount: the farmersdepended on an adequate and timely rainfall tosecure a full return on the season’s sowings.Unevenness in the rains brought sudden anddrastic changes; scarcity could follow abundancewithin the space of a season.
The great nineteenth century developments incanal engineering were concentrated in the Doab.They began early in the 1820s, with the build ofEast Yamuna canal. This system, a radical research-development on an old Mughal canal lane, wasopened in 1830. It irrigated tracts in the Saharanpur,Muzaffarnagar and Meerut districts. By 1878, itsmain and branch channels together withdistributaries totalled 748 miles and irrigated206,732 acres (as against the average of thepreceding five years, 188,678). The cost of theworks, excluding interest, came to pounds sterling126,235. Being one of the most remunerativecanals of British India, it paid nearly 23 per centon the capital expended on it by Government.
In 1868, the construction of a Lower Ganga Canalbegan, together with the modification in thecompleted channels. By 1877-78, the area actuallyirrigated by the whole complex was set at 1,045,013acres. Some 593 miles of main and branch lineshad been completed in the upper and centralDoab. With another 3,417 miles of distributaries,the total length of the channels constructed raninto 4,010 miles and the cost, excluding interest,stood at pounds sterling 3,055,015.
In 1868, the first work sanctioned for the purposeof famine relief began on the Agra canal. In March1874, the canal was formally opened and irrigationbegan the following Rabi season. By 1877-78, itcommanded an area of 375,800 acres; altogether114,200 acres in Mathura district and a further113,100 acres in Agra made the proportion ofirrigated lands in Western UP higher. Smallerworks in Bijnaur, fed by a stream in Moradabaddistrict, covered an area of 4,000 to 5,000 acres. InBareilly, a further group of some four channels,
totalling 256 miles in length and known collectivelyas the Rohilkhand canals, irrigated a belt ofcountry along the terai, where rice was grownextensively.
Canal development was concentrated in thoseareas where facilities existed for it, that is, thedistricts of the North Western Provinces – NWP(today’s Western UP). Those districts had a longestablished and sophisticated patterns of farmingin which well irrigation particularly played alarge part.
It was estimated that in 1848-49 the number ofpakka (masonry) wells in the NWP came to137,337 of which 72,523 were in the Doab.Devastation during the “mutiny” brought thenumber of wells in Doab down to close 7,000, witheach well having an irrigating capacity ofapproximately 4.5 acres per season. Thecorresponding number of the more commonKachche (temporary) wells was estimated at280,000, each with an irrigating capacity of 1.5acres per season. From this, it was estimated thatabout 1,470,000 acres in the Doab were irrigatedby the wells.
Astronomical cost of constructing UpperGanga Canal in Today’s value
Water from the Ganga was released in the Canalin 1854. The canal was constructed at the estimatedcost of £ 4.5 million. In today’s value theconstruction of the canal would have costminimum Rs.73,728 crores in 1994 and Rs.147,456crores in 2004. Surprise, just see how?
Let us assume that one rupee, was put in the‘Fixed Deposit’ in 1854. If one were to considerdoubling of a deposit in a bank after every 10years, one rupee of 1854 would be equivalent toRs.16,384 in 1994 and Rs.32,768 in 2004 asillustrated below:
Decade Year Amount (Rs.)
0 (1854) 1
10 (1864) 2
20 (1874) 4
30 (1884) 8

41
.....................................................................................................................................
40 (1894) 16
50 (1904) 32
60 (1914) 64
70 (1924) 128
80 (1934) 256
90 (1944) 512
100 (1954) 1,024
110 (1964) 2,048
120 (1974) 4,096
130 (1984) 8,192
140 (1994) 16,384
150 (2004) 32,768
In the 1854s, a rupee was worth about one tenthof a pound (www.copseyfamily.org). Hence, if wecalculate the in terms of pounds, 4.5 millionpound sterling of 1854 would be:
= Rs.16,384 x 4.5 x 10 million = Rs.16,384 x4.5 crores
= Rs.73,728 crores in 1994, orRs.147,456 crores in 2004.
(Incidentally, Lord Dalhousie, Governor Generalof East India Company in 1855 offered a pensionof £ 6000 or Rs.60,000 per annum to Laxmibai Raniof Jhansi, which she refused. In today’s value itwill become approximately Rs.96 crores in 1994and Rs.192 crores in 2004.)

42
.....................................................................................................................................
Water Privatisation has suddenly come tomean big bucks in India. With water
resources in the country fast depleting and thegovernment throwing up its hands, at leastfive global Corporates are ready to tap the marketof over $ 2,000 million. They have already set upshops in several States and are confident of seeingtheir projects approved, with the centralgovernment literally rolling the red carpet towelcome them.
To facilitate “private partnerships,” the ministryof urban development in May 2003 released a setof guidelines to State governments for creating a“welcoming atmosphere” in the drinking watersector.
Neither the guidelines nor the National WaterPolicy, 2002, which advocates more privateinvolvement in the water sector bother to see theresult of such corporatization elsewhere in theworld. As in Bolivia, where riots broke out in thecity of Cochabamba after a 35 per cent increase inwater bills, such experiment have been contentiousalmost everywhere. According to a study compiledby David Hall, director of the Public ServicesInternational Research Unit at the University ofGreenwich, privatisation of water of thePhilippines, Germany, Brazil, Nairobi andArgentina have led to a tremendous increase inwater prices, triggering public outrage. Makingprofit on people’s most basic needs is the dreamof many corporate executives.
Global players are keenly watching thedevelopments in India and are slowly seeping intothe sector. Degremont, a subsidiary of France’sSuez, has projects in six cities of India and hasplans for further expansion. The company isdealing in treatment of water exclusively. Futureexpansion will depend on the kind of tradeenvironment the government creates.
Degremont has a project in Delhi; the Sonia Vihartreatment plant is being developed by the companyon a Build Operate and Transfer (BOT) contractfor a fixed period of seven to ten years duringwhich its profits are guaranteed by the government.
While private companies like Degremont have thegovernment subsidizing their profits, otherinternational agencies are looking forward to thecivic bodies reforming their tariff structure to payback loans.
It perceives water not as a fundamental right ofthe people, but as a commodity the governmentcan no longer afford to make available to itspeople free of cost or at subsidised price. Thisapproach, according to Himanshu Thakkar of theSouth Asia Network on Dams, River and People(SANDRP), is fundamentally flawed. “Water is anatural resource and the government owns it onlybecause it promises to make it available to people.On what basis has the government made water acommercial product? On what basis are theprivate companies selling bottled water to people?
VII
WATER PRIVATISATION

43
.....................................................................................................................................
Who has allowed them to make profit out of thisnatural resource (Joshi, 2003)?
The answer to shrinking water resources andgrowing needs, according to Thakkar, does not liein privatisation but in community participationand transparency on the part of the distributingagencies. Conservation efforts in India have beenpioneered not by the government but by thecommunity leaders like Anna Hazare and RajenderSingh. The irony, say Thakkar, is that while thegovernment claims that it does not have anymoney to make infrastructure improvements inthe existing maintenance and distribution system,it is willing to subsidise profits for the foreigntrade companies in the water sector.
It is like privatising national assets andnationalizing private losses. The country is beingsold and nobody has the courage to speak out.Why would a multinational invest in waterwithout expecting you to pay back several timedthe amount?
Nevertheless, Indian policy-makers justifyprivatisation as a necessary step for reforms in thewater sector. “Everyone looks at it as a naturalresource for which nobody should be asked topay. The problem is that the water, which reachesyour house has to be first taken to the treatmentplants, has to be treated and then piped to homes.All this costs money. Where is that going to comefrom?” says Planning Commission (Joshi, 2003).
Access to a fair share of clean, healthy water is abasic human right and indeed the basis of ourexistence. According to the World HealthOrganization, 60 per cent (3.6 billion) of theworld’s population lacks access to essentialsanitation facilities. It is estimated that in the nextquarter of the century, the proportion of theworld’s population living in countries withsignificant water-stress could rise from 34 per cent(1995 figures) to 63 per cent. This would mean thatwater related conflicts would increase, ascommunities try to fulfil their basic needs.
Although, less than ten per cent of the world’swater systems are currently under private control,
at the present rate it is possible that the top threeMNCs, i.e., Suez and Vivendi of France and RWE-AG of Germany, alone will control over seventyper cent of the water system in Europe and NorthAmerica in a decade.
Vivendi that earned $ 5 billion a decade ago in itswater related revenues had increased its profits toover $ 12 billion by 2002. RWE, which moved intothe world market, with its acquisition of Britain’sThames Water, increased its water revenue by awhopping 9,786 per cent in ten years. All three areamong the top one hundred corporations in theworld. Together, their annual revenue in 2001 wasalmost $ 160 billion, and is growing at ten per centa year – outpacing the economies of manycountries in which they operate. They also employmore staff than most of the governments (Barlow,2003).
The state has a great duty vis-à-vis distributionof drinking water. Our rivers are sacred, sotoo our lakes and dams, which serve several socialuses. Aqua robbery by corporates is becomingcommon. The core principle of the public law isthat the state is a trustee of all natural resourcesand is under a legal duty to protect them. Theseare resources and are meant for public useand cannot be converted into private ownership(Iyer, 2003).
The ancient Roman Empire developed a legaltheory known as the “Doctrine of Public Trust.”The public trust doctrine primarily rests on theprinciple that certain resources like air, sea, waterand the forest have such a great importance to thepeople as a whole that it would be whollyunjustified to make them a subject of privateownership. The said resources being a gift ofnature, they should be made freely available toevery one irrespective of the status of life. Thedoctrine enjoins upon the government to protectthe resources for the enjoyment of the generalpublic rather than to permit the use for privateownership or commercial purpose.
The Ganga or Narmada belongs to the people andthe state cannot abandon its fiduciary obligation.It is unconstitutional, unethical and violative of

44
.....................................................................................................................................
human rights to sell or negotiate disposal ofpublicly owned water resources for mineral waterrackets by industrial giants. Equally dangerous,mischievous and mala fide are permissions grantedto macro corporates to dig dam to the bowels ofearth, pump up waters in enormous quantitiesand leave the lakes and neighbouring wellsdeprived of the blessing of nature.
Serious questions are raised when the publicproperties are given to the corporations. Publicfunds bear the burden of public accountability(Dhawan, 2003).
Water and international financial institutions (IFIs)like the World Bank, Asian Development Bankand IMF have required developing countries toopen up their water distribution to private sectorinvestment and foreign companies as a conditionof rescheduling debt. Bolivia, for example, had toaccept comprehensive water privatisation as acondition of receiving new loans. And it doesn’tstart or end with just drinking water. Large damsare mostly built with the support (or pressure) ofIFIs like Asian Development Bank, affecting notonly drinking water but also the livelihoods andhomes of hundreds of thousands of people.
The IMF and the World Bank, along with otherfinancial institutions, support a ‘full cost-recovery’principle. Financing criteria favour multi-utilityservice providers from many developmentproviders, and this is also influencing thedevelopment of the water multinationals takingover other sectors.
As no one can survive without water, themultinational water companies have discovered aprofitable market. The biggest multinational watercompanies come from Europe – Vivendi, Suez-Lyonnaise, Thames Water.
These companies have a record of corruption andbribery, pollution, and ignorance for the healthand safety of both their employers and theircustomers. Extensive interlinks exist betweenexecutives from major water companies, thegovernment and other sectors, mainly bankingand international finance.
Vivendi is the world’s largest water serviceprovider through its subsidiary, Generale des Eux,and operates in 90 countries. Suez Lyonnaise desEaux has operations in 120 countries, supplyingwater to 72 million people. The water industry isexpanding rapidly the range of their activities andthe geographic reach of their services.
Main strategies of entry
• Entering into public-private partnership orjoint venture with an institution on the desiredregion. For example, Vivendi and RWE Groupbecame major parties in 1999 in a consortiumcovering 49.9 per cent privatisation of BerlinerWasserbetriebe, resulting in the largest watersector privatisation company.
• Buying a share in an existing entity in desiredregion and eventually turning it into a whollyowned subsidiary. Vivendi has made it veryclear that it wants to acquire other watercompanies’ assets and operate them.
• Buying smaller operations that haveestablished a presence in a geographic regionor have developed new technologies.
Target areas within the water sector
The corporations are targeting four areas withinthe water sector. They are:
Water and waste,
Water services,
Water treatment, water-related construction andengineering,
Innovative technologies.
This can be targeted in several ways, such asdeveloping internal capacity by acquiringsubsidiaries with expertise; developing formalpartnerships with other multinationals in othersectors; and entering joint ventures or one-contractpartnerships with corporations in other sectors towork on individual projects.
Because of the management complications of bigcompanies, many a times regional governments

45
.....................................................................................................................................
maintain ownership because of the corporation’slack of necessary regional knowledge and wish toretain involvement in the former public sectorprojects. But more often, exclusive control is givento the corporation. Virtually, all successfulinternational efforts to privatise water have focusedon privatising the ownership of the existinginfrastructure; a growing trend is to attain rightsto water access.
WTO and Water
Water is treated as a service, under the GeneralAgreement on Trade in Services (GATS) underWTO – water distribution and collection, wastewater and so on. Under the WTO, water would bemerely a tradable service. Among other problemsarising, water is an essential part of agriculture,but not discussed within that framework. Insteadof ministries and other bodies working withagriculture, rural development and so on, tradenegotiators and multinational corporationsformulate water regulations. MNCs are notinterested in water availability for small farmersand communities but simply of making moreprofits, selling their services as the solution to theworld’s water problems.
By subjecting water access to market trends andWTO decision-making processes, an agreementlike GATS is likely to exacerbate the world’s waterproblems. Minority interests – mostly those ofglobal corporations and foreign investors – wouldtake precedence, with potentially devastatingimplications for fragile ecosystems and the poorcommunities.
Water as such is not a part of the current GATSagreement. The European Commission (EC) hasnow introduced a clause on “environmentalservice” with dead-end environmental services towhisk problems under the carpet instead of takingprecautionary measures. The forces behind thisare as described before, water MNCs lobbyingbehind the scenes in the European Commissionand also USA. Key players are the likes ofEuropean Services Forum and US Coalitions ofService Industry that almost dictate the tradepolicy according to their needs.
European Commission
Leaked documents from the European Commissionrevealed an ambitious agenda for servicesliberation. EC is requesting WTO Members toopen up a whole of sectors, including water as‘environmental service.’
Requests concerning the water sector made toSAARC countries including India, Indonesia,Malaysia, Pakistan, Philippines and Thailand alldealt with water collection, purification anddistribution services through mains, except steamand hot water; wastewater services and treatment,remediation of contaminated/polluted water.
Most Favoured Nation treatment
National treatment is one of the core principles inthe World Trade Organization. It means thatdomestic and foreign companies should be givenequal treatment, i.e., the same benefits. Conditionsof competition should not be in favour of Member’sdomestic services industry. Another core principleis the Most Favoured Nation (MFN) treatment,which means that members must give othermembers’ “treatment no less favourable than thataccorded to like service and service suppliers ofany other country.” MFN treatment prohibitspreferential arrangement among groups of MemberStates in certain sectors or of reciprocity provisions,which confine access benefits to trading partnersgranting similar treatment.
Thirsting for Profits
The Global Corporates are thirsty for profit asshown by the following examples (INSAF, 2002):
• The World Bank estimates the global marketfor water to be worth $ 800 billion.
• The price of one litre bottled water coulddeliver 3,000 litres of tap water to homes.
• Ten corporate giants are vying for control,including French based corporation Vivendi,Suez-Lyonnaise des Eaux and Bouygues (Saur);US based Enron (Azurix); German based RWEGroup; and UK based companies Thameswater, United Utilities, Severn Trent, AnglianWater, and the Kelda Group.
46
.....................................................................................................................................
• Four of the top 10 water companies are rankedamong the 100 largest corporations in theworld by the Global Fortune 500: the RWEGroup (no. 63), Vivendi (no. 69), Suez-Lyonnaise (no. 70) and Enron (no. 85).
• Vivendi and Suez-Lyonnaise are consideredthe General Motors and Ford Motor in theglobal water industry. Suez operates in 120countries and Vivendi in 90 countries around.Together, US $ 10 billion out of their combinedrevenues of US $ 70 billion comes from waterservice alone.
• The global water industry is going throughconstant rapid changes. Between 1994 and1998, there were no less than 139 water relatedmergers and acquisitions. In 1999, the rate ofacquisitions and mergers reached record levels,including the acquisition by Vivendi of the USFilter Co., valued at over US $6 billion.
Externally Aided Projects in Urban WaterSupply and Sanitation in India
So far, 15 projects have been implemented withWorld Bank/French assistance. The Ministry ofUrban Development also supports external aidedprojects in the water supply and sanitation sector(Website of Ministry of Urban Development andPoverty Alleviation, Government of India, 26December 2002). Currently, 19 projects are indifferent stages of Implementation. The details arein tables 7.1 and 7.2.
Some Myths and Reality
World Over, WTO and the World Bank have beenpushing for privatisation of water, as in othersectors. In India too, there is a strong push in thatdirection. For example, in States like UP, Karnataka,Maharashtra and Rajasthan, various World BankProjects are pushing in this direction. In States likeGujarat, Madhya Pradesh, and Chhattisgarh, AsianDevelopment Bank is pushing in this direction.
Following are some examples (of course, there canbe more such instances) to show the reality asagainst the myths propagated in support of watersector in WTO agenda (A dossier by South AsiaNetwork on Dams, Rivers and People, Delhi).
Myth 1: New Policies (NP) would increaseinvestments in the sector.
Reality: The Portuguese government financed thebuilding of a new water treatment plant inMatsulu, Nelspruit. The South African Governmentconstructed it, and operated it for one year. Afterthis it was given as a gift to the water multinational,Biwater as per the understanding. The MNC iscurrently increasing prices in Nelspruit, eventhrough this company contributed nothing to theproject.
Myth 2: NP would lead to more efficientWater Sector.
Reality: The people of Nairobi, Kenya, for example,were forced to fork out over R (Rands) 160 millionwhen Nairobi’s water was privatised to Frenchmultinational, Generales Des Eaux. Soon after thecompany, they decided to install a new (but notbudgeted for) R 1.5 billion billing and revenuecollection service. Although the Mayor complained,the company proceeded and put water prices upby 40 per cent in order to pay for the new system.During this time, 3,500 municipal workers werereplaced by 45 foreign staff who earned massivesalaries from a total R 13.6 million in the secondyear of the contract, rising to R 31.2 million peryear by the end of the contract.
Privatisation of water was also found bad for thepoor of Guinea. Before privatisation in 1989, fewerthan 40 per cent of the urban population hadaccess to piped water. The Government was shortof funds and needed donor finance. Privateparticipation was a condition of World Banklending. The work force was cut almost in halfform 504 employees to 290 and right afterprivatisation, water prices were increased. Theconnection rate rose only by 9 per cent by 7 yearsleaving over 30 per cent of Guineans still withoutwater. The high price of water meant people couldnot afford to get connected; it was difficult foreven wealthy people to pay.
Myth 3: NP would provide clean water.
Reality: The most recent example is the WorldBank’ role in creating the conditions that caused
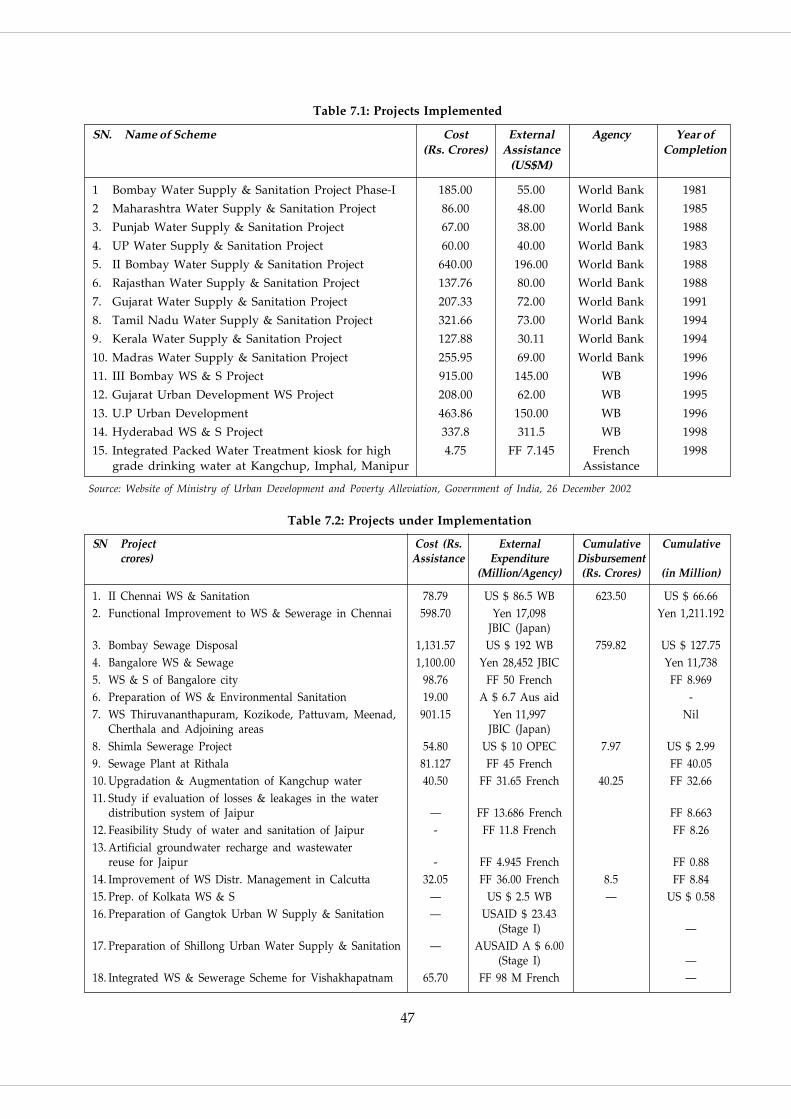
47
.....................................................................................................................................
Table 7.1: Projects Implemented
SN. Name of Scheme Cost External Agency Year of(Rs. Crores) Assistance Completion
(US$M)
1 Bombay Water Supply & Sanitation Project Phase-I 185.00 55.00 World Bank 1981
2 Maharashtra Water Supply & Sanitation Project 86.00 48.00 World Bank 1985
3. Punjab Water Supply & Sanitation Project 67.00 38.00 World Bank 1988
4. UP Water Supply & Sanitation Project 60.00 40.00 World Bank 1983
5. II Bombay Water Supply & Sanitation Project 640.00 196.00 World Bank 1988
6. Rajasthan Water Supply & Sanitation Project 137.76 80.00 World Bank 1988
7. Gujarat Water Supply & Sanitation Project 207.33 72.00 World Bank 1991
8. Tamil Nadu Water Supply & Sanitation Project 321.66 73.00 World Bank 1994
9. Kerala Water Supply & Sanitation Project 127.88 30.11 World Bank 1994
10. Madras Water Supply & Sanitation Project 255.95 69.00 World Bank 1996
11. III Bombay WS & S Project 915.00 145.00 WB 1996
12. Gujarat Urban Development WS Project 208.00 62.00 WB 1995
13. U.P Urban Development 463.86 150.00 WB 1996
14. Hyderabad WS & S Project 337.8 311.5 WB 1998
15. Integrated Packed Water Treatment kiosk for high 4.75 FF 7.145 French 1998grade drinking water at Kangchup, Imphal, Manipur Assistance
Source: Website of Ministry of Urban Development and Poverty Alleviation, Government of India, 26 December 2002
Table 7.2: Projects under Implementation
SN Project Cost (Rs. External Cumulative Cumulativecrores) Assistance Expenditure Disbursement
(Million/Agency) (Rs. Crores) (in Million)
1. II Chennai WS & Sanitation 78.79 US $ 86.5 WB 623.50 US $ 66.662. Functional Improvement to WS & Sewerage in Chennai 598.70 Yen 17,098 Yen 1,211.192
JBIC (Japan)3. Bombay Sewage Disposal 1,131.57 US $ 192 WB 759.82 US $ 127.754. Bangalore WS & Sewage 1,100.00 Yen 28,452 JBIC Yen 11,7385. WS & S of Bangalore city 98.76 FF 50 French FF 8.9696. Preparation of WS & Environmental Sanitation 19.00 A $ 6.7 Aus aid -7. WS Thiruvananthapuram, Kozikode, Pattuvam, Meenad, 901.15 Yen 11,997 Nil
Cherthala and Adjoining areas JBIC (Japan)8. Shimla Sewerage Project 54.80 US $ 10 OPEC 7.97 US $ 2.999. Sewage Plant at Rithala 81.127 FF 45 French FF 40.0510. Upgradation & Augmentation of Kangchup water 40.50 FF 31.65 French 40.25 FF 32.6611. Study if evaluation of losses & leakages in the water
distribution system of Jaipur — FF 13.686 French FF 8.66312. Feasibility Study of water and sanitation of Jaipur - FF 11.8 French FF 8.2613. Artificial groundwater recharge and wastewater
reuse for Jaipur - FF 4.945 French FF 0.8814. Improvement of WS Distr. Management in Calcutta 32.05 FF 36.00 French 8.5 FF 8.8415. Prep. of Kolkata WS & S — US $ 2.5 WB — US $ 0.5816. Preparation of Gangtok Urban W Supply & Sanitation — USAID $ 23.43
(Stage I) —17. Preparation of Shillong Urban Water Supply & Sanitation — AUSAID A $ 6.00
(Stage I) —18. Integrated WS & Sewerage Scheme for Vishakhapatnam 65.70 FF 98 M French —

48
.....................................................................................................................................
the current cholera epidemic in South Africa.
Myth 4: NP would provide equitable accessto water.
Reality: The World Bank’s insistence on full costrecovery service cut-offs to those unable to payforced a number of communities to access uncleanwater sources in South Africa recently.
The World Bank has funded some rural waterschemes in Ghana. These have failed because theBank demanded that rural communities payupfront cash amount towards constructing thewater system. “The policy has resulted in excludingpoor communities incapable of paying fromenjoying their right to consume potable water,”says the CAP-Ghana of Water.
Myth 5: NP would provide sustainable waterservices.
Reality: Biwater, which privatised Nelspruit’swater, withdrew from a Zimbabwean waterprivatisation project when it became clear thatcitizens could not pay the tariffs that would berequired for Biwater to make a profit.
Myth 6: NP would mean less corruption.
Reality: The World Bank’s preference for massiveprojects led to the exceedingly and unnecessaryexpensive (and fatally corrupt) Lesotho Highlandsdam project, which caused water price to jump,forcing even more communities to be a cut off.Twelve multinationals are being prosecuted forpaying bribes in connection with huge waterengineering contracts for the water supply scheme.[The trial began in Lesotho Government for whatis expected to be a very complex and costly trial.]
In France, the home of ‘delegated management’(the World Bank’s favourite form of privatisation),the major multinationals have been convicted ofbribery. In Milan, in neighbouring Italy, police areinvestigating politicians’ alleged role to havereceived bribes from a private company for aconcession to build a new sanitation plant.
In Indonesia (during the infamous Suharto’sregime), Jakarta’s water was privatised through a
French and a British consortium: both were inpartnership with companies owned by Suharto’srelatives and cronies.
Some of the World Bank Researchers note: “Ourempirical research provides clear evidence of theimportance of public procurement corruption,defined as efforts to secure public contractsthrough payment of kickbacks to officials, as anoft-used channel of influence as well .…theextent to which firms with foreign directinvestment and transnationals are also involvedin playing public procurement kickbacks andengaged in other forms of corruption....Conventional recommendations of economicand trade liberalization advocated to addressadministrative corruption will not suffice.”
The two dominant water multinationals, Suez-Lyonnaise and Vivendi, are convicted in corruptioncases.
Myth 7: NP would make water sectoreconomically viable.
Reality: The World Bank’s preference for massiveprojects led to the exceedingly and unnecessaryexpensive (and fatally corrupt) Lesotho Highlandsdam projects, which caused water prices to jump,forcing even more communities to be cut off.
Myth 8: NP will create competitive market,to the advantage of consumers.
Reality: Water and Sanitation sectors by their verynature create monopolies in their respective serviceareas.
There are only four European multinationals thathave the monopoly worldwide on water for profit.One of these, French Vivendi, has recently startedraising water prices in the poorest countries of theworld because they need extra cash to inject intoa Hollywood studio they acquired recently.
Myth 8: NP has been successful elsewhere.
Reality: In Europe, water privatisation has beenfailing for decades, and in several towns water hasbeen “re-municipalised” or taken back fromwhichever multinational messed up the service.

49
.....................................................................................................................................
In Africa, recent research conducted by London-based Greenwich University’s Public ServiceInternational Research Unit uncovered that wherewater was privatised, it was as disastrous as theEuropean experience.
Elements of Water Supply Privatisation
Privatisation of water supply can involve any orall components from the source of water (say adam), filtration and distribution, to the collection,treatment and disposal of wastewater andsewage. Hence the term normally used is WaterSupply and Sanitation (WSS). The privatisationitself can be at various levels and of varioustypes. A brief summary is given below(Dharmadhikary, 2002):
Service Contracts – Involves short-term contractsfor provision of specific services. For example,metre reading and billing. No financial risks areinvolved, and also there is no direct legalrelationship with the consumer.
Lease / Management Contract – As the namesuggests, either the private company leases out ofthe facility from the civil authority, or the latterappoints the company for managing the facility. Ineither case, the ownership remains public; privatecompany is normally not responsible for newinvestments or expansion. Some commercial riskis involved in so far as day-to-day operations areconcerned.
BOOT Contracts – Build, Own, Operate andTransfer Contract in which the private companybuilds some part of the infrastructure - say thetreatment plant, or filtration plant – and runs it fora regular charge on the system. Normally, thesewould be long-term contract, with a purchaseagreement that would guarantee a minimumdemand (the equivalent of the “take-or-pay”clause of Power Purchase Agreement (PPAs) in thepower sector).
Concessions – Long term contracts in which theprivate company takes full charge of the system,takes responsibility for the provision of the serviceand is also responsible for expansion, newinvestment, recover of bills, etc.
Divestures – Where the Government divestsits equity in a utility that is then bought offby a private company. This may be full or partdivesture.
In most cases, the establishment of an independentregulator, whose functions normally include settingthe tariffs, is a part and parcel of privatisation.
While the private sector participation in watersupply is just beginning in India, it has beenextensive in Latin America and Southeast Asia.What are the implications of the privatisation ofwater supply? To understand this, we need to lookalso at the experience of water privatisation inother countries.
Bolivian Experience in Water Privatisation
It is unlikely that many would have heard ofCochabamba before 1999. Till this time, the citywas probably best known for the El Cristo de laConcordia, an immense statute of Jesus Christ,higher than the Cristo del Corcovado in Rio deJaneiro in Brazil. The beautiful Andean city ofCochabamba in Bolivia lies in a fertile valley at2,558 metres above sea level, surrounded by theTunari hill, the Alalay lagoon and the San Sebastianhill (Dharmadhikary, 2002).
In 1999 began the story that was to bring adifferent sort of notoriety to Cochabamba. In 1999,the whole system of water supply for this city washanded over to a consortium of private companiescalled Aguas Del Tunari, led by the Americancorporation Bechtel. The water supply system inthe city was in a mess, plagued by chronicshortages, and most of the poorest neighbourhoodsdid not have access to piped supply. Privatisationof water supply was projected as the only solutionto solve its many problems. Brought in with theintention of improving the water supply in thecity, Aguas Del Tunari was given extraordinaryspecial considerations to attract it to invest in thecity.
The Rs.12,500 crores concession (contract) was for40 years, and assured the company a rate of returnon investment of 15 per cent, linked to the

50
.....................................................................................................................................
consumer price index of the USA. It also gave thecompany full rights to all the water in the district.The immediate result was that the water chargeswere doubled, and then trebled. On the outskirtsof the city, some of the communities had built theirown cooperative water supply systems based oncommon tube wells and distribution networksabout 5 years before the concession was signed.Aguas Del Tunari was given the right to installmetres on the wells of these community systems,and not only that, charge the people for the metrestoo. The rapidly rising prices resulted in theaverage worker being charged about 25 per centof his/her salary as the monthly water bill As theprices rose, the company declared – without anyhesitation or remorse – that it would disconnectall those who could not pay for the water.
As the anger spread, the people took to the streets.The crowd captured the central plaza in the city.Instead of mediating between the people and thecompany, the Government brought in the army tosuppress the people. The main leaders of themovement were arrested. The struggle becamemore intense – people started calling it la Guerradel aqua – the Water Wars. One day in April 2000,as the army confronted the people, a 17 year-oldboy, Victor Hugo Daza was killed. This was theturning point in the struggle. There was nolooking back after this, and the company finallyhad to leave the country.
A Jolt and a Wake Up Call
Cochabamba came as a huge shock to thoseadvocating privatisation of water supply. Sinceabout a decade and a half, the winds ofprivatisation and globalisation have been blowingall over the world. Around the globe, sectors thathave traditionally been in the public domain arebeing privatised. These include power, transport,railways, insurance, and water.
The company has now filed an arbitrationproceeding in the International Centre for theResolution of Investment Disputes (ICSID), adispute resolution mechanism created by andlocated in the World Bank. Aguas Del Tunari /Bechtel is suing Bolivia for 25 million US dollars
(Rs.120 crores) for losses. The proceedingsin this Centre are carried out in total secrecyand the common people, including peopleaffected/to be affected by its decision haveno say. Further, Bechtel has resorted to fudging totake its claims to this centre. It has claimed itselfto be a Dutch Company to take advantage of aBolivia-Dutch treaty, which invokes the ICSID incase of any trade dispute. Bechtel shifted itsregistration to Holland only after the Cochabambaconcession was signed. In early September 2002,several hundred organisations from all over theworld wrote to the World Bank to conduct theproceedings of this arbitration in public, andallow the people of Bolivia to become parties tothe proceedings.
Structural adjustment programmes have forcedcountry after country to adopt the programme ofLPG – Liberalisation, Privatisation andGlobalisation. It is being argued that LPG is theonly path to economic development. The reasoninggiven for this is that the Governments no longerhave the funds required for the huge investmentsnecessary in these sectors. Further, Governmentshave proved to be inefficient, corrupt andmust make way for the more efficient privatesector.
Since water is such a vital part of the economy andinfrastructure, it is not surprising that there hasbeen an enormous push for the privatisation ofwater services. As a result, in many parts of theworld, the water sector has seen large-scaleprivatisation. The events in Cochabamba came ashard reminder that the rosy picture of privatisationof water services also had plenty of thorns. AndCochabamba is not an isolated case. As it happenedin Cochabamba, it also helped focus the world’sattention on many similar, albeit not so dramatic,cases.
Past few years have seen growing push in Indiafor bringing in private companies in a big way inthe water sector. This privatisation of the sectorraises a large number of issues. It is necessary thatthis be preceded by intense debates, discussionsand in-depth examination. Otherwise, who knowshow many Cochabambas may take place in India?

51
.....................................................................................................................................
Failure of Water Privatisation in Manila
The privatisation six years ago of Manila’s 120years old Metropolitan Waterworks and SewerageSystem (MWSS) was the world’s first and largestsuch effort. International funding agencies havesince upheld the Manila System as a success storyurging other Asian countries to adopt the model.
But if the Philippine NGOs like Freedom fromDebt Coalition and the Institute for PopularDemocracy are to be believed, Manila is a basketcase of privatisation’s failure. While the watersupply has improved for the city’s wealthy, tariffshave skyrocketed 150 per cent. Many communitiesdo not have water connection. The privatecompanies are not concerned about waterconservation and have reneged on theircommitments (Chinai, 2002).
The privatisation of MWSS was carried out,notwithstanding opposition from civil societygroups, among them the Freedom from DebtCoalition (FDC). Among the issues raised by FDCwas the nature of water as a service, not a sourceof money. FDC views water as too important aresource to risk giving its provisioning tocorporations whose primary motive is profit. Thisis further exacerbated by the Philippinegovernment’s lack of a credible regulatory capacityand its political system’s malleability and beingopen to capture by vested interests.
The people’s wariness against the turning over ofwater provisioning to private hands was drownedout when the results of the bid were announced.Maynilad submitted a bid of P 4.96/cum whileManila Water submitted P 2.32. The pre-privatisation rate of MWSS is P 8.78 per cubicmetre of water. Promoters of privatisation wereblowing their trumpets, proclaiming to the worldthe merits of privatisation (Freedom from DEBTCoalition).
MWSS five years later
Did privatisation succeed in bringing water to thepeople of Manila? Less than five years after theprivatisation of MWSS, the failure of privatisationwas for all to see.
Not even five years has passed after MWSS wasprivatised, the only tangible gain brought aboutby privatisation, low water rates, went in tatters.Maynilad, from its P 4.96 bid, is now charging itscustomers P 15.46 per cubic metre. How was thispossible? The Lopez-owned Maynilad was able toally itself with the MWSS Regulatory Office’sChief Regulator himself to push for an amendmentto the contract to allow them to increase tariff ratesthrough an automatic currency exchange rateadjustment (auto-CERA) mechanism. This wasdespite the fact that the auto-CERA mechanismhas no basis in the concession agreement.
Although the increases were not enough to causeriots, subsequent increases might. At an ongoingrate of raising process at MWSS, Maynilad isasking for a P 30.92 per cubic metre of water.
ADB and Maynilad
The Asian Development Bank (ADB), lender ofalmost half of the loans assumed by Mayniladwhen MWSS was privatised, pushed for thecontract revision, which will allow Maynilad toincrease water tariffs. It argued that the increaseswere necessary to make Maynilad viable. Thecontract was amended, tariffs increased, andpeople’s lives became harder, but Maynilad stillwants more rise in tariff rates.
Maynilad did not become viable. And ADB knowsit. The Bank now wants Maynilad to secure asovereign guarantee from the Philippinegovernment before it will release a $ 350 millionterm loan to the ailing water firm. What in effecthas happened is that the profits were privatisedwhile the risks remained with government andultimately, in taxpayers’ hands.
Private is not always better than publicsector
When government privatised MWSS, it was withthe steadfast belief that the private sector can dowonders for the water sector because it will makethe MWSS run efficiently.
In the view of Maynilad, the company should haveregistered profits starting 1999. Instead, Maynilad

52
.....................................................................................................................................
is losing, and losing big. In the year 2000, they weresupposed to earn P 604 million but actually incurredP 2.4 billion in losses. In 2001, instead of earningP 477 million, they lost P 1.037 billion.
Why? Because of high non-revenue water (NRW).According to their targets, NRW should have beendecreased to around 30 per cent by 2001 from 57per cent in 1997. Instead, NRW ballooned toalmost 66 per cent. Maynilad is also losing bigbucks because of the firm’s inability to efficientlycollect water tariffs.
Worse, Maynilad is squandering its money not oncapital expenditures such as laying pipes but onthe salaries of its pampered executives, bothforeign and local alike. It has also incurred veryhigh advertising costs.
Indian Experience: Agitation in Sivaganga
People in Sivaganga in Tamil Nadu are agitatingagainst a soft drink maker’s plans to exploit largeamount of water from the region, which is alreadyfacing water scarcity. On 28 April 2003, more than7,000 people participated in a rally against SakthiSugar Mills at Padmathur. The sugar mill hasentered into a contract with the soft drink makerto prepare and package some of its products,using its groundwater resources, 75,000 litres aday. Unlike at Plachimada in Kerala where theresentment among the local people manifested asan angry protest only three years after the bottlingplant began operation, the agitation in Sivagangais a pre-emptive one (Viswanathan, 2003).
The plant will have a production capacity of 600bottles per minutes; the packaging units mightresort to indiscriminate exploitation ofgroundwater, which would lead to scarcity ofwater for drinking and irrigation purposes. Theunit had plans to dig bore wells up to a depths of3000 ft. on the Vaigai river bed, besides using theunutilised part of the quantum of water permittedspecifically for industrial use by sugar mill, whichis 49 lakhs litres a day.
The plant would affect the water supply toSivaganga, Manamudari, and Thiruppuvanam
towns and about 80 villages. The effluents let intoa canal during actual run of the unit caused thedeath of couple of cows and some sheep in avillage close to the factory.
In the Thiruppuvanam panchayat union, wherethe wells of the Sugar mills are located, thegroundwater reserves have fallen significantlyfrom 13,351 hectares metre in 1985 to 7,463hectares metre in 1992. The intensity of groundwater extraction has increased rapidly. Thequantum of water, drawn as a proportion of thewater remaining underground, increased fromthree per cent in 1985 to six per cent in 1992.
Water Privatisation in Palakkad Districtof Kerala
Coca-Cola and Pepsi, arch-rival and thirst-bustersfor millions worldwide, have found commoncause in Kerala against protest groups agitatingagainst the way the bottling units of the twomultinationals are depleting and pollutinggroundwater resources to the detriment of peoplein the drought-prone district of Palakkad (Kumar,2003).
Within two years of its inauguration, and especiallysince April 2002, protests had become a regularfeature in front of the Coca-Cola unit inPlachimada, as several places in Chittur taluk,including 10 colonies of Dalits and tribal people,began to experience a severe drinking watershortage. Despite the company’s claims that theunit is a “greenfield soft-drink bottling factory,”where a major share of the water not bottled, isrecycled and used to recharge the groundwater,residents of surrounding villages continued tocomplain that indiscriminate extraction ofgroundwater had dried up many wells andpolluted several others.
The company’s initial attempts to provide waterin truckloads to some of the affected villages wasnot appreciated, and the agitators continued todemand that it should take steps to restoregroundwater aquifers and ensure continuouswater supply in the affected villages, or face theprospect of closure.
53
.....................................................................................................................................
Ironically, the bottling unit was established in2000 on 38 acres (15.2 hectares) of mostly multi-cropped agricultural land, barely 2 kms awayfrom the river Chitturpuzha and near a numberof reservoirs and irrigation canals. Until recently,according to the protesters, every day the companydrew nearly 1.5 million litres of groundwater andabout 85 truckloads of products left the factorypremises.
A study conducted by some well-knownenvironmentalists, and members of the KeralaSastra Sahitya Parishad (KSSP), too had warnedthat the extraction of groundwater by Coca-Colaat the current rate would stem the possibility ofgroundwater recharge and lead to deficient rainfallpattern of the region. The report also warned ofdeterioration in the quality of groundwater as aresult of over-exploitation. The State governmenthad refused to take note of the plight of thevillagers or to ask the company to curtail theextraction of groundwater.
The Pudusseri Panchayat has cancelled the licenseof Pepsi unit, because the people of the village andsurrounding areas had experienced one of theworst instances of water scarcity this year. Therewas a severe shortage of drinking water. Whileearlier there was enough water to operate thepumps for four to five hours a day, this year thepumping had to stop in less than an hour. Thepanchayat had examined these factors in detailand found that the Pepsi unit had been indulgingin over-exploitation of groundwater sources, giventhe general drought situation prevailing in thearea.
Privatisation of Water: The Tiruppur Case
Tiruppur has entered into the global map byvirtue of the fact that the knitwear industrieslocated in this town contribute to Rs.4,500 croresevery year by way of foreign exchange. Tiruppur,the largest producer of knitwear products inIndia, is located in Coimbatore district in westernTamil Nadu. The population of this town is about255,000. This town however starves due toinadequate water for both industries as well as fordomestic uses. Agriculture is also badly affected
and stressed due to lack of water. This region doesnot have any perennial water supply from surfacesources. The groundwater is depleted with waterdropping up to 1,200 feet in many parts of thedistrict.
New Tiruppur Area Development CorporationLtd. (NTADCL), a company is initiated to supplywater to the industries of Tiruppur town and tothe domestic users. This is a project in which manyagents are participating. They are Tamil NaduGovernment, Tiruppur Exporters’ Association(TEA), Tiruppur Municipality, InfrastructureLeasing and Financial Services Ltd. (IL & FS), theTamil Nadu Corporation for IndustrialInfrastructure Development Ltd. (TACID),NTADCL and Indo-US Financial InstitutionsReform and Expansion (FIRE) Project. This projectaims to supply 185 million litres of water per dayfrom Bhavani river to cater to the needs of about100 dyeing and bleaching units located in this areaas well as to supply water to 1.6 million peoplelocated in the Tiruppur municipality and theadjacent Panchayats. The detailed projectcomponents are the following (Janakrajan, 2003):
• Treated piped water supply of 60 million litresper day (MLD) to Tiruppur municipality and21 adjoining towns and village panchayats.
• Treated water supply of 100 MLD to over 700dyeing and bleaching industries within theTiruppur Planning Area.
• A sewerage system for Tiruppur.
• Onsite sanitation facilities for 88 designatedslum areas within Tiruppur municipality.
NTADCL will be responsible for transmission,treatment of water supply, distribution of wateroutside municipal limits where most of theindustry is located, treatment of the collectedsewage and maintenance of the sewage treatmentplants.
Resource mobilization of the project: Basically,TEA, TACID and IL & FS together are responsibleto design and execute the project. Therefore, apublic limited company called New TiruppurArea Development Corporation (NTADCL) was

54
.....................................................................................................................................
formed in 1995 to see through the project. TheNTADCL will contract out the construction andmaintenance of the system to a Build, Operate andTransfer (BOT) consortium, which is the MahindraConsortium (Mahindra & Mahindra, UnitedInternational, North West Water, and Bechtel).USAID has provided long term (30 years) loanguarantees for US $ 25 million with IL & FS to helpfinance this project. Total estimated cost of theproject is Rs.12 billion of which equity share ofRs.3.9 billion will be contributed by the UnionGovernment, IL & FS, the Tamil Nadu Corporationfor Industrial Infrastructure Development, theTiruppur Exporters Association and the Mahindra-led consortium. The project has a debt componentof Rs.6.98 billion and a subordinate debt of Rs.750million.
The project is supposed to be in full operationwithin six years. It is boasted that this is the firstpublic-private partnership project to accesscommercial funds for the water sector in India.The Tiruppur experiment is going to be thebenchmark for private initiatives in the sector andit will build a strong case for private financing ofwater projects in India in the future.
Treatment of effluent generated by the industriesis not taken care of by the company. One of theimportant processes in the making of knitwearproducts is dyeing and bleaching. This particularprocess not only consumes enormous quantity ofwater, but almost the same quantity of water isdischarged as effluent. The major part of effluentis discharged into the Noyyal river and to asignificant extent in other small streams such asNallar and Jamunai rivers. The available evidenceconfirms that the effluents discharged by theseunits are quite hazardous causing serious healthproblems. This is evident from the type and extentof chemicals used in the bleaching and dyeingprocesses. The estimated water requirements ofthe bleaching and dyeing units in Tiruppur isabout 120 million litres per day (mld) of whichabout 60 per cent is met by groundwater astransported by the tanker-trucks from the ruralneighbourhood. What is really disturbing is thefact that a comparable quantity of water is let out
as effluent in the Noyyal river and other streams,which has already caused permanent damage tothe river, top soil and most important of all, thegroundwater.
Even 30 years earlier, the local textile operatorshave confirmed that groundwater is contaminatedaround the areas where dyeing and bleachingunits discharge their effluents. In the absence ofany perennial source of surface water, thevillages around Tiruppur entirely depend upongroundwater for agriculture. As groundwater iscontaminated, agriculture as the key occupationseems to have been abandoned in many villages.
The Government of Tamil Nadu has constructeda dam across this river (called Orathapalayamdam) in the year 1992, about 10 kms below theTiruppur town, with a view to provide irrigationfor 8,000 hectares. This dam’s catchment area is2,245 sq. kms, which includes most of the area inwhich the dyeing and bleaching units are located.The construction of this dam has turned out to bea mockery and has resulted in the wastage ofpublic resources. This is simply because a largequantity of water (about 120 mld) consumed bythe Tiruppur dyeing and bleaching units isconveniently led into the Noyyal river (in the formof untreated trade effluent), contributing therebyto the ‘additional storage level’ of the dam. Thus,the dam effectively performs the role of a storagereservoir for the contaminated water, contributingquite significantly to the pollution of environment,in particular, groundwater. Unless 20,000 cusecs ofwater is released into the river Cauvery, a majorriver into which Noyyal joins in the downstream.The release of water from the Orathapalayam damwould be extremely harmful to the crops, soil,animals and groundwater.
In February 1997 when there was no appreciableflow in the river Cauvery, the water from theOrathapalayam dam was released with a view tominimize the damage to the villages aroundthe dam. Since the dam was opened withoutany prior public notice, it resulted in a great havocto crops, animals, soil and groundwater.This polluted water of the Noyyal river joined

55
.....................................................................................................................................
Cauvery 32 kms down the Orathapalayam dam.It is reported that the water quality remainsbad even at 300 feet depth, rendering it unfit evenfor irrigation.
If the new water company in Tiruppur bringsadditional water (185 million litres per day), thepollution threat is going to escalate further. Theexisting common effluent treatment plants (CETPs),a total of eight, hardly function but satisfy theSupreme Court order. Further, these CETPs arenot designed to treat the TDS, which is the biggest
pollutant. Since the treatment system is veryexpensive, no industry is willing to treat theeffluent. Therefore, the new company will poseadditional problem by bringing more water to thetown.
The other problem related to the Water Companyis fixing of the price of water for the domesticusers. The rates are not decided so far but it goeswithout saying that the new rates for water isgoing to adversely affect the common man in theregion.

56
.....................................................................................................................................
Privatisation is based on the logic of full costrecovery. This means the introduction of fees
for the service of the end-user, which the state cansubsidise if it can afford to, and liberalization ofmarkets, removing trade barriers and tariffs, andinvariably resulting in increased privatisation(Dossier by South Asia Network on Dams, Riversand People, Delhi). This also means that theyshould recover full cost invested in theinfrastructure, payment of the salaries to the staff,costs involved in the maintenance and the hugeprofits. These corporates are never tired ofpreaching the principle of “full cost recovery”over the investment. These corporates shouldsearch their conscience before preaching the poorcustomers to pay the full cost of their investment.
“The Ganga, which is our mother, has become ourgraveyard,” laments the people. Privatisation ofwater denies local communities their water rightsand access to water in two ways. Firstly, the scarceand limited water resources are diverted, from thepoor to the rich, from the countryside to towns,from agriculture to industry leading to waterfamines where people have no purchasing power,and providing water to those who have destroyedwater resources through waste and pollution.Secondly, the state itself shifts from its function inproviding welfare to the needy and mostmarginalized communities to the new function ofproviding public subsidies for private profits.Scarce and limited public finances are diverted toMNCs like Suez and corporations like JP, which is
building the Tehri dam. Small decentralized ruralschemes are starved of both water resources andfinancial resources.
The citizens of India are paying Suez eitherthrough high prices or through governmentguarantees. Suez owes the people of India afinancial debt and a social debt. The financial debtowed by Suez to the Indian people includes thepublic investment in the Tehri dam and the UpperGanga Canal of which Suez will become the solebeneficiary if the privatisation of Ganga watertakes place. Suez would also owe the compensationto the farmers for annual production losses theywill suffer.
In addition, the privatisation will cost social andecological destruction whose costs are impossibleto quantify and hence the social and ecologicaldebt is unpayable.
As said earlier, the 635 million litres per day(MLD) of Ganga water will be diverted from theUpper Ganga Canal to Delhi, which would affectthe agriculture potential of the canal and the foodsecurity of the region where the canal had beenirrigating since last 150 years.
Suez is not bringing in private foreign investment.It is appropriating public financial investment.Public-private partnerships are in effect privateappropriation of public investment. But thefinancial costs are not the only cost; there are othersocial and ecological costs as well.
VIII
A PUBLIC FULL COST RECOVERY CAMPAIGN:THE DEBT SUEZ OWES THE PEOPLE OF INDIA
57
.....................................................................................................................................
Suez-Degremont should pay Rs.158,149.31 croresof non-recurring money (one time amount) andshould pay about Rs.70,425 crores as non-recurringamount for the guaranteed period of ten years tothe farmers and other affected persons, asillustrated below:
A. Non-recurring Cost
i. Cost of constructing Upper Ganga Canalin 2004 (as explained in chapter IV)
= Rs. 147,456 crores
ii. Suez Degremont is the direct beneficiaryof Tehri dam. Therefore, Suez Degremontowes the responsibility to pay the full costinvested in the construction of Tehri damas well as the rehabilitation cost ofdisplaced persons. Suez Degremont shouldpay Rs.10,582 crores to the people of Tehrias explained below:
Cost of constructing Tehri Dam= Rs.10,000 crores
Rehabilitation Cost of the people displacedby Tehri Dam
= Rs.582 croresTOTAL (ii) = Rs.10,582 crores
iii. The cost of laying pipelines fromMuradnagar to Sonia Vihar (to be borneby the Public) = Rs.111.31 crores
Total non-recurring cost (A) = i + ii + iii =i.e., Rs.147,456 + 10,582 + 111.31
= Rs.158,149.31 crores
B. Recurring Cost
i. Upper Ganga Canal irrigates 924,000hectares in 13 districts in western UP. As
one hectare is 12.5 bighas, it irrigates924,000 x 12.5 = 11,550,000 bighas.
At an estimate, the per bigha income peryear = Rs.3,500
So, the total agricultural income fromUpper Ganga Canal
= 11,550,000 x 3500 = 40,425,000,000= 4,042.5 crores per year
ii. In the rural areas the farmers, particularlymarginal, small and medium farmers alsodo cattle rearing which is closely linkedwith the agriculture development. In all 13districts where the land is irrigated byUpper Ganga Canal, the earning from thecattle rearing is around 2,000 crores perannum.
iii. Besides, there are a large number ofpeople like Blacksmiths, Carpenters andothers, whose survival depends uponagricultural activities. There is also largenumber of landless labourers employed orhired by the farmers. It can be safelyassumed that the total earning of thesepeople is around 1,000 crores per annum.
Total recurring cost, i.e., annual income fromagriculture, cattle rearing, by artisans and landlesslabourers (i + ii + iii) = i.e., 4,042.5 + 2,000 + 1,000= 7,042.5 crores
For the guaranteed period of ten years the amountis Rs.7,042.5 crores x 10 = 70,425 crores
This is the basis of the full public cost recoverycampaign by the people of India against theprivatisation of Ganga by Suez.

58
.....................................................................................................................................
Aiyar, Shankar (2003): “Thirsty India,” India Today, 9 June.
Barlow, Maude (2003): “Water Democracy,” Resurgence(Devon, UK), July/August, No. 219.
Baxi, Amitabh and Shatanu Nandan Sharma (2003): “Potsof Problems,” The Economic Times (New Delhi), 25 May.
Bhushan, Chandra (2003): “Water Industry Is MisusingIt,” Down to Earth (New Delhi), 15 June.
Central Pollution Control Board and Ministry ofEnvironment and Forests, Government of India (2002):Water Quality in India: Status and Trends (1990-2001).
Chinai, Rupa (2002): “Manila Water System Shows Failureof Privatization,” The Times of India (Mumbai), 27 November.
Confederation of Indian Industries and Ministry of WaterResources (2003): “Background Paper,” NationalConference on Water Management: Public-PrivatePartnership, 27 May 2003 (New Delhi: Government ofIndia).
Davies, Bryan and Jenny Day (1998): Vanishing Waters(Cape Town, South Africa: University of Cape TownPress).
D’ Monte, Darryl (2003): “Water - The Poor’s Priority, OurPlanet (Nairobi, UNEP), vol. 14, no. 1.
Dhawan, Rajeev (2003): “Corporate Versus the People,”The Hindu (New Delhi), 17 May.
Dharmadhikary, Shripad (2002): “Water”, Private andLimited (Badwani, MP: Manthan Publication).
Dogra, Bharat, “Dams, Barrages and Future of Garhwal,”
in Friends of Chipko (ed., undated), Ignoring Reason,Inviting Disaster: Threat to Ganga-Himalaya (New Delhi:Friends of Chipko).
Down to Earth (2002): “Urban Water Privatization,Divorced from Reality,” Down to Earth (New Delhi), 15September.
Freedom from DEBT Coalition: The Failure of WaterPrivatization in Manila, Manila.
Hindustan Times (2003): “Five Workers Killed in SewagePlant Tragedy,” Hindustan Times, 26 June.
INSAF (2002): Defend People’s Right to Water (New Delhi:INSAF).
Iyer, V. R. Krishna (2003): “Rivers, Sand and People’sSurvival,” The Hindu (New Delhi), 23 January.
Janakrajan, S. (2003): “Privatization of Water,” HinduSurvey of Environment, June 2003.
Joshi, Poornima (2003): “Tapping the Droplet,” Outlook, 2June.
Khosla, Ashok (2003): “Nor Any Drop to Drink,” OurPlanet (Nairobi, UNEP), vol. 14, no. 4.
Kumar, R. Krishna (2003): “Growing Resistance in Kerala,”Frontline, 20 June.
Kumar, S. (2001): Plant Diversity Along River Ganga(Dehradun: Sai Publishers).
Maitra, Asesh Kumar (2003): “Preciously Parched, FreshWater: A critical Resource,” Geography and You (NewDelhi), vol. 3, no. 3 & 4.
References

59
.....................................................................................................................................
Matu-People’s Organisation (2002): Towards Failure andDevastation: Tehri Dam Project, Environment and Rehabilitation,Fourth document, New Delhi.
Mehta, M. C. (1993): “Ganga Action Plan: Tied up in RedTape,” Hindu Survey of Environment, 1993.
Ministry of Environment and Forests, Government ofIndia: Water (Prevention and Control of Pollution) Cess(Amendment) Act, 2003.
Mohanti, Tushar K. (2003): “Water Crisis Deepens, StatesFail to Take Long Term Perspective,” Economic Times (NewDelhi), 9 June.
Pandey, Mahendra (2003): “Menacing Freshwater,”Geography and You (New Delhi), vol. 3, no. 3 & 4.
Paranjpye, Vijay (1988): Evaluating the Tehri Dam: AnExtended cost Benefit Appraisal, Studies in Ecology andSustainable Development, Series No. 1, (New Delhi:INTACH).
Paranjpye, Vijay (1990): High Dams on the Narmadas, AHolistic Analysis of the River Valley Projects, Studies onEcology and Sustainable Development, Series No. 3, (NewDelhi: INTACH).
Saksena, Rashmi (2003): “Pooling Their Resources,” TheWeek, 11 May.
Sen, Arijit (2000): “The Tao of Varanasi: Living Lab,” ThePioneer (New Delhi), 26 November.
Shiva, Vandana (2002): Water Wars, Privatization, Pollutionand Profit, (New Delhi: Indian Research Press).
Shiva, Vandana, Radha Holla Bhar, Afsar H. Jafri, andKunwar Jalees (2003): Corporate Hijack of Water: How WorldBank, IMF and GATS-WTO Rules are Forcing WaterPrivatisation (New Delhi: Navdanya).
Shiva, Vandana and Kunwar Jalees (2003): “The Impact ofthe River Linking Project,” Sujalam Living Waters, JalSwaraj, Water Sovereignty Series No. 2, (New Delhi:RFSTE/Navdanya).
Singh, Shekhar and Pranab Banerjee (ed., 2002): LargeDams in India: Environmental, Social and Economic Impacts,(New Delhi: Indian Institute of Public Administration).
South Asia Network on Dams, Rivers and People (January2003): Say No To Profit Over Water, A Dossier on Privatizationof Water, (Delhi: South Asia Network on Dams, Rivers andPeople).
The Hindu, New Delhi, 28 November 2002.
The Indian Express (2003): “Poisonous Gases Kill Five atDJB,” The Indian Express (New Delhi) 26 June.
The Indian Express (2003): “UN Water quality List,” TheIndian Express (New Delhi), 6 March.
Toepfer, Klaus (2003): UNEP World Environment DayMessage by Klaus Toepfer (Executive Director, UNEP).
Viswanathan, S. (2003): “Soft Drinks and Hard Choices,”Frontline, 20 June.
Website www.copseyfamily.org, 2003.
Website of Ministry of Urban Development and PovertyAlleviation, Government of India, New Delhi, 26 December2002.
Whitecomb, Elizabeth (1971): Agrarian Conditions inNorthern India, vol. I, The United Provinces under British Rule1860-1900 (New Delhi: Thomson Press India Ltd).
Yadav, Umesh C. S. (2002): “Ganga Action Plan: AnOverview,” Souvenir, Celebrating World Environment Day2002, (New Delhi: Humane Touch).
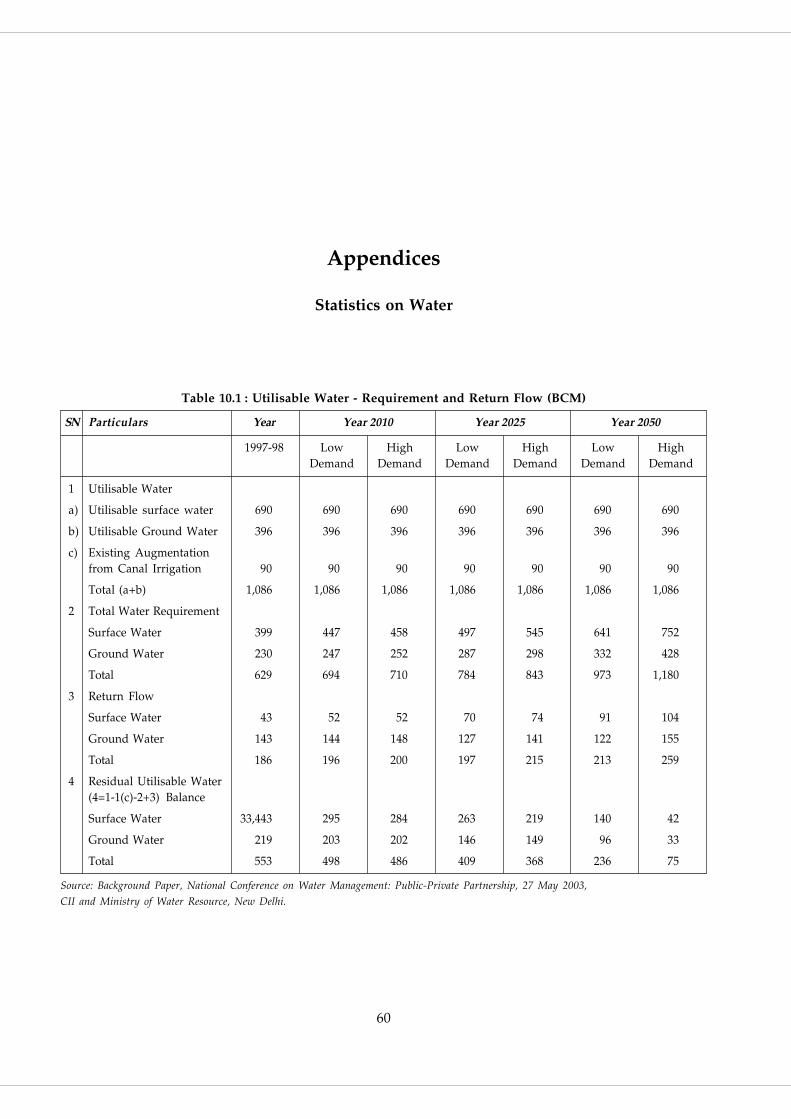
60
.....................................................................................................................................
Appendices
Statistics on Water
Table 10.1 : Utilisable Water - Requirement and Return Flow (BCM)
SN Particulars Year Year 2010 Year 2025 Year 2050
1997-98 Low High Low High Low HighDemand Demand Demand Demand Demand Demand
1 Utilisable Water
a) Utilisable surface water 690 690 690 690 690 690 690
b) Utilisable Ground Water 396 396 396 396 396 396 396
c) Existing Augmentationfrom Canal Irrigation 90 90 90 90 90 90 90
Total (a+b) 1,086 1,086 1,086 1,086 1,086 1,086 1,086
2 Total Water Requirement
Surface Water 399 447 458 497 545 641 752
Ground Water 230 247 252 287 298 332 428
Total 629 694 710 784 843 973 1,180
3 Return Flow
Surface Water 43 52 52 70 74 91 104
Ground Water 143 144 148 127 141 122 155
Total 186 196 200 197 215 213 259
4 Residual Utilisable Water(4=1-1(c)-2+3) Balance
Surface Water 33,443 295 284 263 219 140 42
Ground Water 219 203 202 146 149 96 33
Total 553 498 486 409 368 236 75
Source: Background Paper, National Conference on Water Management: Public-Private Partnership, 27 May 2003,
CII and Ministry of Water Resource, New Delhi.

61
.....................................................................................................................................
Table 10.2 : Water Requirement for Different Users (BCM)
Particulars Year Year 2010 Year 2025 Year 2050
1997-98 Low High % Low High % Low High %
Surface Water
Irrigation 318 330 339 48 325 366 43 375 463 39
Domestic 17 23 24 3 30 36 5 48 65 6
Industries 21 26 26 4 47 47 6 57 57 5
Power 7 14 15 2 25 26 3 50 56 5
Inland Navigation 7 7 1 10 10 1 15 15 1
Flood Control - - 0 - - 0 - - 0
Env. (1) Afforestation - - 0 - - 0 - - 0
Env. (2) Ecology 5 5 1 10 10 1 20 20 2
Evaporation Losses 36 42 42 6 50 50 6 76 76 6
Total 399 447 458 65 497 545 65 641 752 64
Ground Water
Irrigation 206 213 218 31 236 245 29 253 344 29
Domestic & Municipal 13 19 19 2 25 26 3 42 46 4
Industries 9 11 11 1 20 20 2 24 24 2
Power 2 4 4 1 6 7 1 13 14 1
Total 230 247 252 35 287 298 35 332 428 36
Grand Total 629 694 710 100 784 843 100 973 1180 100
Total Water Use
Irrigation 524 543 557 78 561 611 72 628 817 68
Domestic 30 42 43 6 55 62 7 90 111 9
Industries 30 37 37 5 67 67 8 81 81 7
Power 9 18 19 3 31 33 4 63 70 6
Inland Navigation 0 7 7 1 10 10 1 15 15 1
Flood Control 0 0 0 0 0 0 0 0 0 0
Env. (1) Afforestation 0 0 0 0 0 0 0 0 0 0
Env. (2) Ecology 0 5 5 1 10 10 1 20 20 2
Evaporation Losses 36 42 42 6 50 50 6 76 76 7
Total 629 694 710 100 784 843 100 973 1180 100
Source: Background Paper, CII and Ministry of Water Resources
Table 10.3 : Future Drinking Demand
Year Total Water Demand* BCM/Year BCM/Year
Based on Past Based on UN Based on Based on UN Total water requirement forCensus Projection Past Census Projection domestic use for urban and rural
1991 31,465 11.48
2001 43,065 49,935 15.72 16.03
2011 54,810 63,555 20.00 23.20 42
2021 66,555 83,375 24.29 30.43 NA
2025 71,340 91,350 26.04 33.34 55
2050 100,755 140,650 36.77 51.33 90
* The water demand has been worked out @ 170 lpcd for 65% of the urban population presumed to be living in class I cities and @ 100 lpcd
for balance 35% of the urban population living in class I cities (Report of the National Commission for Integrated Water Resource Development
Plan)

62
.....................................................................................................................................
Tab
le 1
0.4
: S
har
e of
wat
er M
anag
emen
t in
Sta
tes’
Tot
al E
xpen
dit
ure
Dec
lin
es f
rom
8.2
1% i
n 1
995-
96 t
o 5.
55%
in
200
2-03
Stat
eEx
pend
iture
on
Irrig
atio
n, f
lood
con
trol
and
soil
and
wat
er c
onse
rvat
ion
Chan
ge o
ver
the
prev
ious
yea
r (%
)(R
even
ue+c
apita
l exp
endi
ture
in R
s. Cr
ore)
2002
-03
2001
-02
2000
-01
1999
-00
1998
-99
1997
-98
1996
-97
1995
-96
02-0
301
-02
00-0
199
-00
98-9
997
-98
96-9
7
And
hra
Prad
esh
3547
.12
2966
.87
2612
.05
2298
.64
2053
.61
1852
.40
1586
.14
1491
.22
19.6
13.6
13.6
11.9
10.9
16.8
6.4
Aru
nach
al P
rade
sh42
.32
83.2
862
.87
33.4
433
.18
35.8
433
.59
32.0
449
.232
.588
.00.
8-7
.46.
74.
8
Ass
am34
2.22
379.
4731
1.07
303.
7623
5.73
237.
1117
8.40
157.
16-9
.822
.02.
428
.9-0
.632
.913
.5
Biha
r10
23.9
080
3.16
878.
8513
35.5
952
5.66
321.
8655
.30
460.
2027
.5-8
.6-3
4.2
154.
163
.3-4
1.5
19.6
Chh
attis
garh
481.
4728
2.75
109.
670.
000.
000.
000.
000.
0070
.315
7.8
Goa
103.
4899
.98
71.6
642
.90
41.4
439
.60
42.4
142
.47
3.5
39.5
67.0
3.5
4.6
-6.6
-0.1
Guj
arat
2776
.96
2476
.22
3195
.99
3287
.79
2966
.25
2460
.90
2016
.37
1654
.74
12.1
-22.
5-2
.810
.820
.522
.021
.9
Har
yana
817.
0977
4.04
680.
5364
8.12
628.
2758
0.09
513.
0642
7.51
5.6
13.7
5.0
3.2
8.3
13.1
20.0
Him
acha
l Pr
ades
h15
7.02
128.
0112
4.85
122.
3311
4.65
100.
0280
.25
65.2
222
.72.
52.
16.
714
.624
.623
.0
Jam
mu
& K
ashm
ir35
9.25
323.
4422
4.52
187.
1118
7.62
154.
2313
7.02
133.
1211
.144
.120
.0-0
.321
.612
.62.
9
Jhar
khan
d45
4.07
432.
340.
000.
000.
000.
000.
000.
005.
0-
--
--
-
Kar
nata
ka24
72.6
014
39.9
820
58.5
618
76.3
216
55.7
314
79.5
314
79.3
912
67.5
171
.7-3
0.0
9.7
13.3
11.9
0.0
16.7
Ker
ala
325.
8937
3.43
319.
4435
0.81
343.
7131
3.72
320.
3530
5.51
-12.
716
.9-8
.92.
19.
6-2
.14.
9
Mad
hya
Prad
esh
1102
.76
1037
.45
880.
8878
8.59
819.
8274
9.34
718.
6267
1.11
6.3
17.8
11.7
-3.8
9.4
4.3
7.1
Mah
aras
htra
2317
.61
2407
.63
3040
.33
3666
.18
3207
.35
3687
.02
2998
.58
3132
.96
-3.7
-20.
8-1
7.1
14.3
-13.
023
.0-4
.3
Man
ipur
103.
1413
7.13
49.8
285
.08
60.3
071
.35
70.4
363
.22
-24.
817
5.3
-41.
441
.1-1
5.5
1.3
11.4
Meg
hala
ya49
.51
52.9
838
.42
33.4
334
.74
31.6
128
.01
33.2
3-6
.527
.914
.9-3
.89.
912
.9-1
5.7
Miz
oram
12.9
315
.25
11.7
516
.69
7.10
7.71
11.7
17.
85-1
5.2
29.8
-29.
613
5.1
-7.9
-34.
249
.2
Nag
alan
d27
.72
26.1
325
.00
24.4
723
.90
21.7
923
.25
14.6
46.
14.
52.
22.
49.
7-6
.358
.8
Ori
ssa
740.
5571
4.40
679.
5474
3.83
825.
1077
9.41
619.
0342
3.68
3.7
5.1
-8.6
-9.8
5.9
25.9
46.1
Punj
ab99
4.12
927.
0678
3.84
683.
3092
5.83
846.
2435
2.00
681.
387.
218
.314
.7-2
6.2
9.4
140.
4-4
8.3
Raj
asth
an13
90.1
612
57.3
711
72.2
012
54.3
913
40.2
511
8.79
1066
.41
1039
.77
10.6
7.3
-6.6
-6.4
19.8
4.9
2.6
Sikk
im18
.71
26.3
522
.81
10.2
310
.67
7.24
10.5
66.
66-2
9.0
15.5
123.
0-4
.147
.4-3
1.4
58.6
Tam
il N
adu
778.
6578
2.14
775.
8981
1.68
675.
8942
8.78
313.
8731
4.51
-0.4
0.8
-4.4
20.1
57.6
36.6
-0.2
Tiru
pura
80.6
285
.74
56.7
948
.04
39.2
434
.76
26.0
618
.71
-6.0
51.0
18.2
22.4
12.9
33.4
39.3
Utt
aran
chal
196.
4319
8.61
35.5
20.
000.
000.
000.
000.
00-1
.145
9.1
--
--
-
Utta
r Pr
ades
h21
69.3
422
7.43
2421
.28
2146
.76
2028
.11
1957
.43
2122
.30
1694
.91
-2.6
-8.0
12.8
5.9
3.6
-7.8
25.2
Wes
t Be
ngal
985.
2610
02.5
096
2.41
766.
7962
5.87
499.
4551
3.97
422.
05-1
.74.
225
.522
.525
.3-2
.821
.8
New
Del
hi66
.27
65.3
356
.75
51.1
544
.53
38.1
132
.14
15.4
51.
415
.110
.914
.916
.818
.610
8.0
All
Sta
tes
2393
7.17
2152
6.47
2166
3.29
2161
7.42
1945
4.55
1785
4.33
1584
4.22
1457
6.83
11.2
-0.6
0.2
11.1
9.0
12.7
8.7
Sour
ce:
Tus
har
K.
Moh
anti
(20
03):
”W
ater
Cri
sis.
..,”
Eco
nom
ic T
imes
, N
ew D
elhi
, 9
June
200
3

63
.....................................................................................................................................
Table 10.5 : Percentage Share of Expenditure on Irrigation,Flood Control and Soil and Water Conservation in State’s Total Budgetary Outlay
State (Revenue + Capital) Percentage share in Rs. crore
2002-03 2001-02 2000-01 1999-00 1998-99 1997-98 1996-97 1995-96
Andhra Pradesh 10.01 9.48 9.29 10.10 9.35 10.44 9.75 10.43
Arunachal Pradesh 3.09 5.47 5.21 3.05 3.31 3.69 3.77 3.99
Assam 3.26 3.66 4.08 4.29 4.53 4.72 4.18 3.58
Bihar 6.25 5.40 5.19 6.83 4.32 3.15 5.85 4.89
Chhattisgarh 6.82 4.71 5.72 - - - - -
Goa 3.65 3.91 3.65 2.66 2.84 3.12 4.48 4.50
Gujarat 9.50 8.20 11.76 15.32 15.47 16.54 16.03 15.31
Haryana 6.83 7.05 7.43 7.75 7.32 7.43 6.55 6.97
Himachal Pradesh 2.61 2.35 2.35 2.60 2.75 2.90 3.05 2.78
Jammu & Kashmir 4.22 4.02 2.87 2.63 3.21 3.15 3.41 3.73
Jharkhand 4.83 5.45 - - - - - -
Karnataka 9.62 6.56 10.47 10.53 11.12 11.74 12.35 12.18
Kerala 2.12 2.74 2.43 2.72 3.24 3.20 4.03 4.41
Madhya Pradesh 6.08 5.26 5.20 4.39 5.13 5.27 5.49 6.34
Maharashtra 5.10 5.49 7.20 9.59 10.58 13.32 11.99 14.66
Manipur 5.13 6.27 3.61 4.78 5.40 6.30 6.95 7.80
Meghalaya 2.69 3.03 2.70 2.80 3.45 3.72 3.57 4.27
Mizoram 1.06 1.09 0.91 1.44 0.79 0.89 1.45 1.10
Nagaland 1.41 1.29 1.36 1.64 1.60 1.77 2.12 1.41
Orissa 5.23 5.68 6.15 7.35 9.55 11.37 9.81 7.62
Punjab 5.18 5.52 5.55 5.70 8.45 8.93 4.66 9.73
Rajasthan 6.20 6.44 6.70 7.72 9.36 8.82 9.73 9.53
Sikkim 0.94 2.33 2.41 0.63 0.66 0.52 0.85 0.67
Tamil Nadu 2.53 3.01 3.18 3.59 3.40 2.47 2.04 2.51
Tirupura 2.95 3.21 2.66 2.71 2.56 2.57 2.21 1.89
Uttaranchal 3.68 4.15 3.20 - - - - -
Uttar Pradesh 4.93 5.21 6.60 6.20 6.45 7.35 9.22 8.15
West Bengal 3.17 3.32 3.60 3.38 3.65 3.68 3.94 4.02
New Delhi 0.75 0.70 0.77 0.87 0.90 0.91 0.91 0.52
All States 5.55 5.36 6.24 6.89 7.30 7.83 7.81 8.21
Source: Tushar K. Mohanti (2003): ”Water Crisis...,” Economic Times, New Delhi, 9 June 2003

64
.....................................................................................................................................
Table 10.6: Medicinal Plants in Ganga-Shiwalik Region
SN. Plant Family Name of Species
1. Acanthaceae Adhatoda vasica, Barleria prionitis, B. cristata, Peristrophe bicalyculata, Reulliatuberosa, Rungia parviflora.
2. Adiantaceae Adiantum sp.
3. Aizoeceae Trianthema sp.
4. Amaranthaceae Achyranthes aspera
5. Apiaceae Centella asiatica
6. Anacardiaceae Spondias pinnata, Buchnania Iatifolia, Mangifera indica
7. Araceae Acorus calamus
8. Apocynaceae Holarrhena antidysenterica, lchnocarpus frutescens, Catharanthus roseus, Neriumodorum, Plumeria acutifolia, Rauwolfia serpentina, Tabernaemontana coronaria,Thevetia nerifolia
9. Asclepiadaceae Asclepias curassavica, Calotropis gigentia, C. procera, Leptadenia reticulata,Tylophora indica.
10. Asteraceae Artemisia sp., Calendula officinalis, Eclipta alba, Tridax procumbens, Vernoniaanthelomintica.
11. Averrhoaceae Averrhoa carambola
12. Barringtoniaceae Barringtonia acutangula
13. Bignoniaceae Stereospermum suaveolens, Tecomella undulata
14. Bombaceae Salmelia malabarica
15. Boraginaceae Cynoglossum sp., Heliotropiu sp., H. indicum
16. Caesalpiniaceae Bauhina variegata, Caesalpinia, C.sophera, C. tora, Saraca indica.
17. Cannabinaceae Cannabis sativa
18. Capparaceae Crataeva nervula
19. Caryophyllaceae Stellaria media
20. Celastraceae Celastrus paniculata
21. Chenopodiaceae Chenopodium ambrosoides
22. Cochlospermaceae Cochlospermum gossypium
23. Combretaceae Angeissus latifolia, Terminalia arjuna, Terminalia bellerica, T. chebula, T. tomentosa,Convolvulus pluricaulis, Evolvulus, alsinoides Ipomoea turpethum.
24. Cucurbitaceae Bryonopsis laciniata, Citrullus, colocythus, Momordica balsamina
25. Cupressaceae Thuja occidentalis.
26. Dioscoreaceae Dioscorea bulbiflora, D.deltoidea.
27. Euphorbiaceae Baliospermum montanum, Bridelia sp., Emblica officinalis, Euphorbia hirta,E. nerifolia, E. thymifolia, Phyllanthus niruri, Ricinus communis.
28. Fagaceae Querus leucotrichophora
29. Flacourtiaceae Flacourtia sp. Casearia tomentosa
30. Lamiaceae Hyptis suaveolens, Mentha piperata, Ocimum sp.
31. Leeaceae Leea aspera
32. Lythraceae Lawsonia inerims
33. Liliaceae Asparagus sp. Gloriosa superba, Urginea indica

65
.....................................................................................................................................
SN. Plant Family Name of Species
34. Malvaceae Hibiscus abelmoschus, H. rosasinensis, Malvastrum coromandalicum, Abutilonindicum, Sida cordata, S. cordfifolia, S.obovata, S. rhombifolia
35. Meliaceae Azadirachta indica, Amoora rohituka, Cedrela toona
36. Mimosaceae Acacia nilotica, Albizzia lebbeck, A. odoratissima, A procera.
37. Menispermaceae Cissampelos pareria, Tinospora cordifolia
38. Moraceae Ficus religiosa
39. Moringaceae Moringa oleifera
40. Myrtaceae Syzigium cumini
41. Nyctaginaceae Boerhavia diffusa
42. Nyctanthaceae Nyctanthes arbortristis
43. Oxalidaceae Oxalis corniculata
44. Papaveraceae Argemone mexicana
45. Papilionaceae Abrus pictorius, Butea frondosa, Desmodium gangeticum, Dolichos biflorus, Medicagosativa, Melilotus philipnensis, Pongamia glabra, Psoralea corylifolia, Puerariatuberosa, Trigonella foenumgraecum, Uraria picta.
46. Pedaliaceae Pedalium foetida
47. Periplocaceae Hemidesmus indicus
48. Piperaceae Piper longum
49. Plumbaginaceae Plumbago zeylanica
50. Poaceae Arundo donax, Cymbopogon sp., Cyndon dactylon
51. Polygonaceae Polygonum viviparum
52. Puniceaceae Punica granatum
53. Rhamanaceae Zizyphus mauritiana
54. Rubiaceae Adina cordifolia Gardenia gummifera
55. Sapotaceae Bassia latifolia, Madhuca indica
56. Smilacaceae Smilax aspera
57. Solanaceae Datura fastuosa, D. stramonium, Solanum indicum, S. nigrum, S. torvum, S.verbascifolium, Withania somnifera.
58. Tiliaceae Grewia oppositifolia
59. Verbenaceae Gmelina arborea, Vitex negundo
60. Scrophulariaceae Bacopa monnieri
61. Zingiberaceae Costus sp., Curcuma longa, Hedychium spicatum, Zingiber officinale
62. Zygophyllaceae Tribulus terrestris.
Source: S. Kumar (2001): Plant Diversity Along River Ganga (Dehradun: Sai Publishers), pp 10-13