galaxy resources limitedgalaxylithium.businesscatalyst.com/media/presentations/1724423.pdf · major...
TRANSCRIPT
Slide 1[xx]
GALAXY RESOURCES LIMITEDDB Lithium-Ion Battery Supply Chain Conference
November 2017ASX: GXY
Slide 2[xx]Galaxy Resources Limited (ASX:GXY)
Disclaimer
Caution Regarding Forward Looking InformationThis document contains forward looking statements concerning the projects owned by Galaxy. Statements concerning mining reserves and resources may also be deemed to be forward looking statements in that they involve estimates based on specific assumptions. Forward-looking statements are not statements of historical fact and actual events and results may differ materially from those described in the forward looking statements as a result of a variety of risks, uncertainties and other factors. Forward-looking statements are inherently subject to business, economic, competitive, political and social uncertainties and contingencies. Many factors could cause the Company’s actual results to differ materially from those expressed or implied in any forward-looking information provided by the Company, or on behalf of, the Company. Such factors include, among other things, risks relating to additional funding requirements, metal prices, exploration, development and operating risks, competition, production risks, regulatory restrictions, including environmental regulation and liability and potential title disputes. Forward looking statements in this document are based on Galaxy’s beliefs, opinions and estimates of Galaxy as of the dates the forward looking statements are made, and no obligation is assumed to update forward looking statements if these beliefs, opinions and estimates should change or to reflect other future developments. There can be no assurance that Galaxy’s plans for development of its mineral properties will proceed as currently expected. There can also be no assurance that Galaxy will be able to confirm the presence of additional mineral deposits, that any mineralization will prove to be economic or that a mine will successfully be developed on any of Galaxy’s mineral properties. Circumstances or management’s estimates or opinions could change. The reader is cautioned not to place undue reliance on forward-looking statements. Data and amounts shown in this document relating to capital costs, operating costs, potential or estimated cashflow and project timelines are internally generated best estimates only. All such information and data is currently under review as part of Galaxy’s ongoing operational, development and feasibility studies. Accordingly, Galaxy makes no representation as to the accuracy and/or completeness of the figures or data included in the document.
Not For Release in USThis presentation has been prepared for publication in Australia and may not be released in the United States. This presentation does not constitute an offer of securities for sale in any jurisdiction, including the United States and any securities described in this announcement may not be offered or sold in the United States absent registration or an exemption from registration under the United States Securities Act of 1933, as amended. Any public offering of securities to be made in the United States will be made by means of a prospectus that may be obtained from the issuer and that will contain detailed information about the company and management, as well as financial statements..
2
CONTACT INFORMATIONLevel 4 / 21 Kintail Road, Applecross, Western Australia 6153 PO Box 1337, Canning Bridge LPOApplecross Western Australia 6953T: +61 8 9215 1700F: +61 8 9215 1799E: [email protected]
Slide 3[xx]Galaxy Resources Limited (ASX:GXY)
Galaxy Overview
3
Slide 4[xx]Galaxy Resources Limited (ASX:GXY)
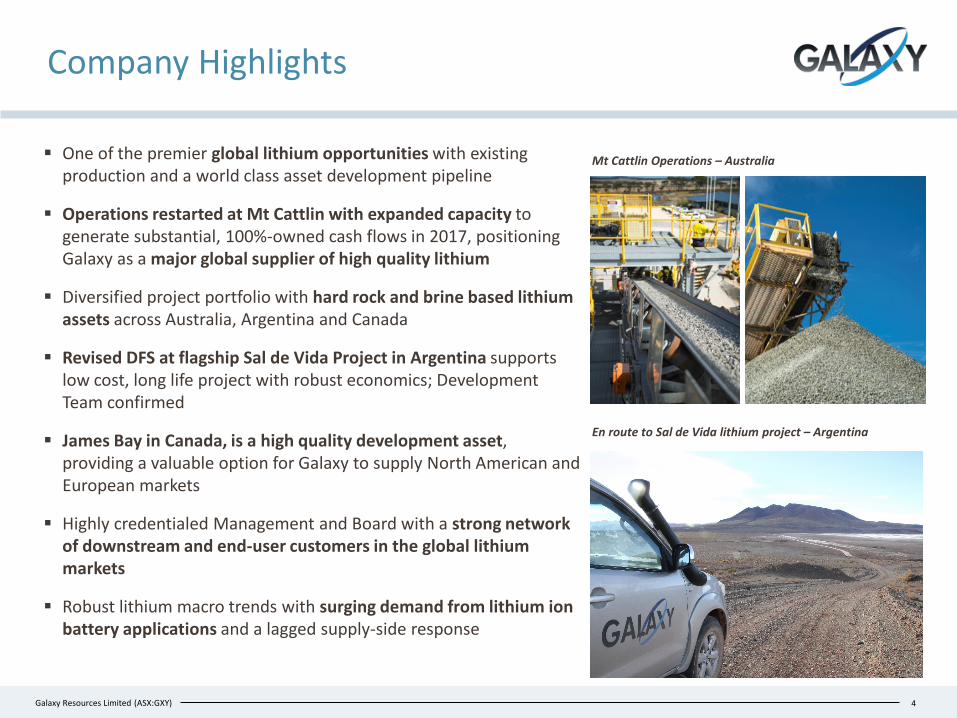
Company Highlights
One of the premier global lithium opportunities with existing production and a world class asset development pipeline
Operations restarted at Mt Cattlin with expanded capacity to generate substantial, 100%-owned cash flows in 2017, positioning Galaxy as a major global supplier of high quality lithium
Diversified project portfolio with hard rock and brine based lithium assets across Australia, Argentina and Canada
Revised DFS at flagship Sal de Vida Project in Argentina supports low cost, long life project with robust economics; Development Team confirmed
James Bay in Canada, is a high quality development asset, providing a valuable option for Galaxy to supply North American and European markets
Highly credentialed Management and Board with a strong network of downstream and end-user customers in the global lithium markets
Robust lithium macro trends with surging demand from lithium ion battery applications and a lagged supply-side response
4
Mt Cattlin Operations – Australia
En route to Sal de Vida lithium project – Argentina

Slide 5[xx]Galaxy Resources Limited (ASX:GXY)
-
5
10
15
20
25
-
1.0
2.0
3.0
4.0
5.0
Nov-16 Feb-17 May-17 Aug-17 Nov-17
Volume (m)Share price (A$)
Volume GXY
Corporate Snapshot
5
Financial Information (2017.11.14)
The leading global pure play lithium company, listed on the ASX, with significant institutional interest and outstanding liquidity
Share Price Performance (1 year)
Share price A$4.02
Number of shares (undiluted)1,2 403.3m
Market Capitalisation A$1,621.4m
Cash (30-Sep-17) A$57.4m
Debt (30-Sep-17) A$8.5m
Net cash (30-Sep-17) A$48.9m
Enterprise Value A$1,572.5m
Investor %
Blackrock Group 6.3%
Ausbil IM 5.3%
Board and Management 2.4%
Top 20 shareholders 39.4%
Top Shareholders (30 Oct 2017)
Shareholder Type and Geographical Breakdown (30 Oct 2017)
Source: IRESSNotes:1 Excludes 19.6M unlisted options on issue at various vesting and expiry dates with
exercise prices between A$0.365 and A$2.78 2 Excludes 5.0M share appreciation rights
47.8%
5.1%2.4%2.7%
18.1%
24.0%
Institutional BrokersBoard & Management Corporate stakeholdersPrivate investors Other
35.9%
17.0%7.1%6.6%
6.7%
26.8%
Australia/New Zealand North AmericaUnited Kingdom Asia/Middle EastEurope Not reported
Slide 6[xx]Galaxy Resources Limited (ASX:GXY)
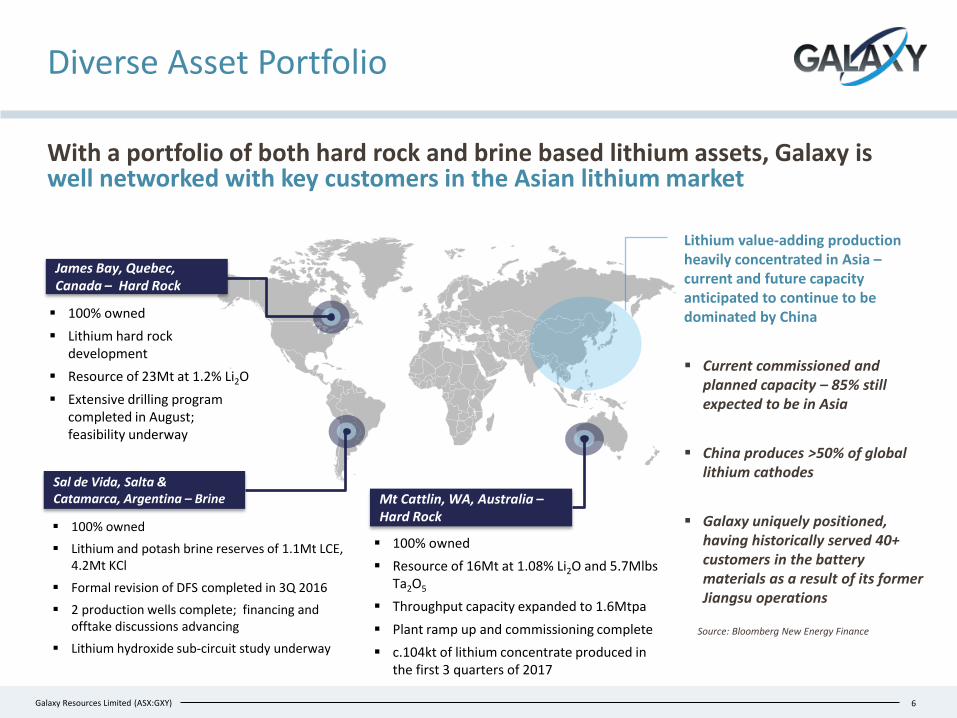
Diverse Asset Portfolio
With a portfolio of both hard rock and brine based lithium assets, Galaxy is well networked with key customers in the Asian lithium market
6
Mt Cattlin, WA, Australia –Hard Rock
Sal de Vida, Salta & Catamarca, Argentina – Brine
James Bay, Quebec, Canada – Hard Rock
100% owned Lithium hard rock
development Resource of 23Mt at 1.2% Li2O Extensive drilling program
completed in August; feasibility underway
100% owned Lithium and potash brine reserves of 1.1Mt LCE,
4.2Mt KCl Formal revision of DFS completed in 3Q 2016 2 production wells complete; financing and
offtake discussions advancing Lithium hydroxide sub-circuit study underway
Lithium value-adding production heavily concentrated in Asia –current and future capacity anticipated to continue to be dominated by China
Current commissioned and planned capacity – 85% still expected to be in Asia
China produces >50% of global lithium cathodes
Galaxy uniquely positioned, having historically served 40+ customers in the battery materials as a result of its former Jiangsu operations
Source: Bloomberg New Energy Finance
100% owned Resource of 16Mt at 1.08% Li2O and 5.7Mlbs
Ta2O5
Throughput capacity expanded to 1.6Mtpa Plant ramp up and commissioning complete c.104kt of lithium concentrate produced in
the first 3 quarters of 2017

Slide 7[xx]Galaxy Resources Limited (ASX:GXY)
Market Review
7
Slide 8[xx]Galaxy Resources Limited (ASX:GXY)
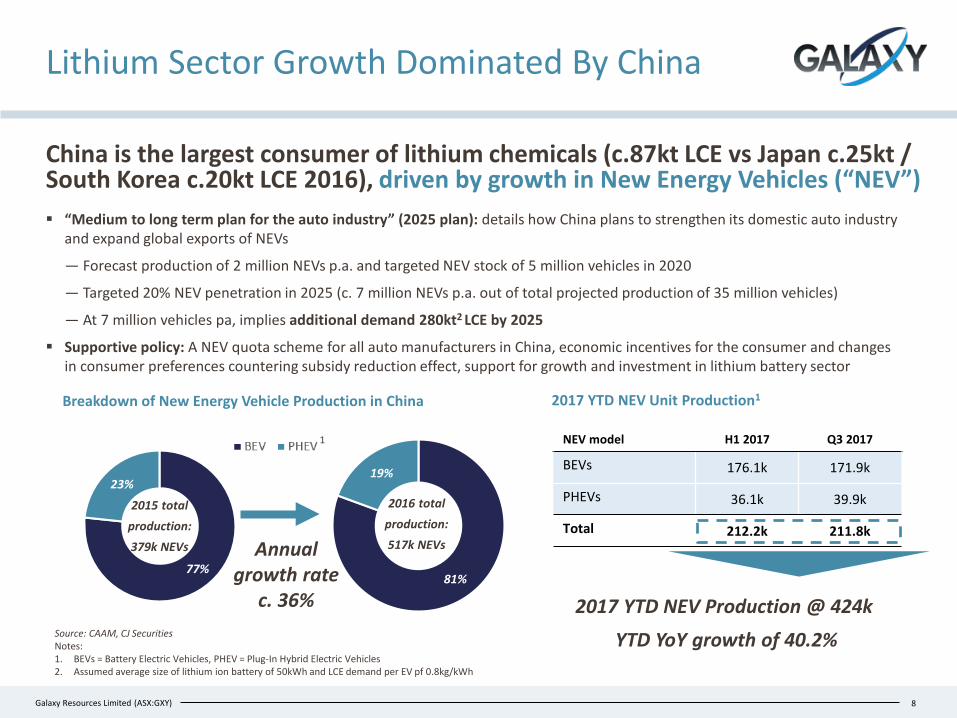
NEV model H1 2017 Q3 2017
BEVs 176.1k 171.9k
PHEVs 36.1k 39.9k
Total 212.2k 211.8k
8
Lithium Sector Growth Dominated By China
China is the largest consumer of lithium chemicals (c.87kt LCE vs Japan c.25kt / South Korea c.20kt LCE 2016), driven by growth in New Energy Vehicles (“NEV”)
Source: CAAM, CJ SecuritiesNotes: 1. BEVs = Battery Electric Vehicles, PHEV = Plug-In Hybrid Electric Vehicles2. Assumed average size of lithium ion battery of 50kWh and LCE demand per EV pf 0.8kg/kWh
81%
19%
77%
23%
Breakdown of New Energy Vehicle Production in China
2015 total production: 379k NEVs
2016 total production: 517k NEVsAnnual
growth rate c. 36%
“Medium to long term plan for the auto industry” (2025 plan): details how China plans to strengthen its domestic auto industry and expand global exports of NEVs
— Forecast production of 2 million NEVs p.a. and targeted NEV stock of 5 million vehicles in 2020
— Targeted 20% NEV penetration in 2025 (c. 7 million NEVs p.a. out of total projected production of 35 million vehicles)
— At 7 million vehicles pa, implies additional demand 280kt2 LCE by 2025
Supportive policy: A NEV quota scheme for all auto manufacturers in China, economic incentives for the consumer and changes in consumer preferences countering subsidy reduction effect, support for growth and investment in lithium battery sector
1
2017 YTD NEV Unit Production1
2017 YTD NEV Production @ 424kYTD YoY growth of 40.2%
Slide 9[xx]Galaxy Resources Limited (ASX:GXY)
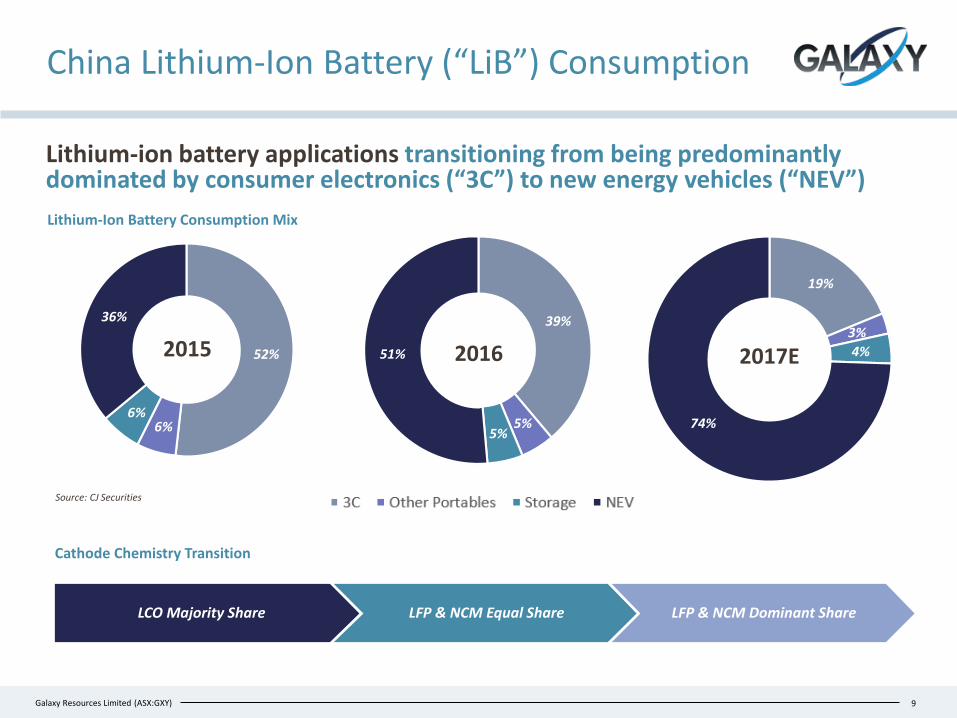
52%
6%6%
36% 39%
5%5%
51%
19%
3%4%
74%
9
Lithium-Ion Battery Consumption Mix
China Lithium-Ion Battery (“LiB”) Consumption
Source: CJ Securities
2015 2016 2017E
Lithium-ion battery applications transitioning from being predominantly dominated by consumer electronics (“3C”) to new energy vehicles (“NEV”)
LCO Majority Share LFP & NCM Equal Share LFP & NCM Dominant Share
Cathode Chemistry Transition
Slide 10[xx]Galaxy Resources Limited (ASX:GXY) 10
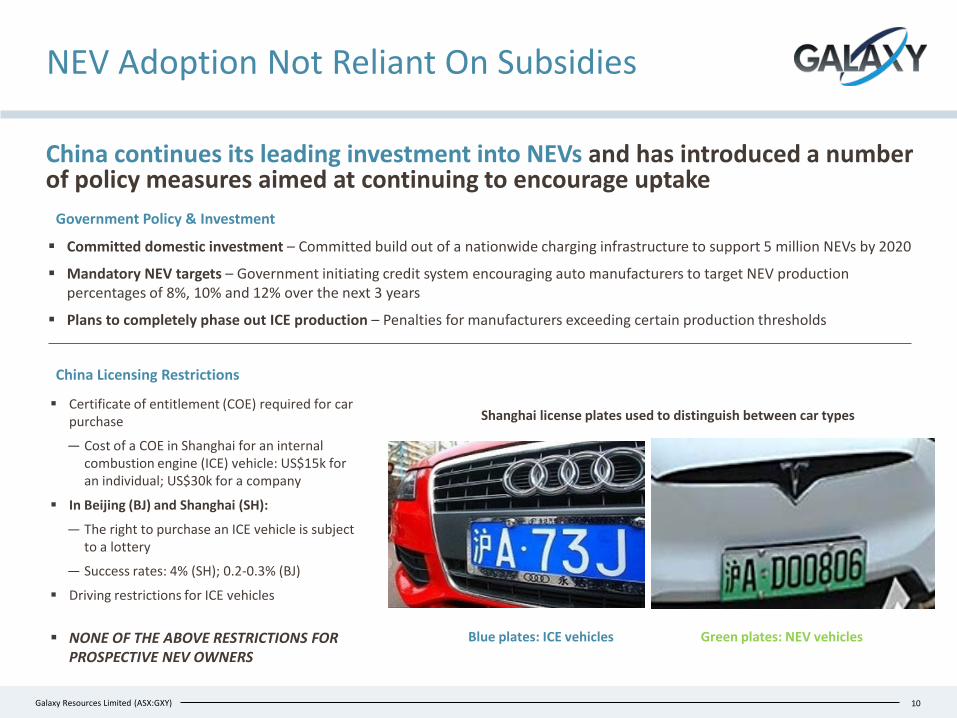
NEV Adoption Not Reliant On Subsidies
China continues its leading investment into NEVs and has introduced a number of policy measures aimed at continuing to encourage uptake
Government Policy & Investment
China Licensing Restrictions
Shanghai license plates used to distinguish between car types
Blue plates: ICE vehicles Green plates: NEV vehicles
Certificate of entitlement (COE) required for car purchase
— Cost of a COE in Shanghai for an internal combustion engine (ICE) vehicle: US$15k for an individual; US$30k for a company
In Beijing (BJ) and Shanghai (SH):
— The right to purchase an ICE vehicle is subject to a lottery
— Success rates: 4% (SH); 0.2-0.3% (BJ)
Driving restrictions for ICE vehicles
NONE OF THE ABOVE RESTRICTIONS FOR PROSPECTIVE NEV OWNERS
Committed domestic investment – Committed build out of a nationwide charging infrastructure to support 5 million NEVs by 2020
Mandatory NEV targets – Government initiating credit system encouraging auto manufacturers to target NEV production percentages of 8%, 10% and 12% over the next 3 years
Plans to completely phase out ICE production – Penalties for manufacturers exceeding certain production thresholds
Slide 11[xx]Galaxy Resources Limited (ASX:GXY)
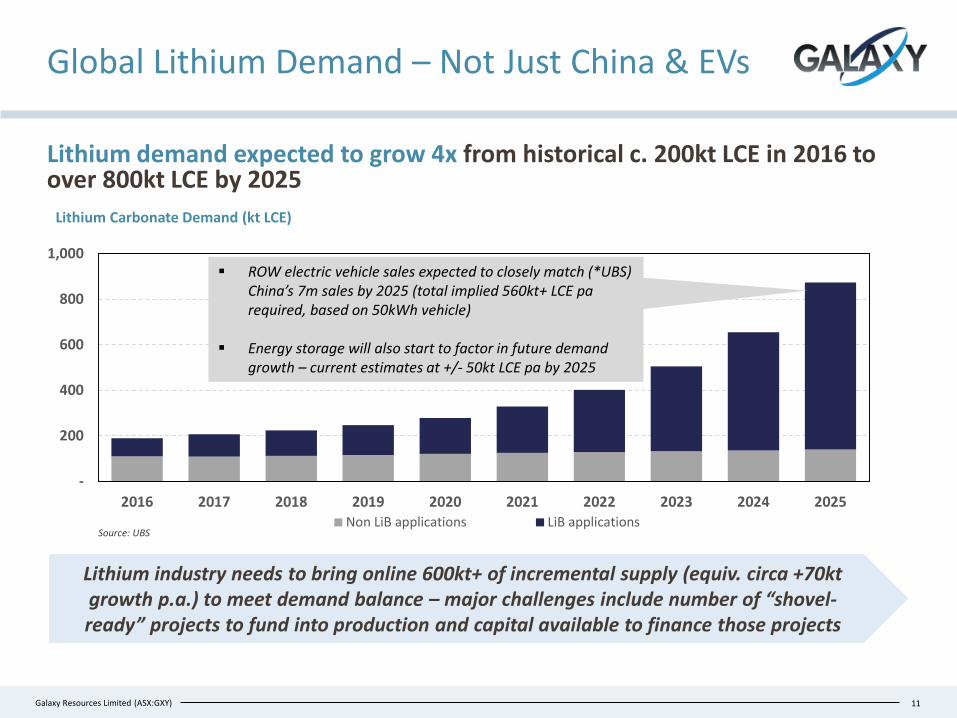
Global Lithium Demand – Not Just China & EVs
Lithium demand expected to grow 4x from historical c. 200kt LCE in 2016 to over 800kt LCE by 2025
Lithium industry needs to bring online 600kt+ of incremental supply (equiv. circa +70kt growth p.a.) to meet demand balance – major challenges include number of “shovel-ready” projects to fund into production and capital available to finance those projects
-
200
400
600
800
1,000
2016 2017 2018 2019 2020 2021 2022 2023 2024 2025Non LiB applications LiB applications
Lithium Carbonate Demand (kt LCE)
Source: UBS
11
ROW electric vehicle sales expected to closely match (*UBS) China’s 7m sales by 2025 (total implied 560kt+ LCE pa required, based on 50kWh vehicle)
Energy storage will also start to factor in future demand growth – current estimates at +/- 50kt LCE pa by 2025
Slide 12[xx]Galaxy Resources Limited (ASX:GXY)
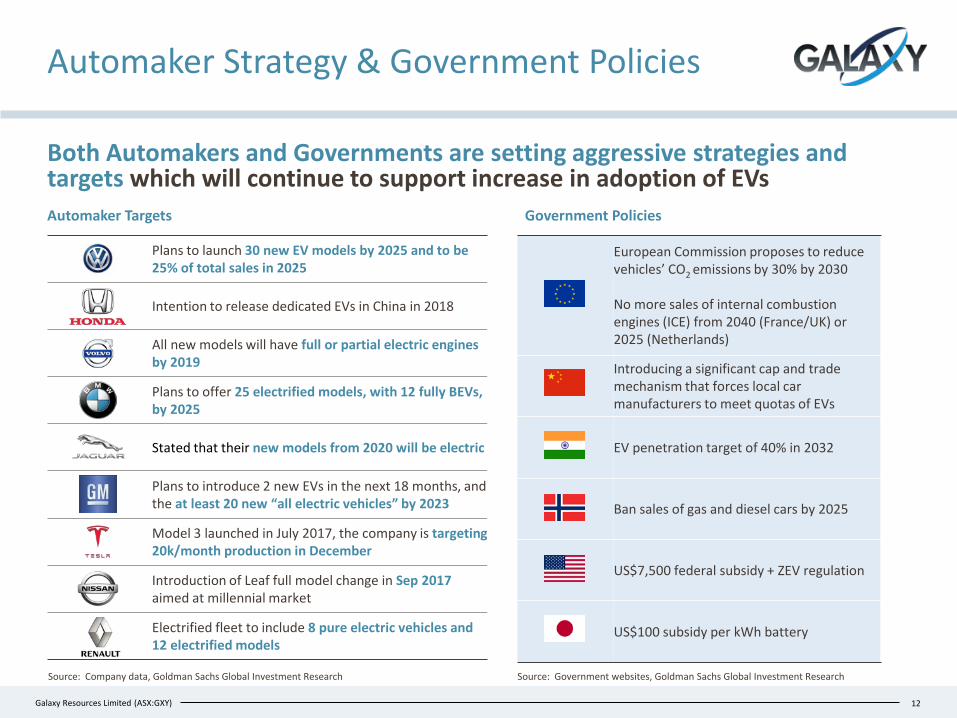
European Commission proposes to reduce vehicles’ CO2 emissions by 30% by 2030
No more sales of internal combustion engines (ICE) from 2040 (France/UK) or 2025 (Netherlands)
Introducing a significant cap and trade mechanism that forces local car manufacturers to meet quotas of EVs
EV penetration target of 40% in 2032
Ban sales of gas and diesel cars by 2025
US$7,500 federal subsidy + ZEV regulation
US$100 subsidy per kWh battery
Automaker Strategy & Government Policies
Both Automakers and Governments are setting aggressive strategies and targets which will continue to support increase in adoption of EVs
12
Source: Company data, Goldman Sachs Global Investment Research
Automaker Targets Government Policies
Source: Government websites, Goldman Sachs Global Investment Research
Plans to launch 30 new EV models by 2025 and to be 25% of total sales in 2025
Intention to release dedicated EVs in China in 2018
All new models will have full or partial electric engines by 2019
Plans to offer 25 electrified models, with 12 fully BEVs, by 2025
Stated that their new models from 2020 will be electric
Plans to introduce 2 new EVs in the next 18 months, and the at least 20 new “all electric vehicles” by 2023
Model 3 launched in July 2017, the company is targeting 20k/month production in December
Introduction of Leaf full model change in Sep 2017 aimed at millennial market
Electrified fleet to include 8 pure electric vehicles and 12 electrified models

Slide 13[xx]Galaxy Resources Limited (ASX:GXY)
Impact On Required Cathode Capacity
Continued investment in cathode production capacity expansion required to facilitate growth alongside the expected demand growth for LiB applications
Implied Cathode Demand (Based On Battery Grade LCE)1
13
Source: UBS, Benchmark Minerals, Company Disclosure, Bloomberg, CJ SecuritiesNotes:1. Battery grade LCE demand based on UBS estimates; Implied cathode volume assumes that the average LCE intensity per tonne of cathode is 0.42. LFP = Lithium Iron Phosphate, NCM = Nickel Cobalt Manganese
China NEV Cathode Mix Transitioning From LFP to Ternary
By 2020, projected NEV cathode mix to reach an estimated 85%/15% mix between ternary and LFP
28%
72%
42%
58%2015 2016 2017E 48%52%
c.90 c.160
c.730
c.225c.400
c.1825
2016 2020 2025Battery grade LCE (kt) Implied cathode volume (kt)
Substantial investment required to meet projected demand for lithium-ion battery applications
NCM LFP
Demand growth in lithium ion battery applications to place strong pressure on supply of cathode materials
— Majority of new expansions are focused on high-end cathodes for automotive batteries
Due to enhanced energy density demands, growth in automotive battery demand is driving ternary (NCM) and NCA cathodes to become the increasingly dominant chemistries
Consumer electronics to uphold demand for LCO, potential switch to ternary chemistries if cobalt supply becomes problematic
Slide 14[xx]Galaxy Resources Limited (ASX:GXY)
1GWh of existing capacity1
1GWh of planned capacity1
HUNGARY
SWEDEN
GERMANY
CAPACITY UNDISCLOSED
EUROPE CAPACITY
UNDISCLOSED
14
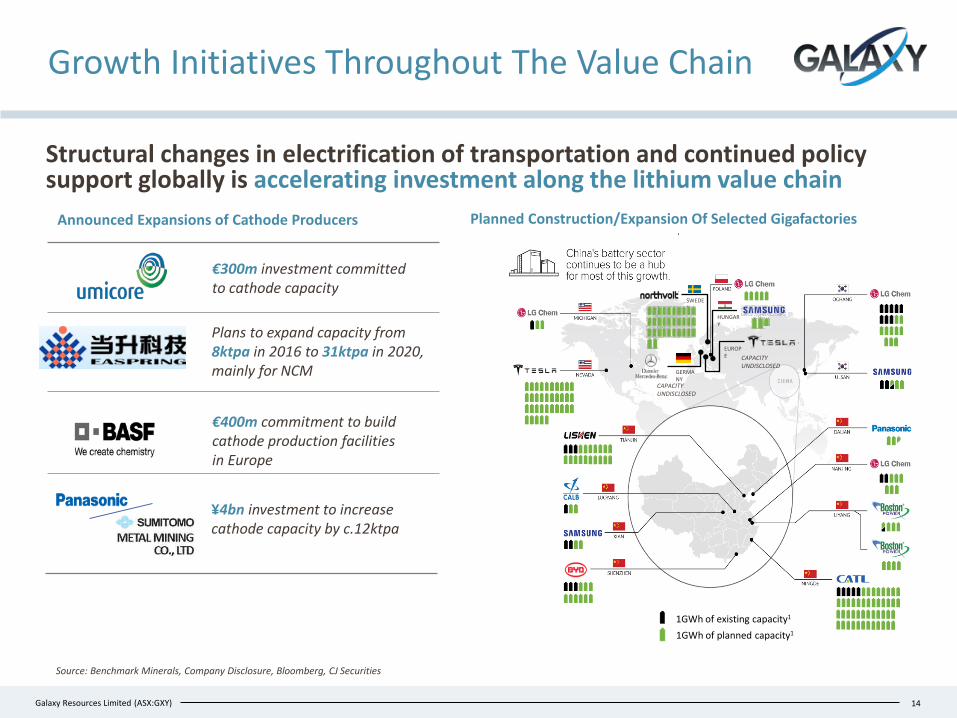
Growth Initiatives Throughout The Value Chain
Structural changes in electrification of transportation and continued policy support globally is accelerating investment along the lithium value chain
Planned Construction/Expansion Of Selected Gigafactories
Source: Benchmark Minerals, Company Disclosure, Bloomberg, CJ Securities
Announced Expansions of Cathode Producers
€400m commitment to build cathode production facilities in Europe
€300m investment committed to cathode capacity
¥4bn investment to increase cathode capacity by c.12ktpa
Plans to expand capacity from 8ktpa in 2016 to 31ktpa in 2020, mainly for NCM

Slide 15[xx]Galaxy Resources Limited (ASX:GXY) 15
Global Investment In LiB Manufacturing
China vs ROW: China has a total c.160GWh of capacity vs ROW aggregate capacity of c. 120GWh
—Represents 57% of global capacity announced to date
LCE Required: If fully utilised today, a total of 280GWh capacity will use 224kt LCE of battery grade material vs only c.90kt LCE of material that was used in batteries in 2016
Capital Investment: Using the Tesla Gigafactory capital intensity of c.US$150m/GWh, this equates to anestimated US$40B+ of investment capital to build out global lithium battery manufacturing capacity
Significant investment is being made into increasing global battery manufacturing capacity, driven primarily by China
-
20
40
60
80
100
120
140
160
180
China Korea United States Japan Others
GWh/year
Comissioned Under Construction Announced
Global Breakdown of Lithium-Ion Battery Project Capacity
Source: Benchmark Minerals, Bloomberg New Energy Finance
Capacity expected to grow 2x from 2017E levels to 2020
28.2GWh64.8GWh
102.8GWh
2015 2016 2017E
Lithium-Ion Battery Manufacturing Capacity
Slide 16[xx]Galaxy Resources Limited (ASX:GXY)
-
30,000
60,000
90,000
120,000
150,000
180,000
2015
Sta
rt- C
hina
Pric
e
Big
3 -
Li2C
O3
pric
e
Lith
ium
Carb
onat
ePr
ice
Lith
ium
Hydr
oxid
ePr
ice
Gross Pricing/t
Net Pricing/t
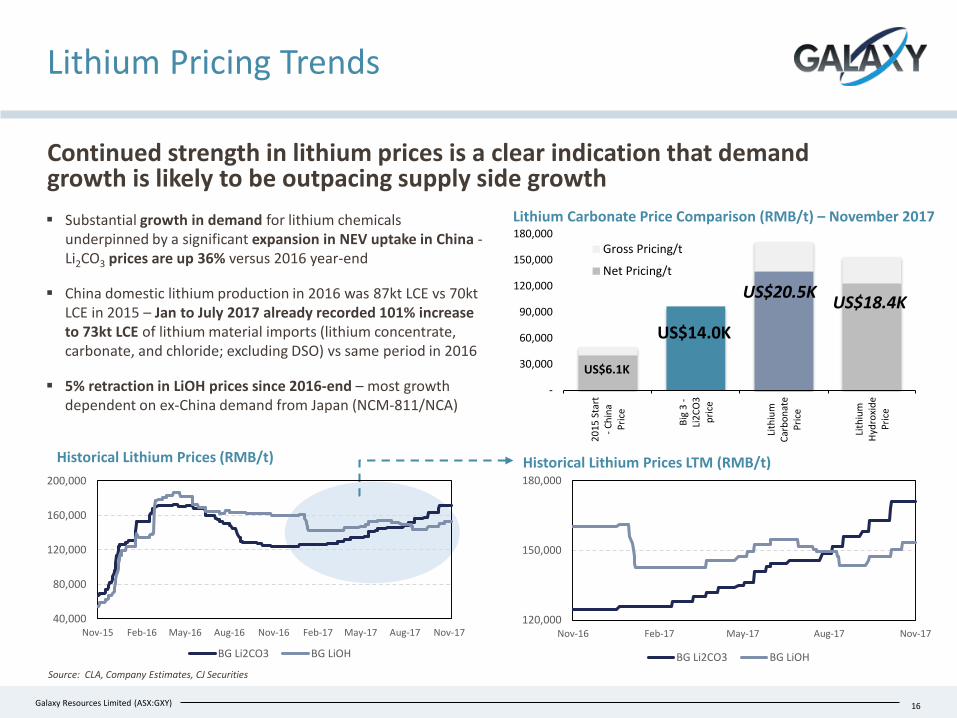
Lithium Pricing Trends
16
Continued strength in lithium prices is a clear indication that demand growth is likely to be outpacing supply side growth
Source: CLA, Company Estimates, CJ Securities
Historical Lithium Prices (RMB/t) Historical Lithium Prices LTM (RMB/t)
Lithium Carbonate Price Comparison (RMB/t) – November 2017
US$6.1K
US$20.5K US$18.4K
US$14.0K
Substantial growth in demand for lithium chemicals underpinned by a significant expansion in NEV uptake in China -Li2CO3 prices are up 36% versus 2016 year-end
China domestic lithium production in 2016 was 87kt LCE vs 70kt LCE in 2015 – Jan to July 2017 already recorded 101% increase to 73kt LCE of lithium material imports (lithium concentrate, carbonate, and chloride; excluding DSO) vs same period in 2016
5% retraction in LiOH prices since 2016-end – most growth dependent on ex-China demand from Japan (NCM-811/NCA)
40,000
80,000
120,000
160,000
200,000
Nov-15 Feb-16 May-16 Aug-16 Nov-16 Feb-17 May-17 Aug-17 Nov-17
BG Li2CO3 BG LiOH
120,000
150,000
180,000
Nov-16 Feb-17 May-17 Aug-17 Nov-17
BG Li2CO3 BG LiOH
Slide 17[xx]Galaxy Resources Limited (ASX:GXY)
Galaxy Projects Update
17

Slide 18[xx]Galaxy Resources Limited (ASX:GXY)
23,46732,998
47,075
March qtr 2017 June qtr 2017 Sept qtr 2017
380 393320
March qtr 2017 June qtr 2017 Sept qtr 2017
542722
843
March qtr 2017 June qtr 2017 Sept qtr 2017
+17%
(18%)
+43%
Mt Cattlin - Key Operational Metrics Q3 2017
18
1 Cash costs and realised prices before royalties and marketing fees
Achieved full production levels during the quarter 43% increase in concentrate produced due to
increased plant utilization, higher head grade and improved specific gravity control
Plant recoveries averaged 57% well above the budgeted target of 50-55%
18% reduction in average production cash costs in Q3 due to:― an increase of production volumes versus
production levels in Q2 2017; and― improved operating efficiencies
Realised selling price of US$843/t1 (A$1,062/t1) for the September quarter
Pricing for 2018 contracts being finalised with key customers
Galaxy successfully achieved improvement across key metrics for the September quarter
Spodumene Produced (dmt)
Production Cash Costs (US$/dmt)
Realised Selling Price (US$/dmt)
Q1 2017 Q2 2017 Q3 2017
Q1 2017 Q2 2017 Q3 2017
Q1 2017 Q2 2017 Q3 2017

Slide 19[xx]Galaxy Resources Limited (ASX:GXY)
Sal de Vida – Overview
One of the world’s largest and highest quality undeveloped brine deposits with significant expansion potential
Reserve category
Time period
TonnesLi total mass
Tonnes equivalent
Li2CO3
Tonnes K total mass
Tonnes equivalent
KCl
Proven 1-6 34,000 181,000 332,000 633,000
Probable 7-40 180,000 958,000 1,869,000 3,564,000
Total 40 years 214,000 1,139,000 2,201,000 4,197,000
Source: Revised Sal de Vida DFS – August 2016. Assumes 500mg/L Li cut off
19
Sal de Vida Reserve Estimates
Location
Sal de Vida, Salta & Catamarca, Argentina
A premier lithium and potash brine development project
― 100% owned by Galaxy and fully permitted
― Located between Salta and Catamarca Province in Argentina, in an area that is known as the ‘Lithium Triangle’
Lithium triangle home to >60% of global annual lithium production
― Sal de Vida located on the same salar as FMC’s Fenix operations
Revised DFS reaffirms the technical superiority of Sal de Vida and potential for a highly profitable operation
― Estimated post-tax NPV8% real of US$1.4bn
― Potential to generate average annual revenues of US$354M
― Potential to generate average annual operating cash flow of US$273M pre-tax (US$182M post-tax)
Large mineral reserves to support long life annual production of 25ktpa of battery grade lithium carbonate and 95ktpa of potash
Brine projects have the advantages of lower operational costs and greater ability to expand production facilities
Discussions advancing with offtakers and potential strategic partners
Slide 20[xx]Galaxy Resources Limited (ASX:GXY)
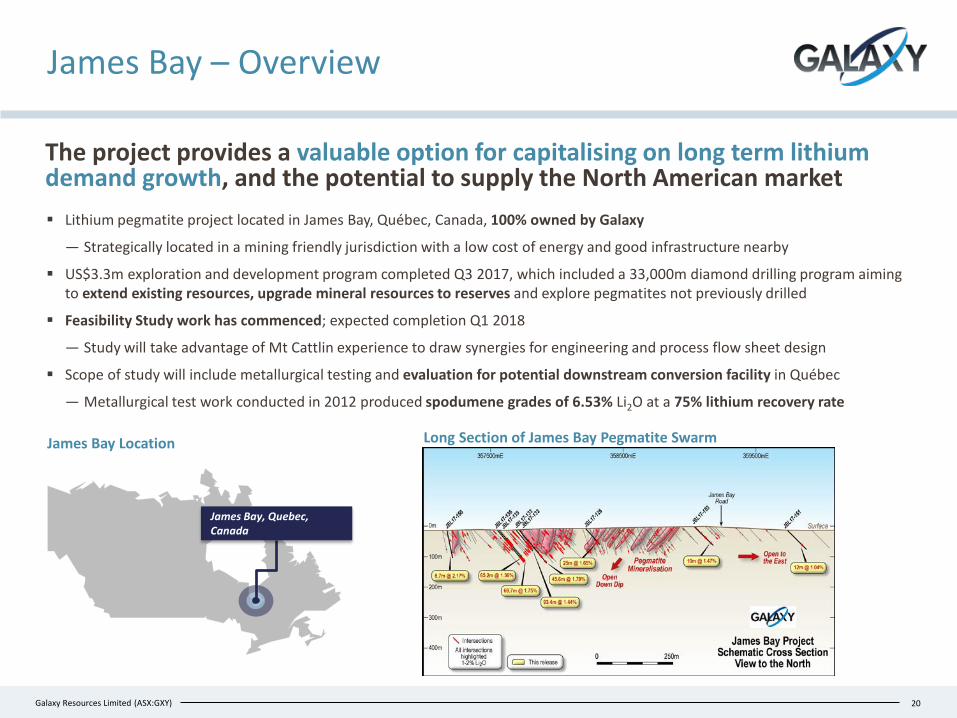
James Bay – Overview
The project provides a valuable option for capitalising on long term lithium demand growth, and the potential to supply the North American market Lithium pegmatite project located in James Bay, Québec, Canada, 100% owned by Galaxy
― Strategically located in a mining friendly jurisdiction with a low cost of energy and good infrastructure nearby
US$3.3m exploration and development program completed Q3 2017, which included a 33,000m diamond drilling program aiming to extend existing resources, upgrade mineral resources to reserves and explore pegmatites not previously drilled
Feasibility Study work has commenced; expected completion Q1 2018
― Study will take advantage of Mt Cattlin experience to draw synergies for engineering and process flow sheet design
Scope of study will include metallurgical testing and evaluation for potential downstream conversion facility in Québec
― Metallurgical test work conducted in 2012 produced spodumene grades of 6.53% Li2O at a 75% lithium recovery rate
20
James Bay, Quebec, Canada
James Bay Location Long Section of James Bay Pegmatite Swarm
Slide 21[xx]Galaxy Resources Limited (ASX:GXY)
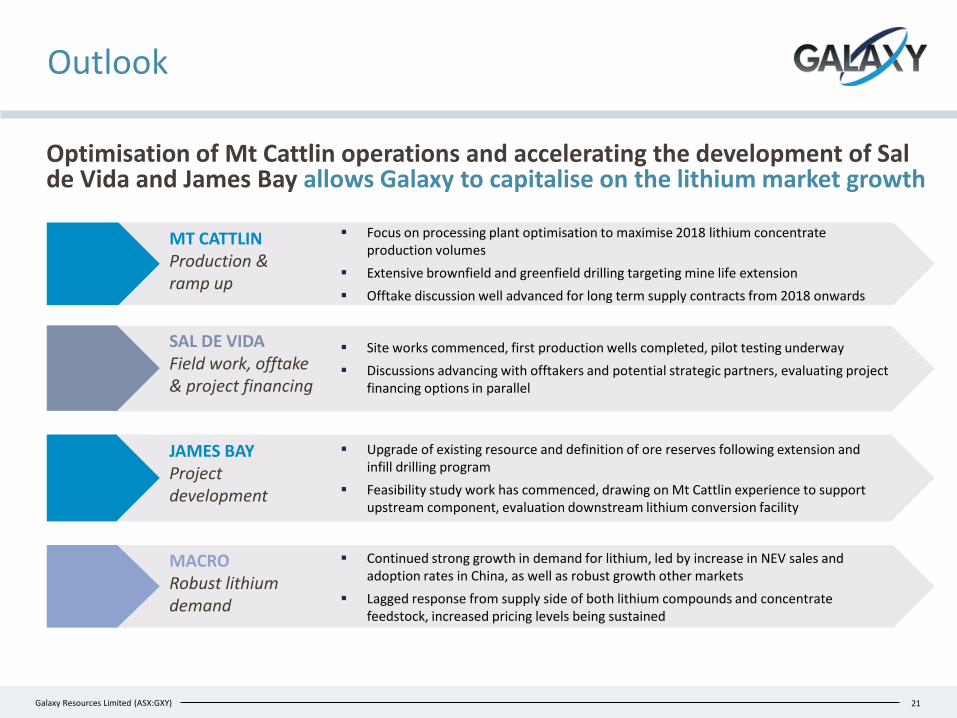
Outlook
Optimisation of Mt Cattlin operations and accelerating the development of Sal de Vida and James Bay allows Galaxy to capitalise on the lithium market growth
MT CATTLINProduction & ramp up
Focus on processing plant optimisation to maximise 2018 lithium concentrate production volumes
Extensive brownfield and greenfield drilling targeting mine life extension Offtake discussion well advanced for long term supply contracts from 2018 onwards
21
Continued strong growth in demand for lithium, led by increase in NEV sales and adoption rates in China, as well as robust growth other markets
Lagged response from supply side of both lithium compounds and concentrate feedstock, increased pricing levels being sustained
MACRORobust lithium demand
JAMES BAYProject development
Upgrade of existing resource and definition of ore reserves following extension and infill drilling program
Feasibility study work has commenced, drawing on Mt Cattlin experience to support upstream component, evaluation downstream lithium conversion facility
SAL DE VIDAField work, offtake & project financing
Site works commenced, first production wells completed, pilot testing underway Discussions advancing with offtakers and potential strategic partners, evaluating project
financing options in parallel
Slide 22[xx]Galaxy Resources Limited (ASX:GXY)
Competent Persons’ Statement
Competent Person StatementSal de Vida Any information in this report that relates to relates to the estimation and reporting of the Sal de Vida Project Mineral Resources and Mineral Reserves is extracted from the report entitled “Sal De Vida: Revised Definitive Feasibility Study Confirms Low Cost, Long Life and Economically Robust Operation” created on 22 August 2016 which is available to view on www.galaxylithium.com and www.asx.com.au. The Company confirms that it is not aware of any new information or data that materially affects the information included in the original market announcement and that all material assumptions and technical parameters underpinning the Mineral Resources and Mineral Reserves estimates in the relevant market announcement continue to apply and have not materially changed. The Company confirms that the form and context in which the Competent Person’s findings are presented have not been materially modified from the original market announcement.
James Bay The information in this report that relates to relates to the estimation and reporting of the James Bay exploration results is extracted from the ASX announcement’s dated 27 June 2017, 2 August 2017, 10 August 2017 and 14 September 2017 which are available to view on www.galaxylithium.com and www.asx.com.au. The Company confirms that it is not aware of any new information or data that materially affects the information included in the original market announcement and that all material assumptions and technical parameters underpinning the exploration results in the relevant market announcement continue to apply and have not materially changed. The Company confirms that the form and context in which the Competent Person’s findings are presented have not been materially modified from the original market announcement.
The information in this report that relates to Mineral Resources at the James Bay Project is based on work completed by Mr James McCann, who is a Member of the Ordre des Geologues du Quebec, a Recognised Overseas Professional Organisation. Mr McCann is a full time employee of Galaxy, and has sufficient experience which is relevant to the style of mineralisation and type of deposit under consideration and to the activity which he is undertaking to qualify as a Competent Person as defined in the 2004 edition of the “Australian Code for Reporting of Exploration Results, Mineral Resources and Ore Reserves”. Mr McCann consents to the inclusion in the report of the matters based on his information in the form and context it appears. This information was prepared and first disclosed under the JORC Code 2004 and it has not been updated since to comply with JORC code 2012 on the basis that the information has not materially changed since it was last reported.
Mt CattlinThe information in this report that relates to the estimation and reporting of the Mt Cattlin Project Mineral Resources and Mineral Reserves is extracted from the report entitled “Mt Cattlin Update: Revised Resource & Reserve Statement” created on 4 August 2015 published by General Mining Limited (ASX: GMM) which is available to view on www.asx.com.au. The Company confirms that it is not aware of any new information or data that materially affects the information included in the original market announcement made by GMM. The Company confirms that the form and context in which the Competent Person’s findings are presented have not been materially modified from the original market announcement.
22