gaining an understanding of value-added analysis value
TRANSCRIPT

Gaining An Understanding of Value-Added Analysis
Value-Added 101

Barbara Israel
�Credentialed Battelle for Kids faculty member
Your Presenter…
Copyright ©2009. Battelle for Kids.
Value-Added Academy
�Credentialed Battelle for Kids faculty member
�School Improvement Specialist
�RVAS
�OIP Facilitator
�Formative Assessment trainer

Learning Session Targets
�Gain an introductory understanding of
value-added analysis
�Understand the difference between progress and
achievement
Copyright ©2009. Battelle for Kids.
Value-Added AcademyValue-Added Academy
�Acquire an awareness of information available
in value-added reports
�Explore how value-added information can
inform educational improvement

Stair-Step Expectations
Copyright ©2009. Battelle for Kids.
Value-Added AcademyValue-Added Academy
�In a perfect world:
�Achievement test scores are enough to show
growth
�Students start at the same place
�Students progress at the same pace

Differentiated Reality
Copyright ©2009. Battelle for Kids.
Value-Added AcademyValue-Added Academy
�In reality:
� Students start at different places
�Students progress at different rates
�Need more than scores on single test to
show school’s effectiveness

�Achievement measures are snapshots in time.
Achievement Measures Alone Provide a Partial
Picture: Educational-Improvement Perspective
Birth Kindergarten 4th Grade Test
1st 2nd 3rd
Copyright ©2009. Battelle for Kids.
Value-Added AcademyValue-Added Academy
�Achievement measures are snapshots in time.
They provide information on what a child has
learned since birth.
�To improve schools, we need a metric that
provides reliable feedback on the work that
schools produce.

A View of Student Progress:
Accountability Perspective
Copyright ©2009. Battelle for Kids.
Value-Added Academy
We must expect that all students can make progress.

What is a Growth Measure?
Copyright ©2009. Battelle for Kids.
Value-Added AcademyValue-Added Academy

How is student assessment data used to produce a
Value-Added AnalysisConceptual Overview
Copyright ©2009. Battelle for Kids.
Value-Added AcademyValue-Added Academy
used to produce a value-added growth metric?

Tests must:
• Be highly correlated to curricular
Test Properties
Copyright ©2009. Battelle for Kids.
Value-Added Academy
• Be highly correlated to curricular
objectives.
• Have sufficient stretch.
• Have appropriate levels of reliability.

�Used when all tests across
grade levels have consistent
Mean Gain Approach
Copyright ©2009. Battelle for Kids.
Value-Added Academy
grade levels have consistent
scales.
�Percentile scores are converted to
Normal Curve Equivalents.

Normal Curve Equivalents
Copyright ©2009. Battelle for Kids.
Value-Added AcademyValue-Added Academy

Mean Gain Example
Year 1 • Grade 3
Student 1 377 = 26 (NCE)
Student 2 380 = 27
Student 3 360 = 19
Year 2 • Grade 4
Student 1 400 = 37 (NCE)
Student 2 385 = 30
Student 3 395 = 35
Math scaled scores for the same students.
Copyright ©2009. Battelle for Kids.
Value-Added Academy
Student 4 377 = 26
Student 5 380 = 28
Mean Baseline = 25.2
Student 4 405 = 41
Student 5 390 = 33
Mean Observed = 35.2
Growth = Mean Observed – Mean Baseline
Growth = 35.2 - 25.2 = 10.0
A crude measure of the growth for this group is 10 NCEs

High Progress
Positive School Effects
School Effect
Sample School Value-Added Report Math
Are the curriculum and instruction working for all students?
Mean Gain Approach (Converted to NCEs)
Copyright ©2009. Battelle for Kids.
Value-Added AcademyValue-Added Academy
High
Achievement
High Mean NCE or Mean Scaled Score
Effect
Observed
Baseline

Value-Added Summary Report
Copyright ©2009. Battelle for Kids.
Value-Added AcademyValue-Added Academy
Where are the areas of strength and weakness?

What pattern would represent optimum growth?
School Diagnostic Report
Copyright ©2009. Battelle for Kids.
Value-Added AcademyValue-Added Academy

Performance Diagnostic Report
Copyright ©2009. Battelle for Kids.
Value-Added AcademyValue-Added Academy
What pattern would represent optimum growth?

How does a student’s growth rate compare to other groups of students?
Student Report
Copyright ©2009. Battelle for Kids.
Value-Added AcademyValue-Added Academy

With average growth, where will this student likely score in the future?
Student Projection
Copyright ©2009. Battelle for Kids.
Value-Added AcademyValue-Added Academy

School Search Feature
Copyright ©2009. Battelle for Kids.
Value-Added AcademyValue-Added Academy
How are other schools with similar students performing?

In Summary, Value-Added Information Shows…
�The students’ progress made in each subject area and
grade level.
�The progress students made who enter the year at
different achievement levels.
Copyright ©2009. Battelle for Kids.
Value-Added AcademyValue-Added Academy
different achievement levels.
�How students’ progress in one curricular area or program
compares to their progress in another.
�Whether individual students are making adequate
progress toward state standards.
Without data, all we have are opinions!
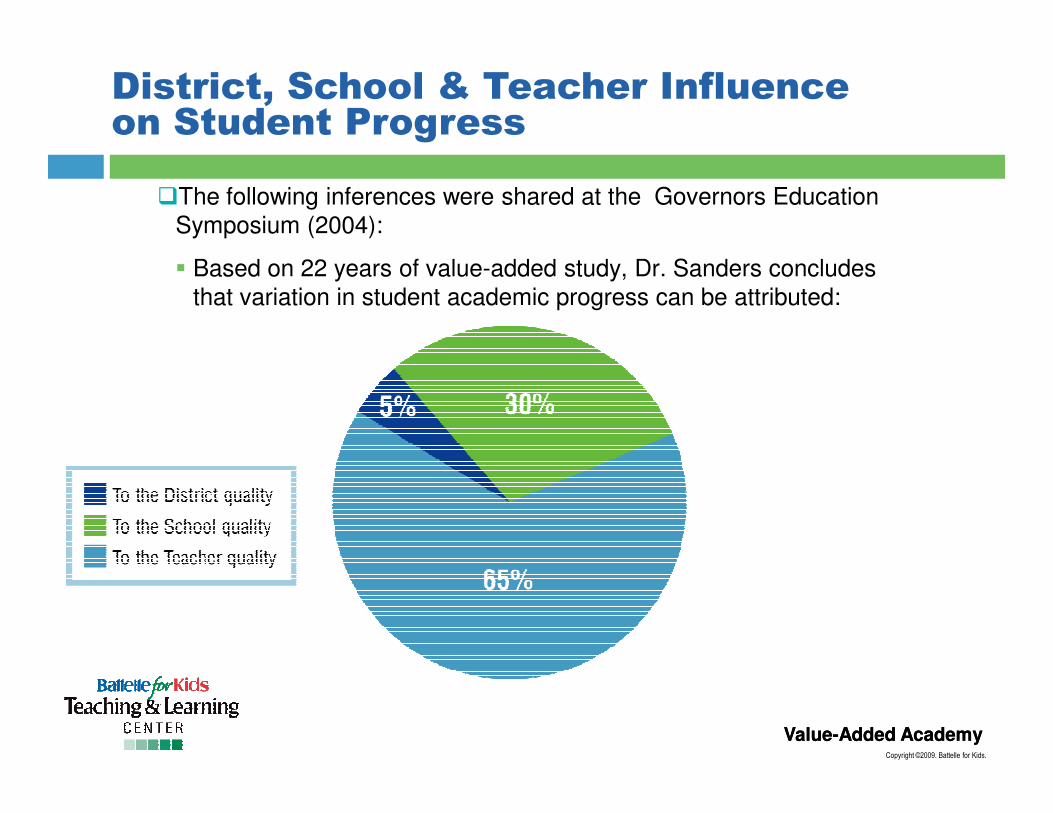
District, School & Teacher Influence on Student Progress
�The following inferences were shared at the Governors Education
Symposium (2004):
� Based on 22 years of value-added study, Dr. Sanders concludes
that variation in student academic progress can be attributed:
Copyright ©2009. Battelle for Kids.
Value-Added AcademyValue-Added Academy

Value-Added Analysis in Ohio
Project SOAR
Copyright ©2009. Battelle for Kids.
Value-Added Academy
Project SOAR
Ohio’s Value-Added
System
Ohio High School Value-Added Project
T-CAP

Project SOAR(Schools’ Online Assessment Reports)
� Operated by Battelle for Kids.
• Began in 2002 with 42 school districts.
• Now includes 100+ districts.
• Provides analysis in all core subjects,
Copyright ©2009. Battelle for Kids.
Value-Added AcademyValue-Added Academy
• Provides analysis in all core subjects,
grades 3-10.
• Uses state and non-state test data.
• Uses the mean predicted model.
• Expected growth is normative
(Average Growth).

Ohio’s Value-Added System
• Operated by the Ohio Department
of Education.
• Began as a grade 4 pilot in 2006 in
all districts and community schools.
Copyright ©2009. Battelle for Kids.
Value-Added AcademyValue-Added Academy
• Provides analysis in math & reading,
grades 4-8.
• Uses only state achievement test data.
• Uses the mean gain model.
• Expected growth is set by the State
Board of Education.

• If a district or school demonstrates more than
expected growth over two consecutive years it
moves up one level in the system.
Value-Added in the State
Accountability System
Copyright ©2009. Battelle for Kids.
Value-Added Academy
moves up one level in the system.
• If a district or school demonstrates less than
expected growth over three consecutive years it
moves down one level in the system.
• Value-added measures are significant at one
standard error.

• School L
• School F
• School B• School D
• School G• School I
• School N
The Power of Two: Achievement & Progress
How do value-added measures support what we know about schools?
Copyright ©2009. Battelle for Kids.
Value-Added AcademyValue-Added Academy
• School H
• School B
• School A
• School K
• School E
• School P
• School J
• School O
• School C
• School M
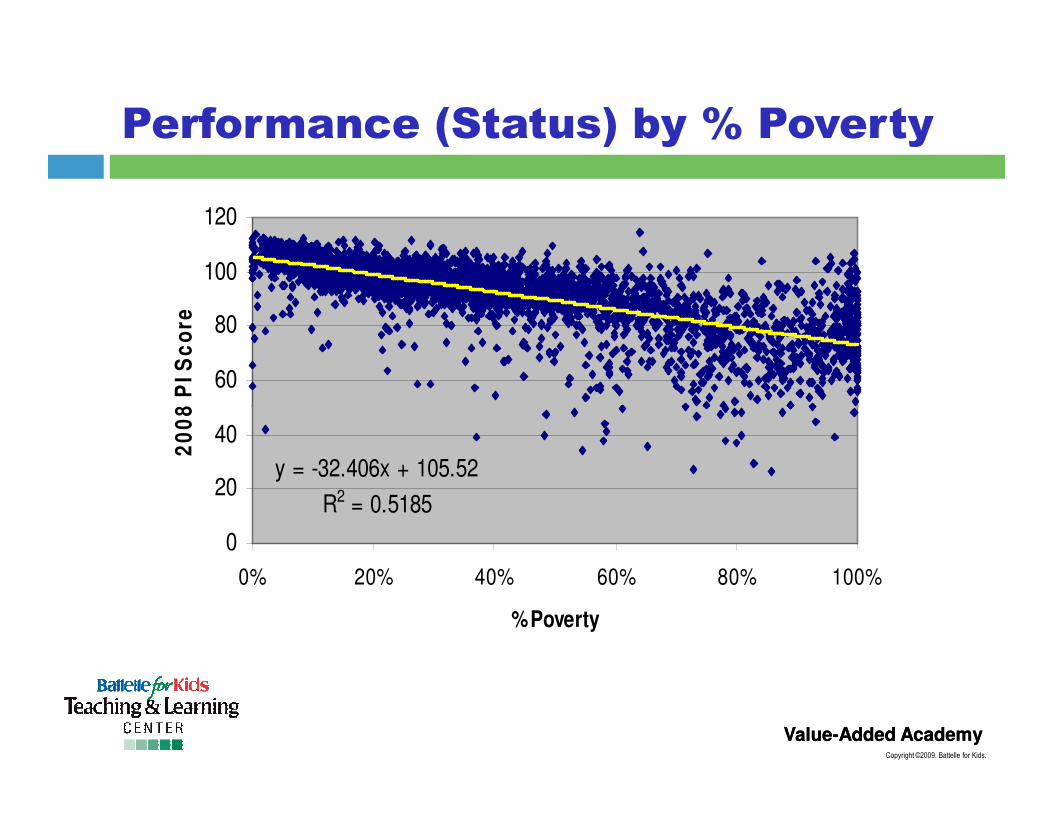
Performance (Status) by % Poverty
60
80
100
120
20
08
PI
Sc
ore
Copyright ©2009. Battelle for Kids.
Value-Added AcademyValue-Added Academy
y = -32.406x + 105.52
R2 = 0.5185
0
20
40
0% 20% 40% 60% 80% 100%
% Poverty
20
08
PI
Sc
ore

Value-added Gains by % Poverty
y = -2.208x + 0.2745
R2 = 0.039
0
5
10
15
20
252
00
8 V
A G
ain
Sc
ore
Copyright ©2009. Battelle for Kids.
Value-Added AcademyValue-Added Academy
-20
-15
-10
-5
0
0% 20% 40% 60% 80% 100%
% Poverty
20
08
VA
Ga
in S
co
re

Connections with School Improvement Efforts
How can value-added information be used in an
annual educational-improvement cycle?
Copyright ©2009. Battelle for Kids.
Value-Added AcademyValue-Added Academy

Beginning-of-the-Year Planning
Grade Level/Department Teams
• Examine value-added and other school performance
information.
• Assess strengths and weaknesses and their potential
Copyright ©2009. Battelle for Kids.
Value-Added AcademyValue-Added Academy
causes.
• Celebrate strengths.
• Set goal(s) that build on strengths and address
weaknesses.
• Create action plans, timelines and responsibilities.

Copyright ©2009. Battelle for Kids.
Value-Added AcademyValue-Added Academy

Value-Added Resources
Ohio Value-Added Portal
www.BattelleforKids.org/ohio
Copyright ©2009. Battelle for Kids.
Value-Added AcademyValue-Added Academy
Value-Added Toolkit
Ohio·Learn
Ohio·Focus

Ohio Value-Added Portal
www.BattelleforKids.org/ohio
Copyright ©2009. Battelle for Kids.
Value-Added AcademyValue-Added Academy

Learning Paths through Ohio●Learn
Copyright ©2009. Battelle for Kids.
Value-Added AcademyValue-Added Academy

www.BattelleforKids.org