gainesville regional utilities 2009 ten-year site plan
TRANSCRIPT

GAINESVILLE REGIONAL UTILITIES
2009 TEN-YEAR SITE PLAN
Submitted to:
The Florida Public Service Commission
April 2009

i
Table of Contents
INTRODUCTION .................................................................................................. 1 1. DESCRIPTION OF EXISTING FACILITIES.......................................................... 2
1.1 GENERATION.............................................................................................. 2 1.1.1 Generating Units................................................................................. 3 1.1.2 Generating Plant Sites........................................................................ 4
1.2 TRANSMISSION .......................................................................................... 5 1.2.1 The Transmission Network ................................................................. 5 1.2.2 Transmission Lines............................................................................. 5 1.2.3 State Interconnections........................................................................ 7
1.3 DISTRIBUTION ............................................................................................ 7 1.4 WHOLESALE ENERGY ............................................................................... 8 1.5 DISTRIBUTED GENERATION..................................................................... 9
2. FORECAST OF ELECTRIC ENERGY AND DEMAND REQUIREMENTS ........ 15
2.1 FORECAST ASSUMPTIONS AND DATA SOURCES ............................... 15 2.2 FORECASTS OF NUMBER OF CUSTOMERS, ENERGY SALES AND
SEASONAL PEAK DEMANDS................................................................... 17 2.2.1 Residential Sector............................................................................ 17 2.2.2 General Service Non-Demand Sector ............................................. 19 2.2.3 General Service Demand Sector ..................................................... 21 2.2.4 Large Power Sector ......................................................................... 22 2.2.5 Outdoor Lighting Sector ................................................................... 23 2.2.6 Wholesale Energy Sales.................................................................. 24 2.2.7 Total System Sales, Net Energy for Load, Seasonal Peak Demands
and DSM Impacts ............................................................................ 26 2.3 ENERGY SOURCES AND FUEL REQUIREMENTS ................................. 26
2.3.1 Fuels Used by System..................................................................... 26 2.3.2 Methodology for Projecting Fuel Use............................................... 27 2.3.3 Purchased Power Agreements ........................................................ 28
2.4 DEMAND-SIDE MANAGEMENT................................................................ 28 2.4.1 Demand-Side Management Program History and Current Status ... 29 2.4.2 Future Demand-Side Management Programs ................................. 31 2.4.3 Demand-Side Management Methodology and Results.................... 31 2.4.4 Gainesville Energy Advisory Committee.......................................... 32 2.4.5 Supply Side Programs ..................................................................... 33
2.5 FUEL PRICE FORECAST ASSUMPTIONS............................................... 35 2.5.1 Oil .................................................................................................... 35 2.5.2 Coal ................................................................................................. 36 2.5.3 Natural Gas...................................................................................... 36 2.5.4 Nuclear Fuel .................................................................................... 37
3. FORECAST OF FACILITIES REQUIREMENTS................................................. 50
3.1 GENERATION RETIREMENTS ................................................................. 50

ii
3.2 RESERVE MARGIN AND SCHEDULED MAINTENANCE ........................ 50 3.3 GENERATION ADDITIONS ....................................................................... 50 3.4 DISTRIBUTION SYSTEM ADDITIONS ...................................................... 51
4. ENVIRONMENTAL AND LAND USE INFORMATION ....................................... 59
4.1. DESCRIPTION OF POTENTIAL SITES FOR NEW GENERATING FACILITIES ................................................................................................ 59
4.2 DESCRIPTION OF PREFERRED SITES FOR NEW GENERATING FACILITIES ................................................................................................ 59 4.2.1 Land Use and Environmental Features ........................................... 59 4.2.2 Air Emissions ................................................................................... 60
4.3 STATUS OF APPLICATION FOR SITE CERTIFICATION......................... 60

1
INTRODUCTION
The 2009 Ten-Year Site Plan for Gainesville Regional Utilities (GRU) is
submitted to the Florida Public Service Commission pursuant to Section 186.801,
Florida Statutes. The contents of this report conform to information requirements
listed in Form PSC/EAG 43, as specified by Rule 25-22.072, Florida Administrative
Code. The four sections of the 2009 Ten-Year Site Plan are:
• Description of Existing Facilities
• Forecast of Electric Energy and Demand Requirements
• Forecast of Facilities Requirements
• Environmental and Land Use Information
Gainesville Regional Utilities (GRU) is a municipal electric, natural gas, water,
wastewater, and telecommunications utility system, owned and operated by the City
of Gainesville, Florida. The GRU retail electric system service area includes the City
of Gainesville and the surrounding urban area. The highest net integrated peak
demand recorded to date on GRU's electrical system was 481 Megawatts on August
8, 2007.

2
1. DESCRIPTION OF EXISTING FACILITIES
Gainesville Regional Utilities (GRU) operates a fully vertically-integrated
electric power production, transmission, and distribution system (herein referred to
as "the System"), and is wholly owned by the City of Gainesville. In addition to retail
electric service, GRU also provides wholesale electric service to the City of Alachua
(Alachua) and Clay Electric Cooperative (Clay). These wholesale contracts will
terminate after December 31, 2010 and December 31, 2012 respectively, unless
renewed. GRU's distribution system serves its retail territory of approximately 124
square miles and 92,795 customers (2008 average). The general locations of GRU
electric facilities and the electric system service area are shown in Figure 1.1.
1.1 GENERATION
The existing generating facilities operated by GRU are tabulated in Schedule
1 at the end of this chapter. The present summer net capability is 610 MW and the
winter net capability is 630 MW1. Currently, the System's energy is produced by
three fossil fuel steam turbines, six simple-cycle combustion turbines, one
combined-cycle unit, and a 1.4079% ownership share of the Crystal River 3 (CR3)
nuclear unit operated by Progress Energy Florida (PEF).
The System has two primary generating plant sites -- Deerhaven and John R.
Kelly (JRK). Each site comprises both steam-turbine and gas-turbine generating
units. The JRK station also utilizes a combined cycle unit.
1 Net capability is that specified by the "SERC Guideline Number Two for Uniform Generator Ratings for
Reporting." The winter rating will normally exceed the summer rating because generating plant efficiencies are increased by lower ambient air temperatures and lower cooling water temperatures.

3
1.1.1 Generating Units
1.1.1.1 Steam Turbines. The System's three operational simple-cycle
steam turbines are powered by fossil fuels and CR3 is nuclear powered. The fossil
fueled steam turbines comprise 54.8% of the System's net summer capability and
produced 84.6% of the electric energy supplied by the System in 2008. These units
range in size from 23.2 MW to 228.4 MW. The combined-cycle unit, which includes
a heat recovery steam generator/turbine and combustion turbine set, comprises
18.4% of the System's net summer capability and produced 8.5% of the electric
energy supplied by the System in 2008. The System's 11.6 MW share of CR3
comprises 1.9% of the System's net summer capability and produced 5.7% of total
electric energy in 2008. The System’s share of CR3 will increase to 11.981 MW in
2010, and to 13.911 MW in 2012 as the result of capacity upgrades planned by PEF.
Deerhaven Unit 2 and CR3 are used for base load purposes, while JRK Unit 7, JRK
CC1, and Deerhaven Unit 1 are used for intermediate loading.
1.1.1.2 Gas Turbines. The System's six industrial gas turbines make up
24.9% of the System's summer generating capability and produced 1.3% of the
electric energy supplied by the System in 2008. These simple-cycle combustion
turbines are utilized for peaking purposes only because their energy conversion
efficiencies are considerably lower than steam units. As a result, they yield higher
operating costs and are consequently unsuitable for base load operation. Gas
turbines are advantageous in that they can be started and placed on line quickly.
The System's gas turbines are most economically used as peaking units during high
demand periods when base and intermediate units cannot serve all of the System
loads.
1.1.1.3 Internal Combustion (Piston/Diesel). The two reciprocating
internal combustion engines operated by the System at the Southwest Landfill were
decommissioned in 2008 due to a diminished fuel supply.

4
1.1.1.4 Environmental Considerations. All of the System's steam turbines,
except for Crystal River 3, utilize recirculating cooling towers with a mechanical draft
for the cooling of condensed steam. Crystal River 3 uses a once-through cooling
system aided by helper towers. Only Deerhaven 2 currently has flue gas cleaning
equipment consisting of a “hot-side” electrostatic precipitator. Construction is
currently underway on a selective catalytic reduction system to reduce NOx, and a
dry flue gas desulfurization unit with fabric filters, which will reduce SO2, mercury,
and particulates. This equipment will result in a net decrease of 6 MW for
Deerhaven 2.
1.1.2 Generating Plant Sites
The locations of the System’s generating plant sites are shown on Figure 1.1.
1.1.2.1 John R. Kelly Plant. The Kelly Station is located in southeast
Gainesville near the downtown business district and consists of one combined cycle,
one steam turbine, three gas turbines, and the associated cooling facilities, fuel
storage, pumping equipment, transmission and distribution equipment.
1.1.2.2 Deerhaven Plant. The Deerhaven Station is located six miles
northwest of Gainesville. The original site, which was certified pursuant to the
Power Plant Siting Act, includes an 1146 acre parcel of partially forested land. The
facility consists of two steam turbines, three gas turbines, and the associated cooling
facilities, fuel storage, pumping equipment and transmission equipment. As
amended to include the addition of Deerhaven Unit 2 in 1981, the certified site now
includes coal unloading and storage facilities and a zero discharge water treatment
plant, which treats water effluent from both steam units. A potential expansion area,
owned by the System and adjacent to the certified Deerhaven plant site, was
incorporated into the Gainesville City limits February 12, 2007 (ordinance 0-06-130),
consists of an additional 2328 acres, for a total of 3474 acres.

5
1.2 TRANSMISSION
1.2.1 The Transmission Network
GRU's bulk electric power transmission network (System) consists of a 230
kV radial and a 138 kV loop connecting the following:
1) GRU's two generating stations,
2) GRU's nine distribution substations,
3) One 230 kV and two 138 kV interties with Progress Energy Florida (PEF),
4) A 138 kV intertie with Florida Power and Light Company (FPL),
5) A radial interconnection with Clay at Farnsworth Substation, and
6) A loop-fed interconnection with the City of Alachua at Alachua No. 1
Substation.
Refer to Figure 1.1 for line geographical locations and Figure 1.2 for electrical
connectivity and line numbers.
1.2.2 Transmission Lines
The ratings for all of GRU's transmission lines are given in Table 1.1. The
load ratings for GRU's transmission lines were developed in Appendix 6.1 of GRU's
Long-Range Transmission Planning Study, March 1991. Refer to Figure 1.2 for a
one-line diagram of GRU's electric system. The criteria for normal and emergency
loading are taken to be:
• Normal loading: conductor temperature not to exceed 100° C (212° F).
• Emergency 8 hour loading: conductor temperature not to exceed 125° C
(257° F).
6
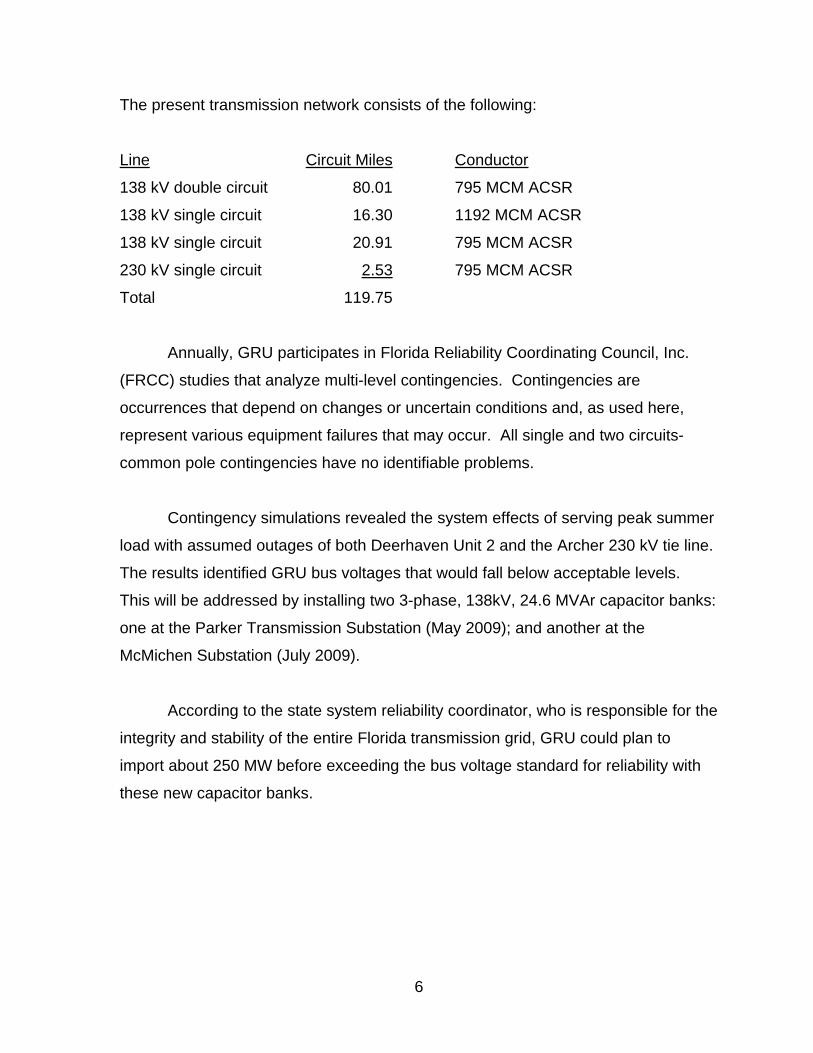
The present transmission network consists of the following:
Line Circuit Miles Conductor
138 kV double circuit 80.01 795 MCM ACSR
138 kV single circuit 16.30 1192 MCM ACSR
138 kV single circuit 20.91 795 MCM ACSR
230 kV single circuit 2.53 795 MCM ACSR
Total 119.75
Annually, GRU participates in Florida Reliability Coordinating Council, Inc.
(FRCC) studies that analyze multi-level contingencies. Contingencies are
occurrences that depend on changes or uncertain conditions and, as used here,
represent various equipment failures that may occur. All single and two circuits-
common pole contingencies have no identifiable problems.
Contingency simulations revealed the system effects of serving peak summer
load with assumed outages of both Deerhaven Unit 2 and the Archer 230 kV tie line.
The results identified GRU bus voltages that would fall below acceptable levels.
This will be addressed by installing two 3-phase, 138kV, 24.6 MVAr capacitor banks:
one at the Parker Transmission Substation (May 2009); and another at the
McMichen Substation (July 2009).
According to the state system reliability coordinator, who is responsible for the
integrity and stability of the entire Florida transmission grid, GRU could plan to
import about 250 MW before exceeding the bus voltage standard for reliability with
these new capacitor banks.

7
1.2.3 State Interconnections
The System is currently interconnected with PEF and FPL at four separate
points. The System interconnects with PEF's Archer Substation via a 230 kV
transmission line to the System's Parker Substation with 224 MVA of transformation
capacity from 230 kV to 138 kV. The System also interconnects with PEF's Idylwild
Substation with two separate circuits via a 150 MVA 138/69 kV transformer at the
Idylwild Substation. The System interconnects with FPL via a 138 kV tie between
FPL's Hampton Substation and the System's Deerhaven Substation. This
interconnection has a transformation capacity at Bradford Substation of 224 MVA.
All listed capacities are based on normal (Rating A) capacities.
1.3 DISTRIBUTION
The System has six loop-fed and three radial distribution substations
connected to the transmission network: Ft. Clarke, Kelly, McMichen, Millhopper,
Serenola, Sugarfoot, Ironwood, Kanapaha, and Rocky Point substations,
respectively. Parker is GRU’s only 230 kV transmission voltage substation. The
locations of these substations are shown on Figure 1.1.
The six major distribution substations are connected to the 138 kV bulk power
transmission network with looped feeds which prevent the outage of a single
transmission line from causing major outages in the distribution system. Ironwood,
Kanapaha and Rocky Point are served by a single tap to the 138 kV network which
would require distribution switching to restore customer power if the single
transmission line tapped experiences an outage. GRU serves its retail customers
through a 12.47 kV distribution network. The distribution substations, their present
rated transformer capabilities, and the number of circuits for each are listed in Table
1.2.
The System has three Power Delivery Substations (PDS) with single 33.6
MVA transformers that are directly radial-tapped to our looped 138 kV system.
8
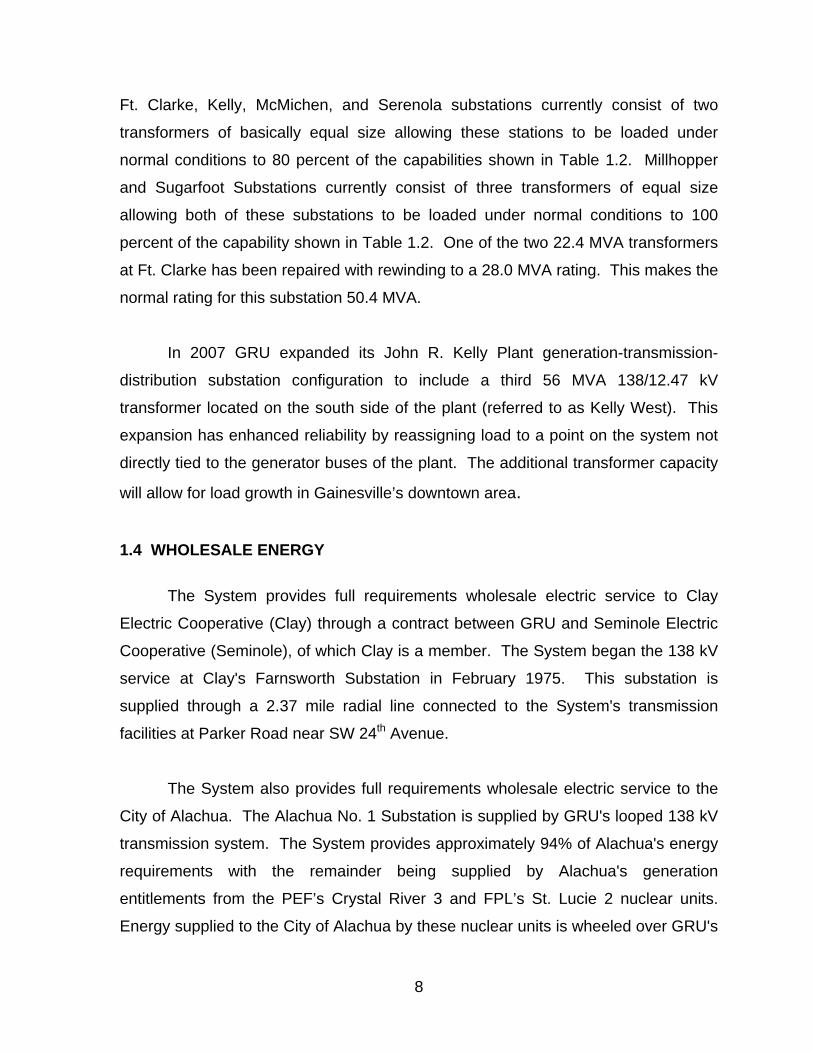
Ft. Clarke, Kelly, McMichen, and Serenola substations currently consist of two
transformers of basically equal size allowing these stations to be loaded under
normal conditions to 80 percent of the capabilities shown in Table 1.2. Millhopper
and Sugarfoot Substations currently consist of three transformers of equal size
allowing both of these substations to be loaded under normal conditions to 100
percent of the capability shown in Table 1.2. One of the two 22.4 MVA transformers
at Ft. Clarke has been repaired with rewinding to a 28.0 MVA rating. This makes the
normal rating for this substation 50.4 MVA.
In 2007 GRU expanded its John R. Kelly Plant generation-transmission-
distribution substation configuration to include a third 56 MVA 138/12.47 kV
transformer located on the south side of the plant (referred to as Kelly West). This
expansion has enhanced reliability by reassigning load to a point on the system not
directly tied to the generator buses of the plant. The additional transformer capacity
will allow for load growth in Gainesville’s downtown area. 1.4 WHOLESALE ENERGY
The System provides full requirements wholesale electric service to Clay
Electric Cooperative (Clay) through a contract between GRU and Seminole Electric
Cooperative (Seminole), of which Clay is a member. The System began the 138 kV
service at Clay's Farnsworth Substation in February 1975. This substation is
supplied through a 2.37 mile radial line connected to the System's transmission
facilities at Parker Road near SW 24th Avenue.
The System also provides full requirements wholesale electric service to the
City of Alachua. The Alachua No. 1 Substation is supplied by GRU's looped 138 kV
transmission system. The System provides approximately 94% of Alachua's energy
requirements with the remainder being supplied by Alachua's generation
entitlements from the PEF’s Crystal River 3 and FPL’s St. Lucie 2 nuclear units.
Energy supplied to the City of Alachua by these nuclear units is wheeled over GRU's

9
transmission network, with GRU providing generation backup in the event of outages
of these nuclear units. The City of Alachua and GRU agreed to extend the original
contract that expired on December 31, 2008 for two years.
Wholesale sales to Clay and the City of Alachua have been included as
native load for purposes of projecting GRU's needs for generating capacity and
associated reserve margins. This forms a conservative basis for planning purposes
in the event these contracts are renewed. Schedules 7.1 and 7.2 at the end of
Section 3 summarize GRU’s reserve margins.
1.5 DISTRIBUTED GENERATION
Construction of the South Energy Center was completed in February of 2009.
The South Energy Center will provide multiple onsite utility services to the new
Shands at UF Cancer Hospital. The new facility houses a 4.1 MW (summer rating)
natural gas-fired turbine capable of supplying 100% of the hospital’s electric and
thermal needs. The South Energy Center will provide electricity, chilled water,
steam and medical gases to the hospital. The unique design is 75% efficient at
primary fuel conversion to useful energy and greatly reduces emissions compared to
traditional generation. Commercial operation of the South Energy Center is
expected to begin in May of 2009.

10

11
FIGURE 1.2 Gainesville Regional Utilities Electric System One-Line Diagram.

Schedule 1EXISTING GENERATING FACILITIES
(1) (2) (3) (4) (5) (6) (7) (8) (9) (10) (11) (12) (13) (14) (15) (16)Alt.Fuel Commercial Expected
Unit Unit Primary Fuel Alternate Fuel Storage In-Service Retirement Summer Winter Summer WinterPlant Name No. Location Type Type Trans. Type Trans. (Days) Month/Year Month/Year MW MW MW MW Status
J. R. Kelly Alachua County 180.00 189.00 177.20 186.20FS08 Sec. 4, T10S, R20E CA WH PL [ 4/65 ; 5/01 ] 2051 38.00 38.00 37.00 37.00 OPFS07 (GRU) ST NG PL RFO TK 8/61 10/13 24.00 24.00 23.20 23.20 OPGT04 CT NG PL DFO TK 5/01 2051 76.00 82.00 75.00 81.00 OPGT03 GT NG PL DFO TK 5/69 05/19 14.00 15.00 14.00 15.00 OPGT02 GT NG PL DFO TK 9/68 09/18 14.00 15.00 14.00 15.00 OPGT01 GT NG PL DFO TK 2/68 02/18 14.00 15.00 14.00 15.00 OP
Deerhaven Alachua County 437.00 447.00 421.40 432.40FS02 Secs. 26,27,35 ST BIT RR 10/81 2031 235.00 235.00 228.40 228.40 OPFS01 T8S, R19E ST NG PL RFO TK 8/72 08/22 88.00 88.00 83.00 83.00 OPGT03 (GRU) GT NG PL DFO TK 1/96 2046 76.00 82.00 75.00 81.00 OPGT02 GT NG PL DFO TK 8/76 2026 19.00 21.00 17.50 20.00 OPGT01 GT NG PL DFO TK 7/76 2026 19.00 21.00 17.50 20.00 OP
Crystal River 3 Citrus County ST NUC TK 3/77 2037 12.24 12.42 11.60 11.89 OP(818/815) Sec. 33, T17S, R16E
(PEF)
System Total 610.20 630.49
Unit Type Fuel Type Transportation Method StatusCA = Combined Cycle Steam Part BIT = Bituminous Coal PL = Pipe Line OP = OperationalCT = Combined Cycle Combustion DFO = Distillate Fuel Oil RR = Railroad Turbine Part NG = Natural Gas TK = TruckGT = Gas Turbine NUC = UraniumST = Steam Turbine RFO = Residual Fuel Oil
WH = Waste Heat
Net CapabilityGross Capability
GRU 2009 Ten Year Site Plan Schedule 1
12

13
TABLE 1.1
TRANSMISSION LINE RATINGS SUMMER POWER FLOW LIMITS
Line Number Description
Normal 100°C (MVA)
Limiting Device
8-Hour Emergency
125°C (MVA)
Limiting Device
1 McMichen - Depot East 236.2 Conductor 282.0 Conductor 2 Millhopper - Depot West 236.2 Conductor 282.0 Conductor 3 Deerhaven - McMichen 236.2 Conductor 282.0 Conductor 6 Deerhaven - Millhopper 236.2 Conductor 282.0 Conductor 7 Depot East - Idylwild 236.2 Conductor 282.0 Conductor 8 Depot West - Serenola 236.2 Conductor 282.0 Conductor 9 Idylwild - Parker 236.2 Conductor 236.2 Conductor
10 Serenola - Sugarfoot 236.2 Conductor 282.0 Conductor 11 Parker - Clay Tap 143.6 Switch 186.0 Switch 12 Parker - Ft. Clarke 236.2 Conductor 282.0 Conductor 13 Clay Tap - Ft. Clarke 143.6 Switch 186.0 Switch 14 Ft. Clarke - Alachua 287.3 Switch 356.0 Conductor 15 Deerhaven - Hampton 224.01 Transformers 270.0 Transformers16 Sugarfoot - Parker 236.2 Conductor 282.0 Conductor 20 Parker-Archer(T75,T76) 224.0 Transformers 300.0 Transformers22 Alachua - Deerhaven 287.3 Switch 356.0 Conductor xx Clay Tap - Farnsworth 236.2 Conductor 282.0 Conductor xx Idylwild – PEF 150.02 Transformer 168.02 Transformer
1) These two transformers are located at the FPL Bradford Substation and are the limiting
elements in the Normal and Emergency ratings for this intertie. 2) This transformer, along with the entire Idylwild Substation, is owned and maintained by PEF. Assumptions:
100 °C for normal conductor operation 125 °C for emergency 8 hour conductor operation 40 °C ambient air temperature 2 ft/sec wind speed Transformers T75 & T76 normal limits are based on a 65 °C temperature rise rating.

14
TABLE 1.2
SUBSTATION TRANSFORMATION AND CIRCUITS
Distribution Substation Normal Transformer Rated Capability Current Number of Circuits
Ft. Clarke 50.4 MVA 4 J.R. Kelly2 168.0 MVA 20 McMichen 44.8 MVA 6 Millhopper 100.8 MVA 10 Serenola 67.2 MVA 8 Sugarfoot 100.8 MVA 9 Ironwood 33.6 MVA 3 Kanapaha 33.6 MVA 3 Rocky Point 33.6 MVA 3
Transmission Substation Normal Transformer Rated Capability Number of Circuits
Parker 224 MVA 5 Deerhaven No transformations- All
138 kV circuits 4
2 J.R. Kelly is a generating station as well as 2 distribution substations. One substation has 14
distribution feeders directly fed from the 2- 12.47 kV generator buses with connection to the 138 kV loop by 2- 56 MVA transformers. The other substation (Kelly West) has 6 distribution feeders fed from a single, loop-fed 56 MVA transformer.

15
2. FORECAST OF ELECTRIC ENERGY AND DEMAND REQUIREMENTS
Section 2 includes documentation of GRU's forecast of number of customers,
energy sales and seasonal peak demands; a forecast of energy sources and fuel
requirements; and an overview of GRU's involvement in demand-side management
programs.
The accompanying tables provide historical and forecast information for calendar
years 1999-2018. Energy sales and number of customers are tabulated in Schedules
2.1, 2.2 and 2.3. Schedule 3.1 gives summer peak demand for the base case forecast
by reporting category. Schedule 3.2 presents winter peak demand for the base case
forecast by reporting category. Schedule 3.3 presents net energy for load for the base
case forecast by reporting category. Short-term monthly load data is presented in
Schedule 4. Projected net energy requirements for the System, by method of
generation, are shown in Schedule 6.1. The percentage breakdowns of energy shown
in Schedule 6.1 are given in Schedule 6.2. The quantities of fuel expected to be used to
generate the energy requirements shown in Schedule 6.1 are given by fuel type in
Schedule 5.
2.1 FORECAST ASSUMPTIONS AND DATA SOURCES
(1) All regression analyses were based on annual data. Historical data was compiled for calendar years 1970 through 2008. System data, such as net energy for load, seasonal peak demands, customer counts and energy sales, was obtained from GRU records and sources.
(2) Estimates and projections of Alachua County population were obtained
from the Florida Population Studies, March 2008 (Bulletin No. 150), published by the Bureau of Economic and Business Research (BEBR) at the University of Florida.
(3) Historical weather data was used to fit regression models. The forecast
assumes normal weather conditions. Normal heating degree days and cooling degree days equal the mean of data reported to NOAA by the Gainesville Municipal Airport station from 1984-2008.
16
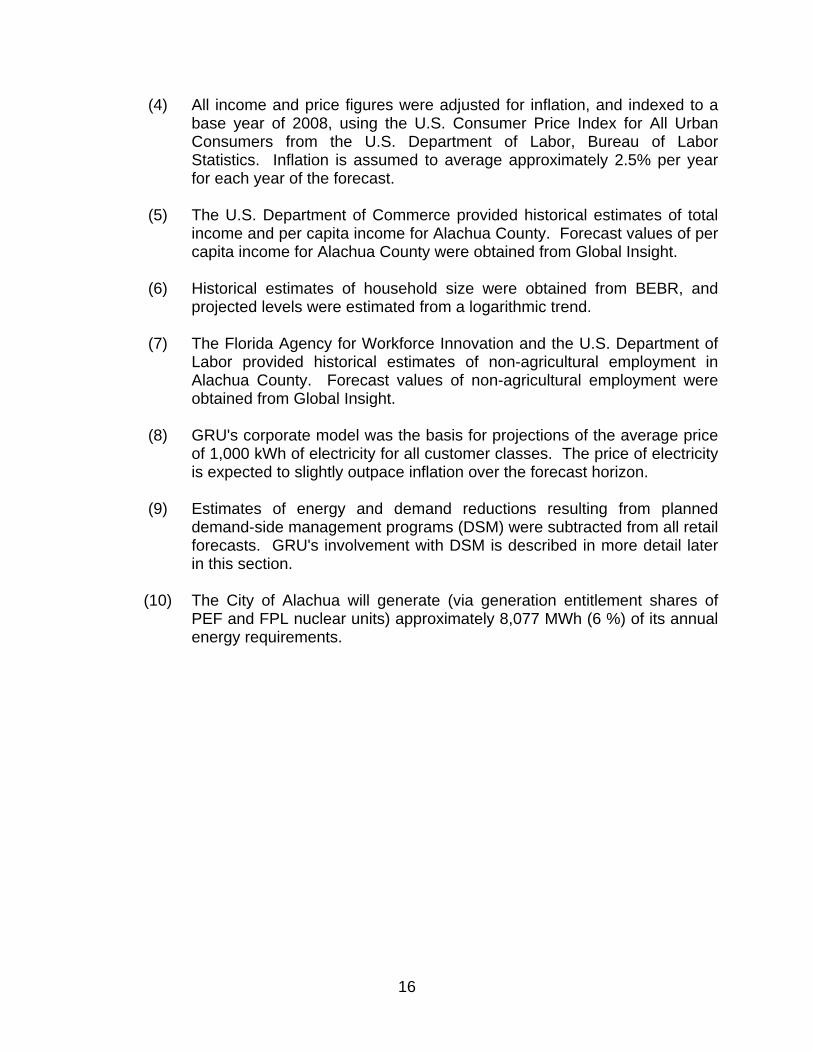
(4) All income and price figures were adjusted for inflation, and indexed to a base year of 2008, using the U.S. Consumer Price Index for All Urban Consumers from the U.S. Department of Labor, Bureau of Labor Statistics. Inflation is assumed to average approximately 2.5% per year for each year of the forecast.
(5) The U.S. Department of Commerce provided historical estimates of total
income and per capita income for Alachua County. Forecast values of per capita income for Alachua County were obtained from Global Insight.
(6) Historical estimates of household size were obtained from BEBR, and
projected levels were estimated from a logarithmic trend.
(7) The Florida Agency for Workforce Innovation and the U.S. Department of Labor provided historical estimates of non-agricultural employment in Alachua County. Forecast values of non-agricultural employment were obtained from Global Insight.
(8) GRU's corporate model was the basis for projections of the average price
of 1,000 kWh of electricity for all customer classes. The price of electricity is expected to slightly outpace inflation over the forecast horizon.
(9) Estimates of energy and demand reductions resulting from planned
demand-side management programs (DSM) were subtracted from all retail forecasts. GRU's involvement with DSM is described in more detail later in this section.
(10) The City of Alachua will generate (via generation entitlement shares of
PEF and FPL nuclear units) approximately 8,077 MWh (6 %) of its annual energy requirements.
17
2.2 FORECASTS OF NUMBER OF CUSTOMERS, ENERGY SALES AND SEASONAL PEAK DEMANDS
Number of customers, energy sales and seasonal peak demands were
forecast from 2009 through 2018. Separate energy sales forecasts were developed
for each of the following customer segments: residential, general service non-
demand, general service demand, large power, outdoor lighting, sales to Clay, and
sales to Alachua. Separate forecasts of number of customers were developed for
residential, general service non-demand, general service demand and large power
retail rate classifications. The basis for these independent forecasts originated with
the development of least-squares regression models. All modeling was performed
in-house using the Statistical Analysis System (SAS)3. The following text describes
the regression equations utilized to forecast energy sales and number of customers.
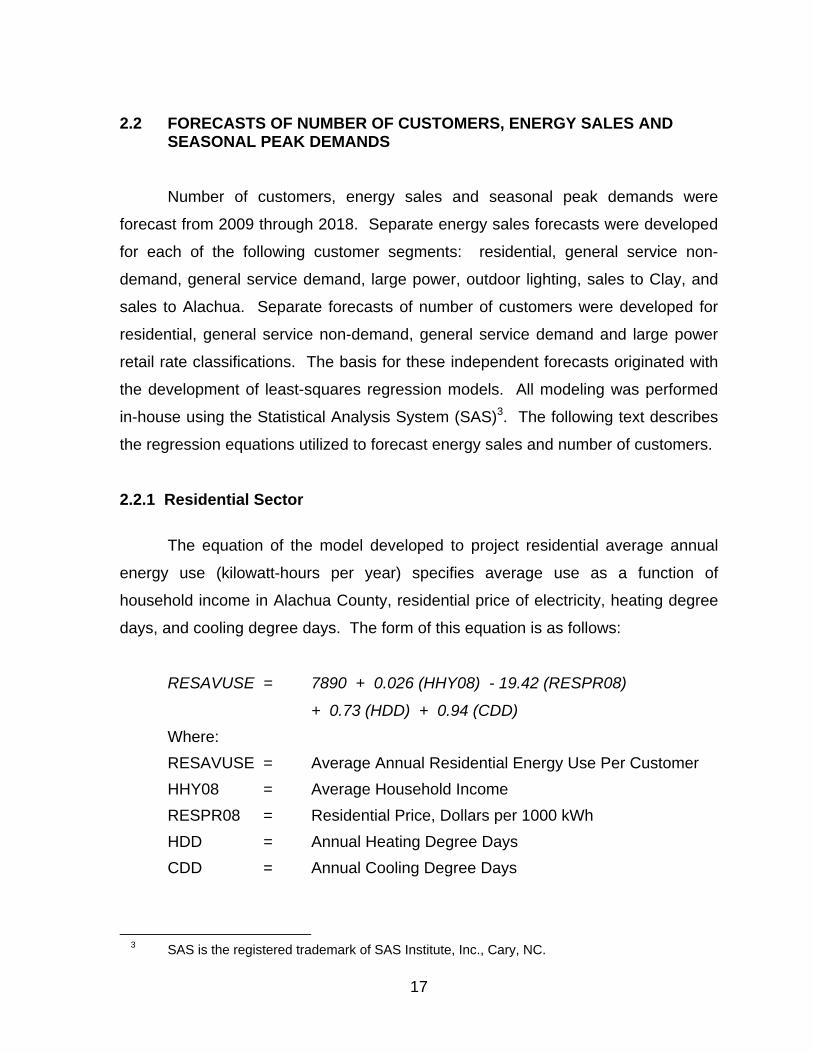
2.2.1 Residential Sector
The equation of the model developed to project residential average annual
energy use (kilowatt-hours per year) specifies average use as a function of
household income in Alachua County, residential price of electricity, heating degree
days, and cooling degree days. The form of this equation is as follows:
RESAVUSE = 7890 + 0.026 (HHY08) - 19.42 (RESPR08)
+ 0.73 (HDD) + 0.94 (CDD) Where: RESAVUSE = Average Annual Residential Energy Use Per Customer HHY08 = Average Household Income RESPR08 = Residential Price, Dollars per 1000 kWh HDD = Annual Heating Degree Days CDD = Annual Cooling Degree Days
3 SAS is the registered trademark of SAS Institute, Inc., Cary, NC.

18
Adjusted R2 = 0.8093 DF (error) = 32 (period of study, 1971-2008) t - statistics:
Intercept = 5.03 HHY08 = 2.36 RESPR08 = -5.10 HDD = 3.07 CDD = 3.45
Projections of the average annual number of residential customers were developed from a linear regression model stating the number of customers as a function of Alachua County population, the number of persons per household, the historical series of Clay customer transfers, and an indicator variable for customer counts recorded under the billing system used prior to 1992. The residential customer model specifications are:
RESCUS = 99588 + 287.8 (POP) – 40779 (HHSize) + 0.90 (CLYRCus) – 976 (OldSys) Where: RESCUS = Number of Residential Customers POP = Alachua County Population (thousands) HHSize = Number of Persons per Household CLYRCus = Clay Customer Transfers OldSys = Older Billing System (1978-1991)
Adjusted R2 = 0.9992 DF (error) = 25 (period of study, 1978-2008) t - statistics:
Intercept = 9.63 POP = 30.34 HHSize = -11.15 CLYRCus = 5.09

19
OldSys = -2.37 The product of forecasted values of average use and number of customers yielded the projected energy sales for the residential sector.
2.2.2 General Service Non-Demand Sector
The general service non-demand (GSN) customer class includes non-
residential customers with maximum annual demands less than 50 kilowatts (kW).
In 1990, GRU began offering GSN customers the option to elect the General Service
Demand (GSD) rate classification. This option offers potential benefit to GSN
customers that use high amounts of energy and have good load factors. Since
1990, 428 customers have elected to transfer to the GSD rate class. The forecast
assumes that additional GSN customers will voluntarily elect the GSD classification,
but at a more modest pace than has been observed historically. A regression model
was developed to project average annual energy use by GSN customers. The
model includes as independent variables, the cumulative number of optional
demand customers and cooling degree days. The specifications of this model are
as follows:
GSNAVUSE = 23.51 – 0.012 (OPTDCus) + 0.0016 (CDD)
Where:
GSNAVUSE = Average annual energy usage by GSN customers
OPTDCus = Cumulative number of Optional Demand Customers
CDD = Annual Cooling Degree Days
Adjusted R2 = 0.8521
DF (error) = 26 (period of study, 1979-2008)
20
t - statistics:
Intercept = 11.25
OPTDCus = -12.13
CDD = 2.11
The number of general service non-demand customers was projected using
an equation specifying customers as a function of Alachua County population, Clay
non-demand transfer customers, and the number of optional demand customers.
The specifications of the general service non-demand customer model are as
follows:
GSNCUS = -5345 + 60.0(POP) + 2.81(CLYNCus) – 3.15(OptDCus)
Where:
GSNCUS = Number of General Service Non-Demand Customers
POP = Alachua County Population (thousands)
CLYNCus = Clay Non-Demand Transfer Customers
OptDCus = Optional Demand Customers
Adjusted R2 = 0.9947
DF (error) = 26 (period of study, 1978-2008)
t - statistics:
Intercept = -8.56
POP = 15.28
CLYNCus = 2.27
OptDCus = -4.82
Forecasted energy sales to general service non-demand customers were
derived from the product of projected number of customers and the projected
average annual use per customer.

21
2.2.3 General Service Demand Sector
The general service demand customer class includes non-residential
customers with established annual maximum demands generally of at least 50 kW
but less than 1,000 kW. Average annual energy use per customer was projected
using an equation specifying average use as a function of per capita income
(Alachua County) and the number of optional demand customers. A significant
portion of the energy load in this sector is from large retailers such as department
stores and grocery stores, whose business activity is related to income levels of area
residents. Average energy use projections for general service demand customers
result from the following model:
GSDAVUSE = 326.2 + 0.0081 (PCY08) – 0.22 (OPTDCust)
Where:
GSDAVUSE = Average annual energy use by GSD Customers
PCY08 = Per Capita Income in Alachua County
OPTDCust = Cumulative number of Optional Demand Customers
Adjusted R2 = 0.6934
DF (error) = 26 (period of study, 1979-2008)
t - statistics:
Intercept = 12.19
PCY08 = 7.64
OPTDCust = -7.63
The annual average number of customers was projected using a regression
model that includes Alachua County population, Clay demand customer transfers,
and the number of optional demand customers as independent variables. The
specifications of the general service demand customer model are as follows:
GSDCUS = -437.9 + 5.37(POP) + 19.65(CLYDCus) + 0.48(OptDCus)

22
Where:
GSDCUS = Number of General Service Demand Customers
POP = Alachua County Population (thousands)
CLYDCus = Clay Demand Transfer Customers
OptDCus = Optional Demand Customers
Adjusted R2 = 0.9958
DF (error) = 26 (period of study, 1978-2008)
t - statistics:
Intercept = -5.74
POP = 11.38
CLYDCus = 4.40
OptDCus = 6.28
The forecast of energy sales to general service demand customers was the
resultant product of projected number of customers and projected average annual
use per customer.
2.2.4 Large Power Sector
The large power customer class currently includes eleven customers that
maintain an average monthly billing demand of at least 1,000 kW. Analyses of
average annual energy use were based on historical observations from 1976
through 2008. The model developed to project average use by large power
customers includes Alachua County nonagricultural employment and large power
price of electricity as independent variables. Energy use per customer has been
observed to increase over time, presumably due to the periodic expansion or
increased utilization of existing facilities. This growth is measured in the model by
local employment levels. The specifications of the large power average use model
are as follows:
LPAVUSE = 7549 + 31.6 (NONAG) - 13.8 (LPPR08)

23
Where:
LPAVUSE = Average Annual Energy Consumption (MWh per Year)
NONAG = Alachua County Nonagricultural Employment (000's) LPPR08 = Average Price for 1,000 kWh in the Large Power Sector
Adjusted R2 = 0.8994 DF (error) = 30 (period of study, 1976-2008)
t - statistics:
INTERCEPT = 6.61
NONAG = 5.43
LPPR08 = -2.10
The forecast of energy sales to the large power sector was derived from the
product of projected average use per customer and the projected number of large power customers, which are projected to remain constant at eleven.
2.2.5 Outdoor Lighting Sector
The outdoor lighting sector consists of streetlight, traffic light, and rental light accounts. Outdoor lighting energy sales account for approximately 1.3% of total
energy sales. Outdoor lighting energy sales were forecast using a model which specified lighting energy as a function of the natural log of the number of residential
customers. The specifications of this model are as follows:
LGTMWH = -287291 + 27878 (LNRESCUS)
Where:
LGTMWH = Outdoor Lighting Energy Sales
LNRESCUS = Number of Residential Customers (natural log)
Adjusted R2 = 0.9918
DF (error) = 13 (period of study, 1994-2008)

24
t - statistics:
Intercept = -38.25
RESCUS = 41.28
2.2.6 Wholesale Energy Sales As previously described, the System provides control area services to two
wholesale customers: Clay Electric Cooperative (Clay) at the Farnsworth Substation; and the City of Alachua (Alachua) at the Alachua No. 1 Substation, and
at the Hague Point of Service. Approximately 6% of Alachua's 2008 energy
requirements were met through generation entitlements of nuclear generating units operated by PEF and FPL. These wholesale delivery points serve an urban area
that is either included in, or adjacent to the Gainesville urban area. These loads are considered part of the System’s native load for facilities planning through the
forecast horizon. GRU provides other utilities services in the same geographic areas served by Clay and Alachua, and continued electrical service will avoid
duplicating facilities. Furthermore, the populations served by Clay and Alachua benefit from services provided by the City of Gainesville, which are in part supported
by transfers from the System.
Clay-Farnsworth net energy requirements were modeled with an equation in which Alachua County population was the independent variable. Output from this
model was adjusted to account for the history of load that has been transferred between GRU and Clay-Farnsworth, yielding energy sales to Clay. Historical
boundary adjustments between Clay and GRU have reduced the duplication of facilities in both companies’ service areas. The form of the Clay-Farnsworth net
energy requirements equation is as follows:
CLYNEL = -53730 + 578.3 (POP)

25
Where:
CLYNEL = Farnsworth Substation Net Energy (MWh)
POP = Alachua County Population (000’s)
Adjusted R2 = 0.9420
DF (error) = 17 (period of study, 1990-2008) t - statistics:
Intercept = -7.38
POP = 17.13
Net energy requirements for Alachua were estimated using a model in which
City of Alachua population was the independent variable. BEBR provided historical estimates of City of Alachua Population. This variable was projected from a trend
analysis of the component populations within Alachua County. The model used to develop projections of sales to the City of Alachua is of the following form:
ALANEL = -61514 + 22693 (ALAPOP) Where:
ALANEL = City of Alachua Net Energy (MWh) ALAPOP = City of Alachua Population (000’s)
Adjusted R2 = 0.9846 DF (error) = 25 (period of study, 1982-2008)
t - statistics: Intercept = -19.33
ALAPOP = 40.77
To obtain a final forecast of the System's sales to Alachua, projected net energy requirements were reduced by 8,077 MWh reflecting the City of Alachua's
nuclear generation entitlements.
26
2.2.7 Total System Sales, Net Energy for Load, Seasonal Peak Demands and Conservation Impacts
The forecast of total system energy sales was derived by summing energy
sales projections for each customer class; residential, general service non-demand,
general service demand, large power, outdoor lighting, sales to Clay, and sales to
Alachua. Net energy for load was then forecast by applying a delivered efficiency
factor for the System to total energy sales. The projected delivered efficiency factor
used in this forecast is 0.96. Historical delivered efficiencies were examined from
the past 25 years to make this determination. The impact of energy savings from
conservation programs was accounted for in energy sales to each customer class,
prior to calculating net energy for load.
The forecasts of seasonal peak demands were derived from forecasts of
annual net energy for load. Winter peak demands are projected to occur in January
of each year, and summer peak demands are projected to occur in August of each
year, although historical data suggests the summer peak is nearly as likely to occur
in July. The average ratio of the most recent 25 years' monthly net energy for load
for January and August, as a portion of annual net energy for load, was applied to
projected annual net energy for load to obtain estimates of January and August net
energy for load over the forecast horizon. The medians of the past 25 years' load
factors for January and August were applied to January and August net energy for
load projections, yielding seasonal peak demand projections. Forecast seasonal
peak demands include the net impacts from planned conservation programs.
2.3 ENERGY SOURCES AND FUEL REQUIREMENTS 2.3.1 Fuels Used by System
Presently, the system is capable of using coal, residual oil, distillate oil,
natural gas, and a small percentage of nuclear fuel to satisfy its fuel requirements.
Since the completion of the Deerhaven 2 coal-fired unit, the System has relied upon

27
coal to fulfill much of its fuel requirements. To the extent that the System
participates in interchange sales and purchases, actual consumption of these fuels
will likely differ from the base case requirements indicated in Schedule 5. These
projections are based on a fuel price forecast prepared in 2008.
2.3.2 Methodology for Projecting Fuel Use
The fuel use projections were produced using the Electric Generation
Expansion Analysis System (EGEAS) developed under Electric Power Research
Institute guidance. Ng Engineering provides support, maintenance, and training for
the EGEAS software. This is the same software the System uses to perform long-
range integrated resource planning. EGEAS has the ability to model each of the
System’s generating units as well as optimize the selection of new capacity and
technologies (see Section 3), and include the effects of environmental limits, dual
fuel units, reliability constraints, and maintenance schedules. The production
modeling process uses a load-duration curve convolution and conjoint probability
model to simulate optimal hourly dispatch of the System’s generating resources.
The input data to this model includes:
(1) Long-term forecast of System electric energy and power demand
needs; (2) Projected fuel prices, outage parameters, nuclear refueling cycle, and
maintenance schedules for each generating unit in the System; (3) Similar data for the new plants that will or could be added to the
system to maintain system reliability.
The output of this model includes: (1) Monthly and yearly operating fuel expenses by fuel type and unit; and (2) Monthly and yearly capacity factors, energy production, hours of
operation, fuel utilization, and heat rates for each unit in the system.
28
2.3.3 Purchased Power Agreements
2.3.3.1 G2 Energy Baseline Landfill Gas. GRU has entered into a 15-year
contract to receive 3 MW of landfill gas fueled capacity at the Marion County
Baseline Landfill, from G2 Energy Marion, LLC. The generation facility began
commercial operation on January 1, 2009. G2 expects to complete a capacity
expansion of 0.8 MW by December 2009, bringing net output to 3.8 MW.
2.3.3.2 Progress Energy 50 MW. GRU negotiated a contract with Progress
Energy Florida (PEF) for 50 MW of base load capacity. This contract began January
1, 2009 and continues through December 31, 2013. Extensions of this contract are
subject to negotiation. An additional 25 MW baseload capacity was contracted from
January 1, 2009 through December 31, 2010, and another additional 25 MW of
baseload capacity was contracted for March through August of 2009 and 2010. 2.3.3.3 Biomass RFP for PPA. GRU is negotiating a 25-year purchase
power agreement with American Renewables for 100 MW of biomass capacity to be
online before January 1, 2014. GRU anticipates reselling approximately 50 MW of
capacity from this unit for up to 10 years.
2.3.3.4 Inglis Hydro. GRU is negotiating with Inglis Hydroelectric, LLC for
about 2 MW of hydro power located in Levy County near the Inglis locks of the Cross
Florida Barge Canal. The anticipated in-service date is mid 2013.
2.3.3.5 Solar Feed-In Tariff. In March of 2009 GRU became the first utility
in the United States to offer a European-style solar feed-in tariff (FIT). Under this
program, GRU agrees to purchase 100% of the solar power produced from any
private generator at a fixed rate for a contract term of 20 years. The FIT rate has
built-in subsidy to incentivize the installation of solar in the community, and help
create a strong solar marketplace. GRU’s FIT costs are recovered through fuel
adjustment charges, and have been limited to the equivalent of a 1.5% base rate
increase. This limit translates to an annual capacity stop-loss to purchase 4 MW.

29
GRU has received applications to fully build out this capacity in the first two years of
the program, and applications are continuing to be aquired.
2.4 DEMAND-SIDE MANAGEMENT 2.4.1 Demand-Side Management Program History and Current Status
Demand and energy forecasts and generation expansion plans outlined in
this Ten Year Site Plan include impacts from GRU’s Demand-Side Management
(DSM) programs. The System forecast reflects the incremental impacts of DSM
measures, net of cumulative impacts from 1980 through 2008. DSM programs are
available for all retail customers, including commercial and industrial customers, and
are designed to effectively reduce and control the growth rates of electric
consumption and weather sensitive peak demands.
DSM direct services currently available to the System’s residential customers,
or expected to be implemented during 2009, include energy audits and low income
household whole house energy efficiency improvements. GRU also offers rebates
and other financial incentives for the promotion of:
• high efficiency central air conditioning
• high efficiency room air conditioning
• central air conditioner maintenance
• reflective roof coating for mobile homes
• solar water heating
• solar photovoltaic systems
• natural gas in new construction
• Home Performance with the federal Energy Star program
• Energy Star building practices of the EPA
• Green Building practices
• heating/cooling duct repair

30
• variable speed pool pumps
• energy efficiency for low-income households
• attic and raised-floor insulation
• removing second refrigerators from homes and recycling the materials
• compact fluorescent light bulbs
• energy efficiency low-interest loans
• natural gas for displacement of electric in water heating, space
heating, and space cooling in existing structures.
Energy audits are available to the System’s non-residential customers. In
addition GRU offers rebates and other considerations for the promotion of:
• solar water heating
• solar photovoltaic
• natural gas for water heating and space heating
• vending machine motion sensors
• efficient exit lighting
• customized business rebates for energy efficiency retrofits
The System continues to offer standardized interconnection procedures and
compensation for excess energy production for both residential and non-residential
customers who install distributed resources and offers rebates to residential
customers for the installation of photovoltaic generation. The solar feed-in tariff has
replaced photovoltaic rebates as the incentive for non-residential customers to
implement distributed solar generation.
Grants and voluntary customer contributions have made several renewable
projects possible within GRU’s service area. A combination of customer
contributions and State and Federal grants allowed GRU to add its 10 kW
photovoltaic array at the Electric System Control Center in 1996. GRU secured
grant funding through the Department of Community Affairs’ PV for Schools

31
Educational Enhancement Program for PV systems that were installed at two middle
schools in 2003. And currently, the GRUGreensm program gives customers the
opportunity to invest in renewable energy resources including landfill gas, solar, and
wind energy credits through contributions on their monthly bill.
GRU has also produced numerous factsheets, publications, and videos which
are available at no charge to customers to assist them in making informed decisions
affecting their energy utilization patterns. Examples include: Passive Solar Design-
Factors for North Central Florida, a booklet which provides detailed solar and
environmental data for passive solar designs in this area; Solar Guidebook, a
brochure which explains common applications of solar energy in Gainesville; and
The Energy Book, a guide to conserving energy at home.
2.4.2 Future Demand-Side Management Programs
GRU continues to monitor the potential for additional DSM efforts including
programs addressing thermal storage, district chilled water cooling, window shading,
additional energy efficiency in low-income households and demand response. GRU
continues to review the efforts of conservation leaders in the industry, and has
conducted fact finding trips to California, Texas, Vermont and New York to maximize
these efforts. GRU plans to continue to expand its DSM programs as a way to cost-
effectively meet customer needs and hedge against potential future carbon tax and
trade programs.
2.4.3 Demand-Side Management Methodology and Results
The expected effect of DSM program participation was derived from a
comparative analysis of historical energy usage of DSM program participants and
non-participants. The methodology upon which existing DSM programs is based
includes consideration of what would happen under current conditions, the fact that
the conservation induced by utility involvement tends to "buy" conservation at the

32
margin, adjustment for behavioral rebound and price elasticity effects and effects of
abnormal weather. Known interactions between measures and programs were
accounted for where possible. Projected penetration rates were based on historical
levels of program implementations and tied to escalation rates paralleling service
area population growth. GRU has contracted with a consultant to perform a
measurement and verification analysis of several of the conservation programs
implemented over the past two years. Results from this study will aid GRU in both
determining which programs are most effective and in quantifying the energy and
demand savings achieved by these measures.
The implementation of DSM programs planned for 2009-2018 is expected to
provide an additional 49 MW of summer peak reduction and 123 GWh of annual
energy savings by the year 2018. A history and projection of total DSM program
achievements from 1980-2018 is shown in Table 2.1.
2.4.4 Gainesville Energy Advisory Committee The Gainesville Energy Advisory Committee (GEAC) is a nine-member citizen
group that is charged with formulating recommendations to the Gainesville City
Commission concerning national, state and local energy-related issues. The GEAC
offers advice and guidance on energy management studies and consumer
awareness programs.
GEAC has contributed to several significant policy changes, including helping
to establish a residential energy audit program, creating inverted-block and time-of-
use electric rates, and making solar a generation priority for the City of Gainesville.
GEAC was instrumental in the development and installation of a 10 kilowatt PV
system at the System Control Center. GEAC has strongly supported the EPA’s
Energy Star program, and has helped GRU earn EPA’s 1998 Utility Ally of the Year
award. As a long-range load reduction strategy, GEAC contributed to the
development of a Green Builder program for existing multi-family dwellings, which

33
account for approximately 35% of GRU’s total residential load. GEAC also
supported GRU’s IRP efforts through their sponsorship of community workshops and
review of the IRP.
2.4.5 Supply Side Programs
Prior to the addition of Deerhaven Unit 2 in 1982, the System was relying on
oil and natural gas for over 90% of native load energy requirements. In 2008, oil-
fired generation comprised 0.5% of total net generation, natural gas-fired generation
contributed 19.7%, nuclear fuel contributed 5.7%, and coal-fired generation provided
74.1% of total net generation. Deerhaven 2 is also contributing to reduced oil use by
other utilities by offering coal-generated energy on the Florida energy market. The
PV system at the System Control Center provides slightly more than 10 kilowatts of
capacity at solar noon on clear days.
The System has several programs to improve the adequacy and reliability of
the transmission and distribution systems, which will also result in decreased energy
losses. These include the installation of distribution capacitors, purchase of high-
efficiency distribution transformers, and the reconductoring of the feeder system.
2.4.5.1 Transformers. GRU has been purchasing overhead and
underground transformers with a higher efficiency than the NEMA TP-1 Standard for
the past 18 years. Higher efficiency means less kW losses or power lost due the
design of the transformer. Since 1988, there have been 18,073 high-efficiency
transformers installed on GRU's distribution system. A study was initiated to
compare the kW losses of GRU's transformer design to a design based on NEMA
TP-1 Efficiency Standard for Transformers. The results of this investigation showed
that relative to the standard design, GRU experienced these savings:
Average Annual Demand Loss Savings 2.8 MW
Average Annual Energy Saved 24,900 MWh

34
Peak Demand Savings 6.2 MW
2.4.5.2 Reconductoring. GRU has been continuously improving the feeder
system by reconductoring feeders from 4/0 Copper to 795 MCM aluminum overhead
conductor. Also, in specific areas the feeders have been installed underground
using 1000 MCM underground cable. Following is a comparison of the resistance
for the types of conductors used on GRU's electric distribution system:
795 MCM Aluminum Overhead Conductor 0.13 ohms/mile
1000 MCM Aluminum Underground Cable 0.13 ohms/mile
4/0 Copper Overhead Conductor 0.31 ohms/mile
Calculations with average loading on the conductors show the total savings
due to moving from 4/0 copper to an aluminum conductor (795 or 1000 MCM):
Average Annual Demand Savings 2.4 MW
Average Annual Energy Saved 21,000 MWh
Peak Demand Savings 7.9 MW
2.4.5.3 Capacitors. GRU strives to maintain an average power factor of
0.98 by adding capacitors where necessary on each distribution feeder. Without
these capacitors the average uncorrected power factor would be 0.92.
The percentage of loss reduction can be calculated as shown:
% Loss Reduction=[1-(Uncorrected pf/Corrected pf)2] x 100
% Loss Reduction=[1-(0.92/0.98)2] x 100
% Loss Reduction = 11.9
In general, overall system losses have stabilized near 4% of net generation
as reflected in the forecasted relationship of total energy sales to net energy for load.

35
2.5 FUEL PRICE FORECAST ASSUMPTIONS
GRU consults a variety of reputable sources to compile projections of fuel
prices for fuels currently used and those that are evaluated for potential future use.
Oil prices are obtained from the Annual Energy Outlook 2009 (AEO2009), published
in March 2009 by the U.S. Department of Energy’s Energy Information
Administration (EIA). Natural gas price projections are derived from several
forecasts published by the PIRA Energy Group. Coal prices are projected in the
near term based on knowledge of contractual agreements with suppliers. These
prices are projected to the out years by applying growth rates for U.S. coal prices
provided in AEO2009. Projected prices for nuclear fuel were provided by PEF. Any
price forecasts that are provided in constant-year (real) dollars are translated to
nominal dollars using the projected Gross Domestic Product – Implicit Price Deflator
from AEO2009. Fuel prices are analyzed in two parts: the cost of the fuel
(commodity), and the cost of transporting the fuel to GRU’s generating stations. The
external forecasts typically address the commodity prices, and GRU’s specific
transportation costs are included to derive delivered prices. A summary of historical
and projected fuel prices is provided in Table 2.2.
2.5.1 Oil
GRU relies on No. 6 Oil (residual) and No. 2 Oil (distillate or diesel) as back-
up fuels for natural gas fired generation. These fuels are delivered to GRU
generating stations by truck. Forecast prices for these two types of oil are derived
directly from AEO2009.
During calendar year 2008, distillate fuel oil was used to produce 0.07% of
GRU’s total net generation. Distillate fuel oil is expected to be the most expensive
fuel available to GRU. During calendar year 2008, residual fuel oil was used to

36
produce 0.44% of GRU’s total net generation. The quantity of fuel oils used by GRU
is expected to remain low.
2.5.2 Coal
Coal is the primary fuel used by GRU to generate electricity, comprising
74.1% of total net generation during calendar year 2008. GRU purchases low-sulfur
(0.7%), high Btu eastern coal for use in Deerhaven Unit 2. In 2009, Deerhaven Unit
2 will begin operating following the retrofit of an air quality control system, which is
being added as a means of complying with new environmental regulations.
Deerhaven Unit 2 will be able to utilize coals with up to approximately 1.7% sulfur
content following the retrofit, therefore GRU also projects prices for both low and
medium sulfur coals for evaluation in Deerhaven Unit 2 following the air quality
control retrofit.
Projected prices for coal used by Deerhaven Unit 2 through 2011 were based
on GRU’s contractual options with its coal suppliers. Projected prices beyond 2011
were escalated using growth rates for U.S. coal prices from AEO2009. GRU has a
contract with CSXT for delivery of coal to the Deerhaven plant site through 2019.
2.5.3 Natural Gas
GRU procures natural gas for power generation and for distribution by a Local
Distribution Company (LDC). In 2008, GRU purchased approximately 6.1 million
MMBtu for use by both systems. GRU power plants used 65% of the total
purchased for GRU during 2008, while the LDC used the remaining 35%.
GRU purchases natural gas via arrangements with producers and marketers
connected with the Florida Gas Transmission (FGT) interstate pipeline. GRU’s
delivered cost of natural gas includes the commodity component, Florida Gas

37
Transmission’s (FGT) fuel charge, FGT’s usage (transportation) charge, FGT's
reservation (capacity) charge, and basis adjustments.
Prices for 2009 and 2010 were projected in-house using anticipated impacts
from risk management activities, commodity costs, and other pricing impacts
including transportation costs. Delivered prices from 2011 through 2018 represent
the sum of GRU’s anticipated transportation costs and commondity prices from PIRA
Energy Group’s October 2008 long-term Henry Hub forecast.
2.5.4 Nuclear Fuel
GRU’s nuclear fuel price forecast includes a component for fuel and a
component for fuel disposal. The projection for the price of the fuel component is
based on Progress Energy Florida’s (PEF) forecast of nuclear fuel prices. The
projection for the cost of fuel disposal is based on a trend analysis of actual costs to
GRU.
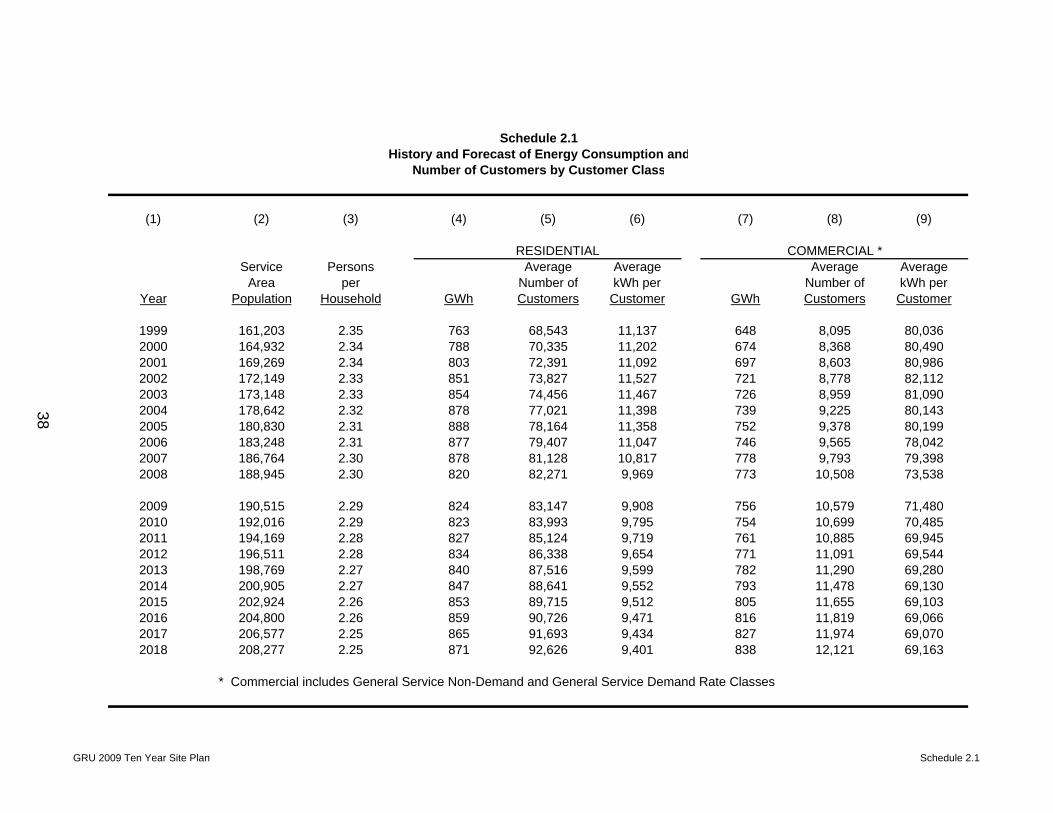
Schedule 2.1History and Forecast of Energy Consumption and
Number of Customers by Customer Class
(1) (2) (3) (4) (5) (6) (7) (8) (9)
RESIDENTIAL COMMERCIAL *Service Persons Average Average Average Average
Area per Number of kWh per Number of kWh perYear Population Household GWh Customers Customer GWh Customers Customer
1999 161,203 2.35 763 68,543 11,137 648 8,095 80,0362000 164,932 2.34 788 70,335 11,202 674 8,368 80,4902001 169,269 2.34 803 72,391 11,092 697 8,603 80,9862002 172,149 2.33 851 73,827 11,527 721 8,778 82,1122003 173,148 2.33 854 74,456 11,467 726 8,959 81,0902004 178,642 2.32 878 77,021 11,398 739 9,225 80,1432005 180,830 2.31 888 78,164 11,358 752 9,378 80,1992006 183,248 2.31 877 79,407 11,047 746 9,565 78,0422007 186,764 2.30 878 81,128 10,817 778 9,793 79,3982008 188,945 2.30 820 82,271 9,969 773 10,508 73,538
2009 190,515 2.29 824 83,147 9,908 756 10,579 71,4802010 192,016 2.29 823 83,993 9,795 754 10,699 70,4852011 194,169 2.28 827 85,124 9,719 761 10,885 69,9452012 196,511 2.28 834 86,338 9,654 771 11,091 69,5442013 198,769 2.27 840 87,516 9,599 782 11,290 69,2802014 200,905 2.27 847 88,641 9,552 793 11,478 69,1302015 202,924 2.26 853 89,715 9,512 805 11,655 69,1032016 204,800 2.26 859 90,726 9,471 816 11,819 69,0662017 206,577 2.25 865 91,693 9,434 827 11,974 69,0702018 208,277 2.25 871 92,626 9,401 838 12,121 69,163
* Commercial includes General Service Non-Demand and General Service Demand Rate Classes
GRU 2009 Ten Year Site Plan Schedule 2.1
38

Schedule 2.2History and Forecast of Energy Consumption and
Number of Customers by Customer Class
(1) (2) (3) (4) (5) (6) (7) (8)
INDUSTRIAL ** Street and Other Sales Total SalesAverage Average Railroads Highway to Public to Ultimate
Number of MWh per and Railways Lighting Authorities ConsumersYear GWh Customers Customer GWh GWh GWh GWh
1999 173 17 10,188 0 22 0 1,6062000 172 17 10,114 0 22 0 1,6562001 173 17 10,162 0 23 0 1,6962002 178 18 10,178 0 24 0 1,7742003 181 19 9,591 0 24 0 1,7862004 188 18 10,444 0 25 0 1,8302005 189 18 10,477 0 25 0 1,8542006 200 20 10,093 0 25 0 1,8492007 196 18 10,891 0 26 0 1,8772008 184 16 11,497 0 26 0 1,803
2009 159 11 14,431 0 27 0 1,7662010 157 11 14,277 0 27 0 1,7612011 157 11 14,312 0 28 0 1,7732012 158 11 14,405 0 28 0 1,7912013 160 11 14,538 0 28 0 1,8102014 161 11 14,649 0 29 0 1,8302015 162 11 14,761 0 29 0 1,8492016 163 11 14,854 0 29 0 1,8672017 164 11 14,934 0 30 0 1,8862018 165 11 15,022 0 30 0 1,904
** Industrial includes Large Power Rate Class
GRU 2009 Ten Year Site Plan Schedule 2.2
39

Schedule 2.3History and Forecast of Energy Consumption and
Number of Customers by Customer Class
(1) (2) (3) (4) (5) (6)
Sales Utility NetFor Use and Energy Total
Resale Losses for Load Other Number ofYear GWh GWh GWh Customers Customers
1999 109 83 1,798 0 76,6552000 120 93 1,868 0 78,7202001 125 62 1,882 0 81,0112002 142 92 2,008 0 82,6232003 146 83 2,015 0 83,4342004 149 70 2,049 0 86,2642005 163 66 2,082 0 87,5602006 174 75 2,099 0 88,9922007 188 57 2,122 0 90,9392008 196 79 2,079 0 92,795
2009 198 81 2,045 0 93,7372010 201 82 2,044 0 94,7032011 205 83 2,061 0 96,0202012 210 84 2,085 0 97,4402013 215 85 2,110 0 98,8172014 219 86 2,135 0 100,1302015 224 87 2,160 0 101,3812016 227 89 2,183 0 102,5562017 231 88 2,205 0 103,6782018 235 89 2,228 0 104,759
GRU 2009 Ten Year Site Plan Schedule 2.3
40

Schedule 3.1History and Forecast of Summer Peak Demand - MW
Base Case
(1) (2) (3) (4) (5) (6) (7) (8) (9) (10)
Residential Comm./Ind.Load Residential Load Comm./Ind. Net Firm
Year Total Wholesale Retail Interruptible Management Conservation Management Conservation Demand
1999 439 26 393 0 0 12 0 8 4192000 446 28 397 0 0 13 0 8 4252001 430 28 381 0 0 13 0 8 4092002 454 32 401 0 0 13 0 8 4332003 439 33 384 0 0 14 0 8 4172004 455 33 399 0 0 14 0 9 4322005 489 37 428 0 0 15 0 9 4652006 488 39 425 0 0 15 0 9 4642007 507 44 437 0 0 16 0 10 4812008 487 43 414 0 0 18 0 12 457
2009 475 45 396 0 0 20 0 14 4412010 478 46 393 0 0 23 0 16 4392011 485 47 394 0 0 26 0 18 4412012 492 48 395 0 0 28 0 21 4432013 500 49 396 0 0 31 0 24 4452014 508 50 398 0 0 34 0 26 4482015 516 51 399 0 0 37 0 29 4502016 523 52 401 0 0 39 0 31 4532017 532 53 404 0 0 42 0 33 4572018 539 54 406 0 0 44 0 35 460
GRU 2009 Ten Year Site Plan Schedule 3.1
41

Schedule 3.2History and Forecast of Winter Peak Demand - MW
Base Case
(1) (2) (3) (4) (5) (6) (7) (8) (9) (10)
Residential Comm./Ind.Load Residential Load Comm./Ind. Net Firm
Winter Total Wholesale Retail Interruptible Management Conservation Management Conservation Demand
1999 / 2000 380 27 310 0 0 36 0 7 3372000 / 2001 408 33 331 0 0 37 0 7 3642001 / 2002 416 33 336 0 0 39 0 8 3692002 / 2003 442 37 357 0 0 40 0 8 3942003 / 2004 398 31 319 0 0 40 0 8 3502004 / 2005 426 36 341 0 0 41 0 8 3772005 / 2006 436 40 346 0 0 42 0 8 3862006 / 2007 412 38 324 0 0 42 0 8 3622007 / 2008 411 40 321 0 0 42 0 8 3612008 / 2009 471 45 376 0 0 42 0 8 421
2009 / 2010 409 45 314 0 0 42 0 8 3592010 / 2011 412 46 316 0 0 42 0 8 3622011 / 2012 416 47 319 0 0 42 0 8 3662012 / 2013 421 48 323 0 0 42 0 8 3712013 / 2014 425 49 326 0 0 42 0 8 3752014 / 2015 430 50 330 0 0 42 0 8 3802015 / 2016 434 51 333 0 0 42 0 8 3842016 / 2017 437 52 335 0 0 42 0 8 3872017 / 2018 441 53 338 0 0 42 0 8 3912018 / 2019 445 54 341 0 0 42 0 8 395
GRU 2009 Ten Year Site Plan Schedule 3.2
42

Schedule 3.3History and Forecast of Net Energy for Load - GWH
Base Case
(1) (2) (3) (4) (5) (6) (7) (8) (9)
Residential Comm./Ind. Utility Use Net Energy LoadYear Total Conservation Conservation Retail Wholesale & Losses for Load Factor %
1999 1,887 67 22 1,606 109 83 1,798 49%2000 1,961 70 23 1,655 120 93 1,868 50%2001 1,979 74 23 1,695 125 62 1,882 53%2002 2,110 78 24 1,774 142 92 2,008 53%2003 2,121 82 24 1,786 146 83 2,015 55%2004 2,158 84 25 1,830 149 70 2,049 54%2005 2,196 88 26 1,854 163 65 2,082 51%2006 2,215 90 26 1,849 174 76 2,099 52%2007 2,253 98 33 1,877 186 59 2,122 50%2008 2,230 108 43 1,804 196 79 2,079 52%
2009 2,209 115 49 1,765 198 82 2,045 53%2010 2,219 121 54 1,761 201 82 2,044 53%2011 2,249 128 60 1,774 205 82 2,061 53%2012 2,285 134 66 1,791 210 84 2,085 54%2013 2,323 141 72 1,810 215 85 2,110 54%2014 2,360 147 78 1,830 219 86 2,135 54%2015 2,398 154 84 1,850 224 86 2,160 55%2016 2,433 160 90 1,869 227 87 2,183 55%2017 2,467 166 96 1,886 231 88 2,205 55%2018 2,503 173 102 1,904 235 89 2,228 55%
GRU 2009 Ten Year Site Plan Schedule 3.3
43
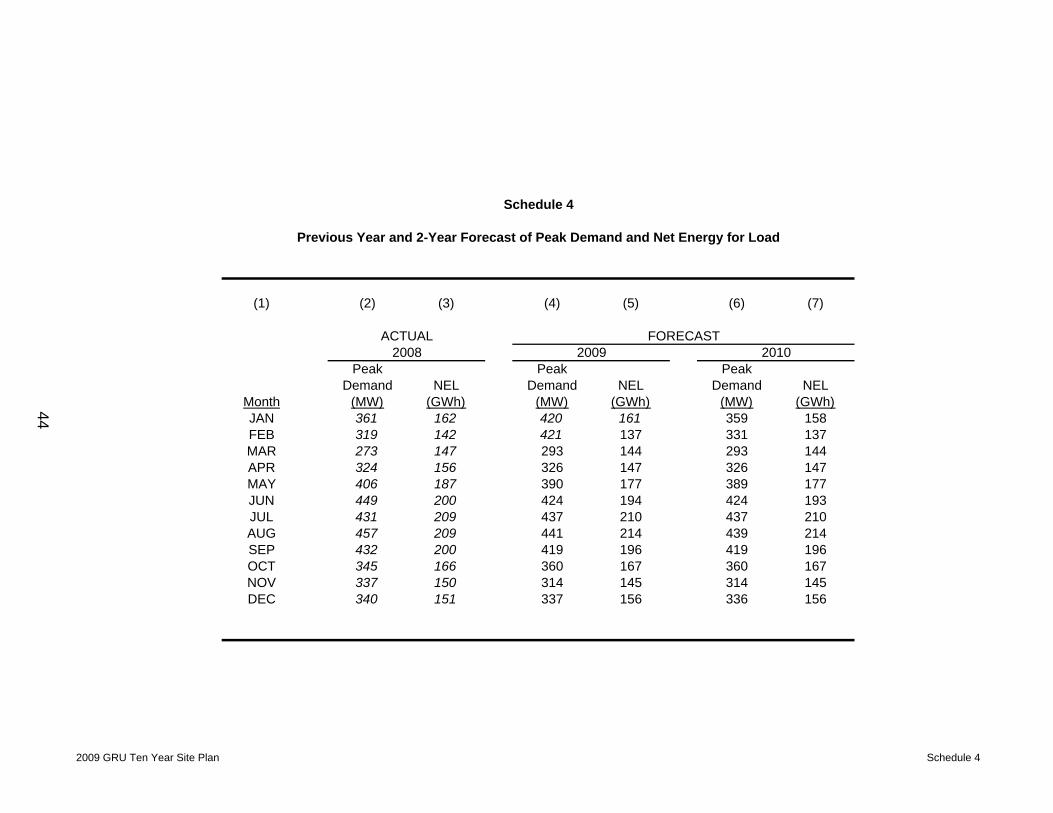
Schedule 4
Previous Year and 2-Year Forecast of Peak Demand and Net Energy for Load
(1) (2) (3) (4) (5) (6) (7)
ACTUAL FORECAST2008 2009 2010
Peak Peak PeakDemand NEL Demand NEL Demand NEL
Month (MW) (GWh) (MW) (GWh) (MW) (GWh)JAN 361 162 420 161 359 158FEB 319 142 421 137 331 137MAR 273 147 293 144 293 144APR 324 156 326 147 326 147MAY 406 187 390 177 389 177JUN 449 200 424 194 424 193JUL 431 209 437 210 437 210AUG 457 209 441 214 439 214SEP 432 200 419 196 419 196OCT 345 166 360 167 360 167NOV 337 150 314 145 314 145DEC 340 151 337 156 336 156
2009 GRU Ten Year Site Plan Schedule 4
44

Schedule 5FUEL REQUIREMENTS
As of January 1, 2009
(1) (2) (3) (4) (5) (6) (7) (8) (9) (10) (11) (12) (13) (14) (15)ACTUAL
UNITS 2008 2009 2010 2011 2012 2013 2014 2015 2016 2017 2018
(1) NUCLEAR TRILLION BTU 1.011 1.059 1.094 0.968 1.270 1.149 1.270 1.149 1.270 1.149 1.270
(2) COAL 1000 TON 550.410 456.424 462.534 518.122 504.654 448.138 526.404 548.563 549.501 562.157 554.082
RESIDUAL(3) STEAM 1000 BBL 14.499 0.000 0.000 0.000 0.000 0.000 0.000 0.000 0.000 0.000 0.000(4) CC 1000 BBL 0.000 0.000 0.000 0.000 0.000 0.000 0.000 0.000 0.000 0.000 0.000(5) CT 1000 BBL 0.000 0.000 0.000 0.000 0.000 0.000 0.000 0.000 0.000 0.000 0.000(6) TOTAL: 1000 BBL 14.499 0.000 0.000 0.000 0.000 0.000 0.000 0.000 0.000 0.000 0.000
DISTILLATE(7) STEAM 1000 BBL 0.074 0.000 0.000 0.000 0.000 0.000 0.000 0.000 0.000 0.000 0.000(8) CC 1000 BBL 1.062 0.000 0.000 0.000 0.000 0.000 0.000 0.000 0.000 0.000 0.000(9) CT 1000 BBL 1.871 0.000 0.000 0.000 0.000 0.000 0.000 0.000 0.000 0.000 0.000(10) TOTAL: 1000 BBL 3.007 0.000 0.000 0.000 0.000 0.000 0.000 0.000 0.000 0.000 0.000
NATURAL GAS(11) STEAM 1000 MCF 2,239.919 131.459 80.086 186.163 215.865 34.472 109.691 78.927 73.054 69.455 83.687(12) CC 1000 MCF 1,310.994 2,283.106 1,355.691 2,184.140 2,051.867 973.657 2,117.528 2,016.030 2,136.495 2,102.704 2,280.569(13) CT 1000 MCF 303.268 796.529 520.008 959.886 882.923 313.255 849.063 779.940 671.840 754.448 733.355(14) TOTAL: 1000 MCF 3,854.181 3,211.094 1,955.785 3,330.189 3,150.655 1,321.384 3,076.282 2,874.897 2,881.389 2,926.607 3,097.611
(15) Landfill Gas 1000 MCF 0.264 0.000 0.000 0.000 0.000 0.000 0.000 0.000 0.000 0.000 0.000
FUEL REQUIREMENTS
GRU 2009 Ten Year Site Plan Schedule 5
45
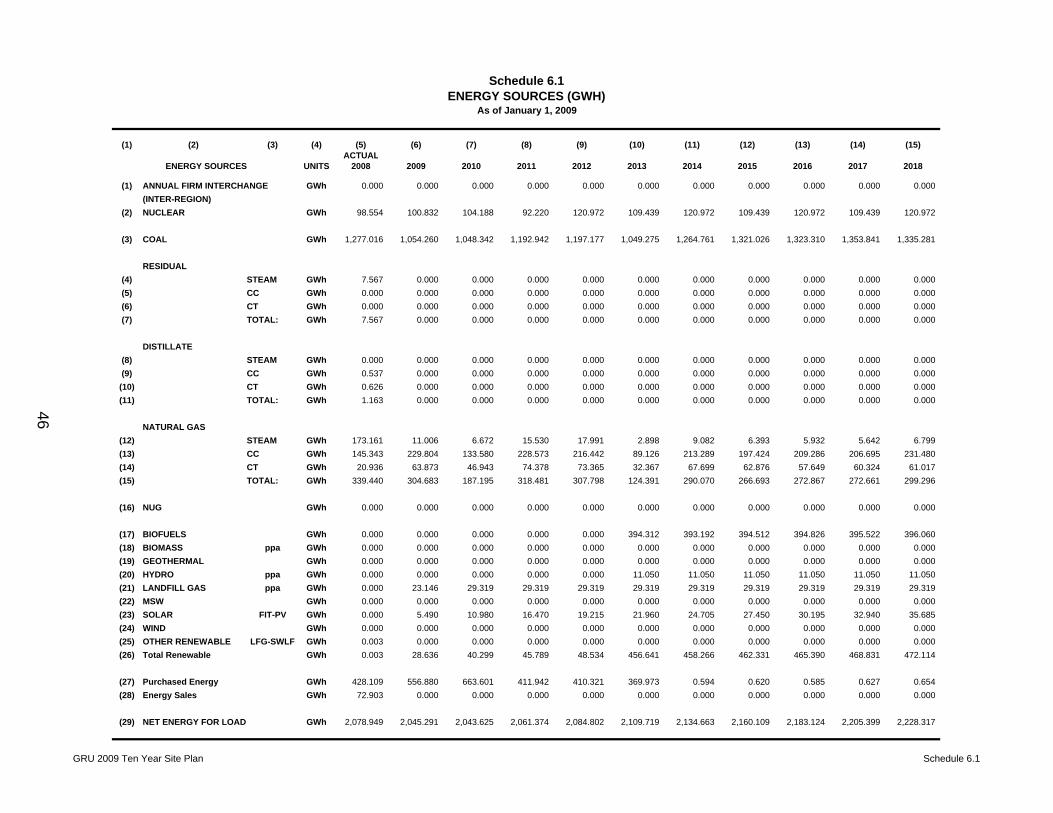
Schedule 6.1ENERGY SOURCES (GWH)
As of January 1, 2009
(1) (2) (3) (4) (5) (6) (7) (8) (9) (10) (11) (12) (13) (14) (15)ACTUAL
ENERGY SOURCES UNITS 2008 2009 2010 2011 2012 2013 2014 2015 2016 2017 2018
(1) ANNUAL FIRM INTERCHANGE GWh 0.000 0.000 0.000 0.000 0.000 0.000 0.000 0.000 0.000 0.000 0.000(INTER-REGION)
(2) NUCLEAR GWh 98.554 100.832 104.188 92.220 120.972 109.439 120.972 109.439 120.972 109.439 120.972
(3) COAL GWh 1,277.016 1,054.260 1,048.342 1,192.942 1,197.177 1,049.275 1,264.761 1,321.026 1,323.310 1,353.841 1,335.281
RESIDUAL(4) STEAM GWh 7.567 0.000 0.000 0.000 0.000 0.000 0.000 0.000 0.000 0.000 0.000(5) CC GWh 0.000 0.000 0.000 0.000 0.000 0.000 0.000 0.000 0.000 0.000 0.000(6) CT GWh 0.000 0.000 0.000 0.000 0.000 0.000 0.000 0.000 0.000 0.000 0.000(7) TOTAL: GWh 7.567 0.000 0.000 0.000 0.000 0.000 0.000 0.000 0.000 0.000 0.000
DISTILLATE(8) STEAM GWh 0.000 0.000 0.000 0.000 0.000 0.000 0.000 0.000 0.000 0.000 0.000(9) CC GWh 0.537 0.000 0.000 0.000 0.000 0.000 0.000 0.000 0.000 0.000 0.000(10) CT GWh 0.626 0.000 0.000 0.000 0.000 0.000 0.000 0.000 0.000 0.000 0.000(11) TOTAL: GWh 1.163 0.000 0.000 0.000 0.000 0.000 0.000 0.000 0.000 0.000 0.000
NATURAL GAS(12) STEAM GWh 173.161 11.006 6.672 15.530 17.991 2.898 9.082 6.393 5.932 5.642 6.799(13) CC GWh 145.343 229.804 133.580 228.573 216.442 89.126 213.289 197.424 209.286 206.695 231.480(14) CT GWh 20.936 63.873 46.943 74.378 73.365 32.367 67.699 62.876 57.649 60.324 61.017(15) TOTAL: GWh 339.440 304.683 187.195 318.481 307.798 124.391 290.070 266.693 272.867 272.661 299.296
(16) NUG GWh 0.000 0.000 0.000 0.000 0.000 0.000 0.000 0.000 0.000 0.000 0.000
(17) BIOFUELS GWh 0.000 0.000 0.000 0.000 0.000 394.312 393.192 394.512 394.826 395.522 396.060(18) BIOMASS ppa GWh 0.000 0.000 0.000 0.000 0.000 0.000 0.000 0.000 0.000 0.000 0.000(19) GEOTHERMAL GWh 0.000 0.000 0.000 0.000 0.000 0.000 0.000 0.000 0.000 0.000 0.000(20) HYDRO ppa GWh 0.000 0.000 0.000 0.000 0.000 11.050 11.050 11.050 11.050 11.050 11.050(21) LANDFILL GAS ppa GWh 0.000 23.146 29.319 29.319 29.319 29.319 29.319 29.319 29.319 29.319 29.319(22) MSW GWh 0.000 0.000 0.000 0.000 0.000 0.000 0.000 0.000 0.000 0.000 0.000(23) SOLAR FIT-PV GWh 0.000 5.490 10.980 16.470 19.215 21.960 24.705 27.450 30.195 32.940 35.685(24) WIND GWh 0.000 0.000 0.000 0.000 0.000 0.000 0.000 0.000 0.000 0.000 0.000(25) OTHER RENEWABLE LFG-SWLF GWh 0.003 0.000 0.000 0.000 0.000 0.000 0.000 0.000 0.000 0.000 0.000(26) Total Renewable GWh 0.003 28.636 40.299 45.789 48.534 456.641 458.266 462.331 465.390 468.831 472.114
(27) Purchased Energy GWh 428.109 556.880 663.601 411.942 410.321 369.973 0.594 0.620 0.585 0.627 0.654(28) Energy Sales GWh 72.903 0.000 0.000 0.000 0.000 0.000 0.000 0.000 0.000 0.000 0.000
(29) NET ENERGY FOR LOAD GWh 2,078.949 2,045.291 2,043.625 2,061.374 2,084.802 2,109.719 2,134.663 2,160.109 2,183.124 2,205.399 2,228.317
GRU 2009 Ten Year Site Plan Schedule 6.1
46

Schedule 6.2ENERGY SOURCES (%)
As of January 1, 2009
(1) (2) (3) (4) (5) (6) (7) (8) (9) (10) (11) (12) (13) (14) (15)ACTUAL
ENERGY SOURCES UNITS 2008 2009 2010 2011 2012 2013 2014 2015 2016 2017 2018
(1) ANNUAL FIRM INTERCHANGE GWh 0.00% 0.00% 0.00% 0.00% 0.00% 0.00% 0.00% 0.00% 0.00% 0.00% 0.00%(INTER-REGION)
(2) NUCLEAR GWh 4.74% 4.93% 5.10% 4.47% 5.80% 5.19% 5.67% 5.07% 5.54% 4.96% 5.43%
(3) COAL GWh 61.43% 51.55% 51.30% 57.87% 57.42% 49.74% 59.25% 61.16% 60.62% 61.39% 59.92%
RESIDUAL(4) STEAM GWh 0.36% 0.00% 0.00% 0.00% 0.00% 0.00% 0.00% 0.00% 0.00% 0.00% 0.00%(5) CC GWh 0.00% 0.00% 0.00% 0.00% 0.00% 0.00% 0.00% 0.00% 0.00% 0.00% 0.00%(6) CT GWh 0.00% 0.00% 0.00% 0.00% 0.00% 0.00% 0.00% 0.00% 0.00% 0.00% 0.00%(7) TOTAL: GWh 0.36% 0.00% 0.00% 0.00% 0.00% 0.00% 0.00% 0.00% 0.00% 0.00% 0.00%
DISTILLATE(8) STEAM GWh 0.00% 0.00% 0.00% 0.00% 0.00% 0.00% 0.00% 0.00% 0.00% 0.00% 0.00%(9) CC GWh 0.03% 0.00% 0.00% 0.00% 0.00% 0.00% 0.00% 0.00% 0.00% 0.00% 0.00%(10) CT GWh 0.03% 0.00% 0.00% 0.00% 0.00% 0.00% 0.00% 0.00% 0.00% 0.00% 0.00%(11) TOTAL: GWh 0.06% 0.00% 0.00% 0.00% 0.00% 0.00% 0.00% 0.00% 0.00% 0.00% 0.00%
NATURAL GAS(12) STEAM GWh 8.33% 0.54% 0.33% 0.75% 0.86% 0.14% 0.43% 0.30% 0.27% 0.26% 0.31%(13) CC GWh 6.99% 11.24% 6.54% 11.09% 10.38% 4.22% 9.99% 9.14% 9.59% 9.37% 10.39%(14) CT GWh 1.01% 3.12% 2.30% 3.61% 3.52% 1.53% 3.17% 2.91% 2.64% 2.74% 2.74%(15) TOTAL: GWh 16.33% 14.90% 9.16% 15.45% 14.76% 5.90% 13.59% 12.35% 12.50% 12.36% 13.43%
(16) NUG GWh 0.00% 0.00% 0.00% 0.00% 0.00% 0.00% 0.00% 0.00% 0.00% 0.00% 0.00%
(17) BIOFUELS GWh 0.00% 0.00% 0.00% 0.00% 0.00% 18.69% 18.42% 18.26% 18.09% 17.93% 17.77%(18) BIOMASS ppa GWh 0.00% 0.00% 0.00% 0.00% 0.00% 0.00% 0.00% 0.00% 0.00% 0.00% 0.00%(19) GEOTHERMAL GWh 0.00% 0.00% 0.00% 0.00% 0.00% 0.00% 0.00% 0.00% 0.00% 0.00% 0.00%(20) HYDRO ppa GWh 0.00% 0.00% 0.00% 0.00% 0.00% 0.52% 0.52% 0.51% 0.51% 0.50% 0.50%(21) LANDFILL GAS ppa GWh 0.00% 1.13% 1.43% 1.42% 1.41% 1.39% 1.37% 1.36% 1.34% 1.33% 1.32%(22) MSW GWh 0.00% 0.00% 0.00% 0.00% 0.00% 0.00% 0.00% 0.00% 0.00% 0.00% 0.00%(23) SOLAR fit GWh 0.00% 0.27% 0.54% 0.80% 0.92% 1.04% 1.16% 1.27% 1.38% 1.49% 1.60%(24) WIND GWh 0.00% 0.00% 0.00% 0.00% 0.00% 0.00% 0.00% 0.00% 0.00% 0.00% 0.00%(25) OTHER RENEWABLE GWh 0.00% 0.00% 0.00% 0.00% 0.00% 0.00% 0.00% 0.00% 0.00% 0.00% 0.00%(26) Total Renewable GWh 0.000144% 1.40% 1.97% 2.22% 2.33% 21.64% 21.47% 21.40% 21.32% 21.26% 21.19%
(27) Purchased Energy GWh 20.59% 27.23% 32.47% 19.98% 19.68% 17.54% 0.03% 0.03% 0.03% 0.03% 0.03%(28) Energy Sales GWh 3.51% 0.00% 0.00% 0.00% 0.00% 0.00% 0.00% 0.00% 0.00% 0.00% 0.00%
(29) NET ENERGY FOR LOAD GWh 100.00% 100.00% 100.00% 100.00% 100.00% 100.00% 100.00% 100.00% 100.00% 100.00% 100.00%
GRU 2009 Ten Year Site Plan Schedule 6.2
47

TABLE 2.1
DEMAND-SIDE MANAGEMENT IMPACTSTotal Program Achievements
SummerYear MWh kW1980 254 1681981 575 3701982 1,054 6741983 2,356 1,2121984 8,024 2,8011985 16,315 4,6191986 25,416 7,0181987 30,279 8,3181988 34,922 9,5391989 38,824 10,5541990 43,661 11,7531991 48,997 12,9361992 54,898 14,3171993 61,356 15,7521994 66,725 16,8711995 72,057 18,0221996 75,894 18,5771997 79,998 19,0661998 84,017 19,5411999 88,631 20,0552000 93,132 20,6542001 97,428 21,1852002 102,159 21,7202003 106,277 22,2222004 109,441 22,6762005 113,182 23,4052006 116,544 24,0782007 130,872 26,5112008 151,347 30,139
2009 163,647 34,3392010 175,947 38,9392011 188,247 43,9392012 200,547 49,3392013 212,847 54,9392014 225,147 60,6392015 237,447 66,4392016 249,792 70,7392017 262,137 75,0392018 274,483 79,339
GRU 2009 Ten Year Site Plan Table 2.1 48

TABLE 2.2
DELIVERED FUEL PRICES$/MMBtu
Residual Distillate Natural Compliance PerformanceYear Fuel Oil Fuel Oil Gas Coal (1) Coal (2) Nuclear1999 2.79 3.47 2.86 1.66 0.442000 4.52 5.99 4.53 1.62 0.382001 4.15 6.53 4.94 1.88 0.382002 4.58 5.69 3.95 2.06 0.382003 4.87 6.59 5.97 2.04 0.432004 5.17 5.17 6.40 2.03 0.412005 7.15 18.67 9.15 2.38 0.452006 8.07 15.24 8.68 3.00 0.452007 7.68 16.35 8.52 2.94 0.402008 7.60 13.74 10.57 3.87 0.42
2009 8.35 15.24 6.57 3.86 0.482010 12.97 14.91 6.76 3.31 0.652011 14.68 16.68 8.49 3.43 0.662012 16.53 18.46 8.84 3.53 0.832013 17.65 19.44 9.04 3.61 0.852014 19.80 21.74 9.43 3.73 0.922015 20.90 22.97 9.95 3.83 0.932016 21.60 23.83 10.46 3.88 0.962017 22.02 24.44 11.08 3.94 0.962018 22.87 25.39 11.90 4.04 0.95
(1) Compliance coal has an average heat content 12,800 Btu/lb and a sulfur content of approximately 0.7%.(2) Performance coal has an average heat content 12,500 Btu/lb and a sulfur content of approximately 1.25%.
GRU 2009 Ten Year Site Plan Table 2.2
49

50
3. FORECAST OF FACILITIES REQUIREMENTS 3.1 GENERATION RETIREMENTS
The System plans to retire one generating unit within the next 10 years. The
John R. Kelly steam unit #7 (JRK #7) (23 MW) is presently scheduled to be retired in
October 2013.
3.2 RESERVE MARGIN AND SCHEDULED MAINTENANCE
GRU uses a planning criterion of 15% capacity reserve margin (suggested for emergency power pricing purposes by Florida Public Service Commission Rule 25-6.035). Available generating capacities are compared with System summer peak demands in Schedule 7.1 (and Figure 3.1) and System winter peak demands in Schedule 7.2 (and Figure 3.2). Higher peak demands in summer and lower unit operating capacities in summer result in lower reserve margins during the summer season than in winter. In consideration of existing resources, expected future purchases, and savings impacts from conservation programs, GRU expects to maintain a summer reserve margin well in excess of 15% over the next 10 years.
3.3 GENERATION ADDITIONS
Due to new EPA regulations promulgated in March 2005, the retrofit of our
Deerhaven #2 Air Quality Control System (AQCS) is proceeding as one means of
complying with the new regulations. The upgraded AQCS will consist of a selective
catalytic reduction (SCR) system and a dry flue gas desulfurization system (FGD)
which will include a baghouse (BH). It is expected that the SCR and the FGD/BH
will be operational following the 2009 spring maintenance outage.
The GRU South Energy Center located at the new Shands Healthcare
Cancer Hospital (4.1 MW combustion turbine) was recently completed and will begin
51
commercial operation in early summer 2009. Characteristics of the combustion
turbine are summarized in Schedule 8 at the end of this section.
As part owner in the Crystal River 3 nuclear unit, GRU will benefit from three
uprates of the unit’s capacity approved by the Nuclear Regulatory Commission
(NRC). GRU’s share (1.4079%) of the uprates (first 11 MW in 2008, second 28 MW
in 2009, and 140 MW in 2011) will net the System 2.5 MW of additional base load
capacity.
Eleven responses to GRU’s “Request for Proposals” (RFP) for a biomass
fueled facility in the 30-100 MW range were received on December 15, 2007.
Addendum Two has been issued to solicit binding proposals from the top three
proposals from the initial RFP. The responses to Addendum Two were received
April 11, 2008 and included biomass fueled capacity and energy through a purchase
power agreement (PPA), with an option to buy the plant at a later date. The
proposed biomass facility will be owned and operated by American Renewables.
This facility is planned to have a net capacity of 100 MW and will be designed to use
clean woody fuels including forest residuals and tree thinnings.
3.4 DISTRIBUTION SYSTEM ADDITIONS
Up to five new, identical, mini-power delivery substations (PDS) were planned
for the GRU system back in 1999. Three of the five; Rocky Point, Kanapaha, and
Ironwood were installed by 2003. A fourth PDS is planned for spring 2010. The
location for this PDS, which will be known as Springhill, will be a parcel owned by
GRU west of Interstate 75 and north of 39th Avenue along our existing 138 kV
transmission line. A fifth PDS is being considered for addition to the System no
earlier than 2013. The location of this proposed fifth PDS would be in the northern
part of the service territory near U.S. Highway 441. These new mini-power delivery
substations have been planned to redistribute the load from the existing substations
as new load centers grow and develop within the System.

52
Each PDS will consist of one (or more) 138/12.47 kV, 33.6 MVA, wye-wye
substation transformer with a maximum of eight distribution circuits. The proximity of
these new PDS’s to other, existing adjacent area substations will allow for backup in
the event of a substation transformer failure.

Schedule 7.1Forecast of Capacity, Demand, and Scheduled Maintenance at Time of Summer Peak
(1) (2) (3) (4) (5) (6) (7) (8) (9) (10) (11) (12)
Total Firm Firm Total System FirmInstalled Capacity Capacity Capacity Summer Peak Reserve Margin Scheduled Reserve Margin
Capacity (2) Import Export QF Available (3) Demand (1) before Maintenance Maintenance after Maintenance (1)Year MW MW MW MW MW MW MW % of Peak MW MW % of Peak
1999 547 32 97 0 482 419 63 15.0% 14 49 11.7%2000 547 0 58 0 489 425 64 15.1% 0 64 15.1%2001 610 0 93 0 517 409 108 26.4% 0 108 26.4%2002 610 0 43 0 567 433 134 30.9% 0 134 30.9%2003 610 0 3 0 607 417 190 45.6% 0 190 45.6%2004 611 0 3 0 608 432 176 40.7% 0 176 40.7%2005 611 0 3 0 608 465 143 30.8% 0 143 30.8%2006 611 0 3 0 608 464 144 31.0% 0 144 31.0%2007 611 0 0 0 611 481 130 27.0% 0 130 27.0%2008 610 49 0 0 659 457 202 44.2% 0 202 44.2%
2009 608 105 0 0 710 441 269 60.9% 0 269 60.9%2010 608 110 0 0 712 439 273 62.3% 0 273 62.3%2011 608 65 0 0 665 441 224 50.9% 0 224 50.9%2012 620 67 0 0 678 443 235 53.0% 0 235 53.0%2013 620 121 0 0 730 445 285 64.0% 0 285 64.0%2014 597 74 0 0 659 448 211 47.2% 0 211 47.2%2015 597 76 0 0 660 450 210 46.6% 0 210 46.6%2016 597 78 0 0 660 453 207 45.6% 0 207 45.6%2017 597 80 0 0 661 457 204 44.8% 0 204 44.8%2018 583 82 0 0 648 460 188 40.8% 0 188 40.8%
(1) System Peak demands shown in this table reflect continued service to partial and full requirements wholesale customers.In the event these contracts are not renewed, reserve margins shown in this table will increase significantly.
(2) Details of planned changes to installed capacity from 2009-2018 are reflected in Schedule 8.(3) The coincidence factor used for Summer photovoltaic capacity is 35%.
GRU 2009 Ten Year Site Plan Schedule 7.1
53

GRU 2009 Ten Year Site Plan Figure 3.1
Figure 3.1Summer Peak Demand and Resources
0
100
200
300
400
500
600
700
80019
99
2000
2001
2002
2003
2004
2005
2006
2007
2008
2009
2010
2011
2012
2013
2014
2015
2016
2017
2018
Meg
aWat
ts
15% Reserve Margin
Firm Peak Demand
Available Capacity
54
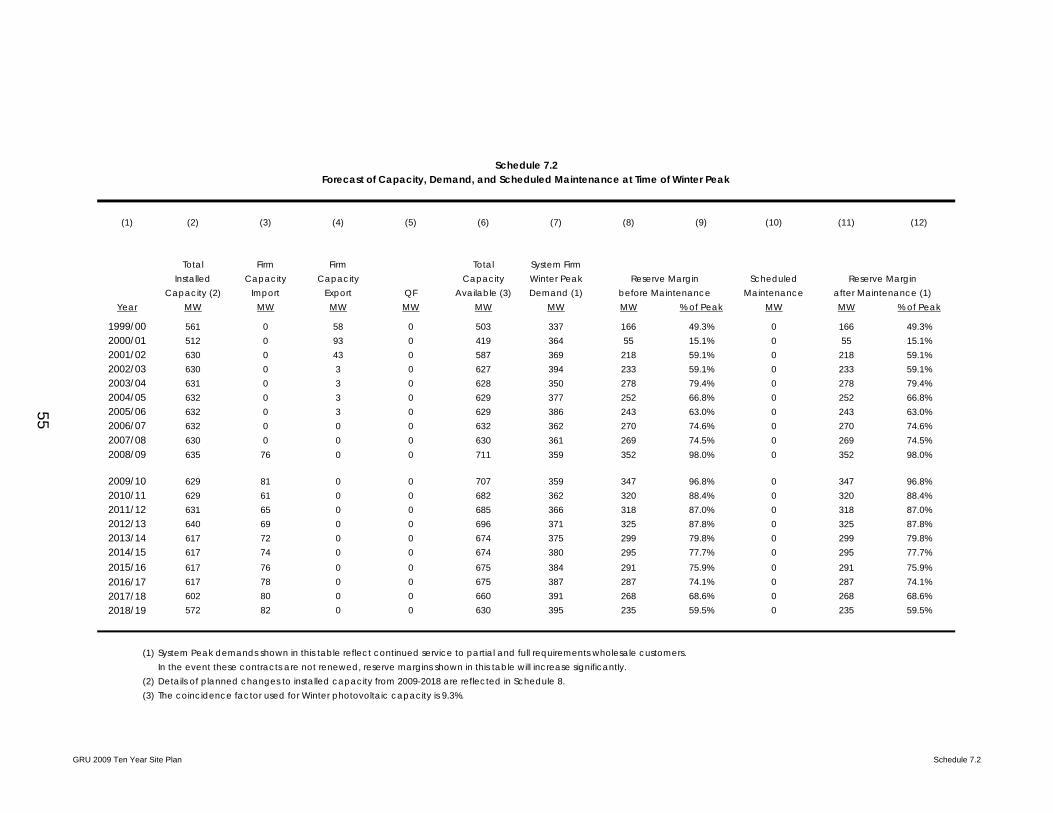
Schedule 7.2Forecast of Capacity, Demand, and Scheduled Maintenance at Time of Winter Peak
(1) (2) (3) (4) (5) (6) (7) (8) (9) (10) (11) (12)
Total Firm Firm Total System FirmInstalled Capacity Capacity Capacity Winter Peak Reserve Margin Scheduled Reserve Margin
Capacity (2) Import Export QF Available (3) Demand (1) before Maintenance Maintenance after Maintenance (1)Year MW MW MW MW MW MW MW % of Peak MW MW % of Peak
1999/00 561 0 58 0 503 337 166 49.3% 0 166 49.3%2000/01 512 0 93 0 419 364 55 15.1% 0 55 15.1%2001/02 630 0 43 0 587 369 218 59.1% 0 218 59.1%2002/03 630 0 3 0 627 394 233 59.1% 0 233 59.1%2003/04 631 0 3 0 628 350 278 79.4% 0 278 79.4%2004/05 632 0 3 0 629 377 252 66.8% 0 252 66.8%2005/06 632 0 3 0 629 386 243 63.0% 0 243 63.0%2006/07 632 0 0 0 632 362 270 74.6% 0 270 74.6%2007/08 630 0 0 0 630 361 269 74.5% 0 269 74.5%2008/09 635 76 0 0 711 359 352 98.0% 0 352 98.0%
2009/10 629 81 0 0 707 359 347 96.8% 0 347 96.8%2010/11 629 61 0 0 682 362 320 88.4% 0 320 88.4%2011/12 631 65 0 0 685 366 318 87.0% 0 318 87.0%2012/13 640 69 0 0 696 371 325 87.8% 0 325 87.8%2013/14 617 72 0 0 674 375 299 79.8% 0 299 79.8%2014/15 617 74 0 0 674 380 295 77.7% 0 295 77.7%2015/16 617 76 0 0 675 384 291 75.9% 0 291 75.9%2016/17 617 78 0 0 675 387 287 74.1% 0 287 74.1%2017/18 602 80 0 0 660 391 268 68.6% 0 268 68.6%2018/19 572 82 0 0 630 395 235 59.5% 0 235 59.5%
(1) System Peak demands shown in this table reflect continued service to partial and full requirements wholesale customers.In the event these contracts are not renewed, reserve margins shown in this table will increase significantly.
(2) Details of planned changes to installed capacity from 2009-2018 are reflected in Schedule 8.(3) The coincidence factor used for Winter photovoltaic capacity is 9.3%.
GRU 2009 Ten Year Site Plan Schedule 7.2
55

GRU 2009 Ten Year Site Plan Figure 3.2
Figure 3.2Winter Peak Demand and Resources
0
100
200
300
400
500
600
700
80019
99/0
0
2000
/01
2001
/02
2002
/03
2003
/04
2004
/05
2005
/06
2006
/07
2007
/08
2008
/09
2009
/10
2010
/11
2011
/12
2012
/13
2013
/14
2014
/15
2015
/16
2016
/17
2017
/18
2018
/19
Meg
aWat
ts
15% Reserve MarginFirm Peak DemandAvailable Capacity
56

Schedule 8
PLANNED AND PROSPECTIVE GENERATING FACILITY ADDITIONS AND CHANGES
(1) (2) (3) (4) (5) (6) (7) (8) (9) (10) (11) (12) (13) (14) (15) (16)
Const. Comm. Expected Gross Capability Net CapabilityUnit Unit Fuel Fuel Transport Start In-Service Retire Summer Winter Summer Winter
Plant Name No. Location Type Pri. Alt. Pri. Alt. Mo/Yr Mo/Yr Mo/Yr (MW) (MW) (MW) (MW) Status
DEERHAVEN FS02 Alachua County ST BIT RR Jan-07 May-09 0 0 -6.3 -6.3 DSecs. 26,27 35
T8S, R19E
DEERHAVEN FS02 Alachua County ST BIT RR Sep-09 May-12 0 0 9.1 9.1 ASecs. 26,27 35
T8S, R19E
SOUTH ENERGY CENTER GT1 Alachua County GT NG PL Apr-07 May-09 4.5 4.5 4.1 4.1 V(Distributed generation) Sec. 10, T10S, R20E
CRYSTAL RIVER 3 Citrus County ST NUC TK Jan-10 0.386 0.396 ASec. 33, T17S, R16E
CRYSTAL RIVER 3 Citrus County ST NUC TK Jan-12 1.930 1.978 ASec. 33, T17S, R16E
J. R. KELLY FS07 Alachua County ST NG RFO PL TK Oct-13 -24 -24 -23.2 -23.2 RTSec. 4, T10S, R20E
Unit Type Transportation MethodGT = Combustion (gas) Turbine PL = PipelineST = Steam Turbine RR = Railroad
TK = Truck
Fuel Type StatusBIT = Bituminus Coal A = Generating unit capability increasedNG = Natural Gas D = Generating unit capability decreasedNUC = Nuclear RT = Existing generator scheduled for retirementRFO = Residual Fuel Oil V = Under construction, more than 50% complete
GRU 2009 Ten Year Site Plan Schedule 8
57

Schedule 9Description of Proposed Facility Under Discussion
(1) Plant Name and Unit Number: GRU Energy Center(Distributed Generation)
(2a) Net Capacitya. Summer 4.1 MWb. Winter 4.1 MW
(2a) Gross Capacitya. Summer 4.5 MWb. Winter 4.5 MW
(3) Technology Type: Combustion Turbine (Solar)
(4) Anticipated Construction Timinga. Field construction start-date: 4/1/2007b. Commercial in-service date: 5/1/2009
(5) Fuela. Primary Fuel (by Heat Input) Natural Gasb. Alternate Fuel na
(6) Air Pollution Control Strategy: Low NOx Burners
(7) Cooling Method: air cooled
(8) Total Site Area (ft2): 50,000
(9) Construction Status: Approved
(10) Certification Status: Not Certified
(11) Status with Federal Agencies: Air Permit issued 7/25/07
(12) Projected Unit Performance DataPlanned Outage Factor (POF): 3.0%Forced Outage Factor (FOF): 6.0%Equivalent Availability Factor (EAF): 95.0%Resulting Capacity Factor (CF) 90.0%Average Net Operating Heat Rate (ANOHR): 10,100
(13) Projected Unit Financial DataBook Life (Years) 30Total Installed Cost (2009$/kW) 930.49Direct Construction Cost ($2009/kW): 0.00Escalation ($2009/kW) 28.75Escalation: 3.00%Fixed O&M ($2009/kW-Yr): 0.00Variable O&M ($2009/MWh): 15.33
GRU 2009 Ten Year Site Plan Schedule 9 58

59
4. ENVIRONMENTAL AND LAND USE INFORMATION
4.1 DESCRIPTION OF POTENTIAL SITES FOR NEW GENERATING FACILITIES
Currently, there are no new potential generation sites planned.
4.2 DESCRIPTION OF PREFERRED SITES FOR NEW GENERATING FACILITIES
The new potential generating facility (resulting from GRU’s “Request for
Proposals for Biomass-fueled Generation Facility”) is planned to be located on land
leased from GRU on the northwest portion of the existing Deerhaven plant site. The
Deerhaven site is shown in Figure 1.1 and Figure 4.1, located north of Gainesville off
U.S. Highway 441. The Deerhaven site is preferred for the proposed project for
several major reasons. Since it is an existing power generation site, future
development is possible while minimizing impacts to the greenfield (undeveloped)
areas. It also has an established access to fuel supply and power delivery; as well as
fuel, water and combustion product management facilities. The preferred location of
the proposed biomass facility is shown on Figure 4.1.
4.2.1 Land Use and Environmental Features
The location of the Deerhaven Generating Station ("Site") is indicated on
Figure 1.1 and Figure 4.1, overlain on USGS maps that were originally at a scale of
1 inch : 24,000 feet. Figure 4.2 provides a photographic depiction of the land use
and cover of the existing site and adjacent areas. The existing land use of the
certified portion of the site is industrial (i.e., electric power generation and
transmission and ancillary uses such as fuel storage and conveyance; water,
combustion product, and forest management). The areas acquired since 2002
have been annexed into the City of Gainesville. The current zoning remains
County Agricultural, but a land use change application has been filed with the City

60
of Gainesville. Eventually, the site will be zoned (city) Pubic Services with
conservation areas. Surrounding land uses are primarily rural or agricultural with
some low-density residential development. The Deerhaven site encompasses
approximately 3474 acres.
The Site is located in the Suwannee River Water Management District. A
small increase in water quantities for potable uses is projected. It is estimated that
industrial water usage associated with the new unit could be as much as two million
gallons per day (MGD). The groundwater allocation in the existing Site Certification
would be sufficient to accommodate the requirements of the site in the future with the
proposed new unit. Water for potable use will be supplied via the City’s potable water
system. Groundwater will continue to be extracted from the Floridian aquifer. A
significant amount of reclaimed water from GRU’s Main St. and/or Kanapaha
wastewater treatment plants may be made available to the site to supply industrial
process and cooling water needs. Process wastewater is currently collected, treated
and reused on-site. The site has zero discharge of process wastewater to surface
and ground waters, with a brine concentrator and on-site storage of solid water
treatment by-products. It is expected that this practice would continue with the
addition of a new unit. Other water conservation measures may be identified during
the design of the project.
4.2.2 Air Emissions The proposed generation technology would necessarily meet all applicable
standards for all criteria pollutants. 4.3 STATUS OF APPLICATION FOR SITE CERTIFICATION
American Renewables will be applying for site certification for the planned 100 MW biomass generating facility located on land that is part of the Deerhaven site.

Figure 4.1
61
!!!!!!!!!!!!!!!!!!!!!!!!!!!!!!!
!!
!!
!!
!!
!!
!!
!!
!!
!!
!!
!!
!!
!!
!!
!!
!!
!!
!!
!!
!!
!!
!!
!!
!!
!!
!!
!!
!!
!!
!!
!!
!!
!!
!!
!!
!!
!
!!
!!
!!
!!
!!
!!
!!
!!
!!
!!
!!
!!
!!
!!
!!
!!
!!
!!
!!
!!
!!
!!
!!
!!
!!
!!
!!
!!
!!
!!
!!
!!
!!
!!
!!
!!
!!
!!!!!!!!!!!!!!!!!!!!!!!!!!!!!!!!!!!!!!!!!!!!!!!!!!!!!!!!!!!!!!!!!!!!!!!!!!!!!!!!!!!!!!
! ! ! ! ! ! ! ! ! ! ! ! ! ! ! ! ! ! ! ! ! ! ! ! ! ! ! ! ! !
!!
!!
!!
!!
!!
!!
!!
!!
!!
!!
!!
!!
!!
!!
!!
!!
!!
!!
!
! ! ! ! ! ! ! ! ! ! ! ! ! ! ! ! ! ! ! ! ! ! ! ! ! ! ! ! ! ! ! ! ! ! ! ! ! ! ! ! ! ! ! ! ! ! ! ! ! ! ! ! ! ! ! ! ! ! ! ! ! ! ! ! ! ! ! ! ! ! ! ! ! ! ! ! ! ! ! ! ! ! ! ! !!
!!
!!
!!
!!
!!
!!
!!
!!
!!
!!
!!
!!
!!
!!
!!
!!
!!
!!
®QUADRANGLE LOCATION
WITHIN STATE OF FLORIDA
Data Source: USGS 7.5 Minute Quadrangle Maps :Quad names-Alachua, Gainesville West,Monteocha, Gainesville East
Quadrangle Map Scale1 : 24,000
(1 " = 2,000')
DeerhavenGenerating
Station
Alachua Quad
Gainesville West Quad
Location Map:Deerhaven Generating Station
U.S. H
WY 441
Monteocha Quad
Gainesville East Quad
Deerhaven Property Boundary
Deerhaven Property Boundary
Proposed Biomass Facility
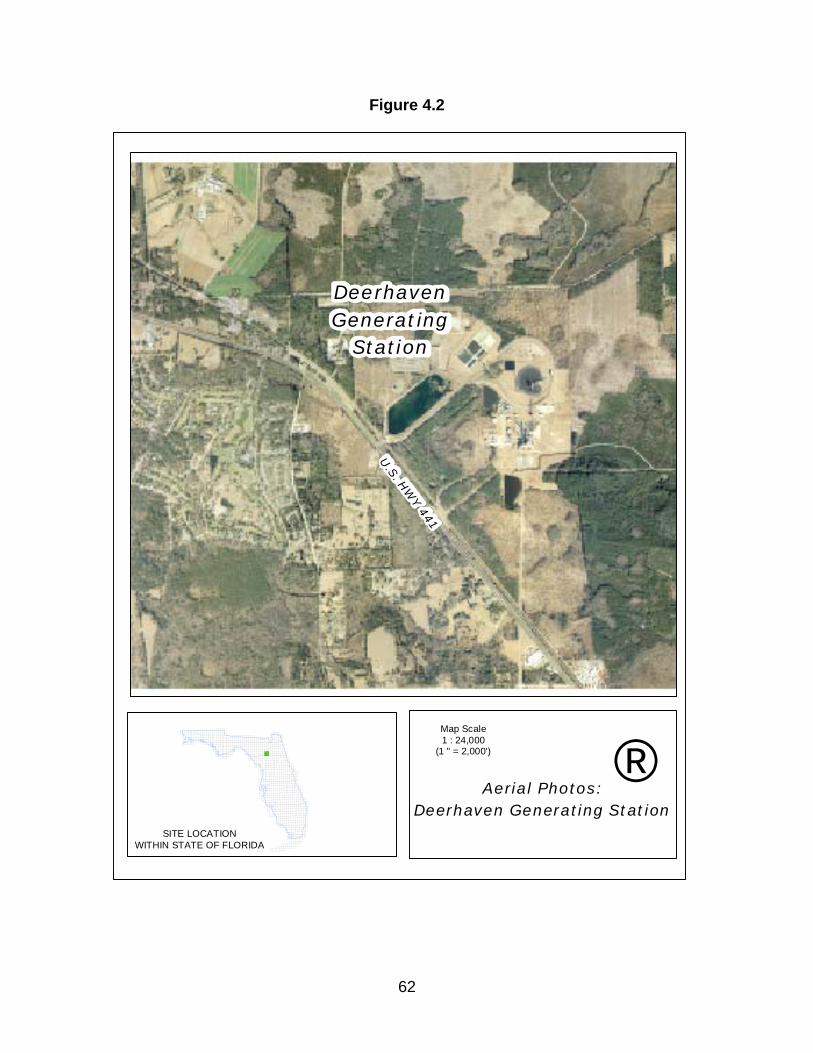
Figure 4.2
62
®SITE LOCATION
WITHIN STATE OF FLORIDA
Map Scale1 : 24,000
(1 " = 2,000')
DeerhavenGenerating
Station
Aerial Photos:Deerhaven Generating Station
U.S. H
WY 441