g uidance on the collection of race and ethnicity data by ambulance services bruce cohen, sylvia...
TRANSCRIPT
GGuidance on the uidance on the Collection of Race and Collection of Race and Ethnicity DataEthnicity Databy Ambulance Servicesby Ambulance Services
Bruce Cohen, Sylvia Hobbs, James West, Georgia Simpson-May Massachusetts Department of Public Health

Purpose of this Purpose of this InformationInformation
• Provide instructions on how to collect race and ethnicity data in the prehospital setting
• Provide tools for responding to questions patients may have and to reduce patient and EMT discomfort
• Explain why race and ethnicity data are required to meet State and National requirements

QuestionQuestion 1, Hispanic 1, Hispanic EthnicityEthnicity
1. Are you Hispanic/Latino/Spanish?1. Are you Hispanic/Latino/Spanish?❑ ❑ Yes Yes
❑❑ NoNo

If a patient asksIf a patient asks “What is meant by Hispanic, “What is meant by Hispanic,
Latino or Spanish?”Latino or Spanish?”EMT Response: “A person is Hispanic, Latino or
Spanish if he or she considers themselves to be of Hispanic or Latino heritage. Usually, but not always people who trace their heritage or family’s heritage to Spain or a country in Latin American can think of
themselves as Hispanic.”
Record Patient’s Yes or No ResponseIf the response is some, partly, half, or a
little, please enter Yes.If a patient declines, enter Not Reporting.

If a patient asksIf a patient asks “Are you trying to find out if I “Are you trying to find out if I
am a US Citizen?”am a US Citizen?”EMT Response: “No, definitely not.
Also, the confidentiality of all patient information if protected by law.”
Record Patient’s Yes or No ResponseIf the response is some, partly, half, or a
little, please enter Yes.If a patient declines, enter Not Reporting.
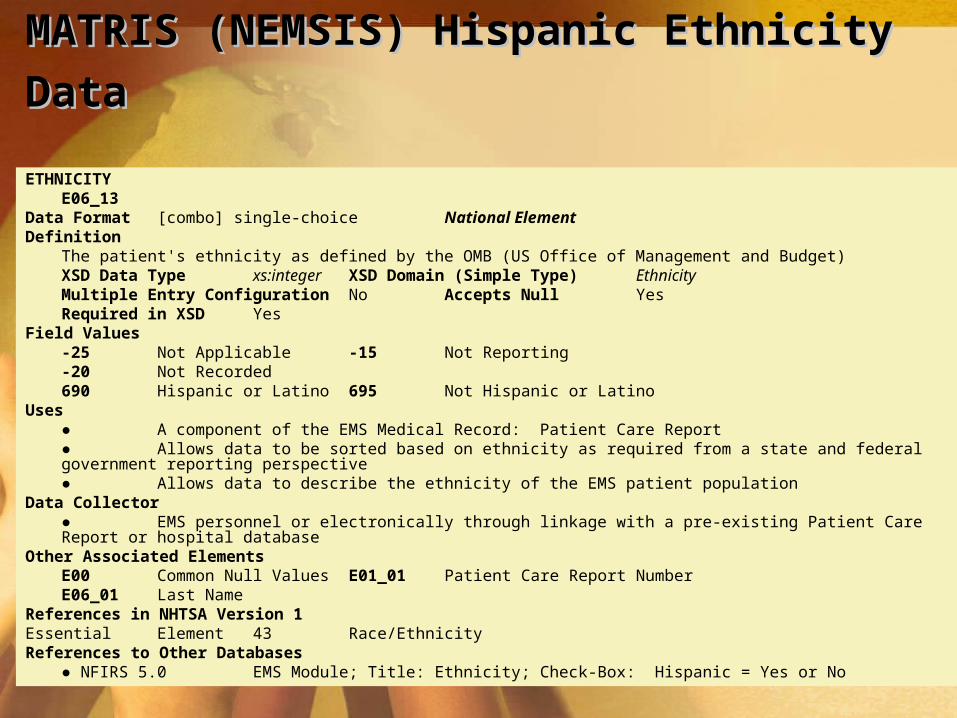
MATRIS (NEMSIS) Hispanic Ethnicity DataMATRIS (NEMSIS) Hispanic Ethnicity Data
ETHNICITYE06_13
Data Format [combo] single-choice National ElementDefinition
The patient's ethnicity as defined by the OMB (US Office of Management and Budget)XSD Data Type xs:integer XSD Domain (Simple Type) EthnicityMultiple Entry Configuration No Accepts Null YesRequired in XSD Yes
Field Values-25 Not Applicable -15 Not Reporting-20 Not Recorded690 Hispanic or Latino 695 Not Hispanic or Latino
Uses● A component of the EMS Medical Record: Patient Care Report● Allows data to be sorted based on ethnicity as required from a state and federal government reporting perspective● Allows data to describe the ethnicity of the EMS patient population
Data Collector● EMS personnel or electronically through linkage with a pre-existing Patient Care Report or hospital database
Other Associated ElementsE00 Common Null Values E01_01 Patient Care Report NumberE06_01 Last Name
References in NHTSA Version 1Essential Element 43 Race/EthnicityReferences to Other Databases
● NFIRS 5.0 EMS Module; Title: Ethnicity; Check-Box: Hispanic = Yes or No

Question 2, RaceQuestion 2, Race
2. What is your race? (select all that apply) ❑ American Indian/Alaska Native
❑ Asian❑ Black❑ Native Hawaiian or other Pacific Islander ❑ White❑ Other❑ Unknown/not reporting
If a patient declines or does not know,
enter Not Reporting.

If a patient responds:If a patient responds: “We’re all human beings” “We’re all human beings”
EMT Response: “We collect this information to make sure
everyone gets the best possible care.”
If a patient declines or does not know,
enter Not Reporting.

MATRIS (NEMSIS) Race DataMATRIS (NEMSIS) Race DataRACE
E06_12Data Format [combo] single-choice National ElementDefinition
The patient's race as defined by the OMB (US Office of Management and Budget)XSD Data Typexs:integer XSD Domain (Simple Type) RaceMultiple Entry Configuration No Accepts Null YesRequired in XSD Yes
Field Values-25 Not Applicable -20 Not Recorded-15 Not Reporting660 American Indian or Alaska Native 665 Asian670 Black or African American 675 Native Hawaiian or Other Pacific Islander680 White 685 Other Race
Uses● A component of the EMS Medical Record: Patient Care Report● Allows data to be sorted based on race as required from a state and federal government reporting perspective● Allows data to describe the race of the EMS patient population
Data Collector● EMS personnel or electronically through linkage with a pre-existing Patient Care Report or hospital database
Other Associated ElementsE00 Common Null Values E01_01 Patient Care Report NumberE06_01 Last Name
References in NHTSA Version 1Essential Element 43 Race/EthnicityReferences to Other Databases
● NFIRS 5.0 EMS Module; Title: Race; Pick-List: White = 1, Black = 2, American Indian, Eskimo, Aleut = 3, Asian = 4, Other, Multi-racial = 0, Race Undetermined = U

If a patient asks “Why?”If a patient asks “Why?”
EMT Response: There are new state requirements that all
ambulance services in Massachusetts collect this
information.
This information will only be used to guarantee that all
patients receive the highest quality of care and to ensure the
best services possible.

If a patient wants more If a patient wants more information…information…
Some patients will want a more detailed explanation about why the data are being collected before responding. In such cases, the EMT should explain that the State will use the data to ensure that we are providing quality care and serving a diverse population. We are collecting this information from all patients. This will help us to see differences in health among different populations. We can reduce those differences by reaching out to people and offering additional services.
Although we are required to ask, respondents are NOT required to provide answers. If a patient elects not to answer, the EMT should select the “Not Reporting” box.
EMTs should NOT guess or select the category he/she believes best describes the patient.

If a patient asks about If a patient asks about PrivacyPrivacy
EMT Response: “Your privacy is protected.”
Who accesses the information:
• Hospital Registration personnel
• EMS and Hospital Care Providers
• EMS Quality Control Personnel
Who does not access the information:
• Immigration• The general public

If the patient refusesIf the patient refuses
EMT Response: “I understand that these questions may be a little
sensitive. We are required to ask all patients. This information will be kept
private and will only be used to improve the healthcare we provide to
all.”

If the patient If the patient stillstill refuses refuses
EMT Response: “That is okay. You have the right to not answer these
questions.”
Record Patient’s Response as Not
Reporting
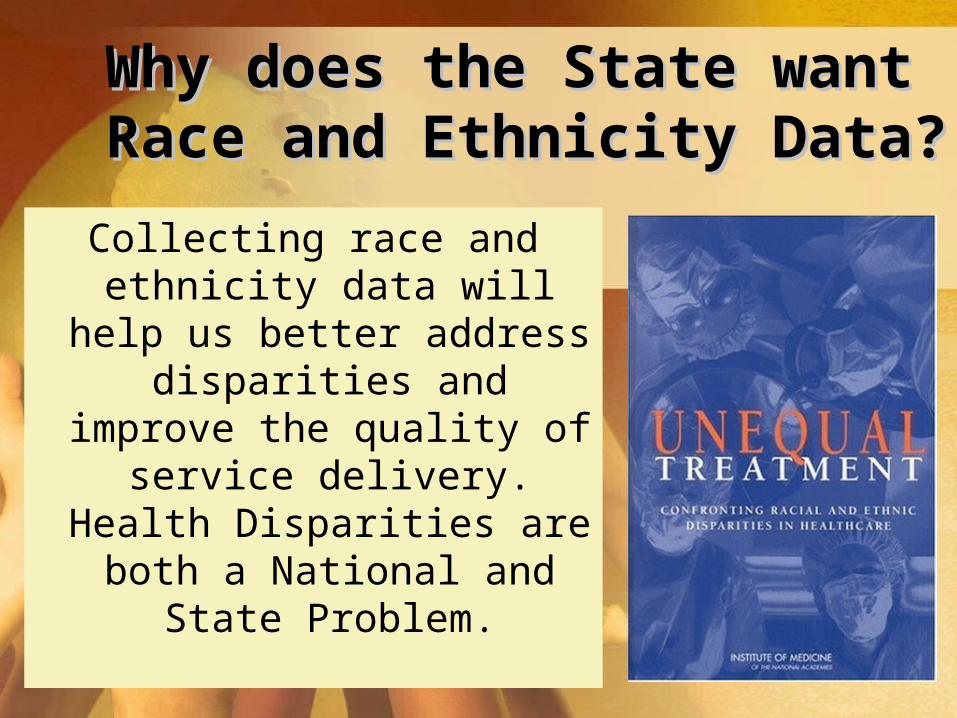
Why does the State want Why does the State want Race and Ethnicity Data?Race and Ethnicity Data?
Collecting race and ethnicity data will help
us better address disparities and improve the quality of service
delivery. Health Disparities are both a
National and State Problem.

Added ValueAdded Value OF RACE
• civil rights infringement: monitors discrimination, equality of opportunity and treatment, and indirectly, institutional racism
• more routinely collected
• limited capacity to use alternative data collection processes: (observation, informant, surname)
OF ETHNICITY
• more consistently understood
• less likely to change over time, less context dependent
• more useful for program targeting and development
• measure of cultural practices
• improved sensitivity to linguistic needs

What are Health What are Health Disparities?Disparities?
Health disparities are differences in health outcomes and their determinants between segments of the population, as defined by social, demographic, environmental, and geographic attributes. Health inequalities, which is sometimes used interchangeably with the term health disparities, is more often used in the scientific and economic literature to refer to summary measures of population health associated with individual- or group-specific attributes (e.g., income, education, or race/ethnicity). Health inequities are a subset of health inequalities that are modifiable, associated with social disadvantage, and considered ethically unfair. Health disparities, inequalities, and inequities are important indicators of community health and provide information for decision making and intervention implementation to reduce preventable morbidity and mortality. Except in the next section of this report that describes selected health inequalities, this report uses the term health disparities as it is defined in U.S. federal laws and commonly used in the U.S. public health literature to refer to gaps in health between segments of the population.
Source: CDC MMWR Rationale for Regular Reporting on Health Disparities and Inequalities--United States, January 14, 2011 / 60(01);3-10

What is the Public Health Rationale for What is the Public Health Rationale for Measuring Health Disparities?Measuring Health Disparities?
Increasingly, the research, policy, and public health practice literature report substantial disparities in life expectancy, morbidity, risk factors, and quality of life, as well as persistence of these disparities among segments of the population. In 2007, the CDC’s Healthy People 2010 Midcourse Review revealed progress on certain objectives but less than adequate progress toward eliminating health disparities for the majority of objectives among segments of the U.S. population, defined by race/ethnicity, sex, education, income, geographic location, and disability status.
During 1980--2000, the U.S. population became older and more ethnically diverse, and during 1992--2005, household income inequality increased. Although the combined effects of changes in the age structure, racial/ethnic diversity, and income inequality on health disparities are difficult to assess, the nation is likely to continue experiencing substantial racial/ethnic and socioeconomic health disparities, even though overall health outcomes measured by Healthy People 2010 objectives are improving for the nation. Because vulnerable populations are more likely than others to be affected adversely by economic recession, the recent downturn in the global economy might worsen health disparities throughout the United States if the coverage and effectiveness of safety-net and targeted programs do not keep pace with needs .
Source: CDC MMWR Rationale for Regular Reporting on Health Disparities and Inequalities--United States, January 14, 2011 / 60(01);3-10

•The cancer death rate for men was 46% higher than the rate for women
•Blacks had the highest premature mortality rate, 1.5 times the rate of whites
•The death rate for those with less education was almost 3 times higher than the rate for those with more education
•Springfield, Lowell, Fall River, Taunton, Worcester, and New Bedford had the highest premature mortality rates
Evidence of Health Evidence of Health Disparities in MassachusettsDisparities in Massachusetts
Source: Massachusetts Deaths 2007, Massachusetts Department of Public Health Bureau of Health Information, Statistics, Research, and Evaluation, Division of Research and Epidemiology, Registry of Vital Records and Statistics, April 2009

Rates per 100,000 population under 75 years of age; age-adjusted to the 2000 US standard population.
CHNA PMR1. Community Health Network of Berkshire = 331.02. Upper Valley Health Web-Franklin County = 303.53. Partnership for Health in Hampshire County = 319.14. The Community Health Connection = 384.35. Community Health Network of Southern Worcester County = 335.96. Community Partners for Health = 290.27. Community Health Network of Greater Metro West = 238.68. Community Wellness Coalition = 355.69. Fitchburg/Gardner Community Health Network = 322.610. Greater Lowell Community Health Network = 350.911. Greater Lawrence Community Health Network = 281.912. Greater Haverhill Community Health Network = 331.313. Community Health Network North = 267.4
14. North Shore Community Health Network = 316.515. Greater Woburn/Concord/Littleton Community Health Network = 192.016. North Suburban Health Alliance = 285.617. Greater Cambridge/Somerville Community Health Network = 232.718. West Suburban Health Network = 210.619. Alliance for Community Health = 358.420. Blue Hills Community Health Alliance = 298.421. Hampshire County Partnership = 351.522. Greater Brockton Community Health Network = 366.623. South Shore Community Partners in Prevention = 284.924. Greater Attleboro-Taunton Health & Education Response = 35425. Partners for a Healthier Community = 378.926. Greater New Bedford Health & Human Services Coalition = 343.527. Cape Cod & Islands Community Health Network = 295.9
1
45
8
24
26
12
10
22
21
25
19
2 9
3
6
27
23
20
1311
1416
7
15
18
17
Rates are per 100,000 persons under 75 years of age, age-adjusted to the 2000 US standard population and are calculated using MDPHpopulation estimates for 2005, which are the most up-to-date estimates available at the sub-state level by age groups.
2007 PMR by CHNA
Significantly higher than state rate
Not significantly different from state rate
Significantly lower than state rate
Massachusetts PMR= 295.4
Premature Mortality Rates (PMR) Premature Mortality Rates (PMR) by Community Health Network by Community Health Network
Area (CHNA) Massachusetts: 2007Area (CHNA) Massachusetts: 2007Source: Massachusetts Deaths 2007, Massachusetts Department of Public Health Bureau of Health Information, Statistics, Research, and Evaluation, Division of Research and Epidemiology, Registry of Vital Records and Statistics, April 2009

Mortality Rates by Education Mortality Rates by Education and and Race/Ethnicity, Adults 25-64 Race/Ethnicity, Adults 25-64 YearsYears11
Massachusetts: 2007Massachusetts: 2007727.3
467.7
181.0
358.5
231.0
533.7
0
200
400
600
800
Whites Blacks Hispanics
Dea
ths
per
100
,000
High School or Less
13+ Education
Rates are per 100,000 population. Age-adjusted to the 2000 US standard population 1Uses 2000 Population Estimates
* Statistically higher than those with 13+ yrs of education (p<0..05)
*
*
*
Source: Massachusetts Deaths 2007, Massachusetts Department of Public Health Bureau of Health Information, Statistics, Research, and Evaluation, Division of Research and Epidemiology, Registry of Vital Records and Statistics, April 2009
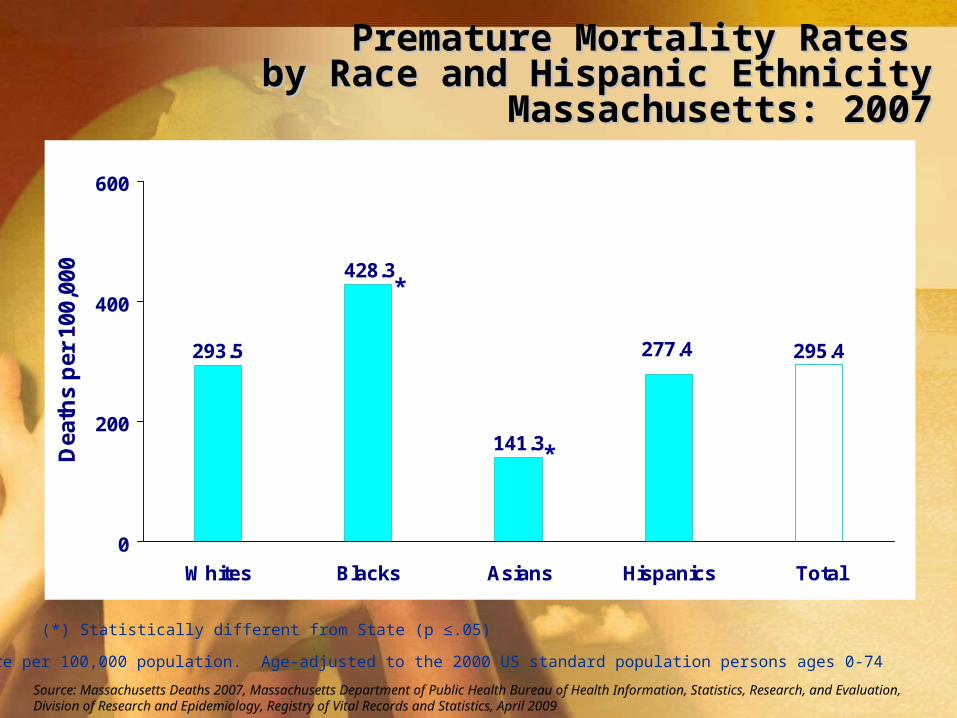
Premature Mortality Rates Premature Mortality Rates by Race and Hispanic Ethnicityby Race and Hispanic Ethnicity
Massachusetts: 2007Massachusetts: 2007
295.4277.4
141.3
428.3
293.5
0
200
400
600
Whites Blacks Asians Hispanics Total
Dea
ths
per
100
,000
Rates are per 100,000 population. Age-adjusted to the 2000 US standard population persons ages 0-74
*
*
(*) Statistically different from State (p ≤.05)
Source: Massachusetts Deaths 2007, Massachusetts Department of Public Health Bureau of Health Information, Statistics, Research, and Evaluation, Division of Research and Epidemiology, Registry of Vital Records and Statistics, April 2009

Diabetes Mortality Rates Diabetes Mortality Rates by Race and Ethnicityby Race and EthnicityMassachusetts: 2007Massachusetts: 2007
15.5
37.4
28.2
16.5
9.9
0
10
20
30
40
Whites Blacks Asians Hispanics Total
Dea
ths
per
100
,000
Rates are per 100,000 population. Age-adjusted to the 2000 US standard population
N=1,041 N=96 N=15 N=62 N=1,216
* Statistically different than state rate (p<0.05)
*
*
*
Source: Massachusetts Deaths 2007, Massachusetts Department of Public Health Bureau of Health Information, Statistics, Research, and Evaluation, Division of Research and Epidemiology, Registry of Vital Records and Statistics, April 2009

Mortality Rates for Causes Mortality Rates for Causes Amenable to Health Care by Race/EthnicityAmenable to Health Care by Race/Ethnicity
Massachusetts: 2000 and 2007Massachusetts: 2000 and 2007
105.4
142.9
40.6
103.6
64.5
82.180.5
53.1
122.9
80.8
0
40
80
120
160
Whites Blacks Asians Hispanics Total
Dea
ths
per
100
,000
2000 2007
Rates are per 100,000 population. Age-adjusted to the 2000 US standard population persons ages 0-74
** **
** Statistically lower than 2000 rate (p<0.05)
Source: Massachusetts Deaths 2007, Massachusetts Department of Public Health Bureau of Health Information, Statistics, Research, and Evaluation, Division of Research and Epidemiology, Registry of Vital Records and Statistics, April 2009
Concluding ThoughtsConcluding Thoughts• Collecting race and ethnicity data will help us better
address disparities and improve the quality of service delivery
• For additional information on health disparities, see:– Unequal Treatment: Confronting Racial and
Ethnic Disparities in Health Care available for free online at: http://www.nap.edu/openbook.php?isbn=030908265X
– CDC Health Disparities and Inequalities Report — United States, 2011 available for free online at: http://www.cdc.gov/mmwr/pdf/other/su6001.pdf
Remember: EMTs should NOT guess or select the category Remember: EMTs should NOT guess or select the category he/she believes best describes the patient.he/she believes best describes the patient.