g model article in press - john stermanjsterman.scripts.mit.edu/docs/dogan sterman hoarding jom.pdfg...
TRANSCRIPT

O
“B
Ja
b
a
AAA
1
bsbttrp
srsmt
h0
ARTICLE IN PRESSG ModelPEMAN-916; No. of Pages 16
Journal of Operations Management xxx (2015) xxx–xxx
Contents lists available at ScienceDirect
Journal of Operations Management
journa l homepage: www.e lsev ier .com/ locate / jom
I’m not hoarding, I’m just stocking up before the hoarders get here.”ehavioral causes of phantom ordering in supply chains
ohn D. Sterman a,∗, Gokhan Dogan b
MIT Sloan School of Management, Cambridge, MA, USATAV, Istanbul, Turkey
r t i c l e i n f o
rticle history:vailable online xxxccepted by Daniel R. Guide
a b s t r a c t
When suppliers are unable to fill orders, delivery delays increase and customers receive less than theydesire. Customers often respond by seeking larger safety stocks (hoarding) and by ordering more thanthey need to meet demand (phantom ordering). Such actions cause still longer delivery times, creatingpositive feedbacks that intensify scarcity and destabilize supply chains. Hoarding and phantom orderingcan be rational when customers compete for limited supply in the presence of uncertainty or capacity con-straints. But they may also be behavioral and emotional responses to scarcity. To address this question weextend Croson et al.’s (2014) experimental study with the Beer Distribution Game. Hoarding and phantomordering are never rational in the experiment because there is no horizontal competition, randomness,or capacity constraint; further, customer demand is constant and participants have common knowledgeof that fact. Nevertheless 22% of participants place orders more than 25 times greater than the known,constant demand. We generalize the ordering heuristic used in prior research to include the possibilityof endogenous hoarding and phantom ordering. Estimation results strongly support the hypothesis, withhoarding and phantom ordering particularly strong for the outliers who placed extremely large orders.
We discuss psychiatric and neuroanatomical evidence showing that environmental stressors can triggerthe impulse to hoard, overwhelming rational decision-making. We speculate that stressors such as largeorders, backlogs or late deliveries trigger hoarding and phantom ordering for some participants eventhough these behaviors are irrational. We discuss implications for supply chain design and behavioral operations research.. Introduction
During World War II, as the Allies faced shortages of food andasic goods, hoarding became a serious threat. A cartoon at the timehowed a stern store manager confronting a shopper attempting touy dozens of cans of food despite rationing. Caught red-handed,he shopper says, “I’m not hoarding, I’m just stocking up beforehe hoarders get here.” Is such behavior a rational, if anti-social,esponse to scarcity, or an emotional reaction driven by fear andanic?
Hoarding, defined here as attempts to accumulate large privatetocks of goods when people perceive threats to supply, is closelyelated to phantom ordering in which people react to uncertain
Please cite this article in press as: Sterman, J.D., Dogan, G., “I’m notBehavioral causes of phantom ordering in supply chains. J. Operations
upply by ordering more than they actually desire, or ordering fromultiple suppliers, then planning to cancel their excess orders once
hey get what they desire. Not limited to wartime, hoarding and
∗ Corresponding author.E-mail address: [email protected] (J.D. Sterman).
ttp://dx.doi.org/10.1016/j.jom.2015.07.002272-6963/© 2015 Elsevier B.V. All rights reserved.
© 2015 Elsevier B.V. All rights reserved.
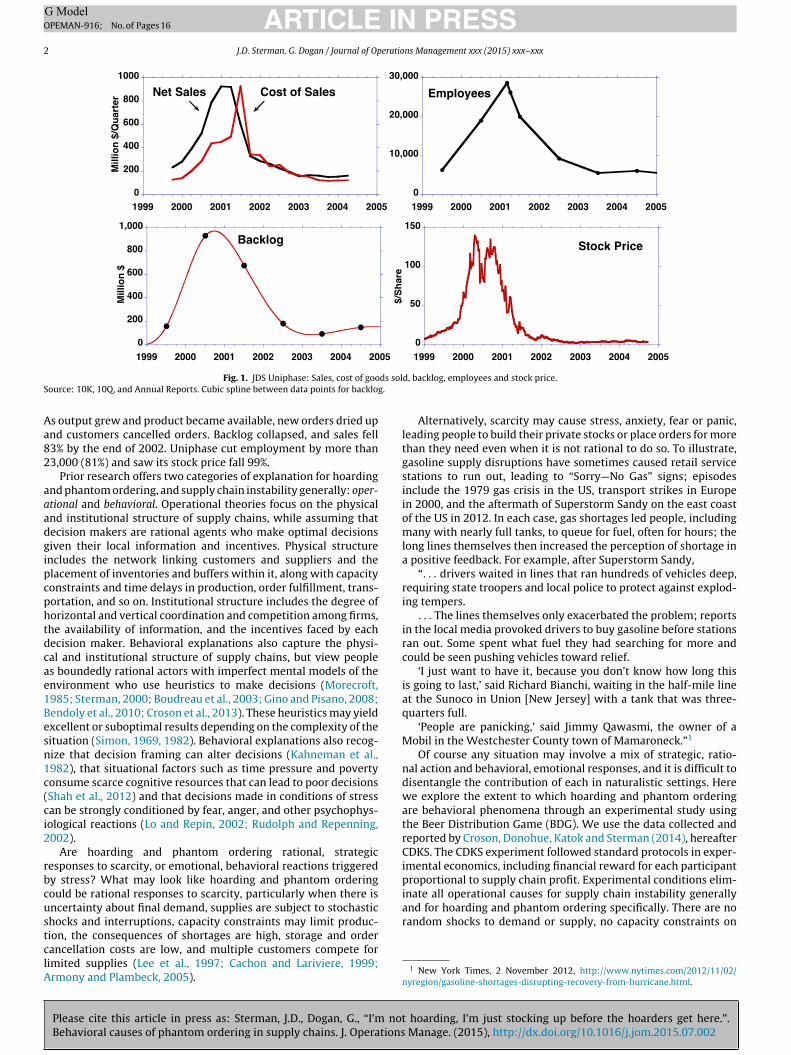
phantom ordering remain persistent, destabilizing and costly phe-nomena in supply chains. For example, during the great technologyboom of the late 20th century, firms such as Cisco Systems, Lucent,Nortel, and JDS Uniphase experienced huge surges in incomingorders. Deliveries could not keep pace. Customers were placed onallocation, receiving only a fraction of what they ordered. Desper-ate for product, many customers ordered still more, often placingorders through multiple channels—in some cases, three or moretimes the number of units they actually desired (Goetz, 2005).These phantom orders further inflated backlogs, causing still longerdelivery times and smaller allocations, a positive feedback thatintensified scarcity. After a lag, production increased and alloca-tions were eased. Suddenly able to get all the product they wanted,customers cancelled their phantom orders, leaving suppliers withhuge excess stocks, excess capacity and deep losses. Cisco wasforced to write off $2.2 billion in excess inventory. Others faredfar worse. During the boom, the order backlog of equipment maker
hoarding, I’m just stocking up before the hoarders get here.”. Manage. (2015), http://dx.doi.org/10.1016/j.jom.2015.07.002
JDS Uniphase exploded, rising 3000% from mid 1998 to mid 2000(Fig. 1). Sales quadrupled between the end of 1999 and beginning of2001. Uniphase expanded capacity and employment dramatically.
ARTICLE IN PRESSG ModelOPEMAN-916; No. of Pages 16
2 J.D. Sterman, G. Dogan / Journal of Operations Management xxx (2015) xxx–xxx
ds solS g.
Aa82
aaadgipcphtdcae1Besn1c(ci2
rbcustclA
inate all operational causes for supply chain instability generallyand for hoarding and phantom ordering specifically. There are norandom shocks to demand or supply, no capacity constraints on
Fig. 1. JDS Uniphase: Sales, cost of gooource: 10K, 10Q, and Annual Reports. Cubic spline between data points for backlo
s output grew and product became available, new orders dried upnd customers cancelled orders. Backlog collapsed, and sales fell3% by the end of 2002. Uniphase cut employment by more than3,000 (81%) and saw its stock price fall 99%.
Prior research offers two categories of explanation for hoardingnd phantom ordering, and supply chain instability generally: oper-tional and behavioral. Operational theories focus on the physicalnd institutional structure of supply chains, while assuming thatecision makers are rational agents who make optimal decisionsiven their local information and incentives. Physical structurencludes the network linking customers and suppliers and thelacement of inventories and buffers within it, along with capacityonstraints and time delays in production, order fulfillment, trans-ortation, and so on. Institutional structure includes the degree oforizontal and vertical coordination and competition among firms,he availability of information, and the incentives faced by eachecision maker. Behavioral explanations also capture the physi-al and institutional structure of supply chains, but view peoples boundedly rational actors with imperfect mental models of thenvironment who use heuristics to make decisions (Morecroft,985; Sterman, 2000; Boudreau et al., 2003; Gino and Pisano, 2008;endoly et al., 2010; Croson et al., 2013). These heuristics may yieldxcellent or suboptimal results depending on the complexity of theituation (Simon, 1969, 1982). Behavioral explanations also recog-ize that decision framing can alter decisions (Kahneman et al.,982), that situational factors such as time pressure and povertyonsume scarce cognitive resources that can lead to poor decisionsShah et al., 2012) and that decisions made in conditions of stressan be strongly conditioned by fear, anger, and other psychophys-ological reactions (Lo and Repin, 2002; Rudolph and Repenning,002).
Are hoarding and phantom ordering rational, strategicesponses to scarcity, or emotional, behavioral reactions triggeredy stress? What may look like hoarding and phantom orderingould be rational responses to scarcity, particularly when there isncertainty about final demand, supplies are subject to stochastichocks and interruptions, capacity constraints may limit produc-
Please cite this article in press as: Sterman, J.D., Dogan, G., “I’m noBehavioral causes of phantom ordering in supply chains. J. Operations
ion, the consequences of shortages are high, storage and orderancellation costs are low, and multiple customers compete forimited supplies (Lee et al., 1997; Cachon and Lariviere, 1999;rmony and Plambeck, 2005).
d, backlog, employees and stock price.
Alternatively, scarcity may cause stress, anxiety, fear or panic,leading people to build their private stocks or place orders for morethan they need even when it is not rational to do so. To illustrate,gasoline supply disruptions have sometimes caused retail servicestations to run out, leading to “Sorry—No Gas” signs; episodesinclude the 1979 gas crisis in the US, transport strikes in Europein 2000, and the aftermath of Superstorm Sandy on the east coastof the US in 2012. In each case, gas shortages led people, includingmany with nearly full tanks, to queue for fuel, often for hours; thelong lines themselves then increased the perception of shortage ina positive feedback. For example, after Superstorm Sandy,
“. . . drivers waited in lines that ran hundreds of vehicles deep,requiring state troopers and local police to protect against explod-ing tempers.. . . The lines themselves only exacerbated the problem; reports
in the local media provoked drivers to buy gasoline before stationsran out. Some spent what fuel they had searching for more andcould be seen pushing vehicles toward relief.
‘I just want to have it, because you don’t know how long thisis going to last,’ said Richard Bianchi, waiting in the half-mile lineat the Sunoco in Union [New Jersey] with a tank that was three-quarters full.
‘People are panicking,’ said Jimmy Qawasmi, the owner of aMobil in the Westchester County town of Mamaroneck.”1
Of course any situation may involve a mix of strategic, ratio-nal action and behavioral, emotional responses, and it is difficult todisentangle the contribution of each in naturalistic settings. Herewe explore the extent to which hoarding and phantom orderingare behavioral phenomena through an experimental study usingthe Beer Distribution Game (BDG). We use the data collected andreported by Croson, Donohue, Katok and Sterman (2014), hereafterCDKS. The CDKS experiment followed standard protocols in exper-imental economics, including financial reward for each participantproportional to supply chain profit. Experimental conditions elim-
t hoarding, I’m just stocking up before the hoarders get here.”. Manage. (2015), http://dx.doi.org/10.1016/j.jom.2015.07.002
1 New York Times, 2 November 2012, http://www.nytimes.com/2012/11/02/nyregion/gasoline-shortages-disrupting-recovery-from-hurricane.html.

ING ModelO
eratio
pcaCfiftnt
lkwmtctrn
mrroi
eeatstatca(oattA
umciirmhmdaIapdtntutahi
ARTICLEPEMAN-916; No. of Pages 16
J.D. Sterman, G. Dogan / Journal of Op
roduction, and no price variations. Each supplier has only oneustomer so there is no horizontal competition to trigger short-ge gaming. No order cancellations are permitted. Further, in theDKS implementation of the BDG, there is no uncertainty aboutnal demand; indeed, customer demand is constant at all times at
our cases per week, and this fact is publicly announced in advanceo all participants. Under these conditions rational agents wouldever create a bullwhip effect, generate oscillations, hoard inven-ory or place phantom orders.
Nevertheless, CDKS find a significant bullwhip effect and oscil-ations in nearly all cases. Even more surprising, despite commonnowledge that customer demand is constant at four cases pereek, 22% of participants order hundreds of cases at a time orore—more than 25 times larger than their common knowledge of
he constant demand—even though doing so destabilizes the supplyhain, raises costs and reduces their financial reward. CDKS treathe extreme cases as outliers, and, although CDKS show that theiresults hold whether the outliers are included or excluded, they doot attempt to explain how such behavior arose.
To explore the role of behavioral processes in the BDG, we esti-ate various decision rules for participant orders. Our decision
ules allow for endogenous hoarding and phantom ordering byelaxing the assumption in prior work that desired on-hand andn-order stocks are constant. We find 36% of participants engaged
n statistically significant hoarding or phantom ordering.Why would people engage in hoarding and phantom ordering
ven when it is irrational to do so? Mammals including humansvolved in environments characterized by variability, uncertainty,nd competition for scarce resources. Hoarding is often an adap-ive behavior in such circumstances, and is observed in manypecies. Neuroanatomical and brain imaging studies suggest thathe propensity to hoard emerged early in mammalian evolution,nd that the brain centers responsible for hoarding are distinct fromhe loci of economic decision-making. The Diagnostic and Statisti-al Manual of Mental Disorders (DSM-5) now recognizes hoardings a distinct psychiatric disorder affecting 2-5% of the populationAmerican Psychiatric Association, 2013). Brain imaging studiesf such individuals find less activity in areas of the brain associ-ted with decision making and emotional control, suggesting thathe limbic system, where emotional responses and the impulseo hoard arise, is able to dominate behavior (Saxena et al., 2004;nderson et al., 2004).
Does the prevalence of hoarding disorder in the general pop-lation mean hoarding and phantom ordering are inevitable, thatanagers must resign themselves to the instability and costs they
reate? If the propensity to engage in hoarding or phantom orderings an attribute of individuals, then the incidence of these behav-ors among participants in the experiment should be distributedandomly. If this dispositional hypothesis is correct, supply chain
anagers might seek to screen out job candidates who suffer fromoarding disorder or are predisposed to it. Alternatively, everyoneay be susceptible to hoarding and phantom ordering to some
egree, with these behaviors triggered by stressors in the situ-tion such as unexpected delivery problems or demand spikes.f this situational hypothesis is correct the incidence of hoardingnd phantom ordering will not be randomly distributed; rather,articipants who experienced stressors such as large, unexpectedemand surges or poor supplier performance will be more likelyo engage in hoarding or place phantom orders than those who didot experience such stresses. If stress can cause irrational hoardingo overwhelm rational decision making even in normal individ-als, screening won’t work; instead firms should seek to redesign
Please cite this article in press as: Sterman, J.D., Dogan, G., “I’m notBehavioral causes of phantom ordering in supply chains. J. Operations
heir supply chains to minimize stressors. We test the dispositionalnd situational hypotheses in the CDKS data. The dispositionalypothesis is strongly rejected, while the situational hypothesis
s supported: the incidence of hoarding and phantom ordering is
PRESSns Management xxx (2015) xxx–xxx 3
much greater among participants who experienced stresses includ-ing order spikes, backlogs, and poor supplier performance.
Why does it matter whether hoarding and phantom ordering arestrategic or behavioral phenomena? Strategic agents will engagein these behaviors when it is rational to do so, and will not if thesystem is redesigned so that hoarding and phantom ordering areno longer optimal. In contrast, if hoarding and phantom ordersarise as the result of bounded rationality and emotional arousal,these behaviors can be triggered by scarcity even among normalindividuals and even when it is irrational to do so, and effectiveinterventions require more than an optimal policy.
We next review the literature on hoarding and phantomordering, showing how positive feedback causes scarcity to be self-reinforcing, and contrast the rational and behavioral theories ofthe phenomenon. Section 3 describes the experiment and results.In section 4 we estimate various ordering decision rules, relaxingthe restrictive assumptions of prior work that desired on-hand andon-order stocks are constant. In section 5 we test the dispositionaland situational hypotheses. In the discussion we explore the impli-cations and review results from neuroscience and psychiatry thatbear on the etiology and evolutionary origins of hoarding. We closewith implications for supply chain design and future research inbehavioral operations management.
2. Hoarding, phantom orders and positive feedback
Phantom ordering has long been recognized. Mitchell (1924)provided an early description of the process and its role in supplychain instability. He described a situation in which
“Retailers find that there is a shortage of merchandise at theirsources of supply. Manufacturers inform them that it is with regretthat they are able to fill their orders only to the extent of 80per cent. . .. They hope to be able to give full service next sea-son, by which time, no doubt, these unexplainable conditionswill have been remedied. However, retailers, having been dis-appointed in deliveries. . .are not going to be caught that wayagain. . .[N]ext season, if they want 90 units of an article, theyorder 100, so as to be sure, each, of getting the 90 in the pro ratashare delivered. . ..Furthermore, to make doubly sure, each mer-chant spreads his orders over more sources of supply.
...[T]he false demand is passed back, stage by stage, along thechannels of production.... What, in turn, is the natural result. . .?Eventually the streams of production are not only enlarged butoverenlarged. There comes a time when the ultimate sources ofsupply fill nearly all the orders of their customers. The latter aresurprised to find their orders filled promptly and fully. . ..Thereis no longer a shortage....Producers in the second stages also filltheir orders promptly and fully, thus surprising their customers inturn....And so on down to the retailers.... [P]roduction has come toexceed the real demand....” (Mitchell 1924; 645–647).
Hoarding and phantom ordering are common in many indus-tries (Goncalves, 2003). Phantom orders are particularly prevalentin industries with long and variable lead times such as chemicals,pulp and paper, semiconductors, and high-tech (see e.g., Burtonet al., 2005 for an example in the chemicals industry and Shi, 2002for an example in high technology). Hoarding, placing multipleorders, and panic buying are also frequently seen for hot consumerproducts such as toys, games, and electronics (e.g. Cabbage Patchdolls, X-Box, iphones). Panic buying and hoarding of food, fuel,and medicines are common during wartime and periods of civilunrest, in regions where goods are chronically scarce (e.g., Russia
hoarding, I’m just stocking up before the hoarders get here.”. Manage. (2015), http://dx.doi.org/10.1016/j.jom.2015.07.002
and eastern Europe under communism), after disasters (e.g., super-storms Sandy and Haiyan) and in times of fear and uncertainty (e.g.,the 1979 US gasoline crisis, the run-up to Y2K). The 2001 anthraxattacks in the US led to runs on the antibiotic Ciprofloxacin (Cipro).

ARTICLE IN PRESSG ModelOPEMAN-916; No. of Pages 16
4 J.D. Sterman, G. Dogan / Journal of Operations Management xxx (2015) xxx–xxx
f hoar
RlGo
pFwpbpdncsbcof
mftti(noettsmtnlBst
ftts
final sales. As Mitchell describes, each firm orders more than theywant to compensate for shrinking allocations, further increasing
2 Note that the dynamics above follow from fundamental queuing theory, e.g., thefact that, by Little’s Law, equilibrium on-order quantities must equal the productof desired deliveries and the delivery delay. A large literature explores more subtle
Fig. 2. Feedback structure o
ationing of flu vaccine in the fall of 2004 led to panic buying, fol-owed within months by surplus stocks (US House Committee onovernment Reform, 2005), and fear of avian flu triggered hoardingf the antiviral drug olsetamivir (Tamiflu) (Pollack 2005).
Fig. 2 shows the feedback structure leading to hoarding andhantom ordering (Sterman 2000; Ch. 17–18, provides more detail;orrester (1961) formulated the first dynamic supply chain modelith endogenous desired inventory coverage and desired sup-
ly lines of on-order inventory). The figure shows the interactionetween a customer, distribution channel (e.g., a retailer), and sup-lier. To maintain adequate service levels for its customers, theistribution channel maintains an inventory of product. The chan-el also maintains a supply line of orders with the supplier (thehannel order backlog). Channel managers place orders with theirupplier to (1) replenish units sold to customers, (2) close any gapetween their desired and actual on-hand inventory level, and (3)lose any gap between the desired and actual supply line of goodsn order with the supplier. These actions form several negativeeedbacks.
First, if channel inventory falls below the target level, channelanagers (or their inventory management software) order more
rom the supplier. The supplier increases shipments to the channel,hough it takes time to do so (the delay is shown in the link betweenhe supplier’s desired shipments and actual shipments). Deliver-es to the channel raise on-hand inventories, closing the negativebalancing) Inventory Control loop, B1. Second, distribution chan-el managers adjust orders to maintain the supply line of unfilledrders at the level sufficient to ensure adequate and timely deliv-ries. For example, if the channel needs to receive 1000 units fromhe supplier each day, and it takes the supplier 10 days to fill orders,hen, by Little’s Law, the channel must maintain, in equilibrium, aupply line of 10,000 units on order. If, through process improve-ent, the supplier can cut the normal delivery time to 5 days, then
he channel need maintain a supply line of only 5000 units. Chan-el managers, or their software, would cut orders until the supply
ine fell from 10,000 to 5000, closing the Supply-Line Control loop,2. Third, an increase in its backlog leads the supplier to increasehipments, reducing the backlog of outstanding orders and closinghe negative Availability loop, B3.
Under normal circumstances, the supplier is able to fill orders
Please cite this article in press as: Sterman, J.D., Dogan, G., “I’m noBehavioral causes of phantom ordering in supply chains. J. Operations
ully within the normal lead-time. Channel managers are con-ent with small safety stocks (safety stock would only be requiredo buffer against uncertainty in customer demand, followingtandard inventory theory). The dynamics of the system are dom-
ding and phantom ordering.
inated by the three negative feedbacks described above. Now,however, imagine that the supplier’s ability to ship falls short ofrequirements. The cause could be the introduction of a surprisinglypopular product, an uptick in the economy, capacity constraints,transportation bottlenecks, strikes or natural disasters. As ship-ments fall below desired levels, the supplier’s lead time rises. Toensure a steady supply of deliveries, channel managers must noworder farther ahead. In the example above, if the supplier’s deliverytime rises from 10 to 15 days, channel managers must (in equi-librium) keep 15,000 units on order. Further, as the probabilityof missed deliveries and partial allocations rises, channel man-agers may seek to have more than 15,000 units on order to keepthe chance that deliveries fall short of requirements to an accept-able level. Orders rise further, causing delivery times to rise stillmore while allocations fall and delivery reliability drops, closing thepositive (reinforcing) Phantom Orders feedback, R1. Furthermore,facing longer delivery delays and less reliable deliveries, channelmanagers may increase their target safety stocks. To do so theymust order more from their suppliers, further lengthening deliverydelays and reducing supplier reliability, triggering still larger tar-get safety stocks and closing the positive Hoarding feedback, R2.Contrary to the normal functioning of markets, scarcity increasesdemand.2
Fig. 3 shows the typical dynamics. Final demand follows a stan-dard lifecycle, rising after product introduction, peaking, and thentrailing off as the product ages. Rising sales deplete distributionchannel inventory. To restore inventories to desired levels the chan-nel must raise orders placed with suppliers above final demand. Ifsupplier capacity is constrained or slow to respond, supplier leadtimes rise and the product may be placed on allocation. Distributionchannel managers respond by placing phantom orders and increas-ing their safety stock targets, boosting orders still further above
t hoarding, I’m just stocking up before the hoarders get here.”. Manage. (2015), http://dx.doi.org/10.1016/j.jom.2015.07.002
effects, such as whether low inventory lowers sales by increasing consumers’ searchcosts or raises sales by signaling scarcity. Cachon et al. (2013) provide a review ofthe literature and an empirical test of these effects in the US automobile industry,finding that lower inventory variety cuts retail sales but that lower inventory of thesame vehicles increases sales (a scarcity effect).

ARTICLE ING ModelOPEMAN-916; No. of Pages 16
J.D. Sterman, G. Dogan / Journal of Operatio
td
bfpeftcdsfgt
ttpspgsg1(t
rbatgaLP
Fig. 3. Typical dynamics of hoarding and phantom ordering.
he backlog and lengthening delivery delays: the positive feedbacksominate the dynamics.
At some point the build rate of product begins to rise faster thanacklog and lead-time peaks. The negative Lead Time Reductioneedback, B4, begins to dominate the system dynamics. Backlogeaks when the build rate equals the order rate, then falls as deliv-ries to the channel exceed new orders. Now the same positiveeedbacks that inflated the demand bubble reverse. With alloca-ions rising and product more readily available, channel managersancel their phantom orders. And with faster and more reliableeliveries, there is no need for the channel to maintain large safetytocks against the risk of supply interruptions. Orders plummet,urther shrinking lead times. Backlog collapses. The supplier strug-les to cut the build rate, but the lag in cutting production leads tohe accumulation of excess inventories.
Hoarding and phantom ordering can be triggered by perturba-ions including supply interruptions or increases in demand. Buthe central role of positive feedback processes means hoarding andhantom ordering can be triggered by even a false perception ofcarcity. For example, Merton’s (1948) theory of the self-fulfillingrophecy emphasizes the role of rumor and misinformation as trig-ers for hoarding episodes such as bank panics. Examples in theupply chain context are abundant. Johnny Carson famously trig-ered a national run on toilet paper when he joked one night in973 that a government report suggested a shortage could occurthe report was wrong). He apologized a few nights later in an efforto stop the panic.
The positive feedbacks described in Fig. 2 may result either fromational, strategic decision-making or from fear, panic and otherehavioral reactions. Thus, as Mitchell described, customers facingllocations yielding only half their order may order twice what theyruly desire. Expecting their competitors to do the same, strate-
Please cite this article in press as: Sterman, J.D., Dogan, G., “I’m notBehavioral causes of phantom ordering in supply chains. J. Operations
ic, forward-looking firms may continue to raise their orders, eachttempting to win a larger share of the shrinking production pie.ee et al. (1997), Cachon and Lariviere (1999) and Armony andlambeck (2005) formalized this intuition, showing that phantom
PRESSns Management xxx (2015) xxx–xxx 5
ordering or shortage gaming is rational when there is horizon-tal competition among customers. However, if shortages triggeremotional arousal, customers may order more and seek to buildsafety stocks out of panic and fear rather than strategic consider-ation of how others will act. Either way, rising orders lead to stilllonger delivery times and still greater orders, making it difficult todetermine the role of rational versus behavioral factors. Laboratoryexperiments, on the other hand, can be designed to eliminate allstrategic incentives for hoarding and phantom ordering. In sucha setting, rational agents would never hoard or place phantomorders, while these behaviors may still be observed if they arisefrom behavioral factors and emotional arousal.
3. The beer distribution game with constant, knowndemand
The Beer Distribution Game (BDG) is widely used in operationsmanagement as both a teaching and research tool. It has been usedto understand the sources of the bullwhip effect, and the impact ofPOS data sharing, inventory visibility, and learning and communi-cation on supply chain performance (Sterman, 1989a; Chen et al.,2000; Croson and Donohue, 2003; Steckel et al., 2004; Croson andDonohue, 2005, 2006; Croson et al., 2014; Wu and Katok, 2006).These studies show that participants endogenously generate sub-stantial supply chain instability, including amplification in ordervariability from final demand to production, oscillations, and phaselag (the peaks of orders tend to be later as one moves from finaldemand to production); these phenomena are common in manyindustries (e.g., Sterman, 2000; Bray and Mendelson, 2012).
Lee et al. (1997) identify four operational causes of the bull-whip effect, including order batching due to quantity discounts,forward ordering based on price expectations (ordering more whenprices are expected to rise and less when they are expected to fall),shortage gaming induced by horizontal competition as customerscompete for limited supply, and demand forecast uncertainty. Thestandard protocol for the BDG (Sterman, 1989a) eliminates the firstthree. There are no quantity discounts or scale economies, so thereis no incentive for order batching. Prices are fixed and demand isexogenous, so there is no incentive for forward ordering. There areno random shocks and no capacity constraints. Most important inthe context of phantom ordering, each supplier serves only one cus-tomer and each customer orders from only one supplier. Thus thereis no incentive to outcompete others for greater allocations by over-ordering. However, in most prior experiments customer demandwas unknown to the participants and/or nonstationary. In suchsituations, amplification may arise from demand forecast updat-ing. Croson and Donohue (2003, 2006) eliminated this possibilityby informing all participants that demand is drawn from a speci-fied stationary uniform distribution. Amplification and instabilityremained. Still, one might object that although subjects knew thedistribution of demand, the realizations of customer orders wereunknown (ex ante).
CDKS (2014) go further by making demand completely con-stant and known to all participants. They implemented the BDGusing a web-based interface to prevent accounting or measure-ment errors and to control communication among participants.The experiments followed standard protocols in experimental eco-nomics. As in the standard game (Sterman, 1989a), holding costswere $0.50/case/week and backlog costs were $1.00/case/week.
Unlike prior studies, customer demand was constant. Further,this fact was publicly announced, inducing common knowledge
hoarding, I’m just stocking up before the hoarders get here.”. Manage. (2015), http://dx.doi.org/10.1016/j.jom.2015.07.002
among all participants. The realization of customer demand (fourcases/week) was also displayed on each participant’s screen everyperiod, serving as an additional reminder that demand was con-stant. Prior to the start of each session participants took a quiz

ARTICLE ING ModelOPEMAN-916; No. of Pages 16
6 J.D. Sterman, G. Dogan / Journal of Operatio
Ffi
ttdbabdc
oaahtspcfTwaofa
aac
abfpts
rdo
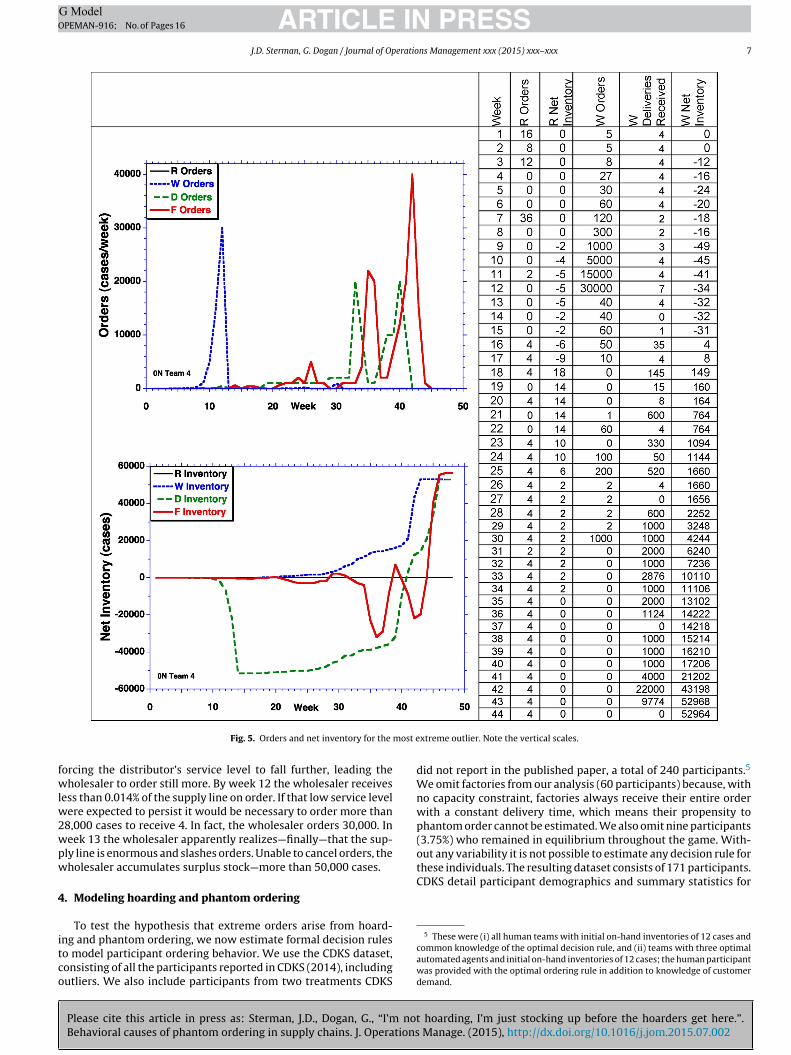
higher orders, causing the distributor’s service level to plummet. Byweek 9 the wholesaler receives less than 0.2% of the supply line onorder with the distributor, and responds by ordering 1000 cases,
3 CDKS examine experimental treatments including (i) publicly providing par-ticipants with the optimal decision rule (inducing common knowledge of optimalstrategy), (ii) replacing all participants but one with automated agents playing theoptimal decision rule (eliminating uncertainty about whether others will play opti-mally), and (iii) providing initial inventory (buffering participants against the riskothers may not behave optimally). Amplification and oscillations in orders andinventories, though moderated by the treatments, remained statistically significantin all conditions. The tendency to ignore the supply line was not moderated by theexperimental treatments.
4 Note that a participant who places a large order could still be rational: opti-mal play given an incoming order of, say, 200 more than the equilibrium rate isto order 200 and then return to the equilibrium order (see note 7). Hence it ispossible that not all of the 22% who ordered 100 c/wk or more at least once devi-ated from rational play. However, CDKS show: (1) more than 70% of participantsspontaneously deviated from the optimal order of 4 c/wk; (2) there is statistically
ig. 4. Typical results with constant customer demand, showing oscillation, ampli-cation, and phase lag.
esting whether they understood the cost structure and rules ofhe game and that demand was constant at four cases/week; playid not commence until all answered correctly. After the session,ut before receiving payment, participants were asked to complete
questionnaire asking them to describe their strategy and theireliefs about their teammates’ strategies. Participants were ran-omly assigned to experimental treatments and roles in the supplyhain. CDKS (2014) provide full documentation.
With constant demand and common knowledge of that fact allperational causes of supply chain instability are eliminated, themplification and oscillations seen in prior experiments should dis-ppear. Furthermore, under these conditions it is never rational tooard or engage in phantom ordering. Participants who order morehan needed to satisfy the known, constant demand would neces-arily induce a backlog upstream, raising costs and lowering theirayoff. CDKS examine a variety of experimental treatments. In allases, they initialize each supply chain in flow equilibrium withour cases in each shipping, production, and order processing stage.herefore, if all participants order four cases/week, inventoriesould remain constant. In the base condition, on-hand inventories
re initialized at the cost-minimizing equilibrium level of zero. Theptimal strategy in that case is clearly for all participants to orderour cases per week throughout, ensuring that inventories remaint the cost-minimizing level of zero at all times.
Nevertheless, nearly all the supply chains exhibit oscillation andmplification (increasing order variability from retailer to factory),nd the bullwhip effect is statistically significant in all treatmentonditions. Fig. 4 shows a typical team.
Two questions must be answered to understand these remark-ble results. First, why do participants first depart from equilibriumy ordering a quantity other than the optimal, equilibrium value ofour cases per week? Second, once the system is perturbed, why doarticipants order in such a way as to cause persistent amplifica-ion and oscillation, rather than returning to equilibrium in a swift,table and cost-minimizing fashion?
Please cite this article in press as: Sterman, J.D., Dogan, G., “I’m noBehavioral causes of phantom ordering in supply chains. J. Operations
CDKS argue that the answer to the first question is coordinationisk. Though all participants have common knowledge of customeremand, some may not believe that their teammates will use theptimal strategy. To buffer themselves against the risk that oth-
PRESSns Management xxx (2015) xxx–xxx
ers will not order optimally, these participants attempt to buildup “coordination stocks” of inventory. Doing so requires that theyorder more than the optimal order quantity of four cases, as seenin Fig. 4, where all but the retailer immediately order more thanfour. Participants’ responses to the post-game questionnaire sug-gest many did not trust their teammates to play optimally andsought to increase their inventories as a hedge against coordinationrisk (see the supplement).
To answer the second question, CDKS estimated the orderingdecision rule first tested in Sterman (1989a). Consistent with thatstudy, they found that most subjects significantly underweightedthe supply line of on-order inventory. Underweighting the sup-ply line causes the system to become underdamped, and oftenlocally unstable, generating oscillations in response to perturba-tions (Mosekilde and Laugesen, 2007; Thomsen et al., 1992; Larsenet al., 1999). Failure to account for the supply line of unfilledorders, and time delays generally, has been observed in a widerange of experimental studies beyond the beer game, includingsingle-person settings with no strategic interactions (Diehl andSterman, 1995), and many other dynamic decision making tasks(Sterman, 1989b; Brehmer, 1992; Kleinmuntz, 1993; Paich andSterman, 1993; Dörner, 1996; Kampmann and Sterman, 2014). Fail-ure to attend to delays and the supply line has also been shownto play important roles in industries from, as Sterman (2000, Ch.20) notes, “aircraft to zinc” (see also Meadows, 1970; Randers andGöluke, 2007; Pierson and Sterman, 2013 for examples). The ten-dency to ignore or underestimate time delays is robust to context,the availability of information about the supply line, incentives andopportunities for learning.3
CDKS also identify a number of outliers who placed very largeorders. Maximum orders were 100 cases/week or more for 22%of the participants in all treatments with humans in each role, anastonishing 25 times greater than the publicly known, constant cus-tomer demand of four cases/week.4 Fig. 5 shows the most extremecase. The key participant is the wholesaler, who orders 30,000 casesin week 12 even though retailer orders average four cases/week andnever exceed 36. The retailer, apparently seeking to build a safetystock, begins by ordering 16 cases, forcing the wholesaler into abacklog. Initially the wholesaler responds modestly to the retailer’sunexpected behavior, increasing orders to 8 cases in week 3. Butthe wholesaler soon finds that the distributor is not able to deliverat that rate: production has not yet increased, so deliveries con-tinue at 4 cases/week. Worse, the distributor actually cuts orders,so in week 7 the wholesaler unexpectedly receives only 2 cases.The wholesaler responds to the drop in supplier deliveries with still
t hoarding, I’m just stocking up before the hoarders get here.”. Manage. (2015), http://dx.doi.org/10.1016/j.jom.2015.07.002
significant order amplification, which is suboptimal; and (3) the vast majority ofparticipants underweight the supply line, leading to suboptimal over-accumulationof inventory and oscillations. Note also that CDKS show that their results, includingsupply-line underweighting, hold with outliers included or excluded.
ARTICLE IN PRESSG ModelOPEMAN-916; No. of Pages 16
J.D. Sterman, G. Dogan / Journal of Operations Management xxx (2015) xxx–xxx 7
most e
fwlw2wpw
4
itco
out any variability it is not possible to estimate any decision rule forthese individuals. The resulting dataset consists of 171 participants.CDKS detail participant demographics and summary statistics for
Fig. 5. Orders and net inventory for the
orcing the distributor’s service level to fall further, leading theholesaler to order still more. By week 12 the wholesaler receives
ess than 0.014% of the supply line on order. If that low service levelere expected to persist it would be necessary to order more than
8,000 cases to receive 4. In fact, the wholesaler orders 30,000. Ineek 13 the wholesaler apparently realizes—finally—that the sup-
ly line is enormous and slashes orders. Unable to cancel orders, theholesaler accumulates surplus stock—more than 50,000 cases.
. Modeling hoarding and phantom ordering
To test the hypothesis that extreme orders arise from hoard-
Please cite this article in press as: Sterman, J.D., Dogan, G., “I’m notBehavioral causes of phantom ordering in supply chains. J. Operations
ng and phantom ordering, we now estimate formal decision ruleso model participant ordering behavior. We use the CDKS dataset,onsisting of all the participants reported in CDKS (2014), includingutliers. We also include participants from two treatments CDKS
xtreme outlier. Note the vertical scales.
did not report in the published paper, a total of 240 participants.5
We omit factories from our analysis (60 participants) because, withno capacity constraint, factories always receive their entire orderwith a constant delivery time, which means their propensity tophantom order cannot be estimated. We also omit nine participants(3.75%) who remained in equilibrium throughout the game. With-
hoarding, I’m just stocking up before the hoarders get here.”. Manage. (2015), http://dx.doi.org/10.1016/j.jom.2015.07.002
5 These were (i) all human teams with initial on-hand inventories of 12 cases andcommon knowledge of the optimal decision rule, and (ii) teams with three optimalautomated agents and initial on-hand inventories of 12 cases; the human participantwas provided with the optimal ordering rule in addition to knowledge of customerdemand.

ING ModelO
8 eratio
ta
uaattaa(m
O
upsuoadct(t
D
D
wa oo
b
A
wpb
A
wp
O
s
O
watSi
tbDitd
stocks.Most of the estimated parameters are far from optimal. The
median estimate of is 0.21, and the estimates of are statis-
7
ARTICLEPEMAN-916; No. of Pages 16
J.D. Sterman, G. Dogan / Journal of Op
he participants they report; the supplement to this paper containsll the models and data needed to replicate our analysis.
We begin with the decision rule used by Sterman (1989a) andsed in subsequent research. The rule is based on the anchoring anddjustment heuristic (Tversky and Kahneman, 1974). Participantsre assumed to anchor on the quantity they expect their customero order from them (De, expected demand), then adjust this quan-ity so as to (1) reduce the discrepancy between the desired andctual stock (the stock adjustment, AS) and (2) reduce the discrep-ncy between the desired and actual supply line of goods on orderthe supply line adjustment ASL). Since cancellations are not per-
itted, orders must be nonnegative:
t = max(
0,Det + ASt + ASL
t
)(1)
Sterman (1989a) and CDKS (2014) modeled expected demandsing exponential smoothing. In the CDKS experiment, however,articipants are publicly informed that customer orders are con-tant at four cases/week at all times. Some participants appeared tose their common knowledge of customer demand in placing theirrders while others adjusted their estimates of incoming demands it varied. To capture these possibilities, we formulate expectedemand as a weighted average of the commonly known constantustomer demand, Dc , and the participant’s belief about the ordershey expect to receive from their customer, Dp, which, as in Sterman1989a), is formed by exponential smoothing of the orders the par-icipant actually receives, D:
et = Dc + (1 − )Dpt (2)
pt = �Dt−1 + (1 − �)Dpt−1 (3)
here is the sensitivity of expected demand to customer ordersnd � is the smoothing parameter on actual incoming orders. If
= 1, De always equals the commonly known constant customerrder rate of four cases/week. Values 0 ≤ < 1 mean expectedrders respond to some extent to smoothed incoming orders.6
The stock adjustment is assumed to be linear in the discrepancyetween desired inventory, S∗, and net inventory, S:
St = ˛S (S∗
t − St) (4)
here �S is the fraction of the inventory discrepancy ordered eacheriod. The supply line adjustment is also linear in the discrepancyetween the desired supply line, SL∗, and the actual supply line, SL:
SLt = ˛SL (SL∗t − SLt) (5)
here �SL is the fraction of supply line discrepancy ordered eacheriod. Combining terms:
t = max(0, Det + ˛S(S∗t − St) + ˛SL(SL
∗t − SLt)) (6)
To estimate the parameters, Sterman (1989a) defines ̌ = ˛SL/˛S,o estimated orders, Ot , become
t = max(0,Det + ˛S((S∗t − St) + ˇ(SL∗t − SLt))) (7)
here ̌ is the fraction of the supply line the participant takes intoccount, 0 ≤ ̌ ≤ 1. Sterman (1989a) and CDKS further assume that
Please cite this article in press as: Sterman, J.D., Dogan, G., “I’m noBehavioral causes of phantom ordering in supply chains. J. Operations
he desired stock and desired supply line are constant. In this case∗ and SL∗ cannot be independently estimated. However, defin-ng effective total desired on-hand and on-order stock S’ = S∗ + ˇSL∗,
6 In Sterman (1989a) customer orders were nonstationary and unknown to par-icipants. In that case forming De by exponential smoothing of incoming orders isehaviorally plausible and, under reasonable conditions, optimal. However, whenc is constant and that is common knowledge, the optimal forecast is always Dc even
f D /= Dc (see note 7), so the optimal value of = 1. Eqs. (2)–(3) allow us to cap-ure the extent to which participants used their common knowledge that customeremand is constant. Note that � cannot be estimated if = 1.
PRESSns Management xxx (2015) xxx–xxx
and assuming an additive error term, the system to be estimated,denoted Model 0, becomes:
Ot = max(
0,Det + ˛S(S′ − St − ˇSLt
)+ �t
)
Det = Dc + (1 − )Dpt
Dpt = �Dt−1 + (1 − �)Dpt−1
subject to 0 ≤ , �, ˛S, ̌ ≤ 1; 0 ≤ S′
(8)
The optimal parameters are readily determined. In CDKS allparticipants have common knowledge that customer demand isconstant and that there are no random events. Participants shouldexpect incoming orders will equal the known, constant customerorder rate of four cases/week. Therefore, = 1 (and � is irrelevant).7
Similarly, with common knowledge of constant customer demand,no stochastic effects and the assumption of rational behavior, thereis no need for any safety stocks, so S∗ = 0. The optimal supply line,SL∗, is readily determined. By Little’s Law, a participant who seeksto receive goods at the rate of R∗ cases/week must maintain, inequilibrium, a supply line equal to
SL∗ = �eR∗ (9)
where �e is the expected lag in receiving orders. Since customerdemand is constant and that fact is common knowledge, the equi-librium rate at which each participant seeks to receive deliveriesfrom their supplier R∗ = 4 cases/week. In the BDG, the normal, equi-librium delivery lag, �∗, is 3 weeks for the factory and 4 weeksfor all others. Hence, given the common knowledge and assumingoptimal play (and hence that �e = �∗), SL∗ = 12 cases for factoriesand 16 for all others. The optimal value of ̌ is one: participantsshould fully account for the supply line of orders placed but notyet received (Sterman, 1989a). The optimal value of ˛S is also one:since there are no adjustment costs, participants should strive toeliminate any inventory shortfall or surplus as quickly as possibleso as to minimize holding and backlog costs.
The optimal decision rule, with constant expected demand and˛S = ̌ = 1, reduces to the familiar order-up-to rule in which partic-ipants order, each period, the entire shortfall between desired andactual inventory, where actual inventory includes both on-handand on-order stocks (Clark and Scarf, 1960). If inventories differfrom the optimal value, rational agents will alter their orders tem-porarily until sufficient orders to correct any inventory discrepancyare in the supply line, then return to the equilibrium order quantity.There would be no oscillation.
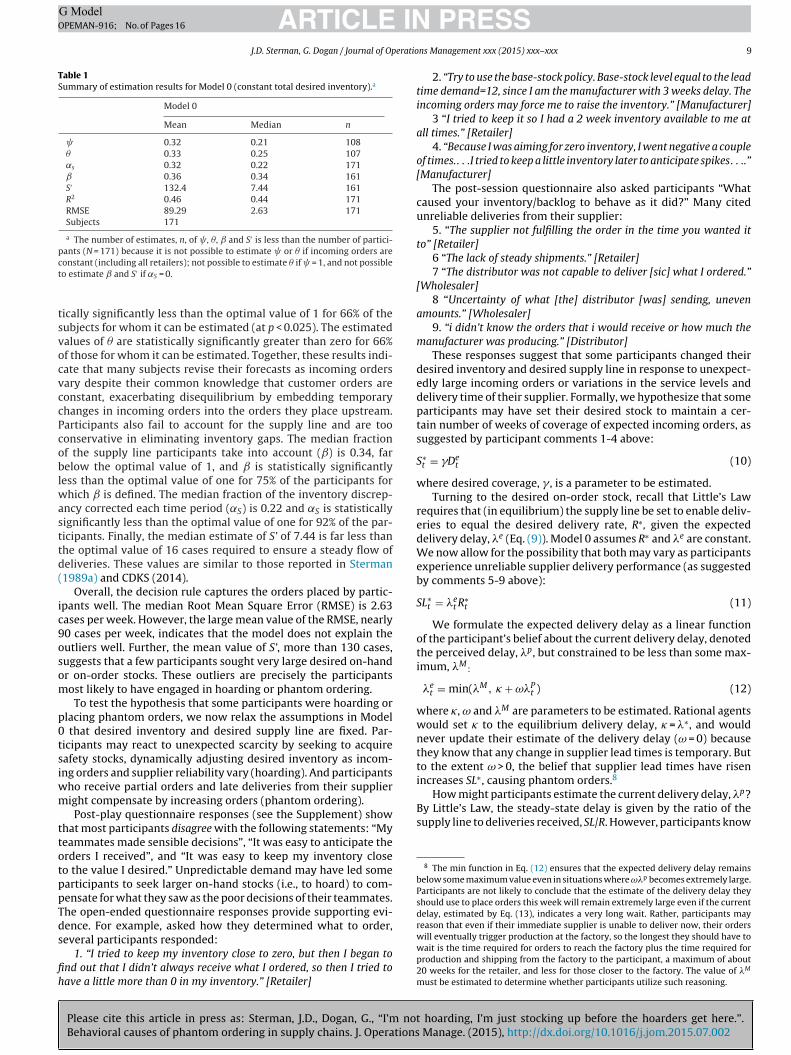
Following CDKS we use nonlinear least squares to estimate thedecision rule in Eq. (8), denoted Model 0, and bootstrapping to esti-mate the confidence intervals for each parameter (the supplementprovides details). Table 1 shows the mean and median estimates forModel 0, which assumes constant desired on-hand and on-order
t hoarding, I’m just stocking up before the hoarders get here.”. Manage. (2015), http://dx.doi.org/10.1016/j.jom.2015.07.002
Note that participant knowledge that customer demand is constant means theoptimal value of = 1 for all players, even if the upstream players receive out-of-equilibrium orders. An upstream player receiving a large order would experiencea backlog and then, through the stock adjustment term, order exactly enough torestore net inventory to the optimal level. Orders would then return to the equi-librium level. Given knowledge that Dc is constant, any value of De /= Dc wouldperpetuate disequilibrium by causing future orders to differ from Dc even afterorders sufficient to correct any inventory shortfall have been placed. Similarly, inseveral treatments CDKS initialize the supply chain out of equilibrium by endowingparticipants with positive initial on-hand inventory. Participants should then orderless than 4 cases/week through the stock adjustment term until their inventoryreturns to the optimal level. Rational upstream players would recognize that anychange in incoming orders was temporary, and would hold their demand forecastconstant at the equilibrium value of 4 cases/week.
ARTICLE ING ModelOPEMAN-916; No. of Pages 16
J.D. Sterman, G. Dogan / Journal of Operatio
Table 1Summary of estimation results for Model 0 (constant total desired inventory).a
Model 0
Mean Median n
0.32 0.21 108� 0.33 0.25 107˛s 0.32 0.22 171ˇ 0.36 0.34 161S′ 132.4 7.44 161R2 0.46 0.44 171RMSE 89.29 2.63 171Subjects 171
a The number of estimates, n, of , �, ̌ and S′ is less than the number of partici-pants (N = 171) because it is not possible to estimate or � if incoming orders arect
tsvocvccPcoblwasttd(
ic9osom
p0tsiwm
ttotppTds
fih
increases SL , causing phantom orders.How might participants estimate the current delivery delay, �p?
By Little’s Law, the steady-state delay is given by the ratio of thesupply line to deliveries received, SL/R. However, participants know
8 The min function in Eq. (12) ensures that the expected delivery delay remainsbelow some maximum value even in situations where ω�p becomes extremely large.Participants are not likely to conclude that the estimate of the delivery delay theyshould use to place orders this week will remain extremely large even if the currentdelay, estimated by Eq. (13), indicates a very long wait. Rather, participants mayreason that even if their immediate supplier is unable to deliver now, their orderswill eventually trigger production at the factory, so the longest they should have to
onstant (including all retailers); not possible to estimate � if = 1, and not possibleo estimate ̌ and S′ if ˛S = 0.
ically significantly less than the optimal value of 1 for 66% of theubjects for whom it can be estimated (at p < 0.025). The estimatedalues of � are statistically significantly greater than zero for 66%f those for whom it can be estimated. Together, these results indi-ate that many subjects revise their forecasts as incoming ordersary despite their common knowledge that customer orders areonstant, exacerbating disequilibrium by embedding temporaryhanges in incoming orders into the orders they place upstream.articipants also fail to account for the supply line and are tooonservative in eliminating inventory gaps. The median fractionf the supply line participants take into account (ˇ) is 0.34, farelow the optimal value of 1, and ̌ is statistically significantly
ess than the optimal value of one for 75% of the participants forhich ̌ is defined. The median fraction of the inventory discrep-
ncy corrected each time period (˛S) is 0.22 and ˛S is statisticallyignificantly less than the optimal value of one for 92% of the par-icipants. Finally, the median estimate of S’ of 7.44 is far less thanhe optimal value of 16 cases required to ensure a steady flow ofeliveries. These values are similar to those reported in Sterman1989a) and CDKS (2014).
Overall, the decision rule captures the orders placed by partic-pants well. The median Root Mean Square Error (RMSE) is 2.63ases per week. However, the large mean value of the RMSE, nearly0 cases per week, indicates that the model does not explain theutliers well. Further, the mean value of S’, more than 130 cases,uggests that a few participants sought very large desired on-handr on-order stocks. These outliers are precisely the participantsost likely to have engaged in hoarding or phantom ordering.
To test the hypothesis that some participants were hoarding orlacing phantom orders, we now relax the assumptions in Model
that desired inventory and desired supply line are fixed. Par-icipants may react to unexpected scarcity by seeking to acquireafety stocks, dynamically adjusting desired inventory as incom-ng orders and supplier reliability vary (hoarding). And participants
ho receive partial orders and late deliveries from their supplieright compensate by increasing orders (phantom ordering).
Post-play questionnaire responses (see the Supplement) showhat most participants disagree with the following statements: “Myeammates made sensible decisions”, “It was easy to anticipate therders I received”, and “It was easy to keep my inventory closeo the value I desired.” Unpredictable demand may have led somearticipants to seek larger on-hand stocks (i.e., to hoard) to com-ensate for what they saw as the poor decisions of their teammates.he open-ended questionnaire responses provide supporting evi-ence. For example, asked how they determined what to order,everal participants responded:
Please cite this article in press as: Sterman, J.D., Dogan, G., “I’m notBehavioral causes of phantom ordering in supply chains. J. Operations
1. “I tried to keep my inventory close to zero, but then I began tond out that I didn’t always receive what I ordered, so then I tried toave a little more than 0 in my inventory.” [Retailer]
PRESSns Management xxx (2015) xxx–xxx 9
2. “Try to use the base-stock policy. Base-stock level equal to the leadtime demand=12, since I am the manufacturer with 3 weeks delay. Theincoming orders may force me to raise the inventory.” [Manufacturer]
3 “I tried to keep it so I had a 2 week inventory available to me atall times.” [Retailer]
4. “Because I was aiming for zero inventory, I went negative a coupleof times.. . .I tried to keep a little inventory later to anticipate spikes. . ..”[Manufacturer]
The post-session questionnaire also asked participants “Whatcaused your inventory/backlog to behave as it did?” Many citedunreliable deliveries from their supplier:
5. “The supplier not fulfilling the order in the time you wanted itto” [Retailer]
6 “The lack of steady shipments.” [Retailer]7 “The distributor was not capable to deliver [sic] what I ordered.”
[Wholesaler]8 “Uncertainty of what [the] distributor [was] sending, uneven
amounts.” [Wholesaler]9. “i didn’t know the orders that i would receive or how much the
manufacturer was producing.” [Distributor]These responses suggest that some participants changed their
desired inventory and desired supply line in response to unexpect-edly large incoming orders or variations in the service levels anddelivery time of their supplier. Formally, we hypothesize that someparticipants may have set their desired stock to maintain a cer-tain number of weeks of coverage of expected incoming orders, assuggested by participant comments 1-4 above:
S∗t = �Det (10)
where desired coverage, � , is a parameter to be estimated.Turning to the desired on-order stock, recall that Little’s Law
requires that (in equilibrium) the supply line be set to enable deliv-eries to equal the desired delivery rate, R∗, given the expecteddelivery delay, �e (Eq. (9)). Model 0 assumes R∗ and �e are constant.We now allow for the possibility that both may vary as participantsexperience unreliable supplier delivery performance (as suggestedby comments 5-9 above):
SL∗t = �et R∗t (11)
We formulate the expected delivery delay as a linear functionof the participant’s belief about the current delivery delay, denotedthe perceived delay, �p, but constrained to be less than some max-imum, �M :
�et = min(�M, � + ω�Pt ) (12)
where �, ω and �M are parameters to be estimated. Rational agentswould set � to the equilibrium delivery delay, � = �∗, and wouldnever update their estimate of the delivery delay (ω = 0) becausethey know that any change in supplier lead times is temporary. Butto the extent ω > 0, the belief that supplier lead times have risen
∗ 8
hoarding, I’m just stocking up before the hoarders get here.”. Manage. (2015), http://dx.doi.org/10.1016/j.jom.2015.07.002
wait is the time required for orders to reach the factory plus the time required forproduction and shipping from the factory to the participant, a maximum of about20 weeks for the retailer, and less for those closer to the factory. The value of �M
must be estimated to determine whether participants utilize such reasoning.

ARTICLE IN PRESSG ModelOPEMAN-916; No. of Pages 16
10 J.D. Sterman, G. Dogan / Journal of Operations Management xxx (2015) xxx–xxx
Table 2Best-fit decision rules among alternative models.a
1 2 3 4
Model 1 bestSubjects: 62 (36.3%)
Model 2 bestSubjects: 57 (33.3%)
Model 1 or model 2 bestSubjects: 119 (69.6%)
Model 0Subjects: 119 (69.6%)
Mean Median n Mean Median n Mean Median n Mean Median n
0.61 0.71 42 0.43 0.26 37 0.52 0.50 79 0.31 0.18 79� 0.38 0.27 34 0.36 0.28 31 0.37 0.28 65 0.32 0.25 79�s 0.33 0.22 62 0.23 0.19 57 0.28 0.20 119 0.34 0.23 119ˇ 0.22 0.07 60 0.11 0.02 57 0.17 0.04 117 0.27 0.26 116S′ NA NA NA NA NA NA 101.4 8.40 116� 3.64 0.67 60 6.54 0.10 57 5.05 0.43 117 NA NA� 21.98 21.34 60 21.48 18.84 57 21.74 19.08 117 NA NAω 2.53 1.20 60 3.86 3.49 57 3.18 1.94 117 NA NA�M 621 150 6 1,078 48 8 882 77 14 NA NAR2 0.57 0.57 62 0.53 0.55 57 0.55 0.55 119 0.53 0.52 119RMSE 24.55 2.32 62 85.34 2.78 57 53.67 2.61 119 87.9 2.72 119%� vs. M0 −72.1% −14.9% −2.9% 2.2% −38.9% −4.3%
a The number of estimates, n, of , �, ˇ, � , �, and ω is less than the number of participants for whom the alternative models fit better than Model 0 (N = 119) because it isn rs); noA um av value
t�purmd
�
dftto
M
gi
M
wi
Smbataas
aoastp0
i(
ot possible to estimate or � if incoming orders are constant (including all retailedditionally, for most participants, the best fit is achieved with values of the maximalue of the actual delivery delay, �P , indicating that the constraint on the allowed
hat the delivery delay can never be less than the normal value*, even if the supply line falls to zero (which can occur if thearticipant orders zero for a sufficiently long period, a common sit-ation resulting from excess inventory). Similarly, participants mayeceive nothing from their supplier, but we assume that their esti-
ate of the delivery delay remains finite by constraining expectedeliveries to the maximum of actual deliveries, Rt , and 1 case/week:
Pt = max(�∗,SLt/ max(Rt,1)) (13)
The questionnaire responses do not reveal how participantsetermine R∗, the desired rate at which they seek to receive goods
rom their supplier. Following Sterman (2000, Ch. 17), we considerwo alternatives. In the first, denoted Model 1, participants seeko receive goods at the rate they expect their customers will placerders:
odel 1 : R∗t = Det (14a)
In the second, denoted Model 2, participants desire to receiveoods at the rate needed to fill expected customer orders and elim-nate any inventory gap they have:
odel 2 : R∗t = max
(0, Det + ˛S
(S∗ − S
))(14b)
here the max function ensures that R∗ remains nonnegative evenf there is surplus inventory.
To summarize, prior studies (Sterman, 1989a; Diehl andterman, 1995; Croson and Donohue, 2006; CDKS, 2014) esti-ate decision rules that rule out hoarding and phantom ordering
ecause desired on-hand and on-order inventories are constant byssumption. We relax these restrictive assumptions to allow forhe possibility of hoarding (increases in desired on-hand inventory)nd phantom orders (increases in desired on-order inventory), bothrising endogenously in response to demand variations or poorupplier delivery performance.
For the desired on-hand stock, we assume participants seek constant desired coverage of expected orders. For the desiredn-order stock, �eR∗, we consider two possibilities for the desiredcquisition rate, R∗. We estimate both alternative models for eachubject by nonlinear least squares, using bootstrapping to estimatehe confidence intervals. We define the best model for each partici-ant to be the model that provides the lowest RMSE among Models
Please cite this article in press as: Sterman, J.D., Dogan, G., “I’m noBehavioral causes of phantom ordering in supply chains. J. Operations
–2.Table 2 summarizes the results. The models allowing hoard-
ng and phantom ordering have lower RMSE than Model 0 for 11969.6%) of the participants. Model 1, in which R∗ = De, fits best for
t possible to estimate � if = 1, and not possible to estimate ˇ, � , �, and ω if ˛S = 0.llowed value of the perceived delivery delay, �M (Eq. (12)), that exceed the largestof the perceived delivery delay is not binding.
62 (36.3%) of the participants, and Model 2, in which R∗ = max(0,De + �S(S∗ − S)), fits best for 57 (33.3%). Compared to Model 0, thebest alternative model lowers the median RMSE modestly (4.3%),but cuts the mean RMSE by 39%: the alternative models providethe greatest improvement for the outliers—those for whom Model0 offers the least explanatory power.
Fig. 6 shows the distributions of the estimated parameters cap-turing hoarding and phantom ordering (� and ω) for the 119participants for whom Model 1 or 2 is best. Most do not seek largesafety stocks, indicating little hoarding, with � < 0.5 weeks for 51.3%of these participants. However, the distribution has a long tail (notethe log2 scale for �). Nearly one-quarter, 23.9%, seek more than twoweeks of coverage, and 7.7% seek more than 16 weeks of coverage.The parameter ω indicates the extent of lead-time updating in theformulation for the desired supply line. If ω ≈ 0, participants arenot sensitive to the current delivery delay, indicating little or nopropensity to place phantom orders. If ω ≈ 1, participants adjustthe desired supply line in proportion to the current delivery delay,inducing phantom orders as supplier service levels drop. Values ofω > 1 indicate even more aggressive phantom ordering—such par-ticipants order even more than the current delivery delay wouldindicate. The distribution of ω also shows a long tail. Among thosefor whom Model 1 or 2 is best, ω < 0.5 for 31.6%. However, ω ≥ 1for 65.8% of participants, and ω ≥ 5 for nearly one-quarter (24.8%).These participants aggressively update their lead time estimatesas supplier service levels fall, triggering large phantom orders thatfurther increase the delivery delay they experience. There is littleevidence that participants limited their estimates of the expecteddelivery delay. Eq. (12) constrains the expected delivery delay to amaximum value, �M , potentially preventing extremely large phan-tom orders by capping the expected delivery delay even if the actualdelay becomes very large. Although the maximum delivery delayexperienced by the participants varies substantially, with a mean(median) of 651 (30) weeks, �M is a binding constraint for only11.8% of the participants for whom model 1 or 2 is best.
Estimation results suggest roughly 70% of the participantsengaged in hoarding or phantom ordering to some degree, as deter-mined by the model yielding the lowest RMSE. A more stringenttest, however, counts only those subjects whose estimated valuesof � or ω are statistically significantly greater than the optimal val-
t hoarding, I’m just stocking up before the hoarders get here.”. Manage. (2015), http://dx.doi.org/10.1016/j.jom.2015.07.002
ues of zero. We find � is statistically significantly greater than theoptimal value of zero at p < 0.025 for 27 individuals (15.8% of all171 participants). We denote these individuals the hoarders. Wefind ω is statistically significantly greater than the optimal value of

ARTICLE IN PRESSG ModelOPEMAN-916; No. of Pages 16
J.D. Sterman, G. Dogan / Journal of Operations Management xxx (2015) xxx–xxx 11
arding
zpeaa
siaidpip8
ttmpsT(
A
(
A
Sy
A
Ug
A
Wpadto
Fig. 6. Distribution of estimated parameters indicating ho
ero for 45 individuals (26.3% of all participants). We denote thesearticipants the phantom orderers. A total of 61 individuals wereither hoarding or phantom ordering (35.7% of all participants), and
total of 11 individuals (6.4% of all participants) were both hoardingnd placing phantom orders.
Fig. 7 compares the actual and best-fit ordering decisions foreveral of the outlier participants. The examples shown includenstances for which both Models 1 and 2 provide the best fit. Thelternative models explain the most extreme participants well,ncluding the wholesaler who ordered 30,000 cases in a single weekespite the fact that incoming orders never exceeded 36 (partici-ant 174; see Fig. 5). That participant does not appear to engage
n hoarding (� = 0), but is extremely sensitive to supplier deliveryerformance (ω = 4.22; �M = 3075). Model 1 reduces the RMSE by3.3% compared to Model 0.
The estimation results support the qualitative analysis in sec-ion 4: as the supplier delivered a smaller and smaller fraction ofhe wholesaler’s orders, the wholesaler compensated by ordering
ore and more. The results illustrate how the positive feedback ofhantom ordering (Fig. 2) can dominate the negative feedbacks thathould limit orders and keep inventory close to the optimal level.he supply line adjustment term in the ordering decision rule (Eq.7)) is
SLt = ˛SL (SL∗t − SLt) = ˛Sˇ (SL∗t − SLt) (15)
In models 1 and 2, the desired supply line is SL*t = �e
tR*t (Eq.
11)), yielding
SLt = ˛Sˇ
(�et R
∗t − SLt
). (16)
ubstituting the formulation for �e (Eq. (12)) into this expressionields
SLt = ˛Sˇ
(min
(�M, � + ω�Pt
)R∗t − SLt
). (17)
sing the formulation for the perceived delivery delay, �P (Eq. (13)),ives
SLt = ˛Sˇ
(min
(�M, � + ωmax
(�∗,SLt/max (Rt,1)
))R∗t − SLt
).(18)
e can gain intuition into the formulation by recognizing thathantom ordering is likely to arise during periods when suppliers
Please cite this article in press as: Sterman, J.D., Dogan, G., “I’m notBehavioral causes of phantom ordering in supply chains. J. Operations
re not able to deliver fully, which means the perceived deliveryelay (Eq. (13)) will exceed the normal delay, �∗. Assuming furtherhat (i) Rt ≥ 1, which is true initially and should be true during peri-ds of high demand, and (ii) the maximum delivery delay, �M , is not
(�) and phantom ordering (ω). Note the log2 scale for � .
a binding constraint, which estimation results show is true for thelarge majority of cases, the supply line adjustment becomes:
ASLt = ˛Sˇ((� + ω
(SLt/Rt
))R∗t − SLt
)(19)
Collecting terms,
ASLt = ˛Sˇ(� + SLt
(ω(R∗
t /Rt) − 1))
(20)
In the original decision rule with constant SL∗ (Eq. (8)), theactual supply line SL always enters ASL and therefore orders witha negative sign: the larger SL, the smaller orders will be, reflectingthe negative (balancing) Supply Line Control feedback (loop B2 inFig. 2). However, as seen in Eq. (20), when the desired supply lineresponds to supplier performance, the net effect of the supply lineadjustment on orders can be positive or negative. Specifically,
ω(R∗t /Rt ) < 1 ⇒ ∂ASL/∂SL < 0 ⇒ ∂O/∂SL < 0 ⇒ net negative feedback;
ω(R∗t /Rt ) > 1 ⇒ ∂ASL/∂SL > 0 ⇒ ∂O/∂SL > 0 ⇒ net positive feedback.
(21)
If ω(R∗/R) > 1, the larger the supply line, the larger orders will be,further increasing the supply line. In that case, the positive PhantomOrdering feedback (R1 in Fig. 2) dominates the negative Supply LineControl loop, leading to runaway growth in orders—until deliveriesrise enough relative to desired deliveries for ω(R∗/R) to fall below1 or the maximum expected delivery delay �M becomes a bindingconstraint. The larger the value of ω, the smaller the increase inR∗/R required to cross the tipping threshold where the system shiftsfrom net negative to net positive feedback.
Starting from the initial equilibrium, R∗ will exceed R if incomingorders rise, causing an increase in expected orders De, or (in Model2) causing an inventory shortfall even if De remains constant (Eq.(14b)). R∗ can also exceed R if the supplier’s deliveries fall.
The estimated parameters for participant 174 are = 1 (making� irrelevant), ˛S = 0.90, ̌ = 1, � = 0, � = 0.01, ω = 4.22, and �M = 3075.Because = 1 the increase in incoming orders participant 174receives from the retailer (peaking at 36 cases/week; Fig. 5) is notpassed into expected demand. Desired inventory coverage � = 0:the participant sets S∗ to the optimal value of zero and there isno evidence of hoarding. Since Model 1 is best for this subject,R∗ = De, and given = 1, simulated R∗ never varies from the opti-mal value of 4 cases/week. However, the distributor cuts ordersfrom 4 to 2 cases/week, causing deliveries to the wholesaler to fallbeginning in week 7 (Fig. 5). Poor supplier delivery performancecauses the simulated ratio R∗/R to rise above one. Participant 174
hoarding, I’m just stocking up before the hoarders get here.”. Manage. (2015), http://dx.doi.org/10.1016/j.jom.2015.07.002
reacts to the unexpected drop in supplier deliveries by increasingSL∗. With ω = 4.22, even small increases in R∗/R lead to net posi-tive feedback. Further, since this participant fully accounts for thesupply line ( ̌ = 1) and orders nearly the entire inventory shortfall

ARTICLE IN PRESSG ModelOPEMAN-916; No. of Pages 16
12 J.D. Sterman, G. Dogan / Journal of Operations Management xxx (2015) xxx–xxx
F ignific* pant n[
ell�fgpeci
7p
ohdo
ig. 7. Estimated and actual orders for typical participants exhibiting statistically sVertical scales differ. Best model compared to Model 0. The letter after the particiW], or Distributor [D]). �RMSE = % change in RMSE compared to Model 0.
ach period (˛S = 0.90) the gain of the positive phantom orderingoop, ˛Sˇω((R∗/R) − 1), is extremely high. Orders and the supplyine grow exponentially until the cap on expected delivery delay,M , is reached (week 12), breaking the positive phantom ordering
eedback. The actual supply line then surpasses the inflated tar-et, and in week 13 orders collapse. The estimated parameters forarticipant 174 suggest that the unexpected drop in supplier deliv-ry performance, not the rise in incoming orders from the retailer,aused the huge surge in orders as the wholesaler became caughtn the positive phantom ordering feedback.
. Dispositional or situational causes of hoarding andhantom ordering?
Why do some participants hoard or place phantom orders while
Please cite this article in press as: Sterman, J.D., Dogan, G., “I’m noBehavioral causes of phantom ordering in supply chains. J. Operations
thers do not? One possibility is that certain individuals have aigh propensity to hoard or place phantom orders, while otherso not; under this dispositional hypothesis hoarding and phantomrdering are attributes of individuals. In terms of the models esti-
ant hoarding or phantom ordering.umber denotes the participant’s role in the supply chain (Retailer [R], Wholesaler
mated above, desired inventory coverage, � , indicative of hoarding,and the sensitivity of orders to perceived delivery delay, ω, whichindicates phantom ordering, would be distributed randomly amongparticipants based on their individual propensity to engage in thesebehaviors (though those prone to hoarding may also be prone tophantom ordering, so the estimates of � and ω might be positivelycorrelated).
Alternatively, everyone may be susceptible to hoarding andphantom ordering to some degree, with these behaviors triggeredby stressors in the situation such as unexpected demand spikes ordelivery problems. Under this situational hypothesis the incidence ofhoarding and phantom ordering will not be randomly distributed;rather, participants who experienced stressors such as large unex-pected demand surges or poor supplier performance will be muchmore likely to engage in hoarding or place phantom orders. For-
t hoarding, I’m just stocking up before the hoarders get here.”. Manage. (2015), http://dx.doi.org/10.1016/j.jom.2015.07.002
mally, we seek to assessHD, the Dispositional hypothesis: Hoarding and phantom order-
ing are attributes of individuals, not the situation in whichindividuals find themselves. Specifically,

ING ModelO
eratio
its
oti
a
ilm
teivr
ichMmwtMapii
(ocdtdiizHu
stiluscib
atiosi
pb
ARTICLEPEMAN-916; No. of Pages 16
J.D. Sterman, G. Dogan / Journal of Op
(i) Hoarding (as indicated by the estimated values of desirednventory coverage, �) will be randomly distributed among par-icipants, and uncorrelated with variability in incoming orders orupplier delivery performance.
(ii) Phantom ordering (as indicated by the estimated valuesf the sensitivity to supplier deliveries, ω) will be randomly dis-ributed among participants, and uncorrelated with variability inncoming orders or supplier delivery performance.
HS, the Situational hypothesis: Hoarding and phantom orderingre triggered by stressors in the situation. Specifically,
(i) Hoarding (as indicated by the estimated values of desirednventory coverage, �) is more likely when participants experiencearge surges in incoming orders or poor supplier delivery perfor-
ance (because either can cause costly backlogs).(ii) Phantom ordering (as indicated by the estimated sensitivity
o supplier deliveries, ω) is more likely when participants experi-nce poor supplier delivery performance, but not large surges inncoming orders (because large inventories are not needed despiteariability in incoming orders if suppliers can deliver quickly andeliably).
Among participants exhibiting statistically significant hoard-ng, the mean of the standard deviation of incoming orders is 227ases/week compared to a mean of 23 cases/week for the non-oarders, a highly statistically significant difference (two-tailedann-Whitney test, U = 956, z = 4.185, p = 0.000014). Similarly, theaximum delivery delay each hoarder experienced averaged 1765eeks compared to a mean of 442 weeks for the non-hoarders;
he difference is also highly statistically significant (two-tailedann–Whitney test, U = 730, z = 5.143, p = 1.36 × 10⁻⁷). The results
re consistent with the Situational Hypothesis HS (i), while the Dis-ositional hypothesis HD (i) is strongly rejected: Hoarding behavior
s strongly associated with either unexpectedly large jumps inncoming orders or unexpectedly large delays in supplier deliveries.
Turning to phantom ordering, theory, beginning with Mitchell1923), posits that firms will order more than they desire and placerders with multiple suppliers when they believe their suppliersannot deliver fully or on time. In contrast, as long as suppliers caneliver quickly and reliably, there is no motivation to place phan-om orders even if incoming orders vary. The maximum deliveryelay experienced by the phantom orderers is statistically signif-
cantly larger than that experienced by those who did not engagen phantom ordering (two-tailed Mann-Whitney test, U = 1723,
= 3.897, p = 0.0001). The results are consistent with HS (ii), whileD (ii) is rejected: Phantom ordering is strongly associated withnexpectedly large increases in supplier delivery delay.9
The evidence supports the hypothesis that situational factorstrongly affect whether participants engaged in hoarding or phan-om ordering. Those who experienced unexpected variability inncoming orders or delays in deliveries from suppliers were moreikely to hoard than those who did not. Those who experiencednexpected problems in receiving what they ordered from theirupplier were more likely to place phantom orders. The results areonsistent with a large role for situational factors as triggers for the
Please cite this article in press as: Sterman, J.D., Dogan, G., “I’m notBehavioral causes of phantom ordering in supply chains. J. Operations
rrational hoarding and phantom ordering observed in participantehavior.10
9 Both HD (ii) and HS (ii) predict that the incidence of phantom ordering will not bessociated with variability in incoming orders, though for different reasons. In fact,he standard deviation of incoming orders experienced by the phantom ordererss not statistically significantly different from that experienced by non-phantomrderers (two-tailed Mann-Whitney test, U = 2697, z = 0.484, p = 0.63). Variability inupplier reliability is associated with phantom ordering, but unexpected increasesn incoming orders per se are not.10 Because there are feedbacks among S* , SL∗ , orders and delivery delay (Fig. 2), it isossible that the association of hoarding with large peak delivery delays arises notecause high delivery delays tend to trigger hoarding, but because the large orders
PRESSns Management xxx (2015) xxx–xxx 13
8. Discussion, limitations and conclusions
Hoarding and phantom ordering contribute to supply chaininstability and inefficiency yet remain common in many industriesand markets. Hoarding and phantom ordering can be rational forindividuals (Lee et al., 1997; Cachon and Lariviere, 1999; Armonyand Plambeck, 2005), though costly and destabilizing for the econ-omy and society. Although hoarding and phantom ordering canresult from the rational behavior of strategic agents, prior research,extending back at least to John Stuart Mill (1848), Mitchell (1924),and Forrester (1961), shows how such behavior can result frombounded rationality and emotional reactions. Many accounts ofrelated phenomena such as speculative bubbles stress the role ofbehavioral and emotional factors, from Mackey’s (1841) classicaccount of the “madness of crowds” to Merton’s (1948) “self-fulfilling prophecy” to Shiller’s (2001) “irrational exuberance.”
The Beer Distribution Game provides an experimental setting inwhich rational and behavioral contributions to supply chain insta-bility can be distinguished. The CDKS (2014) implementation ofthe BDG eliminates all operational and institutional structures thatmight cause rational agents to generate a bullwhip effect, hoardor place phantom orders, including order batching (because thereare no scale economies favoring large order quantities), forwardbuying (because customer demand is exogenous and prices arefixed), uncertainty about demand (because customer demand isconstant and that information is common knowledge), and short-age gaming (because there is no horizontal competition). Underthese conditions rational agents would never generate supply chaininstability, yet nearly all the experimental supply chains exhibiteda pronounced bullwhip. Even more surprising, more than a fifthof all participants placed orders more than 25 times larger thanthe known, constant demand. CDKS showed that their results heldwhether these outliers are included or excluded. However, theydid not examine why so many participants generated astonishinglylarge orders.
Although it is never rational in the CDKS setting to engagein hoarding or phantom ordering, we hypothesize that signals ofscarcity, such as large increases in incoming orders or inadequatedeliveries from suppliers, triggered hoarding or phantom orderingamong many of the outlier participants. To test for the presenceof hoarding or phantom ordering we estimated decision rules forparticipant orders, relaxing the assumption of prior studies thatdesired inventory and desired supply line levels are constant (e.g.,Sterman, 1989a; Diehl and Sterman, 1995; Croson and Donohue,2006; Croson et al., 2014). The alternative models allow for thepossibility that people increase their desired inventory coverage(hoard) as they experience scarcity or increase the desired sup-ply line of unfilled orders (phantom ordering) to compensate forchanges in their supplier’s lead time. While most participants donot hoard or place phantom orders, we find a total of 35.7% ofall participants exhibit statistically significant hoarding (15.8%),phantom ordering (26.3%), or both (6.4%). The alternative mod-els significantly improve the explanatory power of the orderingdecision rules for these subjects. The close match between the esti-
hoarding, I’m just stocking up before the hoarders get here.”. Manage. (2015), http://dx.doi.org/10.1016/j.jom.2015.07.002
mated and actual ordering behavior for these extreme participantssuggests that their decisions did not reflect low motivation, weakincentives or poor understanding of the experiment, but rather
placed by hoarders induce longer delivery delays. Note, however, that if large vari-ations in incoming orders caused long delivery delays for the hoarders, the samelarge variations in incoming orders would cause long delivery delays for the phan-tom orderers, because both H and PO are involved in positive feedbacks (Fig. 2).Instead, there is no statistically significant difference in the variance of incomingorders for the PO group vs. the non-PO group. Nevertheless, follow up studies shouldseek other measures to provide additional tests of HD and HS

ING ModelO
1 eratio
rft
aomeicotc
oiisssehetrw
cartpr“ttCfRwipCoiieoisbatitekis
eeatc
ARTICLEPEMAN-916; No. of Pages 16
4 J.D. Sterman, G. Dogan / Journal of Op
esulted from heuristics such as “build safety stock to compensateor unpredictable customer demand” and “if suppliers deliver lesshan I need, order more to get what I really want.”
The results are striking because hoarding and phantom orderingre never rational in the experiment. There is common knowledgef the constant final customer demand. Participants also have com-on knowledge that there are no capacity constraints or random
vents, that cancellations are not permitted and that there is no hor-zontal competition—each supplier has only one customer and eachustomer has only one supplier. Participants who seek safety stocksr place phantom orders necessarily induce backlogs upstream andhen accumulate excess inventory, raising costs for their supplyhain and reducing their financial reward.
Why, then, do these individuals hoard and place phantomrders? Hoarding and phantom ordering are adaptive responses
n many situations. Competition for limited supplies is commonn settings where hoarding and phantom orders arise, such ashortages of “must have” toys and electronics, boom periods whenuppliers are unable to fill orders on time or crises in whichupplies of vital goods are inadequate and uncertain. Those whoxercise restraint will often go without while more aggressiveoarders deplete available supplies. We speculate that participantsxhibiting these behaviors in the experiment are inappropriatelyransferring heuristics for hoarding and phantom ordering from theeal world, where they are sometimes adaptive, to the experiment,here they are dysfunctional.
Decision-making is not only a cognitive process, but is signifi-antly affected by emotions. Environmental stressors often triggerutonomic arousal, including increased heart rate, adrenalineelease, vasoconstriction that raises blood pressure, and pupil dila-ion, along with anxiety, fear, anger and other emotional andhysiological reactions. A certain degree of autonomic arousal inesponse to stressors is adaptive and enhances survival (e.g., thefight or flight” response to threat). But it has long been known thathe relationship between arousal and performance is ∩ –shaped:oo much stress worsens performance (Yerkes and Dodson, 1908).ausality is often two-way: stress may cause performance to suf-
er, and poor performance can increase stress (see Rudolph andepenning, 2002). Thus, contrary to traditional economic theorieshere greater monetary rewards should induce greater effort and
mprove performance, higher stakes may increase stress to theoint that performance suffers. Consistent with this hypothesis,amerer and Hogarth (1999), reviewing the impact of incentivesn performance in judgment and decision making tasks, find that
ncentives sometimes improve performance, sometimes have nompact, and sometimes decrease performance (they identify sev-ral reasons for this response; stress is only one). In the behavioralperations tradition, Bendoly (2011, 2013) found that participants
n experimental real-time resource allocation tasks experiencedignificant arousal and stress, as measured by pupil dilation andlink rate, that these increased with task difficulty and that stressffected performance (see also Bendoly and Hur, 2007). Outsidehe laboratory, Lo and Repin (2002) measured the psychophys-ological responses of professional securities traders during liverading sessions. They show that even the most experienced tradersxhibit significant emotional and physiological responses to mar-et events. Lo et al. (2005) also find that traders experiencing more
ntense emotional reactions to monetary gains and losses generatedignificantly lower financial returns.
In the CDKS implementation of the beer game, common knowl-dge that customer orders are constant means participants shouldxpect no or only small, transient variations in incoming orders,
Please cite this article in press as: Sterman, J.D., Dogan, G., “I’m noBehavioral causes of phantom ordering in supply chains. J. Operations
nd stable, timely deliveries from their suppliers. Deviations fromhese expectations are unexpected and costly surprises that mayonstitute stressors that increase autonomic arousal and heighten
PRESSns Management xxx (2015) xxx–xxx
emotional responses to the point that they interfere with rationaldecision-making and trigger phantom ordering and hoarding.
The results support the situational hypothesis that stressorsarising from scarcity or poor supplier delivery performance trig-ger hoarding and phantom ordering. The contrasting dispositionalhypothesis posits that differences in the propensity to hoard orplace phantom orders are due to idiosyncratic attributes of indi-viduals, not the situation in which they find themselves. Althoughdifferences among individuals surely play a role, much of theresponse heterogeneity is explained by the conditions the par-ticipants faced, specifically the degree to which they experiencedunexpectedly large orders or poor delivery performance.
People’s poor understanding of dynamics makes such irrationalbehavior more likely. Studies show that people have great difficultyaccounting for feedback processes, time delays, and stock and flowstructures that cause disequilibrium phenomena (Sterman, 2000reviews the literature). Typical mental simulations of complex sys-tems tend to assume open-loop, one-way causality, ignore timedelays and do not account for accumulations (Cronin et al., 2009).Thus a firm may increase desired safety stocks and update theirestimate of supplier lead times if suppliers miss a scheduled deliv-ery. Such responses reflect open-loop, equilibrium mental models:having larger safety stocks and a larger supply line of unfilled ordersis beneficial if customer orders are uncertain and suppliers areunable to deliver on time, but the only way to get them is to placemore orders, further increasing the supplier’s lead time and theprobability of missed deliveries. The stress caused by the deterio-ration in supplier performance may further degrade people’s abilityto understand and respond appropriately to these disequilibriumdynamics, leading to still more phantom orders and eroding trustamong supply chain partners in a destructive positive feedback.
The results, however, beg the question of why hoarding andphantom ordering are triggered for these individuals when theyknow it is irrational to do so in the experiment. Many animals,including humans, evolved in an environment characterized byscarcity, uncertainty, and competition for resources. During timesof scarcity, such as winter, organisms must store resources suffi-cient to survive until food becomes abundant. Some species storethe resources they collect as fat and hibernate during periodsof scarcity. Others cannot use this strategy due to higher basalmetabolic rates or the need to evade predators. For these species,including many birds and mammals, hoarding is highly adaptive(Grisham and Barlow, 2005; Bartness and Day, 2003); individualswho do not “stock up before the hoarders get here” may not survive.Brain imaging studies show that the neural structures responsi-ble for the drive to collect objects, principally food, are located inthe subcortex, a region of the brain that emerged early in mam-malian evolution, while rational decision making in humans residesin the evolutionarily recent frontal cortex (Anderson et al., 2004).We speculate that the unexpected scarcity many participants expe-rience in the experiment generates autonomic arousal sufficient totrigger the latent hoarding response, leading these individuals toboost their safety stock goals and place phantom orders. Doing so,of course, further degrades supplier service and may lead to stillmore stress and still more hoarding and phantom orders.
The psychiatry and neuroscience literatures provide supportfor these hypotheses. Hoarding is a common psychiatric disorderrecognized in the Diagnostic and Statistical Manual of Mental Disor-ders (DSM-5; APA 2013). Symptoms include “excessive acquisitionof possessions” and “persistent difficulty discarding or parting withpossessions” due to “a perceived need to save the items and to dis-tress associated with discarding them” (p. 247-248). Prevalence is
t hoarding, I’m just stocking up before the hoarders get here.”. Manage. (2015), http://dx.doi.org/10.1016/j.jom.2015.07.002
estimated at 2-6% of the population. Hoarding disorder is related toObsessive Compulsive Disorder (OCD) (APA 2013, Mataix-Cols andPertusa, 2012; Bloch et al., 2008). Imaging studies demonstrate thatlower activity in the dorsal anterior cingulate gyrus (ACG) is cor-
ING ModelO
eratio
rwmeio((iscirtt
faapntPtiCiacsm
hid(iatmipB
llctfshprsrderec
edtoa
ARTICLEPEMAN-916; No. of Pages 16
J.D. Sterman, G. Dogan / Journal of Op
elated with hoarding among OCD patients. The ACG is associatedith executive control, problem solving, selecting responses fromultiple, conflicting options and emotional self-control (Saxena
t al., 2004). Some individuals begin to exhibit compulsive hoard-ng after injury or surgery compromises the ACG or other regionsf the frontal cortex associated with rational decision-makingHahm et al., 2001; Eslinger and Damasio, 1985). Anderson et al.2004) found that patients with no history of compulsive hoard-ng who suffered lesions in a particular region of the frontal cortex,pecifically including the ACG, were far more likely to engage inompulsive collecting behavior afterward than those with lesionsn other regions of the frontal cortex. They conclude that the injuredegion “disrupts a mechanism which normally modulates subcor-ically driven predispositions to acquire and collect, and adjustshese predispositions to environmental context.”
It might be argued that evidence about individuals sufferingrom hoarding disorder and patients with brain injuries does notpply to the healthy participants in the experiment or to man-gers of real supply chains. However, showing normal individualshotographs suggestive of hoarding, such as large stacks of oldewspapers, provokes urges and activates brain centers similar tohose observed in compulsive hoarders (Mataix-Cols et al., 2003;hillips and Mataix-Cols, 2004), with the latter finding that presen-ation of hoarding-related images also led to “significant increasesn anxiety” (see also An et al., 2009). Many participants in theDKS experiment experienced cues suggestive of scarcity, includ-
ng large, unexpected increases in incoming orders, large backlogs,nd delayed deliveries from their supplier. We speculate that suchues activate the hoarding impulse in the subcortex, while at theame time acting as stressors enhancing autonomic arousal thatay suppress the ability to regulate that impulse.
The results suggest a variety of avenues for further research. Theypothesis that those engaging in phantom ordering and hoard-
ng experienced more autonomic arousal than others can be testedirectly as people participate in the experiment, as Lo and Repin2002) did for traders. The hypothesis that stressors such as largencoming orders and supplier shortfalls suppress the ACG and/orctivate hoarding centers in the subcortex or limbic system can beested by fMRI or PET imaging of participants during the experi-
ent. For these purposes it may be desirable to use a simplifiednventory management system in which incoming orders and sup-lier lead times can be manipulated directly, whereas in the fullDG these are endogenous.
Empirical studies of supply chains in which instability is preva-ent may also be fruitful. Customers and managers often experienceong and unpredictable supplier lead times, stockouts, and otherues that signal scarcity and may constitute stressors that couldrigger hoarding or phantom ordering. Such experiences may bear more stressful than the experiment. Interviews and econometrictudies may document the prevalence of such behavior. Interviews,owever, are unlikely to reveal the extent to which hoarding andhantom ordering are strategic, rational responses or emotionaleactions to scarcity, since informants may seek to portray them-elves in a favorable light or suffer from hindsight bias and ex postationalization. Observation of supply chain managers in real timeuring periods of scarcity may provide better tests of the role ofmotions, panic, and fear. Similar experiments and field studies inelated contexts including speculative bubbles, bank runs, riots andscape panics may also shed light on the neurological, physiologi-al, emotional and strategic processes affecting behavior.
The results also suggest normative implications. To the extentveryone is susceptible to hoarding and phantom ordering to some
Please cite this article in press as: Sterman, J.D., Dogan, G., “I’m notBehavioral causes of phantom ordering in supply chains. J. Operations
egree, with these behaviors triggered by stresses in the situa-ion, firms must not only attend to the game-theoretic structuref their supply chains but must also design information systemsnd other features of the workplace to minimize the stresses that
PRESSns Management xxx (2015) xxx–xxx 15
might trigger dysfunctional behavioral responses to scarcity. Stud-ies exploring how to reduce these stressors, whether and howtraining can help people resist the urge to hoard, and how to designautomated supply chain management systems to reduce their vul-nerability to hoarding and phantom ordering may help stabilizesupply chains currently at risk in both business and public policycontexts.
Finally, the results suggest a greater role for behavioral researchin operations management generally. Hoarding and phantomordering are not the only behavioral dynamics relevant to man-ufacturing and service operations. Other settings where behavioralreactions are likely to play a role include the hockey stick in salesand manufacturing, cost and schedule overruns in project man-agement, and firefighting in new product development, to namejust a few (e.g., Lyneis and Ford, 2007; Repenning and Sterman,2002; Repenning, 2001). Effective behavioral research in opera-tions will unite the tools of traditional operations managementand operations research with organization theory, psychology, neu-roscience, system dynamics and other disciplines. The result willbe rich behavioral theories of disequilibrium dynamics, tested inexperiments, fieldwork and other empirical studies, and general-ized with formal models that offer useful insights to improve themanagement of complex operations.
Acknowledgments
We are grateful to Rachel Croson, Karen Donohue, and ElenaKatok for providing the data analyzed here, and for helpful com-ments; we also thank Elliot Bendoly, Kevin Linderman, RogelioOliva, the referees, and many others who provided useful sug-gestions in seminars and conference presentations. We thank theProject on Innovation in Markets and Organizations at the MIT SloanSchool of Management for financial support.
References
American Psychiatric Association, 2013. Diagnostic and Statistical Manual ofMental Disorders: DSM-5. American Psychiatric Association, Washington, D.C.
An, S., Mataix-Cols, N., Lawrence, S., Wooderson, V., Giampietro, A., Speckens, M.,2009. To discard or not to discard: the neural basis of hoarding symptoms inobsessive-compulsive disorder. Mol. Psychiatry 14, 318–331.
Anderson, S., Damasio, H., Damasio, A., 2004. A neural basis for collecting behaviorin humans. Brain 128 (1), 201–212.
Armony, M., Plambeck, E., 2005. The impact of duplicate orders on demandestimation and capacity investment. Manage. Sci. 51 (10), 1505–1518.
Bartness, T., Day, D., 2003. Food hoarding: a quintessential anticipatory appetitivebehavior. Prog. Psychobiol. Physiol. Psychol. 18, 69–100.
Bendoly, E., 2011. Linking task conditions to physiology and judgment errors in RMsystems. Prod. Oper. Manage. 20 (6), 860–876.
Bendoly, E., 2013. Real-time feedback and booking behavior in the hospitalityindustry: moderating the balance between imperfect judgment and imperfectprescription. J. Oper. Manage. 31 (1–2), 62–71.
Bendoly, E., Croson, R., Goncalves, P., Schultz, K., 2010. Bodies of Knowledge forResearch in Behavioral Operations. Production and Operations Management19 (4), 434–452.
Bendoly, E., Hur, D., 2007. Bipolarity in reactions to operational ‘constraints’: OMbugs under an OB lens. J. Oper. Manage. 25 (1), 1–13.
Bloch, M., Landeros-Weisenberger, M., Pittenger, C., Leckman, J., 2008.Meta-analysis of the symptom structure of obsessive-compulsive disorder.Am. J. Psychiatry 165 (12), 1532–1542.
Boudreau, J., Hopp, W., McClain, J., Thomas, L., 2003. On the interface betweenoperations and human resources management. Manuf. Serv. Oper. Manage. 5(3), 179–202.
Bray, R., Mendelson, H., 2012. Information transmission and the bullwhip effect: anempirical investigation. Manage. Sci. 58 (5), 860–875.
Brehmer, B., 1992. Dynamic decision making: human control of complex systems.Acta Psychol. 81, 211–241.
Burton, L., Coleman-Kammula, S., J., Sterman, D., Andersen, G., Richardson, 2005. ASystem Dynamics Study of a Commodity Plastics Industry. 23rd InternationalSystem Dynamics Conference, Boston. www.systemdynamics.org/conf2005/
hoarding, I’m just stocking up before the hoarders get here.”. Manage. (2015), http://dx.doi.org/10.1016/j.jom.2015.07.002
proceed/papers/BURTO264Cachon, G., Lariviere, M., 1999. Capacity choice and allocation: strategic behavior
and supply chain performance. Manage. Sci. 45 (8), 1091–1108.Cachon, G., Gallino, S., Olivares, M. (2013) Does Adding Inventory Increase Sales?
Evidence of a Scarcity Effect in U.S. Automobile Dealerships. Columbia Business

ING ModelO
1 eratio
C
C
C
C
C
C
C
C
C
D
DE
FG
G
G
G
H
K
K
K
L
L
L
L
L
M
M
M
109hhrg99512/pdf/CHRG-109hhrg99512. (accessed 11.16.13.).Wu, D., Katok, E., 2006. Learning, communication, and the bullwhip effect. J. Oper.
ARTICLEPEMAN-916; No. of Pages 16
6 J.D. Sterman, G. Dogan / Journal of Op
School Research Paper No. 13-60. Available at SSRN: http://ssrn.com/abstract=2286800. or http://dx.doi.org/10.2139/ssrn.2286800
amerer, C., Hogarth, R., 1999. The effects of financial incentives in experiments: areview and capital-labor-production framework? J. Risk Uncertainty 19 (1–3),7–42.
hen, F., Drezner, Z., Ryan, J.K., Simchi-Levi, D., 2000. Quantifying the bullwhipeffect: the impact of forecasting, lead times, and information. Manage. Sci. 46(3), 436–443.
lark, A., Scarf, H., 1960. Optimal policies for a multi-echelon inventory problem.Manage. Sci. 6, 475–490.
ronin, M., Gonzalez, C., Sterman, J., 2009. Why don’t well-educated adultsunderstand accumulation? A challenge to researchers, educators, and citizens.Org. Behav. Hum. Decis. Processes 108 (1), 116–130.
roson, R., Schultz, K., Siemsen, E., Yeo, M., 2013. Behavioral operations: the stateof the field. J. Oper. Manage. 31 (1–2), 1–5.
roson, R., Donohue, K., 2003. Impact of POS data sharing on supply chainmanagement: an experimental study. Prod. Oper. Manage. 12 (1), 1–11.
roson, R., Donohue, K., 2005. Upstream versus downstream information and itsimpact on the bullwhip effect. Syst. Dyn. Rev. 21 (3), 249–260.
roson, R., Donohue, K., 2006. Behavioral causes of the bullwhip effect and theobserved value of inventory information. Manage. Sci. 52 (3),323–336.
roson, R., Donohue, K., Katok, E., Sterman, J., 2014. Order stability in supplychains: coordination risk and the role of coordination stock. Prod. Oper.Manage. 23 (2), 176–196.
iehl, E., Sterman, J., 1995. Effects of feedback complexity on dynamic decisionmaking. Org. Behav. Hum. Decis. Processes 62 (2), 198–215.
örner, D., 1996. The Logic of Failure. Metropolitan Books/Henry Holt, New York.slinger, P., Damasio, A., 1985. Severe disturbance of higher cognition after
bilateral frontal lobe ablation: patient EVR. Neurology 35, 1731–1741.orrester, J.W., 1961. Industrial Dynamics. MIT Press, Cambridge, MA.ino, F., Pisano, G., 2008. Toward a theory of behavioral operations. Manuf. Serv.
Oper. Manage. 10 (4), 676–691.oetz, J. 2005. Interview with co-founder of a Cisco Value-Added Reseller. Personal
Communication.oncalves, P., 2003. Demand bubbles and phantom orders in supply chains. Ph.D.
Thesis, Massachusetts Institute of Technology. Cambridge, MA, USA.risham, J., Barlow, D., 2005. Compulsive hoarding: current research and theory. J.
Psychopathol. Behav. Assess. 27 (1), 45–52.ahm, D., Kang, Y., Cheong, S., Na, D., 2001. A compulsive collecting behavior
following an A-com aneurismal rupture. Neuorology 56 (3),398–400.
ahneman, D., Slovic, P., Tversky, A., 1982. Judgment Under Uncertainty:Heuristics and Biases. Cambridge University Press, Cambridge, England.
ampmann, C., Sterman, J., 2014. Do markets mitigate misperceptions offeedback? Syst. Dyn. Rev.
leinmuntz, D., 1993. Information processing and the misperception of feedback indynamic decision making. Syst. Dyn. Rev., 9223–9237.
arsen, E., Morecroft, J., Thomsen, J., 1999. Complex behaviour in aproduction-distribution model. Eur. J. Oper. Res. 119 (1), 61–74.
ee, H., Padmanabhan, V., Whang, S., 1997. Information distortion in a supplychain: the bullwhip effect. Manage. Sci. 43 (4), 546–558.
o, A., Repin, D., 2002. The psychophysiology of real time financial risk processing.J. Cognit. Neurosci. 14 (3), 323–339.
o, A., Repin, D., Steenbarger, B., 2005. Fear and greed in financial markets: aclinical study of day-traders. Am. Econ. Rev. 95 (2), 352–359.
yneis, J., Ford, D., 2007. System dynamics applied to project management: asurvey, assessment, and directions for future research. Syst. Dyn. Rev. 23 (2–3),157–189.
ackay, C., 1841. 1841/1980 Extraordinary popular delusions and the madness ofcrowds. Three Rivers Press, New York.
Please cite this article in press as: Sterman, J.D., Dogan, G., “I’m noBehavioral causes of phantom ordering in supply chains. J. Operations
ataix-Cols, D., Pertusa, A., 2012. Annual research review: hoardingdisorder–potential benefits and pitfalls of a new mental disorder. J. ChildPsychol. Psychiatry 53 (5), 608–618.
ataix-Cols, D., Cullen, K., Lange, F., Zelaya, C., Andrew, E., Amaro, M., Brammer, S.,Williams, A., 2003. Neural correlates of anxiety associated with
PRESSns Management xxx (2015) xxx–xxx
obsessive-compulsive symptom dimensions in normal volunteers. Soc. Biol.Psychiatry 53, 482–493.
Meadows, D., 1970. Dynamics of commodity production cycles. MIT Press,Cambridge.
Merton, R., 1948. 1948/1968 The self-fulfilling prophecy, Antioch Review Summer193-210. In: Merton, R. (Ed.), Social Theory and Social Structure. Free Press,New York.
Mill, J.S. 1848. Principles of Political Economy.Mitchell, T.W., 1924. Competitive illusion as a cause of business cycles. Quart. J.
Econ. 38 (4), 631–652.Morecroft, J., 1985. Rationality in the analysis of behavioral simulation models.
Manage. Sci. 31 (7), 900–916.Mosekilde, E., Laugesen, J., 2007. Nonlinear dynamic phenomena in the beer
model. Sys. Dyn. Rev. 23 (2–3), 229–252.Paich, M., Sterman, J., 1993. Boom, bust, and failures to learn in experimental
markets. Manage. Sci. 39 (12), 1439–1458.Phillips, M., Mataix-Cols, D., 2004. Patterns of neural response to emotive stimuli
distinguish the different symptom dimensions of obsessive-compulsivedisorder. CNS Spectr. 9 (4), 275–283.
Pierson, K., Sterman, J., 2013. Cyclical dynamics of airline industry earnings. Sys.Dyn. Rev. 29 (3), 129–156.
Pollack, A. 2005. Hoarding prompts halt in flu drug shipping. New York Times, 27October.
Randers, J., Göluke, U., 2007. Forecasting turning points in shipping freight rates:lessons from 30 years of practical effort. Syst. Dyn. Rev. 23 (2–3), 253–284.
Repenning, N., 2001. Understanding fire fighting in new product development. J.Prod. Innovation Manage. 18 (5), 285–300.
Repenning, N., Sterman, J., 2002. Capability traps and self-confirming attributionerrors in the dynamics of process improvement. Admin. Sci. Quart. 47 (2),265–295.
Rudolph, J., Repenning, N., 2002. Disaster dynamics: understanding the role ofstress and interruptions in organizational collapse. Admin. Sci. Quart. 47, 1–30.
Saxena, S., Brody, K., Maidment, E., Smith, N., Zohrabi, E., Katz, S., Baxter, L., 2004.Cerebral glucose metabolism in obsessive-compulsive hoarding. Am. J.Psychiatry 161 (6), 1038–1048.
Shah, A., Mullainathan, S., Shafir, E., 2012. Some consequences of having too little.Science 338, 682–685.
Shi, S., 2002. Phantom Orders Roil Cisco’s Supply Chain–A System Dynamics Studyof Networking Equipment Industry’s Supply Chain. SM thesis. MIT, Cambridge,MA.
Shiller, R., 2001. Irrational exuberance. Princeton University Press, Princeton NJ.Simon, H., 1969. The Sciences of the Artificial. MIT Press, Cambridge, MA.Simon, H., 1982. Models of Bounded Rationality. MIT Press, Cambridge, MA.Steckel, J., Gupta, S., Banerji, A., 2004. Supply chain decision making: will shorter
cycle times and shared point-of-sale information necessarily help? Manage.Sci. 50 (4), 458–464.
Sterman, J., 1989a. Modeling managerial behavior: Misperceptions of feedback in adynamic decision-making experiment. Manage. Sci. 35 (3), 321–339.
Sterman, J., 1989b. Misperceptions of feedback in dynamic decision making. Org.Behav. Hum. Decis. Processes 43 (3), 301–335.
Sterman, J., 2000. Business Dynamics: Systems Thinking and Modeling for aComplex World. McGraw-Hill, New York, NY.
Thomsen, J., Mosekilde, E., Sterman, J., 1992. Hyperchaotic phenomena in dynamicdecision making. J. Syst. Anal. Model. Simul., 137–156.
Tversky, A., Kahneman, D., 1974. Judgment under uncertainty - heuristics andbiases. Science 185 (4157), 1124–1131.
US House Committee on Government Reform, 109th Congress. The PerplexingShift from Shortage to Surplus: Managing This Season’s Flu Shot Supply andPreparing for the Future. 10 Feb 2005. http://www.gpo.gov/fdsys/pkg/CHRG-
t hoarding, I’m just stocking up before the hoarders get here.”. Manage. (2015), http://dx.doi.org/10.1016/j.jom.2015.07.002
Manage. 24 (6), 839–850.Yerkes, R., Dodson, J., 1908. The relation of strength of stimulus to rapidity of habit
formation. J. Comp. Neurol. Psychol. 18, 459–482.