g model article in press - colorado state university
TRANSCRIPT

Please cite this article in press as: Gao, Z., et al., Integrating temperature vegetation dryness index (TVDI) and regional waterstress index (RWSI) for drought assessment with the aid of LANDSAT TM/ETM+ images. Int. J. Appl. Earth Observ. Geoinf. (2010),doi:10.1016/j.jag.2010.10.005
ARTICLE IN PRESSG ModelJAG 379 1–9
International Journal of Applied Earth Observation and Geoinformation xxx (2010) xxx–xxx
Contents lists available at ScienceDirect
International Journal of Applied Earth Observation andGeoinformation
journa l homepage: www.e lsev ier .com/ locate / jag
Integrating temperature vegetation dryness index (TVDI) and regional waterstress index (RWSI) for drought assessment with the aid of LANDSAT TM/ETM+images
1
2
3
Zhiqiang Gaoa,b,∗, Wei Gaob, Ni-Bin Changc4
a Institute of Geographical Sciences and Natural Resources Research, Chinese Academy of Sciences, Beijing, China5b USDA UV-B Monitoring and Research Program, Natural Resource Ecology Laboratory, Colorado State University, Fort Collins, CO, USA6c Department of Civil, Environmental, and Construction Engineering, University of Central Florida, Orlando, FL, USA7
8
a r t i c l e i n f o9
10
Article history:11
Received 20 May 201012
Accepted 25 October 201013
14
Keywords:15
Drought assessment16
Remote sensing17
Urbanization effect18
Urban heat island19
Coastal management20
a b s t r a c t
This paper presents a new drought assessment method by spatially and temporally integrating temper- Q2ature vegetation dryness index (TVDI) with regional water stress index (RWSI) based on a synergisticapproach. With the aid of LANDSAT TM/ETM data, we were able to retrieve the land-use and land-cover(LULC), vegetation indices (VIs), and land surface temperature (LST), leading to the derivation of threetypes of modified TVDI, including TVDI SAVI, TVDI ANDVI and TVDI MSAVI, for drought assessment ina fast growing coastal area, Northern China. The categorical classification of four drought impact levelsassociated with the RWSI values enables us to refine the spatiotemporal relationship between the LSTand the VIs. Holistic drought impact assessment between 1987 and 2000 was carried out by linking RWSIwith TVDIs group wise. Research findings indicate that: (1) LST and VIs were negatively correlated inmost cases of low, medium, and high vegetation cover except the case of high density vegetation coverin 2000 due to the effect of urban heat island (UHI) effect; (2) the shortage of water in 1987 was moresalient than that that in 2000 based on all indices of TVDI and RWSI; and (3) TVDIs are more suitable formonitoring mild drought, normal and wet conditions when RWSI is smaller than 0.752; but they are notsuitable for monitoring moderate and severe drought conditions.
© 2010 Published by Elsevier B.V.
1. Introduction21
Drought is a normal, recurrent feature of climate having a22
consequence of a reduction of precipitation and/or abnormal tem-23
perature over an extended period of time. In urban drought events,24
which is a temporary aberration, the drought might turn pastures25
brown, threaten shrubs and trees, and result in low vegetation26
cover and high land surface temperature (LST) simultaneously.27
Given that drought is a normal, recurrent feature of climate, it28
occurs in virtually all climatic regimes. Common indicators for29
drought assessment include ecological variables such as vegetation30
cover and evapotranspiration (ET), meteorological variables such31
as precipitation, as well as hydrological variables such as soil mois-32
ture, stream flow, ground water levels, reservoir and lake levels,33
and snow pack.34
The water stress index method is the ratio of the actual ET35
and potential ET which is a kind of crop water stress index.36
∗ Corresponding author at: USDA UV-B Monitoring and Research Program, NaturalResource Ecology Laboratory, Colorado State University, 419 Canyon Ave., Suite 226,Fort Collins, CO 80521, USA. Tel.: +1 970 491 3601.Q1
E-mail address: [email protected] (Z. Gao).
With this concept, Jackson and Idso (1981) promoted the crop 37
water stress index (CWSI) and Moron et al. (1994) proposed water 38
deficit index (WDI). In addition, the moisture index method is an 39
approach for monitoring the regional drought with water char- 40
acteristics of strong absorption in shortwave infrared band (Xu, 41
2006; Fensholt and Sandholt, 2003; Chen et al., 2005). For example, 42
Kogan (1995) proposed the vegetation condition index (VCI), and 43
Mcffters (1996) proposed the normalized difference water index 44
(NDWI) by combining LANDSAT TM green and near-infrared bands. 45
Both of which are the moisture index method. The temperature 46
vegetation dryness index (TVDI) method based on the vegetation 47
index/temperature trapezoid eigenspace (VITT) (Sandholt et al., 48
2002) also belongs to the category of moisture index method. Ther- 49
mal inertia method is the approach using thermal infrared remote 50
sensing data to monitor soil moisture. Waston et al. (1971) firstly 51
proposed a simple model to calculate the thermal inertia with daily 52
difference of LST. Since then, many scientists carried out a vari- 53
ety of experimental studies with respect to the thermal inertia 54
principles (Price, 1977, 1985; England, 1990; Xue and Cracknell, 55
1995). 56
The spatial VITT has been applied widely in many studies reflect- 57
ing the potential impact of LST on NDVI. Moron et al. (1994) 58
explained the algorithm of crop water stress index (CWSI), which 59
0303-2434/$ – see front matter © 2010 Published by Elsevier B.V.doi:10.1016/j.jag.2010.10.005

Please cite this article in press as: Gao, Z., et al., Integrating temperature vegetation dryness index (TVDI) and regional waterstress index (RWSI) for drought assessment with the aid of LANDSAT TM/ETM+ images. Int. J. Appl. Earth Observ. Geoinf. (2010),doi:10.1016/j.jag.2010.10.005
ARTICLE IN PRESSG ModelJAG 379 1–9
2 Z. Gao et al. / International Journal of Applied Earth Observation and Geoinformation xxx (2010) xxx–xxx
Fig. 1. The location of the study area in Shandong Province, China.
could avoid the measurements of leaf temperature when studying60
the situation of vegetation cover. The slope of scatter plot com-61
bined LST and VI represents degree of crop water stress gradient62
based on the negative relationship between LST and VI (Carlson63
et al., 1995; Moran et al., 1996; Fensholt and Sandholt, 2003;64
Venturini et al., 2004; Wang et al., 2007). Many studies moni-65
tored ET and soil moisture with spatial VITT to illuminate their66
correlation (Goward and Hope, 1989; Price, 1990; Ridd, 1995;Q367
Gillies and Carlson, 1995; Gillies et al., 1995, 1997; Sandholt et al.,68
2002; Wang et al., 2004; Han et al., 2006). These studies can69
help us evaluate the spatial and temporal variations of drought70
more accurately although each index has strengths and weaknesses71
which need to be clearly understood as they are integrated into72
drought early warning systems. Since the spatial and temporal73
patterns of vegetation dynamics could be associated with precip-74
itation changes and temperature fluctuations simultaneously, an75
implicit hypothesis of the current study is that integration of dif-76
ferent indices for drought assessment would be better than using77
a single one.78
To test the application and adaptation potential of TVDIs with79
the aid of a suite of remote sensing technologies, this study devel-80
ops a synergistic approach with respect to three TVDIs that were81
designed to combine temperature with four different vegetation82
indices (VIs) group wise. Yet it is believed that the soil-adjusted83
vegetation indices may be better coupled with TVDIs for meet-84
ing the study goal (Makkeasorn and Chang, 2009). To prove the85
concept, four vegetation indices were therefore included for com-86
parisons based on the temperature trapezoid eigenspace (VITT)87
(Sandholt et al., 2002). In addition, the regional water stress index88
(RWSI) designed based on the CWSI mechanism and SEBAL model89
was prepared as a reference basis for the refinements of TVDIs90
when monitoring the regional drought events (Bastiaanssen et al.,91
1998a,b). It is anticipated that the science question as to “how92
changes in these relevant factors may influence the impacts of93
drought episodes in vulnerability assessment?” can be examined94
and answered with this synergistic approach in a fast developing95
coastal region, Northern China.96
2. Methodologies97
2.1. The study area98
The study area is located at Laizhou Bay in Shandong Province,99
China (Fig. 1) within the latitude of 36◦48′43′′–37◦32′49′′ and longi-100
tude 118◦37′37′′–119◦44′31′′. The length along the east-west and of101
north-south directions is approximately 97 km and 79 km, respec-102
tively. The total study area is 486,245 ha. Land elevation drops 103
mildly from 30 m to 2 m above the sea level. Yet the length of 104
the meandering coastal line within the study area is about 400 km 105
long. Such coastal region is an active floodplain that was formed 106
by sediment laden water being released from the neighboring 107
river channel through the regional morphological and sedimen- 108
tary dynamics. Three cities, including the Shouguang City, part of 109
the Weifang City (e.g., the Hangting area), and most of the Changyi 110
City, are situated along this coastal line. The sediment distribution 111
in the alluvial plain ranges from fine sand (close to the low water 112
line) to the typical mud carried by flood currents. Close to the open 113
ocean, the climate system in this area is a moist, warm, temperate 114
continental monsoon climate (Cao, 2002; Wang et al., 2002; Guan 115
et al., 2001). 116
2.2. The satellite image processing 117
Fig. 2 delineates the flowchart of satellite image processing in 118
support of the case-based drought assessment. First of all, LANDSAT 119
TM/ETM+ images, digital elevation model (DEM) data, and climate 120
data were collected. All datasets were vectorized and interpolated 121
as grid datasets with UTM projection in advance to ease the appli- 122
cation in geographical information systems (GIS). 123
In this study, the raw images were geo-referenced to a common 124
UTM coordinate system, and we then re-sampled all of the images 125
to unify relative resolution in images of different sizes using the 126
nearest neighbor algorithm with a pixel size of 30 m × 30 m for all 127
bands, including the thermal band. 128
Following the streamlines in Fig. 2, LANDSAT TM/ETM+ images 129
were processed for the mapping of land use/land cover change 130
(LUCC), VIs, LST and heat fluxes. LUCC associated with May 7th 1987 131
and May 2nd 2000 in the study area was analyzed with respect 132
to the proper interpretation of LANDSAT TM/ETM images and was 133
validated with ground truth data. Regional scale heat fluxes were 134
estimated with the aid of remote sensing images and the surface 135
energy balance algorithm (e.g., SEBAL model) (Bastiaanssen et al., 136
1998a,b). 137
LST retrieval was carried out using the thermal bands of 138
TM/ETM+ data to ease the application of the radiance transfer 139
equation (Qin et al., 2001). The equations for normalized differ- 140
ence vegetation index (NDVI) (Rouse et al., 1973; Tucker, 1979), 141
soil adjusted vegetation index (SAVI) (Huete, 1988), modified SAVI 142
(MSAVI) (Qi et al., 1994) and adjusted normalized difference vege- 143
tation index (ANDVI) (Liu et al., 2008) were collectively employed 144
to produce a suite of VIs in support of advanced drought impact 145
assessment. All of the preparatory efforts led to develop the inte- 146
grated TDVI and RWSI for final analysis in the context of drought 147

Please cite this article in press as: Gao, Z., et al., Integrating temperature vegetation dryness index (TVDI) and regional waterstress index (RWSI) for drought assessment with the aid of LANDSAT TM/ETM+ images. Int. J. Appl. Earth Observ. Geoinf. (2010),doi:10.1016/j.jag.2010.10.005
ARTICLE IN PRESSG ModelJAG 379 1–9
Z. Gao et al. / International Journal of Applied Earth Observation and Geoinformation xxx (2010) xxx–xxx 3
Fig. 2. The flowchart of image processing for exploring the relationships between LST and VIs and drought monitoring.
monitoring. The following subsections will introduce these algo-148
rithms/equations in a greater detail.149
2.3. Retrieval of the land surface heat fluxes and land surface150
temperature (LST)151
With LANDSAT satellite images, the heat fluxes were estimated152
using SEBAL model and calculated using Arc/Info 9.0 Macro Lan-153
guage (AML) and Compaq Visual FORTRAN 6.5 mixed-language pro-154
gramming in this study (Bastiaanssen et al., 1998a,b). Our SEBAL-155
based computer package can be operated in a Microsoft Windows156
system using the ESRI GRID module as the major data format. To157
ease the application of the radiance transfer equation, Qin et al.158
(2001) derived an approximate expression for LST retrieval suit-159
able for thermal bands of TM/ETM+ data. Our LST maps were also160
derived based on the same algorithm developed by Qin et al. (2001).
2.4. Calculations of the NDVI, ANDVI, MSAVI and SAVI 161
The equations for NDVI (Rouse et al., 1973; Tucker, 1979), SAVI 162
(Huete, 1988), MSAVI (Qi et al., 1994) and ANDVI (Liu et al., 2008) 163
are summarized as follows: 164
NDVI = �nir − �red
�nir + �red(1) 165
SAVI = �nir − �red
�nir + �red + L(1 + L) (2) 166
MSAVI = 12
× [(2�nir + 1) −√
(2�nir + 1)2 − 8(�nir − �red)] (3) 167
ANDVI = �nir − �red + (1 + L)(�green − �blue)�nir + �red + (1 + L)(�green + �blue)
(4) 168

Please cite this article in press as: Gao, Z., et al., Integrating temperature vegetation dryness index (TVDI) and regional waterstress index (RWSI) for drought assessment with the aid of LANDSAT TM/ETM+ images. Int. J. Appl. Earth Observ. Geoinf. (2010),doi:10.1016/j.jag.2010.10.005
ARTICLE IN PRESSG ModelJAG 379 1–9
4 Z. Gao et al. / International Journal of Applied Earth Observation and Geoinformation xxx (2010) xxx–xxx
where �red is red band (0.63–0.69 �m) reflectance, �nir is near red169
band (0.76–0.90 �m) reflectance, �blue is blue band (0.45–0.52 �m)170
reflectance, �green is green band (0.52–0.60 �m) reflectance, L is171
adjustment factor, set to minimum background effects (L = 0.5).172
This study follows Eqs. (1)–(4) for the derivation of VIs. It is noted173
that the calculations of ANDVI, SAVI and MSAVI had included a few174
refinements. For instance, to resolve the barrier of vegetation index175
saturation issues (e.g., the index number indicates the amount of176
net rainfall that is required to reduce the index to zero, or saturation177
along the scale), Gitelson et al. (1996) introduced the green band to178
calculate VIs. In order to reduce the impact of soil background on179
VIs, Huete (1988) introduced the soil background adjustment fac-180
tor (L) to calculate VIs. The soil background adjustment factor (L)181
was actually applied in the algorithms of ANDVI, SAVI and MSAVI.182
Besides, the green and blue bands were used for the calculation183
of ANDVI while the green band was used for the calculation of184
MSAVI. As a consequence, these three VIs (ANDVI, SAVI and MSAVI)185
are quite different values as compared to the corresponding NDVI186
value.187
2.5. Calculations of the regional water stress index (RWSI)188
According to the CWSI mechanism (Jackson and Idso, 1981), this189
study defines the RWSI as follows:190
RWSI = 1 − ETETwet
(5)191
where ET is the regional actual ET (m3 ha−1 day−1), and ETwet is192
the regional potential ET (m3 ha−1 day−1). The potential ET is the193
maximum ET under the ideal water conditions assuming that the194
sensible heat flux is minimum (H ≈ 0) causing that all effective195
energy received by the land surface is used for ET. This amount196
of energy is �ETwet = Rn − G. The SEBAL model can be used to gener-197
ate the relevant heat fluxes (Bastiaanssen et al., 1998a,b; Gao et al.,198
2009). If the energy balance equation can be applied to replace the199
term ETwet in Eq. (5), we have:200
RWSI = 1 − �ET�ETwet
= H
Rn − G(6)201
where H is the sensible heat flux (W/m2); Rn is net radiation flux202
(W/m2); and G is soil heat flux (W/m2) (Bastiaanssen et al., 1998a,b).203
Therefore, the regional deficit of water can be monitored on a near204
real-time basis with the aid of remote sensing technologies. Eqs.205
(5) and (6) were thus used for the derivation of RWSI.206
2.6. Calculations of the temperature vegetation dryness index207
Different VIs such as NDVI, ANDVI, MSAVI and SAVI may have208
different linkages with LST providing the design basis of the VITT.209
Sandholt et al. (2002) pointed out that the simplified triangle space210
of LST–NDVI may exhibit the soil moisture contours reflecting the211
spatial patterns of the VITT. It led to the definition of the TVDI as212
expressed below:213
TVDI = Ts − Tsmin
Tsmax − Tsmin(7)214
where Tsmin is the minimum LST given the NDVI along the wet edge215
(K) (see Fig. 3); Tsmax is the maximum LST given the NDVI along the216
dry edge (K) (see Fig. 3); and Ts is the LST in any given pixel (K) (see217
Fig. 3).218
Based on the parameters of LULC, VIs, LST, RWSI, and TVDIs gen-219
erated with the above algorithms, the spatial patterns of LULC, VIs220
and LST and their interrelationships can be analyzed with respect221
to five RWSI classification categories (Table 1) for assessing the222
regional drought events. This endeavor would enable us to derive223
the linkages between the RWSI and the TVDIs, and therefore help224
Fig. 3. The spatial VITT configured by NDVI and LST.
identify the possible adaptation and application potentials of the- 225
ses four types of VIs (i.e., NDVI, ANDVI, SAVI, and MSAVI) proposed 226
for monitoring the regional drought as described in the next sec- 227
tion. This study follows Eq. (7) for the derivation of four modified 228
TVDIs (TVDI NDVI, TVDI ANDVI, TVDI SAVI, and TVDI MSAVI) for 229
comparison in our drought assessment practices. 230
Overall, the built up area can be excluded from our entire study 231
area by LULC classification. This can be done using the GRID mod- 232
ule in ARC/INFO software package. In addition to the LNADSAT 233
TM/ETM data, ground based climate data such as precipitation aver- 234
age temperature, maximum temperature, minimum temperature, 235
precipitation, average wind speed, amount of cloud and others were 236
used to compute the relevant indices. In our case study, we have 237
compared the same cells in the study region for the two reference 238
years to form the basis for comparisons. The scatter plots of LST 239
versus VIs in 2000 as opposed to the one in 1987 may be adopted 240
to answer the science question as to “how changes in these rel- 241
evant factors may influence the impacts of drought episodes in 242
vulnerability assessment?”. 243
3. Results and discussion 244
3.1. The spatial patterns of LULC 245
LANDSAT TM data were used for the analysis of LULC. With the 246
aid of ground truth data throughout the calibration and valida- 247
tion stages, the findings clearly indicate that LULC can be classified 248
into 7 categories including farmland, grassland, woodland, water 249
bodies, beach land, build-up land and saline-alkali land. Fig. 4 fea- 250
tures the side-by-side comparison of the spatial variations of LULC 251
two decades apart. Four dominant types of LULC in the study area 252
Table 1Regional drought classification categories.
Class Relative soil moisture RWSI Drought level
1 <0.4 >0.892 Heavy drought2 0.4–0.5 0.752–0.892 Medium drought3 0.5–0.6 0.612–0.752 Light drought4 0.6–0.8 0.332–0.612 Normal5 >0.8 <0.332 Wet spell
Relative soil moisture = soil moisture/soil saturation moisture × 100.
Please cite this article in press as: Gao, Z., et al., Integrating temperature vegetation dryness index (TVDI) and regional waterstress index (RWSI) for drought assessment with the aid of LANDSAT TM/ETM+ images. Int. J. Appl. Earth Observ. Geoinf. (2010),doi:10.1016/j.jag.2010.10.005
ARTICLE IN PRESSG ModelJAG 379 1–9
Z. Gao et al. / International Journal of Applied Earth Observation and Geoinformation xxx (2010) xxx–xxx 5
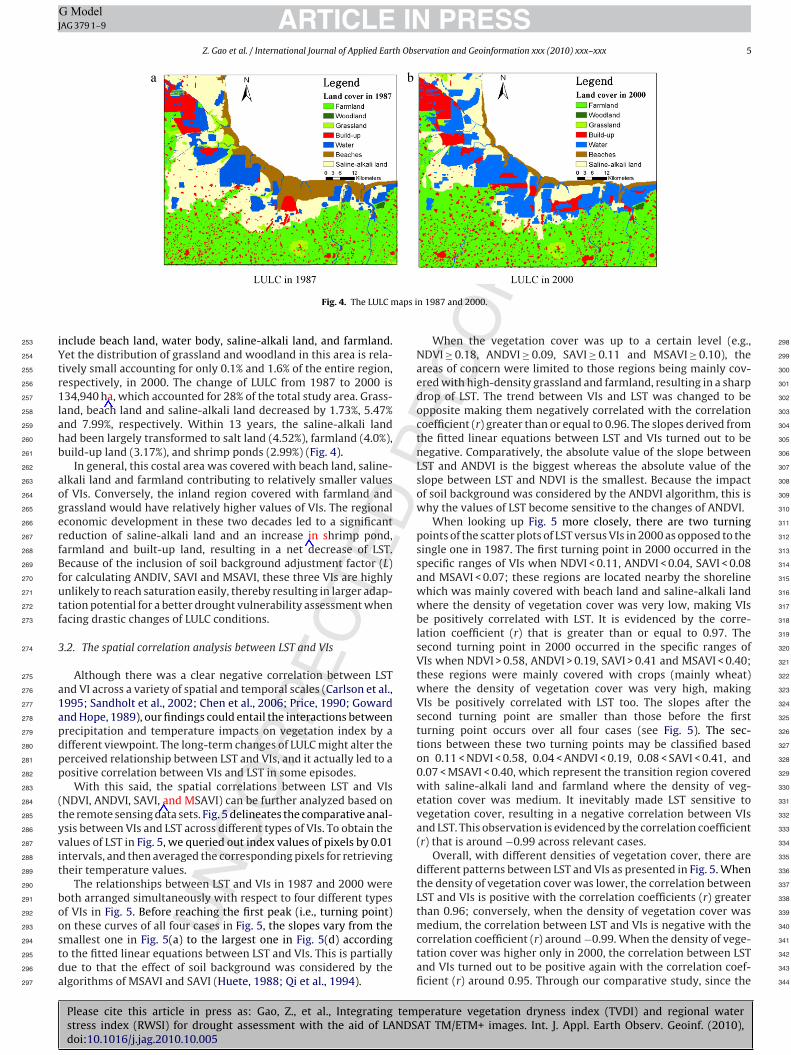
Fig. 4. The LULC maps in 1987 and 2000.
include beach land, water body, saline-alkali land, and farmland.253
Yet the distribution of grassland and woodland in this area is rela-254
tively small accounting for only 0.1% and 1.6% of the entire region,255
respectively, in 2000. The change of LULC from 1987 to 2000 is256
134,940 ha, which accounted for 28% of the total study area. Grass-257
land, beach land and saline-alkali land decreased by 1.73%, 5.47%258
and 7.99%, respectively. Within 13 years, the saline-alkali land259
had been largely transformed to salt land (4.52%), farmland (4.0%),260
build-up land (3.17%), and shrimp ponds (2.99%) (Fig. 4).261
In general, this costal area was covered with beach land, saline-262
alkali land and farmland contributing to relatively smaller values263
of VIs. Conversely, the inland region covered with farmland and264
grassland would have relatively higher values of VIs. The regional265
economic development in these two decades led to a significant266
reduction of saline-alkali land and an increase in shrimp pond,267
farmland and built-up land, resulting in a net decrease of LST.268
Because of the inclusion of soil background adjustment factor (L)269
for calculating ANDIV, SAVI and MSAVI, these three VIs are highly270
unlikely to reach saturation easily, thereby resulting in larger adap-271
tation potential for a better drought vulnerability assessment when272
facing drastic changes of LULC conditions.273
3.2. The spatial correlation analysis between LST and VIs274
Although there was a clear negative correlation between LST275
and VI across a variety of spatial and temporal scales (Carlson et al.,276
1995; Sandholt et al., 2002; Chen et al., 2006; Price, 1990; Goward277
and Hope, 1989), our findings could entail the interactions between278
precipitation and temperature impacts on vegetation index by a279
different viewpoint. The long-term changes of LULC might alter the280
perceived relationship between LST and VIs, and it actually led to a281
positive correlation between VIs and LST in some episodes.282
With this said, the spatial correlations between LST and VIs283
(NDVI, ANDVI, SAVI, and MSAVI) can be further analyzed based on284
the remote sensing data sets. Fig. 5 delineates the comparative anal-285
ysis between VIs and LST across different types of VIs. To obtain the286
values of LST in Fig. 5, we queried out index values of pixels by 0.01287
intervals, and then averaged the corresponding pixels for retrieving288
their temperature values.289
The relationships between LST and VIs in 1987 and 2000 were290
both arranged simultaneously with respect to four different types291
of VIs in Fig. 5. Before reaching the first peak (i.e., turning point)292
on these curves of all four cases in Fig. 5, the slopes vary from the293
smallest one in Fig. 5(a) to the largest one in Fig. 5(d) according294
to the fitted linear equations between LST and VIs. This is partially295
due to that the effect of soil background was considered by the296
algorithms of MSAVI and SAVI (Huete, 1988; Qi et al., 1994).297
When the vegetation cover was up to a certain level (e.g., 298
NDVI ≥ 0.18, ANDVI ≥ 0.09, SAVI ≥ 0.11 and MSAVI ≥ 0.10), the 299
areas of concern were limited to those regions being mainly cov- 300
ered with high-density grassland and farmland, resulting in a sharp 301
drop of LST. The trend between VIs and LST was changed to be 302
opposite making them negatively correlated with the correlation 303
coefficient (r) greater than or equal to 0.96. The slopes derived from 304
the fitted linear equations between LST and VIs turned out to be 305
negative. Comparatively, the absolute value of the slope between 306
LST and ANDVI is the biggest whereas the absolute value of the 307
slope between LST and NDVI is the smallest. Because the impact 308
of soil background was considered by the ANDVI algorithm, this is 309
why the values of LST become sensitive to the changes of ANDVI. 310
When looking up Fig. 5 more closely, there are two turning 311
points of the scatter plots of LST versus VIs in 2000 as opposed to the 312
single one in 1987. The first turning point in 2000 occurred in the 313
specific ranges of VIs when NDVI < 0.11, ANDVI < 0.04, SAVI < 0.08 314
and MSAVI < 0.07; these regions are located nearby the shoreline 315
which was mainly covered with beach land and saline-alkali land 316
where the density of vegetation cover was very low, making VIs 317
be positively correlated with LST. It is evidenced by the corre- 318
lation coefficient (r) that is greater than or equal to 0.97. The 319
second turning point in 2000 occurred in the specific ranges of 320
VIs when NDVI > 0.58, ANDVI > 0.19, SAVI > 0.41 and MSAVI < 0.40; 321
these regions were mainly covered with crops (mainly wheat) 322
where the density of vegetation cover was very high, making 323
VIs be positively correlated with LST too. The slopes after the 324
second turning point are smaller than those before the first 325
turning point occurs over all four cases (see Fig. 5). The sec- 326
tions between these two turning points may be classified based 327
on 0.11 < NDVI < 0.58, 0.04 < ANDVI < 0.19, 0.08 < SAVI < 0.41, and 328
0.07 < MSAVI < 0.40, which represent the transition region covered 329
with saline-alkali land and farmland where the density of veg- 330
etation cover was medium. It inevitably made LST sensitive to 331
vegetation cover, resulting in a negative correlation between VIs 332
and LST. This observation is evidenced by the correlation coefficient 333
(r) that is around −0.99 across relevant cases. 334
Overall, with different densities of vegetation cover, there are 335
different patterns between LST and VIs as presented in Fig. 5. When 336
the density of vegetation cover was lower, the correlation between 337
LST and VIs is positive with the correlation coefficients (r) greater 338
than 0.96; conversely, when the density of vegetation cover was 339
medium, the correlation between LST and VIs is negative with the 340
correlation coefficient (r) around −0.99. When the density of vege- 341
tation cover was higher only in 2000, the correlation between LST 342
and VIs turned out to be positive again with the correlation coef- 343
ficient (r) around 0.95. Through our comparative study, since the 344

Please cite this article in press as: Gao, Z., et al., Integrating temperature vegetation dryness index (TVDI) and regional waterstress index (RWSI) for drought assessment with the aid of LANDSAT TM/ETM+ images. Int. J. Appl. Earth Observ. Geoinf. (2010),doi:10.1016/j.jag.2010.10.005
ARTICLE IN PRESSG ModelJAG 379 1–9
6 Z. Gao et al. / International Journal of Applied Earth Observation and Geoinformation xxx (2010) xxx–xxx
Fig. 5. The scatter plots between VIs and LST.
region’s urbanization was more phenomenal in 2000 than that in345
1987, there is negative correlation between VIs and LST in the areas346
covered with higher density vegetation; this negative correlation is347
different with that of positive correlation in 1987 in the areas cov-348
ered with higher density vegetation. The reason of this difference349
is due to the urban heat island (UHI) effect.350
3.3. Integrating TVDI with RWSI for drought assessment351
Integration between RWSI and TVDI led to an innovative scheme352
for drought impact assessment in which RWSI was set as a refer-353
ence basis for addressing regional water deficit with respect to four354
categories to feature a suite of TVDIs (i.e., TVDI NDVI, TVDI ANDVI,355
TVDI SAVI and TVDI MSAVI). Fig. 6 shows the maps of RWSI in 1987356
and 2000, respectively, which imply that the larger the value of357
RWSI the higher the drought impact is.358
In Fig. 6, it can be seen that the regions covered with saline-alkali359
land and low density of grassland exhibited the larger RWSI, both360
of which are mainly located in the transition regions where the ET361
was salient. The soil moisture in this coastal area being covered362
with beach land and the inland area being covered with farmland363
rendered smaller RWSI, which implies a relatively water abundant364
condition. When the range of RWSI is between 0 and 1.68 in 1987365
and between 0 and 1.46 in 2000, the average RWSIs in the study 366
area were 0.54 in 1987 and 0.28 in 2000, respectively. Given that all 367
satellite data (ETM/TM) had gone through radiometric calibration 368
and atmospheric correction, such observations help draw our con- 369
clusion that the degree of water shortage in 1987 was more severe 370
than that in 2000. Since the areas of unused land (saline-alkali land, 371
beach land) in 1987 were larger than those in 2000, the vegetation 372
cover was sparse and the ET was higher in 1987. As a consequence, 373
it resulted in a relatively larger deficit of soil water. 374
Fig. 7 shows the collection of distribution maps of TVDIs in 375
1987 and 2000. Four subgroups were organized for TVDI NDVI 376
and TVDI MSAVI for the purpose of comparison. Numerically, the 377
range of the TVDIs should be between 0 and 1 and the larger 378
values of TVDIs imply the lower soil moisture contents. By com- 379
paring the spatial distributions of TVDIs in 1987 and 2000, the 380
average values of TVDIs of the study area in 1987 are 0.46, 0.43, 381
0.37, and 0.45 associated with TVDI SAVI, TVDI ANDVI, TVDI NDVI, 382
and TVDI MSAVI, respectively. In addition, the average values of 383
TVDIs of the study area in 2000 are 0.41, 0.40, 0.40, and 0.41 asso- 384
ciated with TVDI SAVI, TVDI ANDVI, TVDI NDVI, and TVDI MSAVI, 385
respectively. Hence, three out of four subgroups (i.e., TVDI SAVI, 386
TVDI ANDVI and TVDI MSAVI) confirmed that the water shortage 387
in 1987 was worse than that in 2000. 388

Please cite this article in press as: Gao, Z., et al., Integrating temperature vegetation dryness index (TVDI) and regional waterstress index (RWSI) for drought assessment with the aid of LANDSAT TM/ETM+ images. Int. J. Appl. Earth Observ. Geoinf. (2010),doi:10.1016/j.jag.2010.10.005
ARTICLE IN PRESSG ModelJAG 379 1–9
Z. Gao et al. / International Journal of Applied Earth Observation and Geoinformation xxx (2010) xxx–xxx 7
Fig. 6. The RWSI maps in 1987 and 2000.
Based on the values of TVDI NDVI that were 0.40 in 2000 and389
0.37 in 1987, it can be summarized that the drought was more390
severe in 2000 than that in 1987. Yet the question left over was why391
the values of TVDI NDVI showed such a controversial outcome? The392
exclusion of soil background in NDVI resulted in such discrepancies.393
Conversely, the inclusion of adjustment factor of soil background in394
ANDVI, SAVI, and MSAVI can promote the accuracy of vulnerability395
assessment.396
Because of the affects of soil background, linkages between RWSI397
and TVDIs (TVDI NDVI, TVDI SAVI, TVDI ANDVI and TVDI MSAVI)398
would become more meaningful if the intervals of 0.01 of RWSI may399
be picked up for categorical classification. Such efforts enable us to 400
present a series of deliberate scatter plots in Fig. 8 with a system- 401
atic structure for regional drought assessment. When taking Fig. 8 402
into account, it is indicative that as the values of TVDIs increase 403
the values of RWSI increase too, making them positively correlated 404
with each other in both 1987 and 2000. Such relationships between 405
RWSI and TVDIs can be further illuminated based on the partitioned 406
ranges of RWSI. When the degree of regional drought turned out to 407
be worse and the values of RWSI reached a higher level (RWSI > 0.8 408
or so), the relationship between RWSI and TVDIs became weakened 409
because TVDIs cannot reflect the actual condition of soil moisture. 410
Fig. 7. The TVDIs maps in 1987 and 2000.

Please cite this article in press as: Gao, Z., et al., Integrating temperature vegetation dryness index (TVDI) and regional waterstress index (RWSI) for drought assessment with the aid of LANDSAT TM/ETM+ images. Int. J. Appl. Earth Observ. Geoinf. (2010),doi:10.1016/j.jag.2010.10.005
ARTICLE IN PRESSG ModelJAG 379 1–9
8 Z. Gao et al. / International Journal of Applied Earth Observation and Geoinformation xxx (2010) xxx–xxx
Fig. 8. The scatter plots between the RWSI and the TVDIs.
When the values of RWSI were in between 0 and 0.8, how-411
ever, there was a significant positive correlation between RWSI and412
TVDIs in both 1987 and 2000 with the correlation coefficient (r)413
greater than 0.95. It may be concluded that use of TVDIs for moni-414
toring drought is only suitable for the situations of wet, normal and415
light dry. In other words, when RWSI ≤ 0.82 (the medium dry), the416
values of TVDIs can reflect the drought condition correctly; yet it417
was not the case when RWSI > 0.82 (medium dry and heavy dry). At418
the practical level, the advanced classification of regional drought419
in Table 1 helps such comparisons.420
4. Conclusions421
Three types of drought are commonly noted including meteoro-422
logical, agricultural, and hydrological droughts. This paper presents423
a synergistic approach spatially and temporarily between two424
types of drought indices associated with two reference years of425
1987 and 2000. With the aid of advancements of contemporary426
remote sensing technologies, cross-linkages and -comparisons can427
be made possible to assess these three types of drought in an all-428
inclusive framework. Our culminating experience obtained in a429
field-scale study in China proved the efficacy and effectiveness of430
our approach.431
Both drought indices of TVDIs and RWSI can be tied together 432
to address soil moisture dynamics and drought impacts. When the 433
values of RWSI may be integrated with TVDI SAVI, TVDI ANDVI and 434
TVDI MSAVI for drought assessment, we found that the shortage of 435
soil water in 1987 was more severe than that in 2000. However, 436
the use of TVDI NDVI cannot draw on the same conclusion. It was 437
due to that TVDIs are suitable for monitoring situations of wet, nor- 438
mal and light dry conditions when RWSI < 0.752. In the situation of 439
medium dry as the value of RWSI is smaller than or equal to 0.8, 440
the TVDIs can still monitor drought correctly. Nevertheless, when 441
dealing with medium dry and heavy dry as the value of RWSI is 442
greater than 0.8, TVDIs cannot correctly portray the situation of 443
water shortage for drought assessment. As a consequence, TVDIs 444
should not be used to monitor the medium and heavy drought 445
(RWSI > 0.8). 446
Acknowledgments 447
The authors are grateful for the financial support from the 448
National Natural Science Foundation of China (41071278), the 449
National 973 Key Project of China (2010CB951603), and the USDA 450
CSREES Project (2006-34263-16926). 451

Please cite this article in press as: Gao, Z., et al., Integrating temperature vegetation dryness index (TVDI) and regional waterstress index (RWSI) for drought assessment with the aid of LANDSAT TM/ETM+ images. Int. J. Appl. Earth Observ. Geoinf. (2010),doi:10.1016/j.jag.2010.10.005
ARTICLE IN PRESSG ModelJAG 379 1–9
Z. Gao et al. / International Journal of Applied Earth Observation and Geoinformation xxx (2010) xxx–xxx 9
References452
Bastiaanssen, W.G.M., Menenti, M., Feddes, R.A., 1998a. A remote sensing surface453
energy balance algorithm for land (SEBAL) 1. Formulation. J. Hydrol., 198–212.454
Bastiaanssen, W.G.M., Pelgrum, H., Wang, J., 1998b. A remote sensing surface energy455
balance algorithm for land (SEBAL). 2. Validation. J. Hydrol., 213–229.456
Cao, J., 2002. Analysis of the cause of seawater intrusion in Laizhou Bay of Shandong457
Province. J. Grad. Sun Yat-Sen Univ. (Nat. Sci. Med.) 23, 104–111.Q4458
Carlson, T.N., Gillies, R.R., Schmugge, T.J., 1995. An interpretation of methodologies459
for indirect measurement of soil water content. Agric. For. Meteorol. 77 (3–4),460
191–205.461
Chen, D., Huang, J., Jackson, T.J., 2005. Vegetation water content estimation for corn462
and soybeans using spectral indices derived from MODIS near- and short-wave463
infrared bands. Remote Sens. Environ. 98 (2–3), 225–236.464
Chen, X.L., Zhao, H.M., Li, P.X., Yin, Z.Y., 2006. Remote sensing image-based analysis of465
the relationship between urban heat island and land use/cover changes. Remote466
Sens. Environ. 104, 133–146.467
England, A.W., 1990. Radiobrightness of diurnally heated freezing soil. IEEE Trans.468
Geosci. Remote Sens. 28 (3), 464–476.469
Fensholt, R., Sandholt, I., 2003. Derivation of a shortwave infrared water stress index470
from MODIS near- and shortwave infrared data in a semiarid environment.471
Remote Sens. Environ. 87 (1), 111–121.472
Gao, Z., Zhang, W., Gao, W., Chang, N.B., 2009. Modeling the land surface heat473
exchange process with the aid of moderate resolution imaging spectroradiome-474
ter images. J. Appl. Remote Sens. 3, 033573.475
Gillies, R.R., Carlson, T.N., 1995. Thermal remote sensing of surface soil water con-476
tent with partial vegetation cover for incorporation into climate models. J. Appl.477
Meteorol. 34, 745–756.478
Gillies, R.R., Carlson, T.N., Kustas, W.P., 1997. A verification of the ‘triangle’ method479
for obtaining surface soil water content and energy fluxes from remote mea-480
surements of the normalized difference vegetation index (NDVI) and surface481
radiant temperature. Int. J. Remote Sens. 18 (15), 3145–3166.482
Gitelson, A.A., Kaufman, Y.J., Merzlyak, M.N., 1996. Use of green channel in remote483
sensing of global vegetation from EOS-MODIS. Remote Sens. Environ. 58,484
289–298.485
Goward, S.N., Hope, A.S., 1989. Evaporation from combined reflected solar and emit-486
ted terrestrial radiation: preliminary FIFE results from AVHRR data. Adv. Space487
Res. 9, 239–249.488
Guan, Y.X., Liu, G.H., Wang, J.F., 2001. Saline-alkali land in the Yellow River Delta:489
amelioration zonation based on GIS. J. Geogr. Sci. 11, 313–320.490
Han, L.J., Wang, P.X., Yang, H., Liu, S.M., Wang, J.D., 2006. Study on NDVI-Ts space by491
combining LAI and evapotranspiration. Sci. China Ser. D 49 (7), 747–754.492
Huete, A.R., 1988. A soil adjusted vegetation index (SAVI). Remote Sens. Environ. 25,493
295–309.494
Jackson, R.D., Idso, S.B., 1981. Canopy temperature as a crop water stress indicator.495
Water Resour. Res. 17, 133–138.496
Kogan, F.N., 1995. Application of vegetation index and brightness temperature for497
drought detection. Adv. Space Res. 15 (11), 91–100.498
Liu, Z.Y., Huang, J.F., Wang, F.M., Wang, Y., 2008. Adjusted-normalized difference499
vegetation index for Estimating Leaf Area Index of rice. Sci. Agric. Sin. 41 (10),500
3350–3356.
Makkeasorn, A., Chang, N.B., 2009. Seasonal change detection of riparian zones with 501
remote sensing images and genetic programming in a semi-arid watershed. J. 502
Environ. Manage. 90, 1069–1080. 503
Mcffters, S.K., 1996. The use of the normalized difference water index (NDWI) in the 504
delineation of open water features. Int. J. Remote Sens. 17 (7), 1425–1432. 505
Moran, M.S., Rahman, A.F., Washburne, J.C., 1996. Combining the Penman–Monteith 506
equation with measurements of surface temperature and reflectance to estimate 507
evaporation rates of semiarid grassland. Agric. For. Meteorol. 80 (2–4), 87–109. 508
Moron, M.S., Clarke, T.R., Inoue, Y., 1994. Estimating crop water deficit using the 509
relation between surface air temperature and spectral vegetation index. Remote 510
Sens. Environ. 49, 246–263. 511
Price, J.C., 1977. Thermal inertia mapping: a new view of the earth. J. Geophys. Res. 512
82, 2582–2590. 513
Price, J.C., 1985. On the analysis of thermal infrared imagery: the limited utility of 514
apparent thermal inertia. Remote Sens. Environ. 18, 59–93. 515
Price, J.C., 1990. Using spatial context in satellite data to infer regional scale evapo- 516
transpiration. IEEE Trans. Geosci. Remote Sens. 28, 940–948. 517
Qi, J., Chehbouni, A., Huete, A.R., Kerr, Y.H., Sorooshian, S., 1994. A modified soil 518
adjusted vegetation index. Remote Sens. Environ. 48, 119–126. 519
Qin, Z., Karnieli, A., Berliner, P., 2001. A mono-window algorithm for retrieving 520
land surface temperature from LANDSAT TM data and its application to the 521
Israel–Egypt border region. Int. J. Remote Sens. 22 (18), 3719–3746. 522
Ridd, M.K., 1995. Exploring a V-I-S (vegetation-impervious surface-soil) model for 523
urban ecosystem analysis through remote sensing: comparative anatomy for 524
citied. Int. J. Remote Sens. 16, 2165–2185. 525
Rouse, J.W., Haas, R.H., Schell, J.A., Deering, D.W., 1973. Monitoring vegetation sys- 526
tems in the Great Plains with ERTS. In: Third ERTS Symposium, NASA SP-351 I, 527
pp. 309–317. 528
Sandholt, I., Rasmussen, K., Andersen, J., 2002. A simple interpretation of the surface 529
temperature/vegetation index space for assessment of surface moisture status. 530
Remote Sens. Environ. 79, 213–224. 531
Tucker, C.J., 1979. Red and photographic infrared linear combinations for monitoring 532
vegetation. Remote Sens. Environ. 8, 127–150. 533
Venturini, V., Bisht, G., Islam, S., 2004. Comparison of evaporative fractions estimated 534
from AVHRR and MODIS sensors over South Florida. Remote Sens. Environ. 93 535
(1–2), 77–86. 536
Wang, Q., Ren, Z., Sun, G., 2002. Research on seawater intrusion disaster in south-east 537
coastwise area of Laizhou Bay. Mar. Environ. Sci. 21, 10–13. 538
Wang, C., Qi, J., Moran, S., 2004. Soil moisture estimation in a semiarid rangeland 539
using ERS-2 and TM imagery. Remote Sens. Environ. 90, 178–189. 540
Wang, X., Xie, H., Guan, H., 2007. Different responses of MODIS-derived NDVI to 541
root-zone soil moisture in semi-arid and humid regions. J. Hydrol. 340 (1–2), 542
12–24. 543
Waston, K., Rowen, L.C., Offield, T.W., 1971. Application of thermal modeling in 544
geologic interpretation of IR images. Remote Sens. Environ. 3, 2017–2204. 545
Xu, H., 2006. Modification of normalized difference water index (NDWI) to enhance 546
open water features in remotely sensed imagery. Int. J. Remote Sens. 27 (14), 547
3025–3033. 548
Xue, Y., Cracknell, A.P., 1995. Advanced thermal inertia modeling. Int. J. Remote Sens. 549
16 (3), 431–446. 550