g-20: implications on china prepared for: the school of international business administration (siba)...
TRANSCRIPT

1
G-20: Implications on China
Prepared for: The School of International Business Administration (SIBA) at Shanghai
University of Finance and Economics (SHUFE)
By Maria Monica WihardjaCentre for Strategic and International Studies

2
History of the G20
• G20: “extension of G7”• Evolution:
– 1975 Library Group: senior officials of France, Japan, U.K., U.S., W. Germany needed a forum for major industrial economies
• Adoption of floating exchange rates in early 1970s• Oil crisis in 1973
– 1975 G-6 Summit: France invited and agreed on annual summits
• Include Italy
– 1976 G-7 Summit: economic policy coordination group• Include Canada• Make up 70% of world GDP and 15% of world population

3
• Evolution (cont):– 1997 G-8 Summit
• Include the Russian Federation• Centrally planned economies collapsed (1989 East Germany, 1991
USSR), economic and political landscape changed
– 1999 G-20 Summit• East Asian financial crisis 1997-1998, Russian crisis 1998• G-8 started losing legitimacy for solving the global problems• Emerging economies were excluded from global economic
discussion• New global challenges appeared (HIV/AID, global warming, etc.)• However, G-8 remained to be the major economic forum until 2008• G-8 started losing legitimacy for overcoming the 2008 global crisis.

4
Global Financial Crisis 2008/2009
• G-20 became the Premier Global Economic Forum in 2008:– G-20: November 2008, Washington, D.C.
• Consider cooperative efforts to cope with the crisis• Consider financial regulatory reform and international monetary
system reform to avoid future crisis• Lay foundations for restoring economic growth
– Key policy coordination forum• Help avert a global meltdown (or another great depression)• Coordinated central banks’ financial rescues and rapid liquidity
injection (w/ IFIs, EU)• Coordinated fiscal packages’ enhancement of aggregate demand and
social protection• Avoid trade protectionism

5
• Africa: South Africa• North America: Canada, United States• Latin America: Argentina, Brazil, Mexico, • East Asia: China, Japan, South Korea• South Asia: India• South East Asia: Indonesia• Western Asia: Saudi Arabia• Europe: European Union, France, Germany, Italy, Russia,
Turkey, United Kingdom• Oceania: Australia
Members of the G-20

6
G-8 G-20Membership G-8
Advanced Industrialized countries (high-income countries)
G-20 (G-8 plus additional 11 leading developing countries (emerging industrial countries and middle-income countries + EU)
Shape of World-GNP- Trade- Pop
-56% of the world- 41%- 13%
-76% of the world-61%-62%
Agenda World economy (stability and growth)
Crisis in Financial Market + World Economy
Approach Consultation of policies Cooperation of policies, actions Mutual Assessment
Focus -Economic stability and growth of member economies- Reduction of poverty in DCs and resource mobilization
-Review of effects of measures against the 2008 financial crisis- Agree on measures against future financial crises
Approach to Development
Poverty reduction in DCs (MDGs) Any added role of middle-income countries
7
Development of the G-20 (2009-2012)
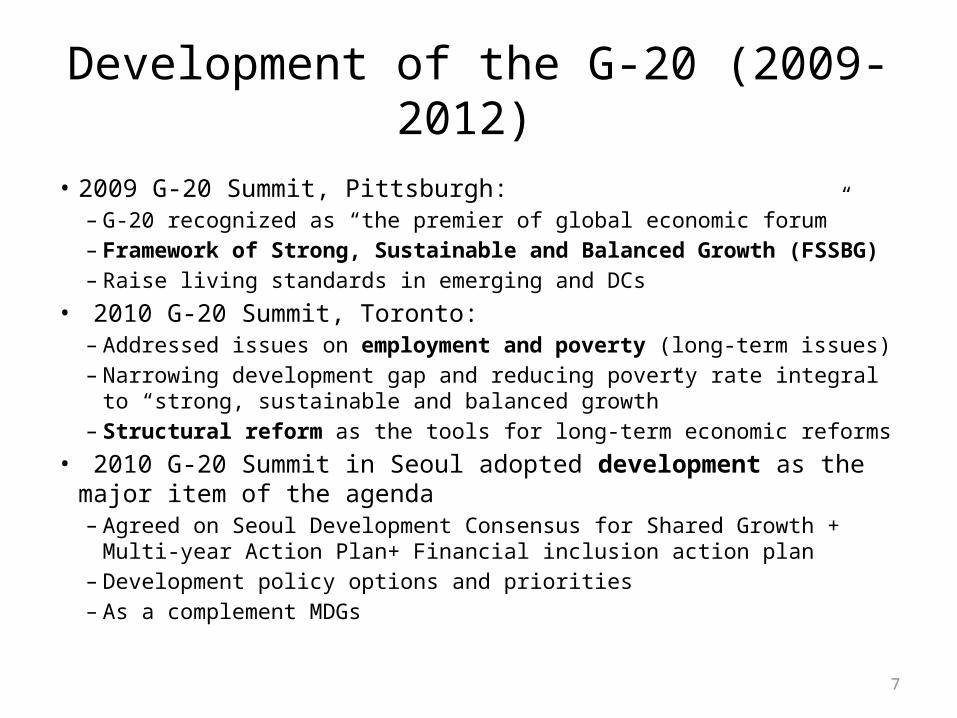
• 2009 G-20 Summit, Pittsburgh:– G-20 recognized as “the premier of global economic forum” – Framework of Strong, Sustainable and Balanced Growth (FSSBG)– Raise living standards in emerging and DCs
• 2010 G-20 Summit, Toronto:– Addressed issues on employment and poverty (long-term issues) – Narrowing development gap and reducing poverty rate integral to “strong,
sustainable and balanced growth” – Structural reform as the tools for long-term economic reforms
• 2010 G-20 Summit in Seoul adopted development as the major item of the agenda– Agreed on Seoul Development Consensus for Shared Growth + Multi-year Action
Plan+ Financial inclusion action plan– Development policy options and priorities – As a complement MDGs

8
• 2011 G-20, Cannes:– Crisis picking-up with no immediate solution– Endorsed the Action Plan on Growth and Jobs– Endorsed the Action Plan on Food Price Volatility
and Agriculture – Endorsed Green Climate Fund– Formalized Troika, consisting of past, present and
future Presidencies

9
• 2012 G-20 Summit, Los Cabos:– The first time that a developing country hosted a G-20 Summit– The world was still in the downside-risk of a crisis– Endorsed the Los Cabos Growth and Jobs Action Plan, balancing growth-job with
austerity and fiscal consolidation– Promoted Inclusive Green Growth as an integral part of FSSBG– Food security and commodity and energy price volatility– Financial Inclusion Peer Learning Program (with Chile and Indonesia)– IMF raised US$456 billion for its “second-line of defense”, with China contributing
US$43 billion (EMs to push for the 2010 IMF quota and voting reform) – Tremendous each-out activities: B-20, Think 20, L-20, Youth -20 – CIGI report on media and public perception:
• Financial regulation reform/ FSB report receive no attention in the 11 G20 capitals surveyed.
• G-20 losing its focus?

10
Mutual Assessment Process:From Pittsburgh to St. Petersburg
• At the 2009 G-20 Summit in Pittsburgh:– MAP was launched to evaluate the consistency of G-20 policies and frameworks with
members’ share growth objectives (FSSBG)– MAP is a new approach to policy collaboration and owned by members of the G-20,
with the goal to ensure that collective policy action will benefit all. • At the 2010 Summit in Seoul:
– “Outlining an action-oriented plan with each member’s concrete policy commitments”
– “Persistently large external imbalances, assessed against indicative guidelines… warrant an assessment of their nature and the root causes of impediments to adjustment as part of MAP…”
• Three pillars: – MAP analysis– Policy progress accountability– Assessment of imbalances (by setting up indicators and indicative guidelines)

11
MAP• The first stage of the MAP: From Pittsburg (2009) to Toronto (2010)
– Aggregate G-20 members’ policy and macroeconomic frameworks – Assess whether members’ policies would help achieve the G-20’s objectives and evaluate alternate policy sessions
• The second stage of the MAP: From Toronto (2010) to Seoul (2010) – An enhanced MAP, with indicative guidelines for key imbalances– Policy commitments by the G-20
• The third stage of the MAP: From Seoul to Cannes– Paris Meeting (February 2011)
• G-20 authorities reached agreement on the key indicators: public debt, fiscal deficits, private saving rate, private debt, and the external balance composed of the trade balance and net investment income flows and transfers
• Seven systemic imbalance countries: China, India, Japan, France, Germany, UK, and US– Washington D.C. Meeting (April 2011)
• G-20 authorities reached agreement on the Indicative Guidelines to identify the presence of large imbalances– In-depth analysis of large imbalances– Progress reports– Updated frameworks
• The current stage of the MAP: Post-Cannes– Near-term actions– Medium-term Policy Imperatives
• G-20 Los Cabos Summit– The Los Cabos Growth and Jobs Action Plan
• The Los Cabos Accountability Assessment Framework • The Los Cabos Accountability Assessment (first assessment)
– Policy Commitments by G-20 Members, including updates to progress reports

12
Reducing Imbalances• To achieve FSSBG, “two rebalancing act” is needed to resolve:
– Internal imbalances• Focuses mainly on public finances
– External imbalances• Focuses mainly current account
– Internal and external imbalances are interlinked via the “S-I=NX” identity• Imbalances are NOT prima facie “bad”
– They warrant remedial action only to the extent that they are underpinned by distortions
– Imbalances can be beneficial if they reflect the optimal allocation of capital across time and space
– Imbalances can be detrimental if they reflect structural shortcomings, policy distortions or market failures.

13
Explaining Imbalances
• Sources of external imbalances in the run-up to the crisis vary widely across the seven economies– Largely reflecting factors that have led domestic
saving behavior to differ widely
• Country in bracket denote those with current account deficits
Private Saving (S-I) Private Dis-saving (S-I)
Public Saving (I) China
Public Dis-saving (I) (India), Japan, (France), Germany
(United States), (United Kingdom)

14
• Countries with current account deficits:– Have low public and private saving (United Kingdom and
United States), or– Have low public saving, which has been offset by high
private saving (France and India)• Countries with current account surpluses:
– Have high national saving, that exceeds high private investment (China), or
– Have high national saving and low investment, which has offset high (modest) public dis-saving in the case of Japan (Germany)

15
Explaining Imbalances• A variety of structural and equilibrium factors have driven public saving behaviors• Factors underpinning fiscal deficits include:
– Japan: • persistently low growth, reflecting a decline in productivity• a shrinking labor force• low investment• the needs of a rapidly aging population
– France, UK, US: • Structural imbalances between tax revenues and spending commitments pre-crisis• Underfunded entitlement obligations• The lack of agreement on fiscal adjustment priorities• The lack of fiscal rules and strict enforcement mechanisms to impose sufficient budgetary
discipline
– India, Japan, US:• Political economy considerations exerting strong pressures on spending and resistance to raising
taxes• A weak revenue system and financial repression (India)

16
• Domestic policy distortions have also played an important role in driving imbalances:– Distortion in financial systems have fueled low private saving and
large current account deficits• UK and US:
– Regulatory and supervisory frameworks distortions were partly responsible for a fundamental breakdown in market discipline and mispricing of risk
– High national saving in China reflects significant underlying distortions
• China:– Inadequate social safety nets, restrictive financial conditions, and undervalued
exchange rate subsidized factor costs, limited dividends and lack of competition in product markets
– This in turn creates massive reserve accumulation, contributing to the low-cost financing of US current account deficit

17
– Weak investment in some advanced economies also reflects policy distortions
• Japan:– Private investment growth (particularly by SMEs) has
remained weak, while corporate savings are large
• India:– Tight financial restrictions have allowed the perpetuations of
large fiscal deficits
• Germany:– Distortion in the financial sector may be a drag on domestic
investment
18
Policy Implication
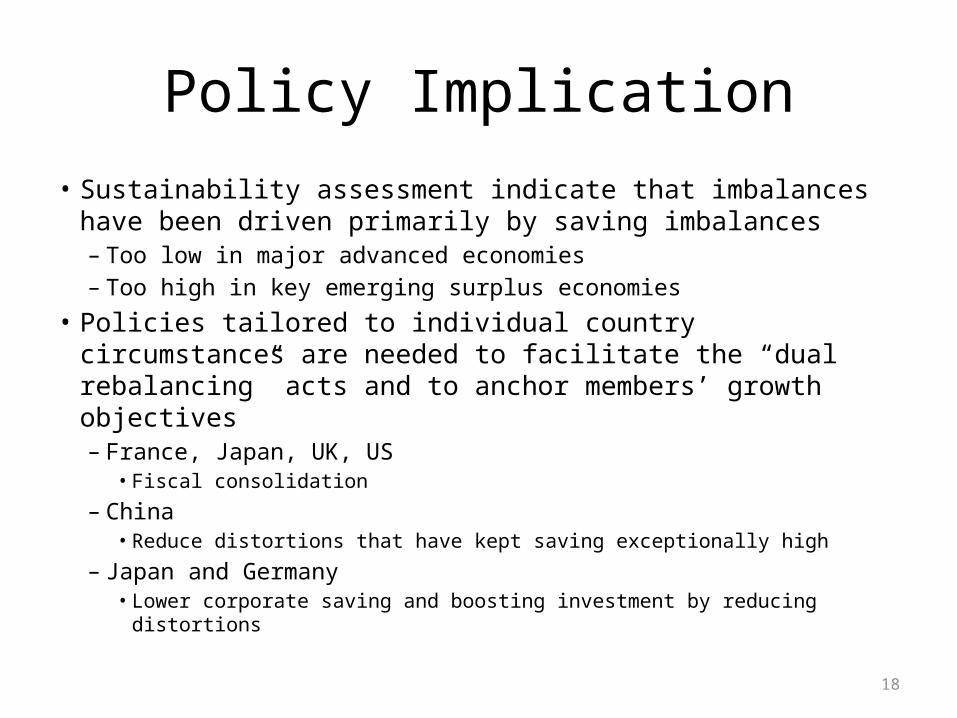
• Sustainability assessment indicate that imbalances have been driven primarily by saving imbalances– Too low in major advanced economies– Too high in key emerging surplus economies
• Policies tailored to individual country circumstances are needed to facilitate the “dual rebalancing” acts and to anchor members’ growth objectives– France, Japan, UK, US
• Fiscal consolidation
– China• Reduce distortions that have kept saving exceptionally high
– Japan and Germany• Lower corporate saving and boosting investment by reducing distortions

19
4 Groups of the G-20:Policy Prescription
Surplus Countries Deficit Countries
Advanced economies Product and labor market reforms
(Germany, Japan, Korea)
Credible fiscal consolidation over the medium term(Australia, Canada, France, Italy, UK, US)
Emerging economies Rebalancing of demand towards domestic sources
(Argentina, China, Saudi Arabia, Russia)
Supply measures to strengthen growth and employment(Brazil, Mexico, Indonesia, South Africa, Turkey)

20
Structural Reform (SR)
• SR have to be included as parts of the strategies in the new growth model:– “The old growth path has become unbalanced, inefficient and
unsustainable because market reforms that have encouraged it are incomplete. Goods markets have been liberalized but other markets are still heavily distorted.” (Drysdale et. al., 2009)
• SR can be defined as:– “Measures to improve institutions and incentives for efficient and
sustainable production, investment and employment, and facilitate fundamental, productivity-increasing changes in the economic structure”
– “Behind-the-border" reforms– They are medium to long-term reforms

21
Why G-20 Leaders Discussed Structural Reform?
• Structural reforms are the keys to rebalance the global imbalance that some experts have argued contributed to the global financial crisis in 2008:– Huang (2010) hypothesized that the global imbalance was partly
rooted in China's factor market cost distortions that artificially boosted China's export competitiveness and inflated China's current account surplus
– In the West, easy credits had lowered savings and leveraged consumption, while deregulated financial market had resulted in excessive leverages of borrowing.
– Excessive savings in the East Asian surplus economies had then been used to finance excessive consumption and "unfruitful" investments such as the housing market in the deficit economies in the West.

22
Why G-20 Leaders Discussed Structural Reform?
Source: OECD
Estimated reduction in potential output (in %) in many developing countries, after the 2008 crisis

23
Why G-20 Leaders Discussed Structural Reform?
Baseline
F isca l conso lida tion²
Baseline
F isca l conso lida tion²
Fiscal conso lida tion² + structural re for
Baseline
F isca l conso lida tion²
Fiscal conso lida tion² + structural re for
100 2.5
80
2.0
60
1.5
40
1.0
20
0.5
0
0.0
Structural reform can do much to sustain growth and reduce global imbalances
Policy simulations, 2016-25 average
World G DP grow th in per cent
OECD gross government debt in per cent of G D P
Global imbalances¹ in per cent of world G D P
4.0 140 3.5
3.5 Fiscal conso lida tion² + structura l re form 120 m 3.0 m
3.0
2.5
2.0
1.5
1.0
0.5
0.0
1. A summary measure of global current account imbalances is constructed as the absolute sum of current balances in each of the main trading countries or regions.
2. Fiscal consolidation including exchange rate response.
Source: OECD calculations.

24
China and the G-20: Why the G-20 is Important to China?
• The G-20 offers a good opportunity for the emerging economies to play a bigger role on the world stage:– Hu Jintao in 2009: “As a platform with wide representative, the G-20 can help the
international community to deal with the international financial crisis.”• The increasing interdependence among different domains:
– Economic relations, climate change, nuclear threats, and the spread of infectious diseases
– Major organizations, such as WTO, IMF, BIS, WB, and WHO, were designed for a specific domain
• The requirement of execution in international affairs:– The rising importance of the spillover effects in macroeconomic and financial stability– The IMF’s unsuccessful role in the multilateral surveillance
• The broader representation with efficiency:– Include almost all the systemic importance countries, both major developed and key
emerging countries– The G-20 has more legitimacy than the G7/G8 and has more efficiency than the UN.

25
China’s view on the G20• China sees the G-20 as the best way to relate to the rest of the world
– It did not otherwise have a spot at the head table• China sees the G-20 as the best way to work towards a reshaping of
the international order to more closely resemble a ‘shareholding’ model, away from the current model of a ‘US-owned family business’.
• The world order should be established upon the principle of multilateralism since the post-cold war era
• China’s diplomatic strategy: – Keeping a low profile and taking a proactive role when feasible
• Generally the attitude of Chinese government towards the G-20 is positive

26
Political Benefits to China
• A chance to participate in global coordination– From a passive state to a proactive state– From outside to inside
• A chance to learn global governance– Emerging markets have less experience with the peer review
process, which have facilitated policy coordination• A chance to represent Chinese position and build China’s
external image• A way to facilitate the adjustment of domestic economic
structure– External strength can help China’s domestic reforms

27
Respect Each Other’s Red Line
• China does NOT support the use of real exchange rates as indicators of monitoring world economic imbalance:– Exchange rate could be one of the reasons, but
not the only reason to imbalance– The optimal policy may or may not imply a
reduction in the deficit or surplus

28
China’s Red Line• China does NOT support the use of international reserves as indicators of
monitoring world economic imbalance:– The International reserve is a by-product of external imbalance and a result of
unreasonable monetary system– Reserve accumulation can provide protection to the economy against sharp
reversals in capital flows– China is not the only country that has accumulated a great amount of foreign
exchange reserves– Almost two-thirds of China’s trade surplus is created by foreign investment
• Its accumulation of foreign exchange reserves is a win-win outcome for both China and foreign investors
– There are other countries that have maintained a trade surplus for a prolonged period of time
• For instance, Germany has kept this surplus for 58 years and Japan for 29 years. China has had it only since 1997
– Technical factor matters
29
The features of China’s Old Development Model
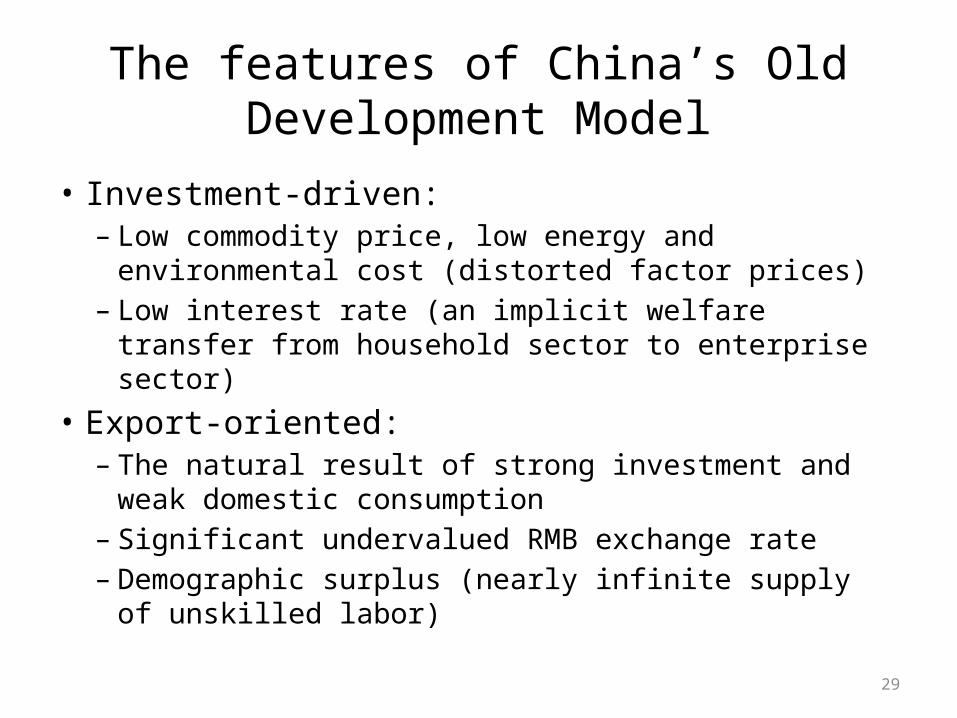
• Investment-driven:– Low commodity price, low energy and environmental cost
(distorted factor prices)– Low interest rate (an implicit welfare transfer from
household sector to enterprise sector)• Export-oriented:
– The natural result of strong investment and weak domestic consumption
– Significant undervalued RMB exchange rate– Demographic surplus (nearly infinite supply of unskilled
labor)

30
The consequences of China’s old development model
• The low consumption ratio and high investment ratio • Significant current account surplus• Even worse, the twin surplus (huge foreign exchange
reserve accumulation)• Industry imbalance (overdeveloped manufacturing industry
and underdeveloped service industry, which leads to low service consumption)
• Strong SOEs and weak small and medium size private enterprises
• Over-reliance on loose monetary policy (high monetized economy)

31
China’s economic growth relies heavily on investment and export
2882
5 -2
052y
yyy
2919
0 -2
052y
yyy
2955
6 -2
052y
yyy
2992
1 -2
052y
yyy
3028
6 -2
052y
yyy
3065
1 -2
052y
yyy
3101
7 -2
052y
yyy
3138
2 -2
052y
yyy
3174
7 -2
052y
yyy
3211
2 -2
052y
yyy
3247
8 -2
052y
yyy
3284
3 -2
052y
yyy
3320
8 -2
052y
yyy
3357
3 -2
052y
yyy
3393
9 -2
052y
yyy
3430
4 -2
052y
yyy
3466
9 -2
052y
yyy
3503
4 -2
052y
yyy
3540
0 -2
052y
yyy
3576
5 -2
052y
yyy
3613
0 -2
052y
yyy
3649
5 -2
052y
yyy
3686
1 -2
052y
yyy
3722
6 -2
052y
yyy
3759
1 -2
052y
yyy
3795
6 -2
052y
yyy
3832
2 -2
052y
yyy
3868
7 -2
052y
yyy
3905
2 -2
052y
yyy
3941
7 -2
052y
yyy
3978
3 -2
052y
yyy
4014
8 -2
052y
yyy
-10%
0%
10%
20%
30%
40%
50%
60%
Private Consumption Fixed Capital Formation Net Export
Percent of GDP
Source: CEIC .

Even compared with the high growth era of developed countries, China’s private consumption expenditure to GDP ratio is extremely low
1092
8 -2
052y
yyy
1202
4 -2
052y
yyy
1311
9 -2
052y
yyy
1421
5 -2
052y
yyy
1531
1 -2
052y
yyy
1640
7 -2
052y
yyy
1750
2 -2
052y
yyy
1859
8 -2
052y
yyy
1969
4 -2
052y
yyy
2079
0 -2
052y
yyy
2188
5 -2
052y
yyy
2298
1 -2
052y
yyy
2407
7 -2
052y
yyy
2517
3 -2
052y
yyy
2626
8 -2
052y
yyy
2736
4 -2
052y
yyy
2846
0 -2
052y
yyy
2955
6 -2
052y
yyy
3065
1 -2
052y
yyy
3174
7 -2
052y
yyy
3284
3 -2
052y
yyy
3393
9 -2
052y
yyy
3503
4 -2
052y
yyy
3613
0 -2
052y
yyy
3722
6 -2
052y
yyy
3832
2 -2
052y
yyy
3941
7 -2
052y
yyy
4051
3 -2
052y
yyy
30%
40%
50%
60%
70%
80%
90%
United States Japan Germany China
Private Consumption to GDP Ratio
Source: CEIC .

33
And China’s investment to GDP ratio is extremely high 10
928
-205
2yyy
y12
024
-205
2yyy
y13
119
-205
2yyy
y14
215
-205
2yyy
y15
311
-205
2yyy
y16
407
-205
2yyy
y17
502
-205
2yyy
y18
598
-205
2yyy
y19
694
-205
2yyy
y20
790
-205
2yyy
y21
885
-205
2yyy
y22
981
-205
2yyy
y24
077
-205
2yyy
y25
173
-205
2yyy
y26
268
-205
2yyy
y27
364
-205
2yyy
y28
460
-205
2yyy
y29
556
-205
2yyy
y30
651
-205
2yyy
y31
747
-205
2yyy
y32
843
-205
2yyy
y33
939
-205
2yyy
y35
034
-205
2yyy
y36
130
-205
2yyy
y37
226
-205
2yyy
y38
322
-205
2yyy
y39
417
-205
2yyy
y40
513
-205
2yyy
y
0%5%
10%15%20%25%30%35%40%45%50%
United States Japan Germany China
Source: CEIC .
Fixed Asset Formation to GDP Ratio

34
Japan, Germany and China all have a significant currency account surplus
19891990
19911992
19931994
19951996
19971998
19992000
20012002
20032004
20052006
20072008
20092010
-8.0
-6.0
-4.0
-2.0
0.0
2.0
4.0
6.0
8.0
10.0
12.0
United States Japan Germany China
Current Account to GDP Ratio
Source: IMF’s WEO .

35
China has a persistent twin surplus since 1999, and U.S.’s overall BOP is more balanced
China
30286 -2052yy
yy
31017 -2052yy
yy
31747 -2052yy
yy
32478 -2052yy
yy
33208 -2052yy
yy
33939 -2052yy
yy
34669 -2052yy
yy
35400 -2052yy
yy
36130 -2052yy
yy
36861 -2052yy
yy
37591 -2052yy
yy
38322 -2052yy
yy
39052 -2052yy
yy
39783 -2052yy
yy-50.0
0.0
50.0
100.0
150.0
200.0
250.0
300.0
350.0
400.0
450.0
Current Account Capital and Financial Account
United States
25903 -2052yy
yy
26999 -2052yy
yy
28095 -2052yy
yy
29190 -2052yy
yy
30286 -2052yy
yy
31382 -2052yy
yy
32478 -2052yy
yy
33573 -2052yy
yy
34669 -2052yy
yy
35765 -2052yy
yy
36861 -2052yy
yy
37956 -2052yy
yy
39052 -2052yy
yy
40148 -2052yy
yy-1,000.0
-800.0
-600.0
-400.0
-200.0
0.0
200.0
400.0
600.0
800.0
1,000.0
Current Account Capital and Financial Account
Source: CEIC .

36
And the same for Japan and GermanyJapan
28460 -2052yy
yy
29190 -2052yy
yy
29921 -2052yy
yy
30651 -2052yy
yy
31382 -2052yy
yy
32112 -2052yy
yy
32843 -2052yy
yy
33573 -2052yy
yy
34304 -2052yy
yy
35034 -2052yy
yy
35765 -2052yy
yy
36495 -2052yy
yy
37226 -2052yy
yy
37956 -2052yy
yy
38687 -2052yy
yy
39417 -2052yy
yy
40148 -2052yy
yy-200.0
-150.0
-100.0
-50.0
0.0
50.0
100.0
150.0
200.0
250.0
Current Account Capital and Financial Account
Germany
26268 -2052yy
yy
27364 -2052yy
yy
28460 -2052yy
yy
29556 -2052yy
yy
30651 -2052yy
yy
31747 -2052yy
yy
32843 -2052yy
yy
33939 -2052yy
yy
35034 -2052yy
yy
36130 -2052yy
yy
37226 -2052yy
yy
38322 -2052yy
yy
39417 -2052yy
yy
40513 -2052yy
yy-300.0
-200.0
-100.0
0.0
100.0
200.0
300.0
Current Account Capital and Financial Account
Source: CEIC .

37
China is a major international creditor, but the investment income is very small if compared with other countries
19891990
19911992
19931994
19951996
19971998
19992000
20012002
20032004
20052006
20072008
20092010
-2.0
-1.0
0.0
1.0
2.0
3.0
4.0
United States Japan Germany China
Overseas investment income to GDP ratio
Source: IMF’s WEO.

38
The Manufacturing sector in China is very large
19911992
19931994
19951996
19971998
19992000
20012002
20032004
20052006
20072008
20092010
25%
30%
35%
40%
45%
50%
United States Japan Germany China
The output of second industry to GDP ratio
Including mining, manufacturing, construction and utility. Source: IMF’s WEO.

39
The service sector in China is significantly underdeveloped
19911992
19931994
19951996
19971998
19992000
20012002
20032004
20052006
20072008
20092010
30%
35%
40%
45%
50%
55%
60%
65%
70%
75%
United States Japan Germany China
The output of service industry to GDP ratio
Source: IMF’s WEO.

40
China has a relatively lower fiscal deficit
19891990
19911992
19931994
19951996
19971998
19992000
20012002
20032004
20052006
20072008
20092010
-14.0
-12.0
-10.0
-8.0
-6.0
-4.0
-2.0
0.0
2.0
4.0
United States Japan Germany China
Fiscal Position to GDP Ratio, %
Source: IMF’s WEO.

41
China has a much lower public debt
19891990
19911992
19931994
19951996
19971998
19992000
20012002
20032004
20052006
20072008
20092010
0.0
50.0
100.0
150.0
200.0
250.0
United States Japan Germany China
Public Debt to GDP Ratio, %
Source: IMF’s WEO.

42
China’s M2 to GDP ratio is extremely high
21885 -2052yy
yy
22981 -2052yy
yy
24077 -2052yy
yy
25173 -2052yy
yy
26268 -2052yy
yy
27364 -2052yy
yy
28460 -2052yy
yy
29556 -2052yy
yy
30651 -2052yy
yy
31747 -2052yy
yy
32843 -2052yy
yy
33939 -2052yy
yy
35034 -2052yy
yy
36130 -2052yy
yy
37226 -2052yy
yy
38322 -2052yy
yy
39417 -2052yy
yy
40513 -2052yy
yy20%40%60%80%
100%120%140%160%180%200%
United States Japan German China
M2 to GDP Ratio
Source: CEIC .

43
Why does China have to change its development model?
• The shrinkage of external demand after the burst of global financial crisis: the deleveraging of U.S. households; the deepening of the EU Zone debt crisis
• The excess capacity and low yields of China’s huge investment of manufacturing and infrastructure due to the weak domestic consumption
• New NPL wave and fiscal problem• The demographic surplus is vanishing• The bottleneck of energy and commodities (China’s term of trade is
exacerbating)• The safety of foreign exchange reserve suffering new potential shocks• The risks of higher inflation and asset price bubbles are looming

44
China’s Policy Commitment to the G-20 and Its ‘Significant’ Progress
• Fiscal policy:– Continue to implement a pro-active fiscal policy
• Reduce the fiscal deficit to around -1.5% of GDP (2012)• In 2011, it was -1.8% of GDP
– Strengthen efforts to manage local government debts and prevent risks
• Further improve the structural tax reduction policies– Raising the individual income tax threshold on salaries from 2000 yuan to 3500
yuan per month and adjusted the tax rate base– Continuing to implement preferential income tax policy for some small businesses
with low profits and initiating a series of relief and exemption policies for tax and fee
– Putting into effect lower provisional import tariffs on over 700 resource products, basic raw materials and key components
• Strictly control new debts of local governments

45
– Significantly enhance the ability of fiscal macro-regulation, further optimize the structure of fiscal revenue and expenditure, make further progress in fiscal and taxation reform, improve the scientific and meticulous management of public finance, and build a fiscal and taxation system conducive to the transformation of economic development pattern (2011-2015).
• Continuing to expand household consumption • Supporting to improve people’s living standards• Advancing the fiscal and taxation reform

46
• Monetary and exchange rate policy– Implement a prudent monetary policy and keep
FRE (Aggregate Financing to the Real Economy) at at an appropriate level. (2011, 2012)
• Broad money supply (M2) increases by 16% in 2011 and 14% in 2012
– Improve conduct of monetary policy • Optimize monetary policy target system, improve the
transmission mechanism and environment of monetary policy

47
– Further promote the reform of RMB exchange rate regime (Medium-term to long-term)
• As of March 30, 2012, the central parity of RMB/USD exchange rate appreciated by 5.22% since the end-2010 and 31.49% since July 2005.
• As of February 2012, RMB REER appreciated by 30.28% since July 2005, ranking 4th in the 58 countries in terms of appreciation.
– Promote foreign exchange management regime reform
• Foreign reserves grows at a slower pace, and even declines in late 2011

48
– Expand the use of RMB in cross-border trade and investment
• In Dec. 2011, RMB Qualified Foreign Institutional Investors scheme was launched, allowing HK-based subsidiaries of mainland fund management companies and securities companies to use RMB raised in HK to invest in securities in the mainland.
• In March 2012, all qualified enterprises were allowed to settle exports in RMB
• Capital account convertibility – With regards to RMB FDI, the process of capital verification inquiry and
reinvestment is streamlined, and the approval process for purchase and payment in foreign exchange is removed.
– Both domestic and foreign funded enterprises are allowed to use foreign currency receipts as collateral to obtain RMB loans

49
• Financial sector policy– Further promote financial reforms
• Deepen the reform in financial institutions• Optimize modern financial corporate system• Strengthen internal governance and risk management• Accelerate the development of multi-level financial
market system• Promote the establishment of a counter-cyclical macro-
prudential policy framework• Strengthen the financial regulation and improve financial
supervision coordination

50
• Structural Reform– Promote the strategic adjustment of economic structure (2011-2015)
• The household consumption rate increases– Demand structure become more balanced among investment, consumption and export– In 2011, domestic demand contributed 106 % to growth– Contribution of final consumption rose to 52%, compared with 42% in 2010
• Promote a basically balanced BOP account– Trade surplus falls to a six-year low, decreasing by 48% from 2008-2011, from 6.7 percent of GDP to 2.6% – Current surplus as a percent of GDP drops from the record high of 10.1 in 2007 to 2.76 in 2011– Policy adjustments have been made that remove barriers, including encouraging the use of foreign
exchange, encouraging imports, and accelerating the Going Global Strategy– Outward investment averaged, 39.1bilion USD annually from 2006 to 2010, up 870% from the average
level in 2001-2005– In 2011, China announced a zero tariffs treatment for imports under 97% items from least developed
countries
• Accelerate the development of the service sector and raise its value-added contribution to the GDP by 4%
– Increase the urbanization rate by 4%– Urbanization rate exceeds 50% as end-2011
• Increase spending on R&D to 2.2% of GDP

51
– Comprehensively improve the people’s well-being (2011-2015)• Create and extra 45 million urban jobs and keep registered urban employment no higher than
5%– Urban registered unemployment rate stayed at a low level of 4.1% at end-2011– Household income keeps increasing in 2011
• The per capita disposable income of urban residents and the per capita net income of rural residents will rise by an average annual rate of over 7% in real terms.
– Household income keeps increasing in 2011, with net per capita income of rural residents up by 11.4% in real terms, the highest rate since 1985
– Per capital disposable income or urban residents up by 8.4% in real terms, representing a closing income gap
• Increase the proportion of expenses for medial treatment paid out of the medical insurance fund to over 70% in accordance with relevant policies
– Universal coverage of medial insurance is achieved– Government subsidy for medial insurance keeps increasing– Over 75% of hospitalization costs is now covered for urban employees, and 70% for urban and rural
residents treated at designated hospitals at or below level two
• Low-income housing will be made available to around 20% of the country’s urban households– In 2011, spending on affordable housing project by the central government rose by 220 percent yoy to
171.3 billion yuan

52
China’s Global Prospects• The reforms in the past decades have been very successful, yielding
average annual growth of 10%• The Chinese economy will be as large as the US economy at
international PPP measures by 2020-22 and it will continue to grow thereafter– PPP measure of Chinese GDP place it around 90% of the US today– By International PPP measure (national accounts converted to the then
exchange rate), the Chinese economy has grown from being 11% of the US economy at turn of century 54% this year
– Rate of convergence was 10% between 2000-2007, 14% between 2007-2011 and around 12% this year
• But, China has to move away from the old development model to the new development model

53
• Given its low current account surplus in 2012 (about 2% of the trade surplus), it was no longer possible to claim that China was making a significant contribution to global imbalances
• This external rebalancing is linked to the steady appreciation of the Chinese currency and market pressures at home.

54
• The internalization of the RMB – There is a potential deadline of such reform to be carried out in
2015 when IMF revises currency basket that makes up the SDR• Economic risks that China faces:
– The most important reform needed to avoid risks to Chinese growth is the liberalization of capital markets and the capital account
– Chinese government is concerned about the risk of inflation if capital account is liberalized while exchange rate controls are maintained
– State capitalism becoming an important objective again since the 2008 GFC is seen as a risk

55
• Other risks that China faces:– Climate risks– Domestic political risk– Internal instability resulting from income
inequality– Risk of fracture in the international system if a
better way of managing relations between states is not found

56
Summary• With growing inter-dependence across domains, the G-20 is important and
necessary to China• China sees the G-20 as the best structure of global governance with respect to
creating a balance between legitimacy and efficiency, and as the best way to relate to the rest of the world
• China’s old development model is no longer sustainable because it creates both internal and external imbalances
• The G-20 can help China perform its structural reforms to reduce these internal and external imbalances
• The success of the Chinese government in dealing with structural change in the past is seen as a cause for optimism
• China faces tremendous prospects to play a greater global role, not only in term of economic but also other non-economic sectors
• However, it also faces tremendous risks should it fail to reform both economically and politically.

57
References• Blancard, Olivier, “A problem shared is a problem halved: the G-20’s Mutual Assessment Process,” iMFdirect, August 26,
2012• EABER-SABER roundtable and public forum digest, “Thinking about the Asian Century,” Canberra, April 17-18, 2012• Hadiyanto, Andin (Center for International Cooperation Policy, Ministry of Finance), “Structural reforms in the G-20,”
presented at CSIS Seminar, “Indonesia’s structural reforms commitment at the G20 and APEC,” August 2, 2011 • IMF, The G-20 Mutual Assessment Process, FactSheet, (http://www.imf.org/external/np/exr/facts/g20map.htm)• IMF, 2012 IMF Staff Reports for the G-20 Mutual Assessment Process (http://www.imf.org/external/np/g20/map2012.htm)• Konrad Adenauer Stiftung International Symposium, “The G-20 Processs: Perceptaions and Perspectives for Global
Governance”, Seoul, May 26-27, 2011:– Ming Zhang (Institute of World Economics and Politics, CASS), “The Transition of China’s Development Model” (slide
presentation)– Huang Wei (Institute of World Economics and Politics, CASS), “A Chinese Prospective to the G20” (slide presentation)– Jiang Shixue (Institute of European Studies, CASS), “China-EU Cooperation in the G20” (slide presentation)
• Lee, Kye Woo (KDI School of Public Policy and Management), “Why Development and MDGs at G-20 Summits,” materials from the G-20 Korea Global Leaders Fellowship Seminar, April-May, 2012
• The G-20 Los Cabos Summit, 2012– The Policy Commitments by G-20 Countries, Los Cabos, 2012– The Los Cabos Growth and Job Actions Plan, Los Cabos, 2012
• Author’s various personal notes