fy21 budget outlook...1 covid-19 industry guidance: public transit and intercity passenger rail, may...
TRANSCRIPT
FY21 Budget OutlookMay 14, 2020
1
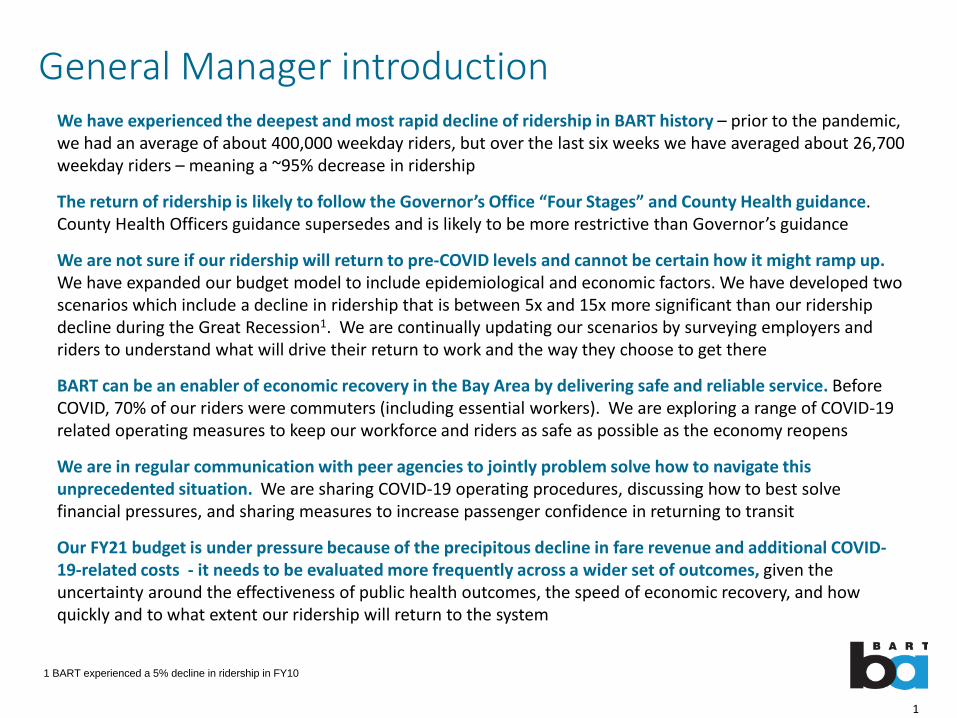
General Manager introductionWe have experienced the deepest and most rapid decline of ridership in BART history – prior to the pandemic, we had an average of about 400,000 weekday riders, but over the last six weeks we have averaged about 26,700 weekday riders – meaning a ~95% decrease in ridership
The return of ridership is likely to follow the Governor’s Office “Four Stages” and County Health guidance. County Health Officers guidance supersedes and is likely to be more restrictive than Governor’s guidance
We are not sure if our ridership will return to pre-COVID levels and cannot be certain how it might ramp up. We have expanded our budget model to include epidemiological and economic factors. We have developed two scenarios which include a decline in ridership that is between 5x and 15x more significant than our ridership decline during the Great Recession1. We are continually updating our scenarios by surveying employers and riders to understand what will drive their return to work and the way they choose to get there
BART can be an enabler of economic recovery in the Bay Area by delivering safe and reliable service. Before COVID, 70% of our riders were commuters (including essential workers). We are exploring a range of COVID-19 related operating measures to keep our workforce and riders as safe as possible as the economy reopens
We are in regular communication with peer agencies to jointly problem solve how to navigate this unprecedented situation. We are sharing COVID-19 operating procedures, discussing how to best solve financial pressures, and sharing measures to increase passenger confidence in returning to transit
Our FY21 budget is under pressure because of the precipitous decline in fare revenue and additional COVID-19-related costs - it needs to be evaluated more frequently across a wider set of outcomes, given the uncertainty around the effectiveness of public health outcomes, the speed of economic recovery, and how quickly and to what extent our ridership will return to the system
1 BART experienced a 5% decline in ridership in FY10

2
Budget summaryUncertainty in both revenue and demand for service• Wide range of possible outcomes - average FY21 ridership could range from 15% to 50% of pre-COVID
and may not recover to 100% until FY23 or later• Reductions in service could reduce spend by 10%, but could force 35% of riders off the system to
support physical distancing• BART’s FY21 plan must be flexible:
• Enhance service to support recovery / meet health standards• Maintain fiscal stability even if revenue recovery is slow
Sharply lower revenue• Forecast revenue loss of up to $600M: FY20 (up to $180M) + FY21 (up to $420M)
• CARES Act will offset only part of this loss • Public health guidance may limit per-car capacity for an extended period• Impacts to fare revenue will last beyond FY21
Increased demands on resources• PPE, disinfecting, and other operational strategies needed (FY21 Est. $40-75M)• Enhanced peak service required for physical distancing as ridership recovers
Additional fiscal support from state and federal governments will be required
3
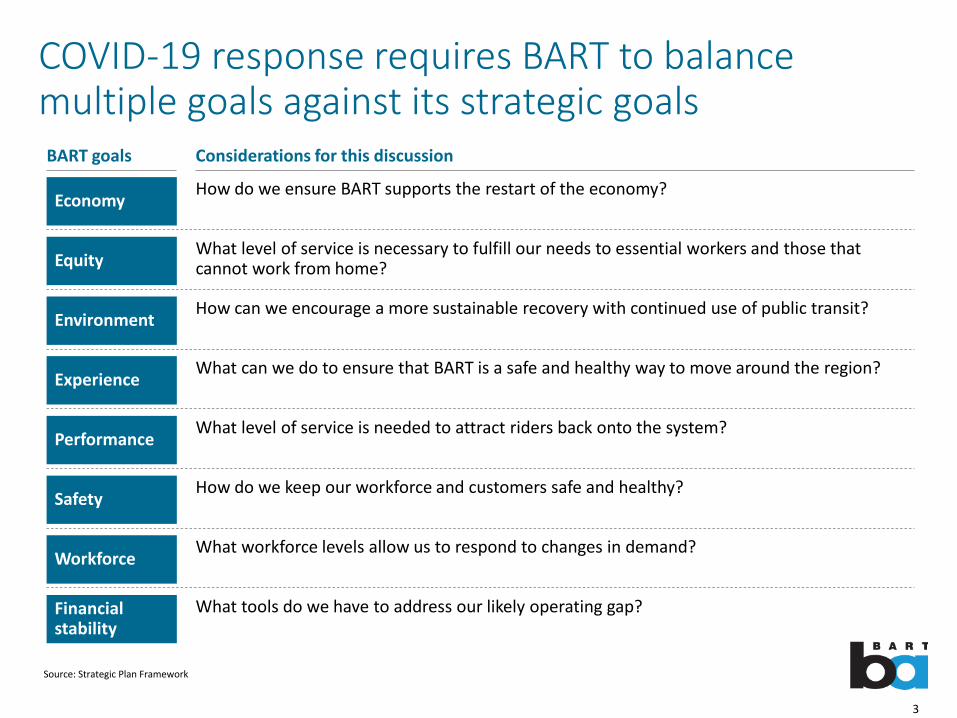
COVID-19 response requires BART to balance multiple goals against its strategic goalsBART goals Considerations for this discussion
Economy
Equity
Environment
Experience
Performance
Safety
Workforce
Financial stability
How do we ensure BART supports the restart of the economy?
What level of service is necessary to fulfill our needs to essential workers and those that cannot work from home?
How can we encourage a more sustainable recovery with continued use of public transit?
What can we do to ensure that BART is a safe and healthy way to move around the region?
What level of service is needed to attract riders back onto the system?
How do we keep our workforce and customers safe and healthy?
What workforce levels allow us to respond to changes in demand?
What tools do we have to address our likely operating gap?
Source: Strategic Plan Framework
4
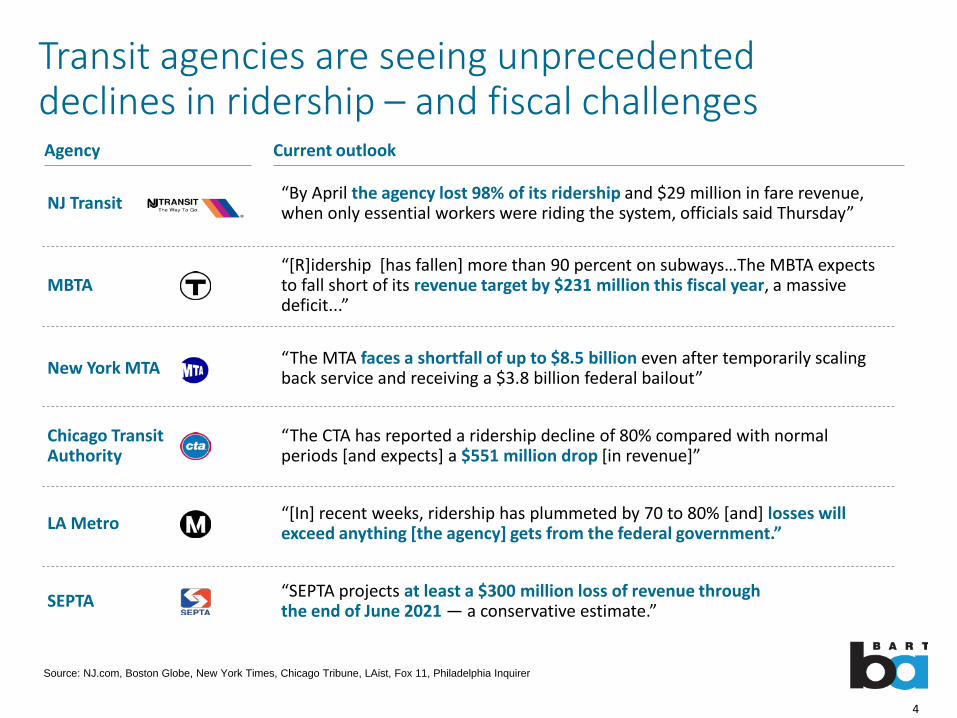
Transit agencies are seeing unprecedented declines in ridership – and fiscal challenges
Source: NJ.com, Boston Globe, New York Times, Chicago Tribune, LAist, Fox 11, Philadelphia Inquirer
Agency
NJ Transit
MBTA
New York MTA
Chicago Transit Authority
LA Metro
SEPTA
“By April the agency lost 98% of its ridership and $29 million in fare revenue, when only essential workers were riding the system, officials said Thursday”
“[R]idership [has fallen] more than 90 percent on subways…The MBTA expects to fall short of its revenue target by $231 million this fiscal year, a massive deficit...”
“The MTA faces a shortfall of up to $8.5 billion even after temporarily scaling back service and receiving a $3.8 billion federal bailout”
“The CTA has reported a ridership decline of 80% compared with normal periods [and expects] a $551 million drop [in revenue]”
“[In] recent weeks, ridership has plummeted by 70 to 80% [and] losses will exceed anything [the agency] gets from the federal government.”
“SEPTA projects at least a $300 million loss of revenue through the end of June 2021 — a conservative estimate.”
Current outlook

5
Illustrative
Dem
and
for r
ider
ship
1
42
3
5Vaccine widely available
Key questions
1
2
3
5
4How deep is the trough?
What does ramp-up look like? What is the post-vaccine next normal?
What is the impact of a potential viral resurgence?
What is the pre-vaccine next normal?
Source: BART
X Major driver for FY21 budget
Time
Illustrative progression of ridership
BART has developed an outlook for ridership based on epidemiological and economic factors

6
Ridership will depend on public health guidelines, economic recovery, and passenger sentiment
Approach
100
~10
~5
~25
~5
~90
~85
~60
~55
“Pre-vaccine next normal”% relative to pre-COVID1
1 Represents BART ridership before a vaccine is widely available – would be reached in Fall 2020 under “Faster Ramp” scenarioSource: BART FY2021 monthly ridership forecasts, BART rider segmentation survey data, BART historical monthly ridership, Oxford Economics unemployment projections, Bureau of Labor Statistics historical unemployment, BART ridership data, COVID 19 Consumer Survey April 2020, Oxford economics jobs by industry in Bay Area counties, Slack HQ, Gartner, KFF
Pre-COVID ridership
Economic impact: How many reasons will passengers have to travel?
Passenger preference: Of remaining riders, how many work from home?
Public health guidance: What fraction of vulnerable populations will ride BART?
Passenger confidence: Of remaining riders, how many will choose BART?
FY21 monthly forecasts for ridership with Silicon Valley Extension
Assumes impact of unemployment is proportional to impact during 2009 recession
In the Bay Area, ~33% of workers have the option of working from home, of which ~10% are expected to work from home permanently
Assumes 50% of vulnerable population returns to BART; this includes adults 65 years and older and adults with pre-existing conditions
Assumes riders come back in line with the fraction that say they will return “after half my community is willing to ride”
7
FY21
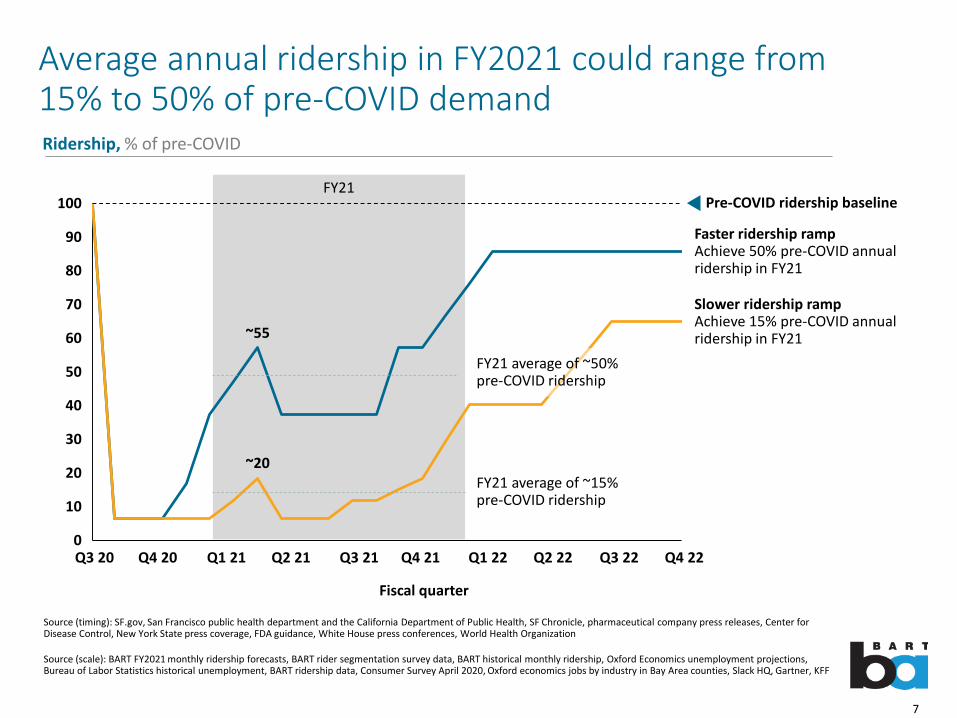
Average annual ridership in FY2021 could range from 15% to 50% of pre-COVID demand
70
60
50
20
0
40
10
30
80
90
100 Pre-COVID ridership baseline
Faster ridership rampAchieve 50% pre-COVID annualridership in FY21
Slower ridership rampAchieve 15% pre-COVID annual ridership in FY21~55
~20
Q3 20 Q4 20 Q1 21 Q2 21 Q3 21 Q4 21 Q1 22 Q2 22 Q3 22 Q4 22
Fiscal quarter
Source (scale): BART FY2021 monthly ridership forecasts, BART rider segmentation survey data, BART historical monthly ridership, Oxford Economics unemployment projections, Bureau of Labor Statistics historical unemployment, BART ridership data, Consumer Survey April 2020, Oxford economics jobs by industry in Bay Area counties, Slack HQ, Gartner, KFF
Source (timing): SF.gov, San Francisco public health department and the California Department of Public Health, SF Chronicle, pharmaceutical company press releases, Center for Disease Control, New York State press coverage, FDA guidance, White House press conferences, World Health Organization
FY21 average of ~50% pre-COVID ridership
FY21 average of ~15% pre-COVID ridership
Ridership, % of pre-COVID
8
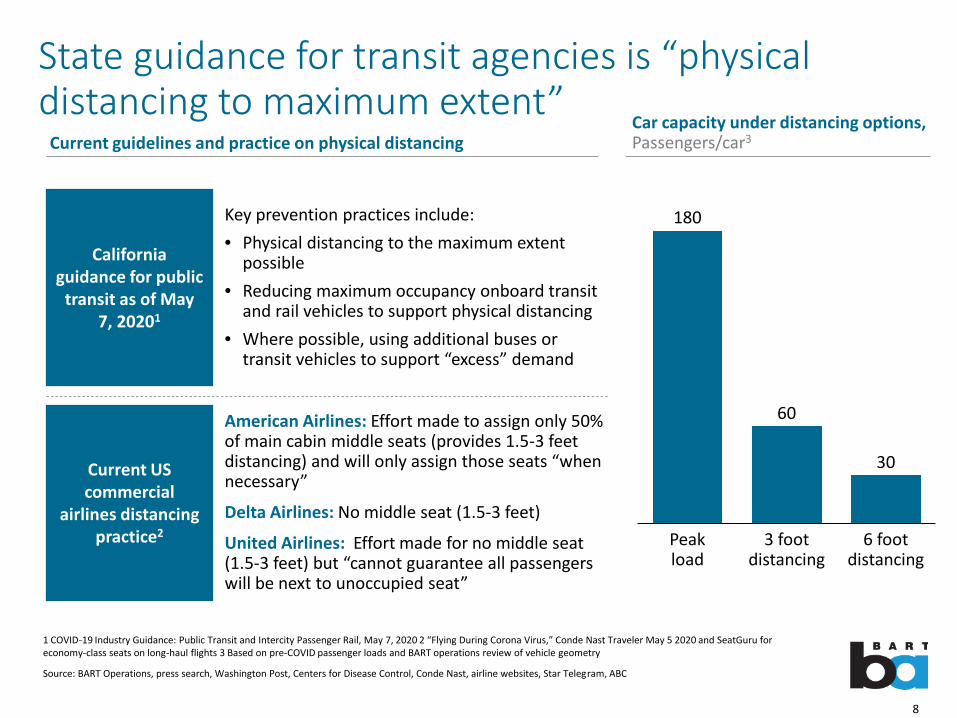
State guidance for transit agencies is “physical distancing to maximum extent”
1 COVID-19 Industry Guidance: Public Transit and Intercity Passenger Rail, May 7, 2020 2 “Flying During Corona Virus,” Conde Nast Traveler May 5 2020 and SeatGuru for economy-class seats on long-haul flights 3 Based on pre-COVID passenger loads and BART operations review of vehicle geometry
Source: BART Operations, press search, Washington Post, Centers for Disease Control, Conde Nast, airline websites, Star Telegram, ABC
180
60
30
3 footdistancing
Peakload
6 footdistancing
Current guidelines and practice on physical distancing
Key prevention practices include: • Physical distancing to the maximum extent
possible• Reducing maximum occupancy onboard transit
and rail vehicles to support physical distancing• Where possible, using additional buses or
transit vehicles to support “excess” demand
California guidance for public
transit as of May 7, 20201
American Airlines: Effort made to assign only 50% of main cabin middle seats (provides 1.5-3 feet distancing) and will only assign those seats “when necessary”
Delta Airlines: No middle seat (1.5-3 feet)
United Airlines: Effort made for no middle seat (1.5-3 feet) but “cannot guarantee all passengers will be next to unoccupied seat”
Current US commercial
airlines distancing practice2
Car capacity under distancing options, Passengers/car3
9
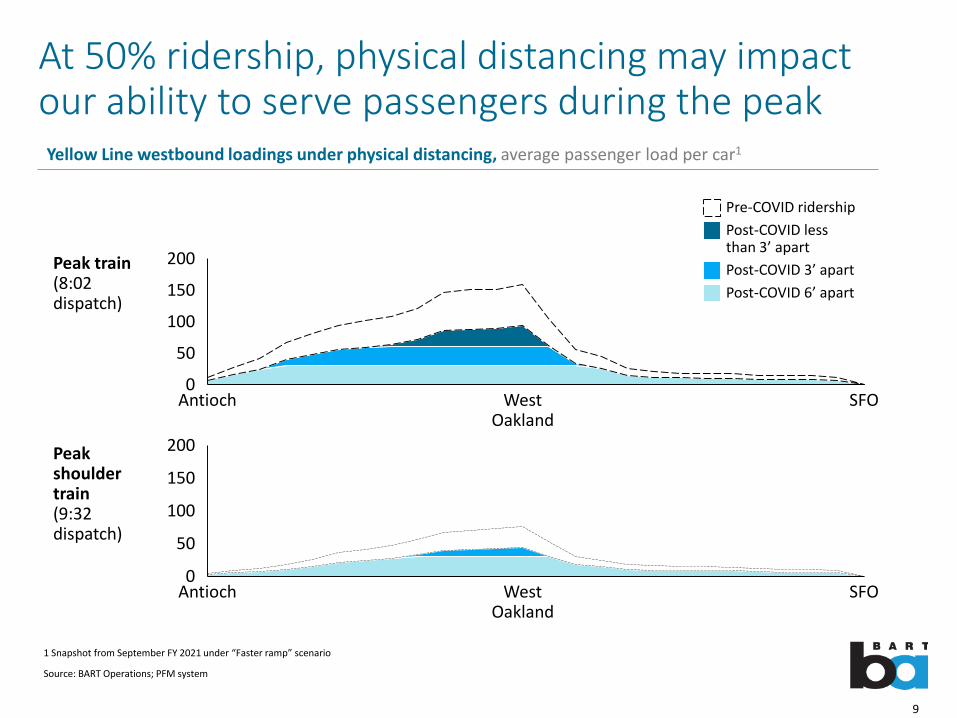
At 50% ridership, physical distancing may impactour ability to serve passengers during the peak
1 Snapshot from September FY 2021 under “Faster ramp” scenario
Source: BART Operations; PFM system
100
0
50
150
200
SFOWest Oakland
Antioch
Yellow Line westbound loadings under physical distancing, average passenger load per car1
Peak train (8:02 dispatch)
Peak shoulder train (9:32 dispatch)
0
50
150
100
200
West Oakland
Antioch SFO
Post-COVID 6’ apart
Pre-COVID ridershipPost-COVID lessthan 3’ apartPost-COVID 3’ apart
10
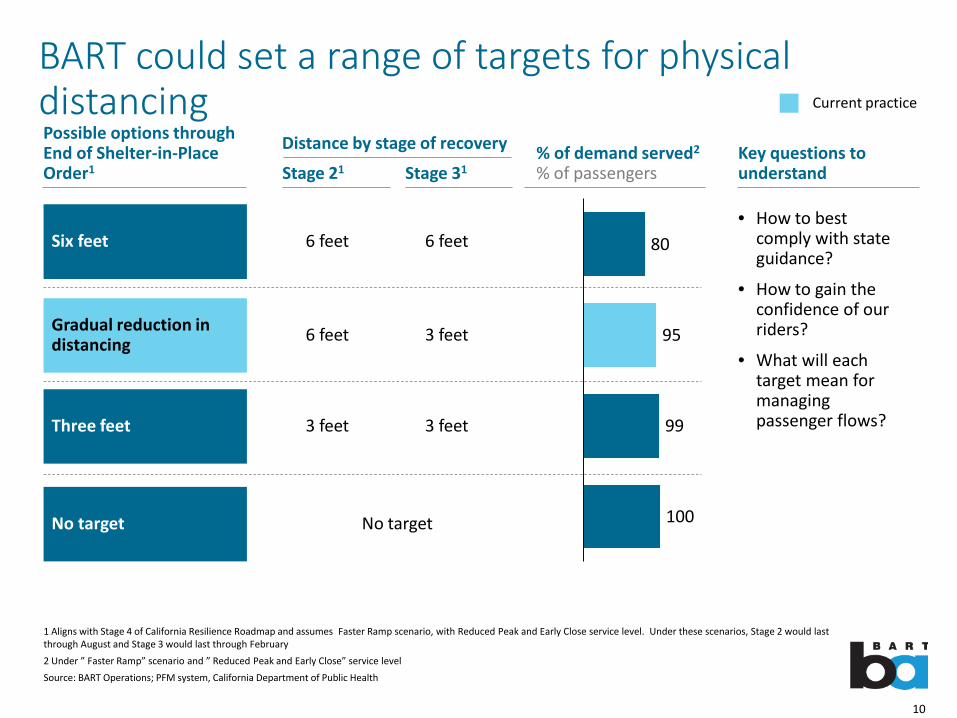
80
95
99
100
1 Aligns with Stage 4 of California Resilience Roadmap and assumes Faster Ramp scenario, with Reduced Peak and Early Close service level. Under these scenarios, Stage 2 would last through August and Stage 3 would last through February2 Under ” Faster Ramp” scenario and ” Reduced Peak and Early Close” service levelSource: BART Operations; PFM system, California Department of Public Health
BART could set a range of targets for physical distancing
% of demand served2
% of passengers
Possible options through End of Shelter-in-Place Order1
Six feet
Gradual reduction in distancing
Three feet
No target
Key questions to understand
• How to best comply with state guidance?
• How to gain the confidence of our riders?
• What will each target mean for managing passenger flows?
Stage 21 Stage 31
6 feet
6 feet
3 feet
3 feet
No target
6 feet
3 feet
Distance by stage of recovery
Current practice

11
In addition to distancing, BART is considering an array of other COVID-related operating measures
• Across the world, there are widely varying sets of health policy guidelines, alongside varying levels of enforcement
• There is no one answer for how public transit systems should respond to COVID-19, though some type of increased cleaning has been universally implemented
• Beyond simply adhering to health policy guidelines, it is critical for public transit systems to put in place interventions that increase passenger confidence and safeguard customers and staff
• Most variation between systems is seen on:• PPE and testing for passengers• Enforcing physical distancing and new norms
Source: Seoulmetro.co.kr, Mediahub.go.kr, International Association of Public Transport, Korea Herald, Metro.Taipei, Taiwan News, Taipei Times, Storm Media, Deutschebahn.com, Taggeschau, RBB24, General-Anzeiger,, Gothamist, MTA, NY Post, The Guardian, The Verge, Moovit, Expert interviews
12
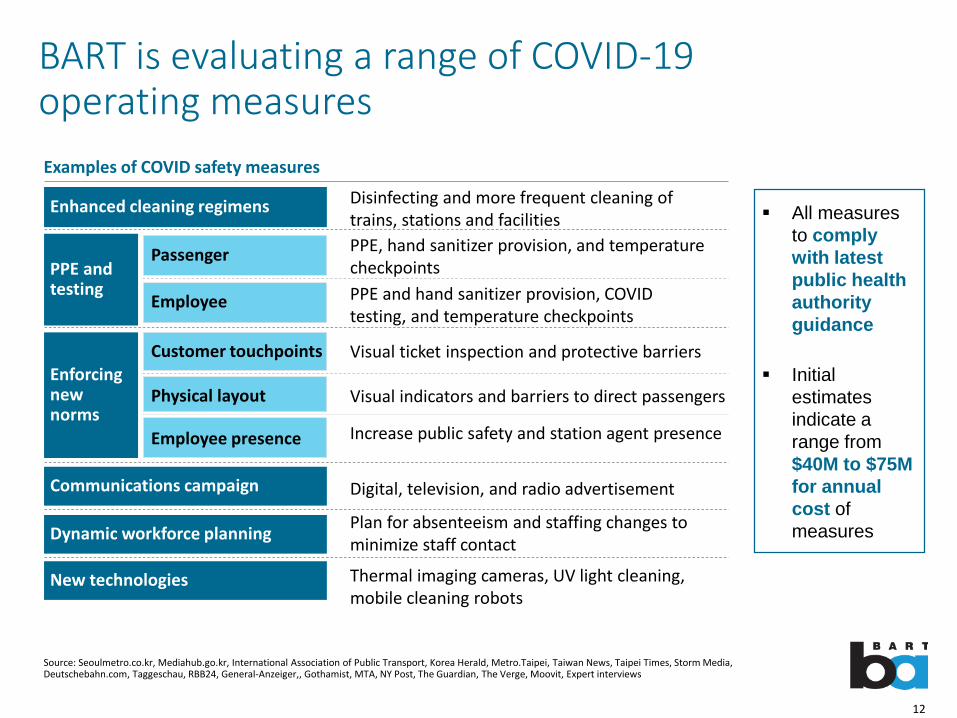
BART is evaluating a range of COVID-19 operating measures
All measures to comply with latest public health authority guidance
Initial estimates indicate a range from $40M to $75M for annual cost of measures
Communications campaign
Dynamic workforce planning
New technologies
Enforcing new norms
Employee presence
Physical layout
Customer touchpoints
Enhanced cleaning regimens
PPE and testing
Passenger
Employee
Digital, television, and radio advertisement
Plan for absenteeism and staffing changes to minimize staff contact
Thermal imaging cameras, UV light cleaning, mobile cleaning robots
Increase public safety and station agent presence
Visual indicators and barriers to direct passengers
Visual ticket inspection and protective barriers
PPE, hand sanitizer provision, and temperature checkpointsPPE and hand sanitizer provision, COVID testing, and temperature checkpoints
Disinfecting and more frequent cleaning of trains, stations and facilities
Examples of COVID safety measures
Source: Seoulmetro.co.kr, Mediahub.go.kr, International Association of Public Transport, Korea Herald, Metro.Taipei, Taiwan News, Taipei Times, Storm Media, Deutschebahn.com, Taggeschau, RBB24, General-Anzeiger,, Gothamist, MTA, NY Post, The Guardian, The Verge, Moovit, Expert interviews

13
A wide range of international responses to COVID-19 operation measures exists
Enforcing new norms
Social distancing target
PPE and testing
Enhanced cleaning
Hand sanitizer
Mask requirementMask provision2
Communications campaign
Dynamic workforce planning
Plan for absenteeism
Worker contact minimization
New technologies
Passenger
PPE provision Symptom screening
Employee COVID-19 testing
Employee
Visual indicators (e.g., decals, app)
Physical barriers to direct traffic flow1
Physical layout
Contactless paymentCustomer
touchpoints
Increased public safety presence
Increased staff presence
Train, station, and facility cleaning
Digital, television, and radio advertising
Employee presence
Fully implementedPartially implemented or under considerationNo evidence
Y
In discussion Thermal imaging Mobile cleaning robots
Cameras to track mask-
wearingElectrostatic
sprayers
BART planned Seoul Taipei Deutsche Bahn Paris (RATP) New York
-
1 California guidelines recommend either visual indicators or physical barriers to direct traffic flow 2 BART currently providing donated masks at some stationsSource: International Association of Public Transport, “COVID-19 Industry Guidance: Public Transit and Intercity Rail,” California Department of Health, CalSTA, CalOSHA, May 2020, Seoulmetro.co.kr, Mediahub.go.kr, Korea Herald, Metro.Taipei, Taiwan News, Taipei Times, Storm Media, Deutschebahn.com, Taggeschau, RBB24, General-Anzeiger,, Gothamist, MTA, NY Post, The Guardian, The Verge, Moovit, Expert interviews
NONEXHAUSTIVE
No interventionRecommended under CA guidelines
6 feet 6 feet 5 feet 5-6 feet 3 feet 6 feet

14
While service reductions could reduce expenditures by 15%, BART may only be able to meet 65% of rider demand
1 In line with June bid staffing levels 2 Assumes 6’ physical distancing across all service options and Faster Ramp scenario
Source: BART O&M Cost Model, BART PFM Database, Center for Disease Control
8
(52)
(137)
(202)
0
~65
~90
~85
~80
~25
More service
Less service
Service options
Enhanced pre-COVID train schedule
Cost impact compared to pre-COVID schedule,$M FY21
Reduced peak and early close1
Half pre-COVID schedule
Normal pre-COVID train schedule
Demand served, %2
Minimum service
Head-ways
15-min
Add’l peak service
48 trains, 8 hours per day
Daily service hours
15-min
30-min
15-min
None
None
24 trains, 4 hours per day
5AM-9PM
5AM-9PM
5AM-12AM
5AM-12AM
60-min None 5AM-9PM

15
Given projected demand and increased COVID costs, we evaluated several service plans
Source: BART Performance and Budget
FY21 ($M)
Potential Service Plans
Minimum service Half pre-COVID schedule
Reduced peak and early close
Normal pre-COVID schedule
Enhanced pre-COVID schedule
Routes 3 5 5 5 5
Headways 60 30 15 15 (+rush trains) 15 (+ add’l rush trains)
Hours of Service 5am-9pm 5am-9pm 5am-9pm 5am-12am 5am-12am
Peak Cars 219 431 609 709 709
Peak Trains 22 44 62 72 72
Total Car Miles (M) 17.1 45.0 82.3 92.1 95.6Budget (Total Uses of Funds) ($M) $725 $790 $875 $927 $934
Budget Delta ($M) ($202) ($137) ($52) - $8% Change from Pre-COVID Schedule (21%) (16%) (4%) - 1%
Total FTEs 2,531 2,868 3,334 3,585 3,616
FTE Difference (1,054) (717) (251)* - 31
% FTE Change from Pre-COVID Schedule (29%) (20%) (7%)* - 1%
* Vacant positions only; FTEs in this scenario reduced through inactivating vacant positions

16
From these we developed 3 options…
Source: BART Performance and Budget
FY21 Working Income Statement Option A Option B Option C
Service Level Half pre-COVID schedule Reduced peak and early close
Enhanced pre-COVID service
Revenue Scenario Slower ramp Midpoint Faster rampSources ($M)Fare revenue 69 145 222Capacity constraint (4) (4) (18)Parking 5 10 16Other operating 27 29 31Sales tax proceeds 226 239 252SFO & SVBX assistance 83 75 71Other assistance 118 119 119Total Revenues 525 614 693CARES tranche 1 (FY20 remainder) 75 75 75CARES tranche 2 (targeted) 164 164 164Total Sources 764 853 932
Uses ($M)Labor & benefits 540 601 628Power 40 48 56Non-labor 146 162 168Debt Service 47 47 47Allocations 17 17 28COVID expenses (estimate) 75 75 75Total Uses 865 950 1,002Net Result (101) (97) (70)Net Result less CARES Tranche 2 (265) (261) (234)
17
Staff Rec
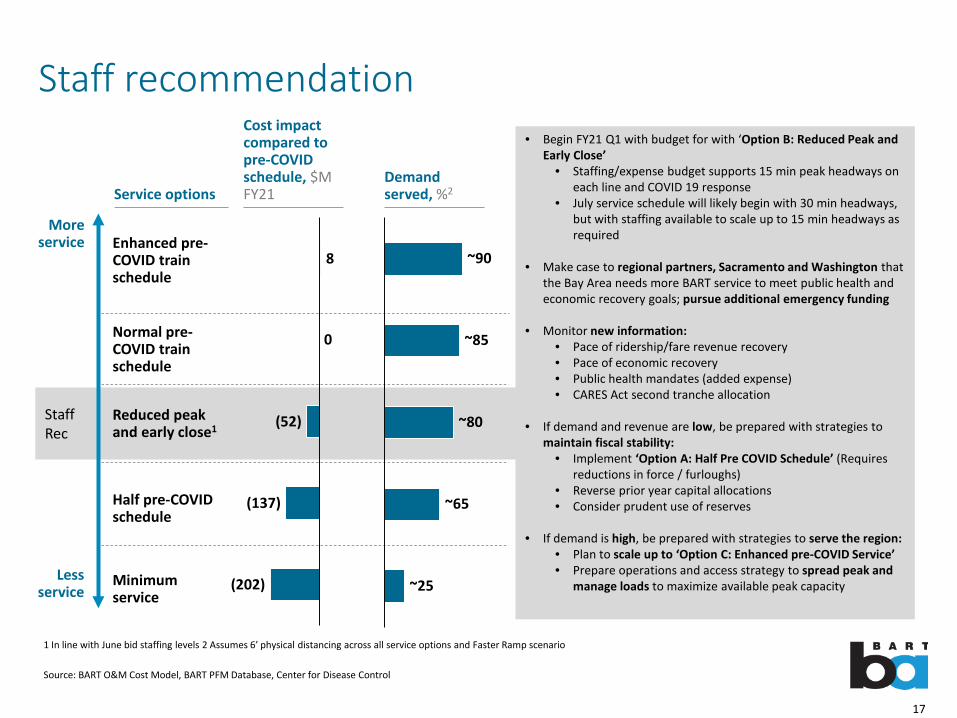
Staff recommendation
Source: BART O&M Cost Model, BART PFM Database, Center for Disease Control
More service
Less service
8
(52)
(137)
(202)
0
Service options
Enhanced pre-COVID train schedule
Cost impact compared to pre-COVID schedule, $M FY21
Reduced peak and early close1
Half pre-COVID schedule
Normal pre-COVID train schedule
Demand served, %2
Minimum service
• Begin FY21 Q1 with budget for with ‘Option B: Reduced Peak and Early Close’
• Staffing/expense budget supports 15 min peak headways on each line and COVID 19 response
• July service schedule will likely begin with 30 min headways, but with staffing available to scale up to 15 min headways as required
• Make case to regional partners, Sacramento and Washington that the Bay Area needs more BART service to meet public health and economic recovery goals; pursue additional emergency funding
• Monitor new information:• Pace of ridership/fare revenue recovery• Pace of economic recovery• Public health mandates (added expense) • CARES Act second tranche allocation
• If demand and revenue are low, be prepared with strategies to maintain fiscal stability:
• Implement ‘Option A: Half Pre COVID Schedule’ (Requires reductions in force / furloughs)
• Reverse prior year capital allocations• Consider prudent use of reserves
• If demand is high, be prepared with strategies to serve the region:• Plan to scale up to ‘Option C: Enhanced pre-COVID Service’• Prepare operations and access strategy to spread peak and
manage loads to maximize available peak capacity
1 In line with June bid staffing levels 2 Assumes 6’ physical distancing across all service options and Faster Ramp scenario
~25
~90
~80
~85
~65

18
FY21 Budget – budget checkpoints
Planned Dates Topic
June 25 Budget Adoption
July 1 FY21 Begins
October Meeting Q1 Budget Update, CheckpointAssess changes to:Pace of ridership/fare revenue recoveryPace of economic recoveryPublic health mandates/added expenseCARES Act 2nd tranche allocation
January Meeting Q2 Budget Update, Checkpoint
April Meeting Q3 Budget Update, Checkpoint
Source: BART Performance and Budget

Appendix

20
FEMA Public Assistance• Emergency Operation Center costs• Training specific to the declared event• Disinfection of eligible public facilities• Technical assistance to state, tribal, territorial or local governments on
emergency management and control of immediate threats to public health and safety
• FEMA currently reimbursing COVID-19 measures under category B of Public Assistance
• BART staff is working with State government to determine which expenses are reimbursable
• Window for reimbursement will close at a point determined by the Federal government
• Staff understands that reimbursable categories include:
• Facility disinfection• Purchase and distribution
of commodities (e.g., PPE, gloves)
• Emergency Operations Center
• COVID-related communications
Summary of Category B items
Management, control and reduction of immediate threats to public health and safety
• Non-deferrable medical treatment of infected persons in a shelter or temporary medical facility
• Related medical facility services and supplies• Temporary medical facilities and/or enhanced medical/hospital capacity• Use of specialized medical equipment• Medical waste disposal• Emergency medical transport
Emergency medical care
• All sheltering must be conducted in accordance with standards and/or guidance approved by HHS/CDC and must be implemented in a manner that incorporates social distancing measures
• Non-congregate medical sheltering is subject to prior approval by FEMA and is limited to that which is reasonable and necessary to address the public health needs of the event, is pursuant to the direction of appropriate public health officials and does not extend beyond the duration of the Public Health Emergency.
Medical sheltering
• Household pet sheltering and containment actions• Purchase and distribution of food, water, ice, medicine, and other
consumable supplies, to include personal protective equipment and hazardous material suits movement of supplies and persons.
• Security and law enforcement• Communications of general health and safety information to the public.• Search and rescue to locate and recover members of the population• Reimbursement for state, tribe, territory and/or local government force
account overtime costs
Other items
Source: “Coronavirus Eligible Emergency Protective Measures,” FEMA Public Assistance Program via fema.gov, March 19,2020
21
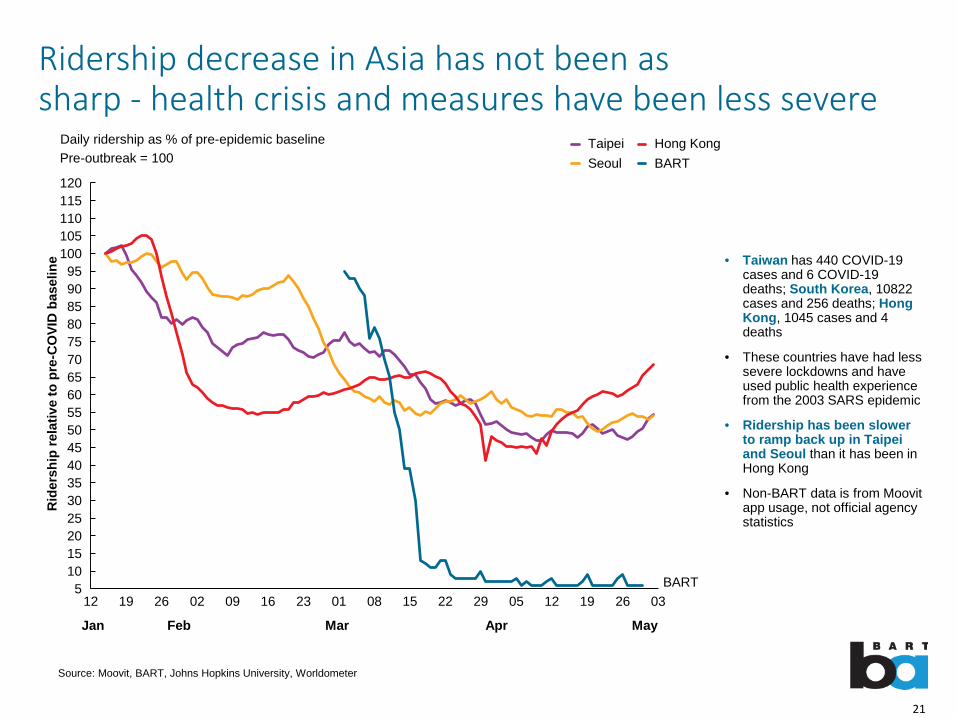
Ridership decrease in Asia has not been as sharp - health crisis and measures have been less severe
Rid
ersh
ip re
lativ
e to
pre
-CO
VID
bas
elin
e
29
90
05 12
10
19 035
75
02
2520
15
30
19
100
15
354045
12
50
26
55
08
65
85
2316
80
70
09 26
95
105
01
110115
22
120
60
Pre-outbreak = 100
• Taiwan has 440 COVID-19 cases and 6 COVID-19 deaths; South Korea, 10822 cases and 256 deaths; Hong Kong, 1045 cases and 4 deaths
• These countries have had less severe lockdowns and have used public health experience from the 2003 SARS epidemic
• Ridership has been slower to ramp back up in Taipei and Seoul than it has been in Hong Kong
• Non-BART data is from Moovitapp usage, not official agency statistics
Daily ridership as % of pre-epidemic baseline
SeoulTaipei Hong Kong
BART
BART
Source: Moovit, BART, Johns Hopkins University, Worldometer
Jan Feb Mar Apr May
22
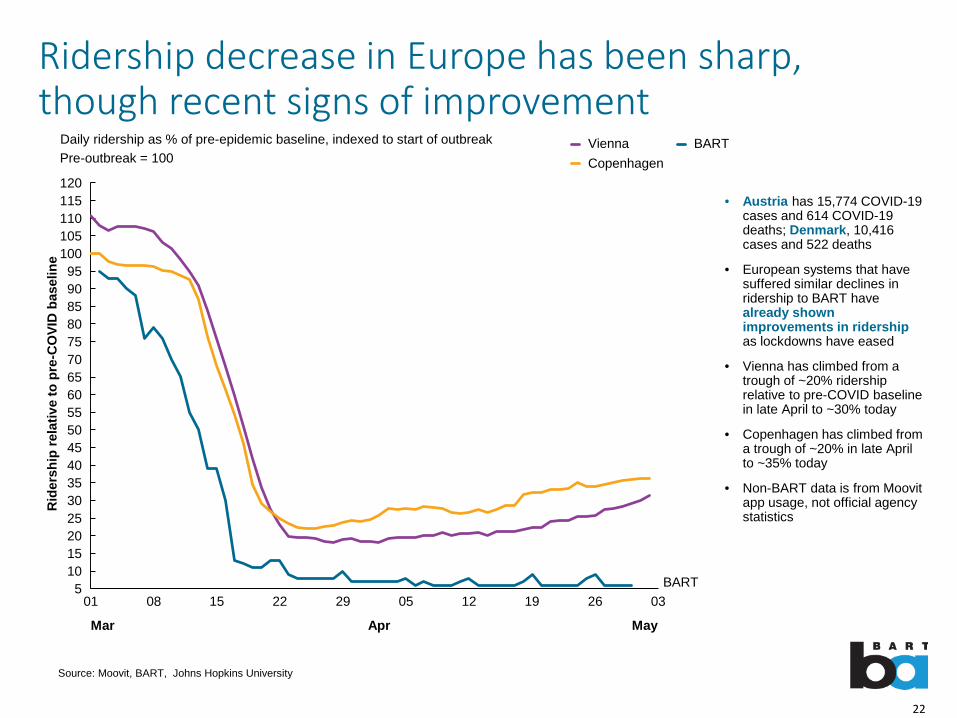
Ridership decrease in Europe has been sharp, though recent signs of improvement
Rid
ersh
ip re
lativ
e to
pre
-CO
VID
bas
elin
e
25
01 12
120
22
95
35
105
20
105
40
15
5560
30
100
45
0305 26
90
50
19
7065
8085
2915
75
110
08
115
Pre-outbreak = 100
• Austria has 15,774 COVID-19 cases and 614 COVID-19 deaths; Denmark, 10,416 cases and 522 deaths
• European systems that have suffered similar declines in ridership to BART have already shown improvements in ridershipas lockdowns have eased
• Vienna has climbed from a trough of ~20% ridership relative to pre-COVID baseline in late April to ~30% today
• Copenhagen has climbed from a trough of ~20% in late April to ~35% today
• Non-BART data is from Moovitapp usage, not official agency statistics
Daily ridership as % of pre-epidemic baseline, indexed to start of outbreak
CopenhagenVienna BART
Mar Apr May
Source: Moovit, BART, Johns Hopkins University
BART