fy2020 consolidated financial results · 2020-04-29 · toyota production (10,000 unit) 906 893 -13...
TRANSCRIPT

FY2020
Consolidated Financial Results
April 30th, 2020
AISIN SEIKI Co., Ltd.

1. Overview of Financial Results (FY2020)
2. Consolidated Financial Results (FY2020)
3. Reference Information
1/18
Contents
P.2
P.3-8
P.9-18

2/18
1. Overview of Financial Results (FY2020)
1. Revenue for FY2020 decreased compared to last year
due to unfavorable Automatic Transmission sales mainly
in China and the impact of COVID-19.
2. Operating Profit for FY2020 decreased compared to last
year due to the decrease of sales , increase of
depreciation cost by advanced investment, and the loss
on Business liquidation such as impairment of fixed
asset, in spite of steady cost reduction by Structural
reforms.
3. With respect to the annual forecast for FY2021, it cannot
be disclosed at this point, due to difficulties to estimate
reasonable financial impact of COVID-19.

3/18
2.Consolidated Financial Results (FY2020)

(Billion yen)
FY2019 FY2020 Change
Results Rate to
Revenue
% Results
Rate to
Revenu
e% Amount %
Revenue 4,043.1 - 3,784.5 - -258.6 -6.4
Operating Profit 205.5 5.1 56.1 1.5 -149.4 -72.7
Profit before
income taxes 217.4 5.4 53.3 1.4 -164.1 -75.4
Profit for the
period * 110.1 2.7 24.0 0.6 -86.1 -78.2
EPS 408.64 yen
- 89.28
yen - -319.36
yen -78.2
FX Rate USD 111 yen USD 109 yen -2 yen -1.8
CNY 16.5 yen CNY 15.6 yen -0.9 yen -5.5
Toyota
production (10,000 Unit)
906 893 -13 -1.4
AT sales (10,000 Unit)
999 904 -95 -9.5
FY2020
Forecast
in Jan Rate to
Revenue %
3,840.0 -
75.0 2.0
78.0 2.0
40.0 1.0
148.42 yen
-
USD 108 yen
CNY 15.4 yen
907
925
4/18
Consolidated Financial Results (FY2020)
Pre
-conditio
ns
* Profit for the period attributable to Owners of the parent

286.5 257.5
130.7 142.6
116.0 112.9
105.4 102.5
106.0 93.2
87.7 68.4
65.4 63.8
74.0 61.4
54.1 56.5
80.1
34.6
69.6
33.6
74.1
32.6
349.4
295.6
0
200
400
600
800
1,000
1,200
1,400
1,600
FY2019 FY2020
VW&Audi
HONDA
PSA
SUZUKI
VOLVO
FCA
MITSUBISHI
BMW
Others
NISSAN
FY2019 Revenue
FY2020 Revenue (- 258.6)
Other Auto Makers sales breakdown
-29.0
+11.9
-3.1
-2.9
-12.8
-19.3 -1.6
-45.5
-12.6
-53.8
GM -41.5
5/18
Guangzhou Automobile
+2.4
-36.0
Sales by Customer (FY2020)
Toyota
Group 2,316.8 (57.3%)
4,043.1 1,599.0
(39.6%)
Other
Auto Makers
Life & others 127.2 (3.1%)
(Billion yen)
(Billion yen)
Toyota
Group 2,309.4 (61.0%)
3,784.5 Other
Auto Makers 1,355.2
(35.8%)
Life & others 119.8 (3.2%)
(Billion yen) Chinese OEMs Total
258.7 ⇒142.0(-116.7) 1,599.0
1,355.2
-243.8
Changan Automobile

2,376.3
585.4
350.0 377.5 353.7
2,190.2
580.2
367.5 315.2 331.2
0
500
1,000
1,500
2,000
2,500
Japan NorthAmerica
Europe China Asia& Others
FY2019 FY2020
122.9
-2.5 5.5
45.2
32.2
46.3
7.6 -5.9
21.6
(12)
94
Japan NorthAmerica
Europe China Asia& Others
FY2019 FY2020
Revenue (-258.6) Operating Profit (- 149.4)
FX
Impact
Other
factors
Japan - -186.1
North
America -11.5 +6.3
Europe -4.5 +22.0
China -18.6 -43.7
Asia &
Others +1.3 -23.8
Total -33.4 -225.2
FX
Impact
Other
factors
Japan -7.0 -69.6
North
America +0.2 -12.1
Europe -0.4 +2.5
China +0.3 -51.4
Asia &
Others +0.4 -11.0
Eliminati
on - -1.2
Total -6.4 -143.0
-186.1
-5.2
-62.3 -22.5
+2.1
-51.1
-10.6
+17.5
-76.6
-11.9
6/18
-14.4
(Billion yen)
(Billion yen)
Segment Information (FY2020)

Op
era
ting
Pro
fit
Sale
s
fluctu
atio
n
Co
st s
truc
ture
im
pro
vem
en
t
-99.7
+34.5
-149.4 Billion yen
7/18
Fluctuations for Operating Profit (FY2020)
FY2019 / FY2020
FY2019
205.5
Qu
ality
-rela
ted
c
os
ts fo
r FY
+26.2
Non-ordinary
factors for FY2019
+26.2 billion yen
20
19
Op
era
ting
Pro
fit (E
xc
ep
t no
n-o
rdin
ary
fac
tors
for F
Y ) 2
01
9
231.7
+9.6 -6.4 +1.0
Stru
ctu
ral re
form
s
FX
imp
act
Ch
an
ge o
f m
ate
rial p
rice
-15.7
-7.5 -3.7
Depreciation
Production Preparation cost
R&D cost
-2.2 Fix
ed
co
st
& o
thers
Op
era
ting
Pro
fit (E
xc
ep
t no
n-o
rdin
ary
fa
cto
rs fo
r FY
)
20
20
141.6
Qu
ality
-rela
ted
co
sts
fo
r FY
202
0
-23.5
Lo
ss o
n
Bu
sin
ess liq
uid
atio
n
-32.0
-30.0
Imp
act o
f CO
VID
- 19
FY2020
56.1
Op
era
ting
Pro
fit
(Billion yen)
Ordinary factors -90.1 billion yen Non-ordinary factors for FY2020
-85.5 billion yen

Op
era
ting
Pro
fit
(Fore
ca
st in
Ja
n)
8/18 FY2020
(Forecast in Jan)
75.0
+2.1
+3.9
+2.9
+2.2 -30.0
Imp
act o
f CO
VID
- 19
Stru
ctu
ral re
form
s
FX
imp
act
Dep
recia
tion
Oth
ers
- 18.9 Billion yen
56.1
Op
era
ting
Pro
fit
FY2020
FY2020 (Forecast in Jan)
/ FY2020
Fluctuations for Operating Profit (FY2020)
(Billion yen)

9/18
3.Reference Information

82.2 88.5 92.7 97.4
68.5 73.1
76.8 93.9 15.3
18.3 22.6
25.3
FY2017 FY2018 FY2019 FY2020
72.0 74.5 81.0 83.6
69.2 80.3
92.0 96.2 18.0
20.1 22.3 22.8
FY2017 FY2018 FY2019 FY2020
Others
ADS-G
AW-G
AISIN SEIKI-G
102.8 122.5
169.0
118.2
72.3
87.3
144.9
107.4 39.7
19.0
32.9
39.8
FY2017 FY2018 FY2019 FY2020
10/18
Capital Expenditure/Depreciation/ R&D Expenditure
Capital Expenditure Depreciation R&D Expenditure
237.4
260.3
389.9
290.6
AW-G of FY2020
amount includes
AISIN AI Group by
integration.
197.1 213.4
226.4 242.1
167.7
202.1 (4.7%) (5.0%)
(4.7%) 182.9
205.8 (5.4%)
(): Rate to sales
(Billion yen)

73 74 73 85
83 76 73 84
76 81 79 78
81 83 90 79
FY2017 FY2018 FY2019 FY2020
4Q
3Q
2Q
1Q
153 143 151 148
148 147 149 144
151 151 155 146
144 137 136 129
FY2017 FY2018 FY2019 FY2020
226 217 224 233
231 223 222 228
227 232 234 224
225 220 226 208
FY2017 FY2018 FY2019 FY2020
11/18
Toyota car production
Toyota Domestic production
Toyota Oversea production
Toyota Global production
(10,000 Unit)
313 314 315
596 578 591
326
567
906 909 892 893

44 43 46 41
45 45 43 37
43 47 41 39
46 46 40 31
0
50
100
150
200
FY2017 FY2018 FY2019 FY2020
204 233 260 226
207 234 246 220
224 258 246
236
234 258 247
222
0
200
400
600
800
1,000
FY2017 FY2018 FY2019 FY2020
42 42 43 28
39 34 39 29
45 48 36
30
39 40 33
24
0
50
100
150
200
FY2017 FY2018 FY2019 FY2020
16 13 17 23
14 13 18
19 12 13
20 20 13 14
17 17
0
20
40
60
80
FY2017 FY2018 FY2019 FY2020
12/18
Sales Number
AT sales
Navigation System sales
MT sales
Navigation Soft sales
(10,000 Unit) (10,000 Unit)
(10,000 Unit) (10,000 Unit)
178 170 181 148
869 999 983
904 165
151 164
111
53
72
55
79

FY2017 FY2018 FY2019 FY2020
USD 1.34 1.13 1.13 0.96
EUR 0.17 0.19 0.17 0.18
THB * 0.81 1.26 1.55 1.31
CNY * 0.79 0.81 0.76 0.40
13/18
16.5 15.6 16.1 16.8
3.4 3.5 3.1 3.4
0.0
10.0
20.0
FY2017 FY2018 FY2019 FY2020
CNY
THB
119 130 129
121
109 111 111 109
80
100
120
140
EUR
USD
Foreign Exchange Rate
Impacts on
Operating Profit
(yen)
Forex Impact on Operating
profit per 1(or 0.1) yen (Billion yen)
* Impacts of THB and CNY are per 0.1yen.
Foreign Currency Exchange Rate

0
30
60
90
120
◆ ◆
0
500
1,000
1,500
2,000
124.2 150.1
110.2
19.9
(5)
55
115
1751,542.1 1,738.1 1,799.2
1,622.1
0
600
1,200
1,800
◆
◆
◆
◆
◆
◆
14/18
Financial Results of the Main Consolidated Companies Ⅰ
AISIN SEIKI Group
1,782.6 1,641.9 1,776.2
80.5 78.0 67.0
1,685.7
30.2
(Billion yen) (Billion yen) 4.9% 4.4% 3.8%
1.8%
(Billion yen) (Billion yen) 8.1%
8.6%
6.1%
1.2%
FY2017 FY2018 FY2019 FY2020
AISIN AW Group (after integration with AISIN AI Group)
FY2017 FY2018 FY2019 FY2020
0
10
20
30
0
100
200
300
400
◆ ◆
◆
-15
0
15
0
200
400
600
800
◆ ◆
◆
◆
◆
15/18
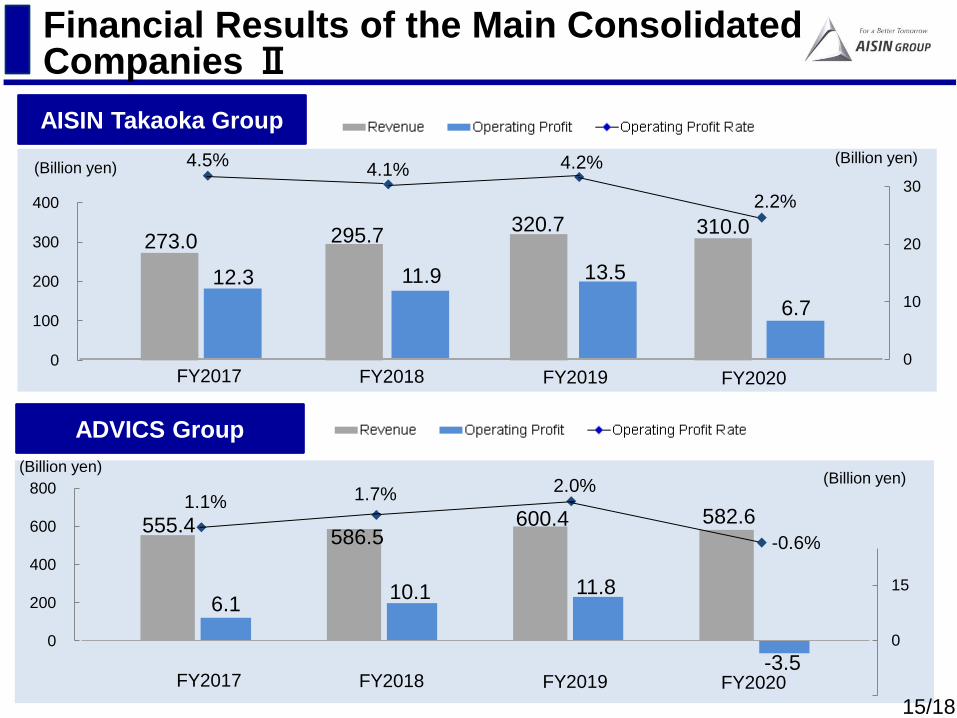
Financial Results of the Main Consolidated Companies Ⅱ
AISIN Takaoka Group
ADVICS Group
(Billion yen) (Billion yen)
273.0
12.3
295.7
11.9
320.7
13.5
310.0
6.7
4.2% 4.5% 4.1%
2.2%
(Billion yen) (Billion yen)
6.1 10.1 11.8
555.4 586.5
600.4 582.6
-3.5
2.0% 1.1% 1.7%
-0.6%
FY2017 FY2018 FY2019 FY2020
FY2017 FY2018 FY2019 FY2020

838.6 858.8 907.5 957.5 917.0 938.0 1,023.5
1,030.2 1,007.9 986.5
1,018.9 1,029.7 963.0 950.7 958.0 912.7
226 231 227 225
217 223 232 220
224 222
234 226 233 228 224
208
0
50
100
150
200
250
0
600
1,200
1,800
1Q 2Q 3Q 4Q 1Q 2Q 3Q 4Q 1Q 2Q 3Q 4Q 1Q 2Q 3Q 4Q
59.0
35.7
67.3 66.4 53.5 54.4
77.6 68.1 64.8
58.3
38.1 44.1
25.5 27.9 23.7
-21.0
7.0%
4.2%
7.4% 6.9% 5.8% 5.8%
7.6% 6.6% 6.4%
5.9%
3.7% 4.3%
2.7% 2.9% 2.5%
-3.0%
1.0%
5.0%
(30)
0
30
60
90
120
16/18
Quarterly Performance
Operating Profit
Revenue
FY2017 FY2018 FY2019 FY2020
(Billion yen) (10,000 Unit)
FY2017 FY2018 FY2019 FY2020
- 2.3%
(Billion yen)

94.8
133.8
108.0
145.7 123.2
82.3
53.4
2.6
5.6%
7.2%
5.8%
7.1%
6.2%
4.0%
2.8%
0.1%
0.0%
2.0%
4.0%
6.0%
0
30
60
90
120
150
180
210
1H 2H 1H 2H 1H 2H 1H 2H
1,697.5 1,865.0 1,855.1 2,053.8 1,994.4 2,048.7 1,913.7 1,870.8
457 452 440 452 446
460 461 432
0
120
240
360
480
0
600
1,200
1,800
2,400
3,000
1H 2H 1H 2H 1H 2H 1H 2H
17/18
Half Yearly Performance
Operating Profit
Revenue
FY2017 FY2018 FY2019 FY2020
FY2017 FY2018 FY2019 FY2020
(Billion yen)
(10,000 Unit)
(Billion yen)

FY2017 FY2018 FY2019 FY2020
Dividend (yen) 125 150 150 120
Dividend Payout Ratio 28.1% 30.6% 36.7% 134.4%
Repurchase of Treasury
Stock (billion yen) 49.0 59.4 0.0 0.0
Total return Ratio(*) 66.5% 74.5% 36.7% 134.4%
*capitalization ratio (cap ratio) = Interest-bearing debt/(Interest-bearing debt + Equity)
*Interest-bearing debt =Bonds and loans payable + Lease liabilities
*We may redeem the hybrid bonds and loans raised in FY2019 before maturity without replacement financing in the case that the capitalization ratio of
prior Quarter of redemption is less or equal to 27.5% same as the end of December 2019.
468.7 528.5 622.5 1,005.5
1,694.8 1,803.1 1,873.6 1,795.6
FY2017 FY2018 FY2019 FY2020
Interest-bearing debt * Equity
21.7% 22.7% 24.9% 35.9%
Capitalization ratio
18/18
31.0%
Capital policy and Return to Shareholders
Capital policy Our core capital policy is to maximize corporate value by maintaining the balance between “financial safety” and “capital efficiency”.
We regard capitalization ratio as an important financial index to assess our capital structure, and believe the ratio from 25% to 30%
represents optimal balance. At the end of the fiscal year 2019, capitalization ratio temporarily exceeds above range due to the
financing of AW’s stock buy-back.
Return to Shareholders
Our “Return to shareholders” policy is to achieve steady dividend payout with a dividend payout ratio of around 30%. We are also considering to repurchase Treasury Stock based on our capitalization ratio and future investment trends.
(*) Total return Ratio= (Cash dividend paid + repurchase of treasury Stock) / Profit for the period
(Billion yen)
Capitalization ratio (Reflecting “equity attributes” of the hybrid bonds and loans. )