fy2018 q3 financial results - satoworldwide.com · base business sales primary labels sales base...
TRANSCRIPT

February 8, 2019
Securities Code: 6287
FY2018 Q3 Financial Results (Nine Months Ended December 31, 2018)

1
Summary of Apr-Dec 2018
Auto-ID Solutions business Progressed steadily.
IDP business R&D progressed largely as planned.
Japan : Growth remained solid despite some adverse external environments.
Consolidated sales and OI increased YoY.
Overseas : Recovery momentum mostly continued despite some soft spots.
Consolidated Apr-Dec
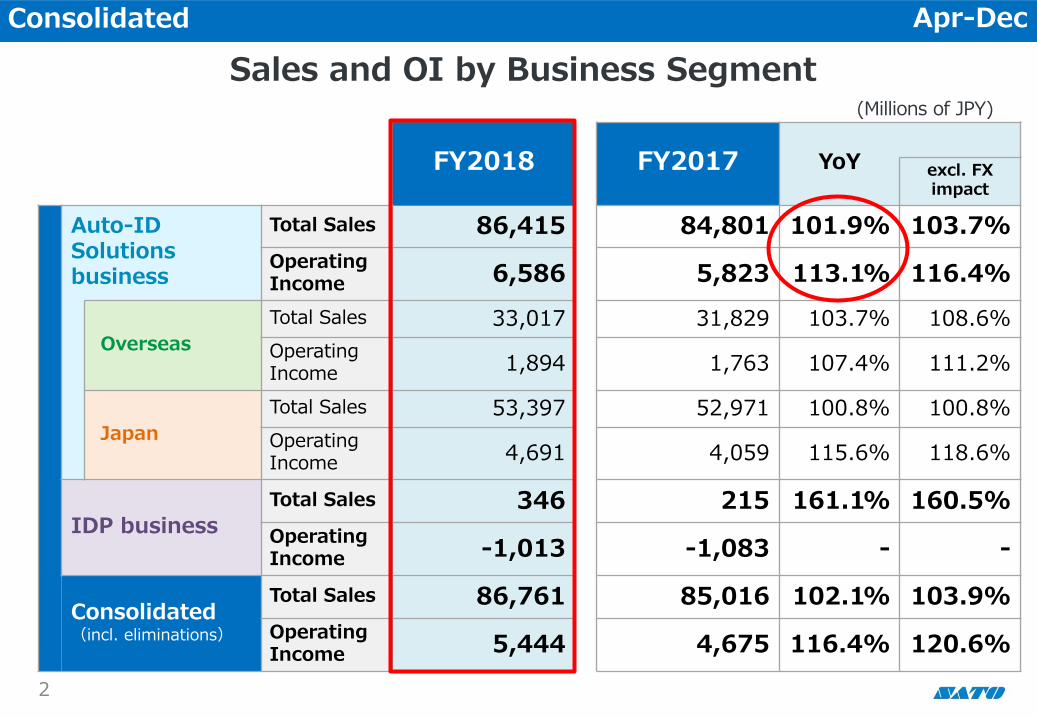
Sales and OI by Business Segment (Millions of JPY)
Consolidated Apr-Dec
FY2018 FY2017 YoY excl. FX impact
Auto-ID Solutions business
Total Sales 86,415 84,801 101.9% 103.7%
Operating Income 6,586 5,823 113.1% 116.4%
Overseas
Total Sales 33,017 31,829 103.7% 108.6%
Operating Income 1,894 1,763 107.4% 111.2%
Japan
Total Sales 53,397 52,971 100.8% 100.8%
Operating Income 4,691 4,059 115.6% 118.6%
IDP business
Total Sales 346 215 161.1% 160.5%
Operating Income -1,013 -1,083 - -
Consolidated (incl. eliminations)
Total Sales 86,761 85,016 102.1% 103.9%
Operating Income 5,444 4,675 116.4% 120.6%
2

Sales and OI by Region
FY17
84,801 FY18
86,415
FY17
5,823
FY18
6,586
Operating Income
(Millions of JPY)
Asia/Oceania 12.3%
Europe 12.6%
The Americas 12.6%
Overseas 37.5%
Japan 62.5%
Asia/Oceania 20.7%
Europe 1.1%
The Americas 8.6%
Overseas 30.4%
Japan 69.6%
Overseas 38.2%
Japan 61.8%
Asia/Oceania 12.6%
Europe 13.7%
The Americas 11.9%
Overseas 29.5%
Japan 70.5%
Asia/Oceania 22.5%
Europe 6.1%
The Americas 0.9%
Sales
OI ratio: Japan: 7.7%, Overseas: 5.5% OI ratio: Japan: 8.8%, Overseas: 5.7%
*Ratio excludes eliminations.
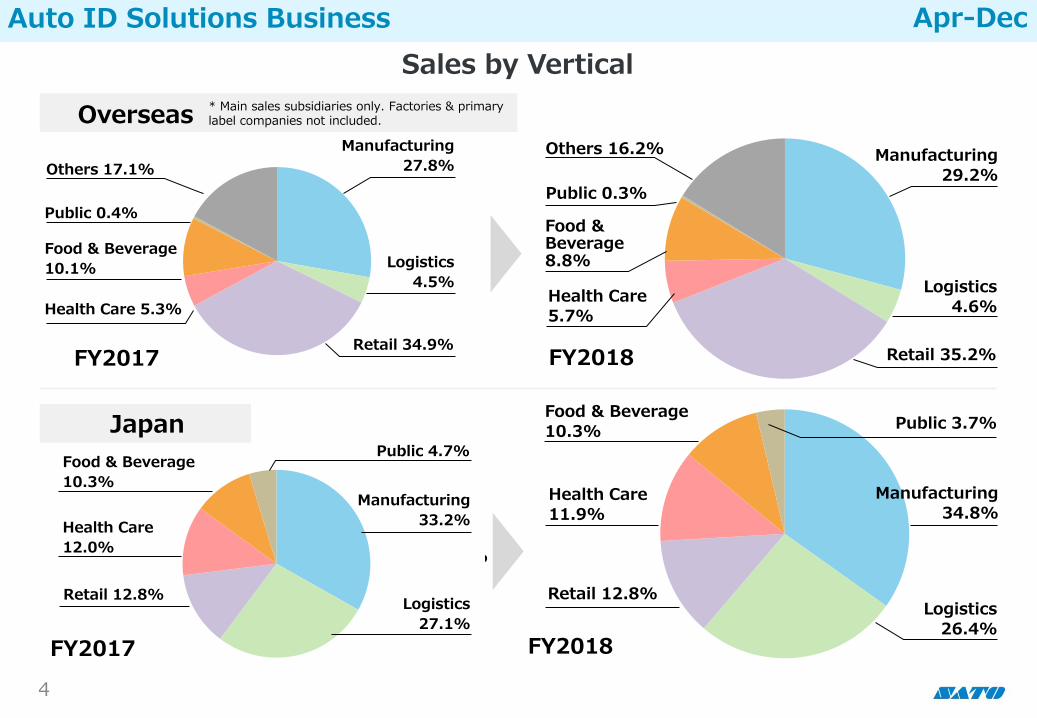
Auto ID Solutions Business Apr-Dec
3
FA, 33.2%
ロジ, 27.1%
リテール, 12.8%
ヘルスケア, 12.0%
食品, 10.3%
公共,
4.9%
FA, 30.0%
ロジ, 4.5%
リテール,
35.2%
ヘルスケア,
5.7%
食品, 8.8%
公共, 0.3%
その他,
16.2%
FA,
27.8%
ロジ,
4.5%
リテール,
34.9%
ヘルスケア,
5.3%
食品,
10.1%
公共,
0.4%
その他,
17.1%
Food & Beverage
10.1%
FA, 34.8%
ロジ, 26.4%
リテール, 12.8%
ヘルスケア, 11.9%
食品, 10.3%
公共, 3.8%
FY2017 FY2018
FY2017 FY2018
Overseas Manufacturing
27.8%
Logistics
4.5%
Retail 34.9%
Health Care 5.3%
Public 0.4%
Others 17.1% Manufacturing
29.2%
Logistics 4.6%
Retail 35.2%
Health Care 5.7%
Food & Beverage 8.8%
Public 0.3%
Others 16.2%
Japan
Health Care
12.0%
Food & Beverage
10.3%
Public 4.7%
Manufacturing
33.2%
Logistics
27.1%
Retail 12.8%
Public 3.7%
Manufacturing 34.8%
Logistics 26.4%
Health Care 11.9%
Retail 12.8%
* Main sales subsidiaries only. Factories & primary label companies not included.
Food & Beverage
10.3%
Auto ID Solutions Business Apr-Dec
Sales by Vertical
4
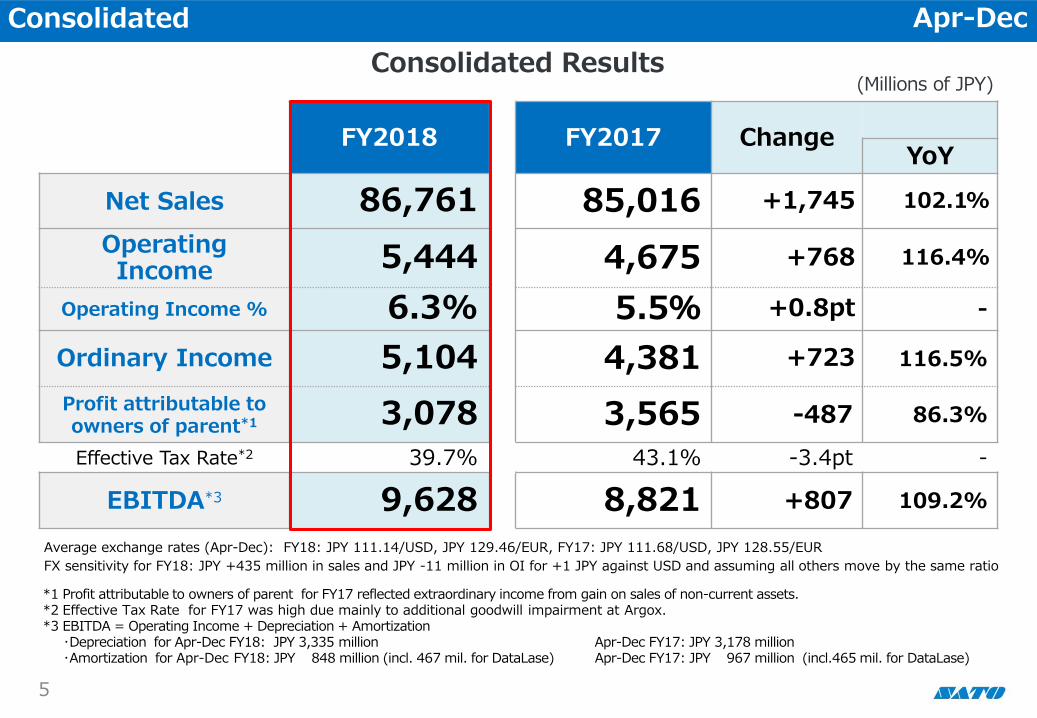
FY2018 FY2017 Change YoY
Net Sales 86,761 85,016 +1,745 102.1%
Operating Income 5,444 4,675 +768 116.4%
Operating Income % 6.3% 5.5% +0.8pt -
Ordinary Income 5,104 4,381 +723 116.5%
Profit attributable to owners of parent*1 3,078 3,565 -487 86.3%
Effective Tax Rate*2 39.7% 43.1% -3.4pt -
EBITDA*3 9,628 8,821 +807 109.2%
5
Average exchange rates (Apr-Dec): FY18: JPY 111.14/USD, JPY 129.46/EUR, FY17: JPY 111.68/USD, JPY 128.55/EUR
FX sensitivity for FY18: JPY +435 million in sales and JPY -11 million in OI for +1 JPY against USD and assuming all others move by the same ratio
(Millions of JPY)
*1 Profit attributable to owners of parent for FY17 reflected extraordinary income from gain on sales of non-current assets. *2 Effective Tax Rate for FY17 was high due mainly to additional goodwill impairment at Argox. *3 EBITDA = Operating Income + Depreciation + Amortization ・Depreciation for Apr-Dec FY18: JPY 3,335 million Apr-Dec FY17: JPY 3,178 million ・Amortization for Apr-Dec FY18: JPY 848 million (incl. 467 mil. for DataLase) Apr-Dec FY17: JPY 967 million (incl.465 mil. for DataLase)
Consolidated Apr-Dec
Consolidated Results

6
(Millions of JPY)
0
1,000
2,000
3,000
0
10,000
20,000
30,000
Q1 Q2 Q3 Q4 Q1 Q2 Q3 Q4 Q1 Q2 Q3 Q4
forecast
OI Sales
Sales OI OI: Auto-ID Solutions business only (excl. IDP business)
FY2016 FY2018 FY2017
Consolidated
Quarterly Consolidated Sales & OI
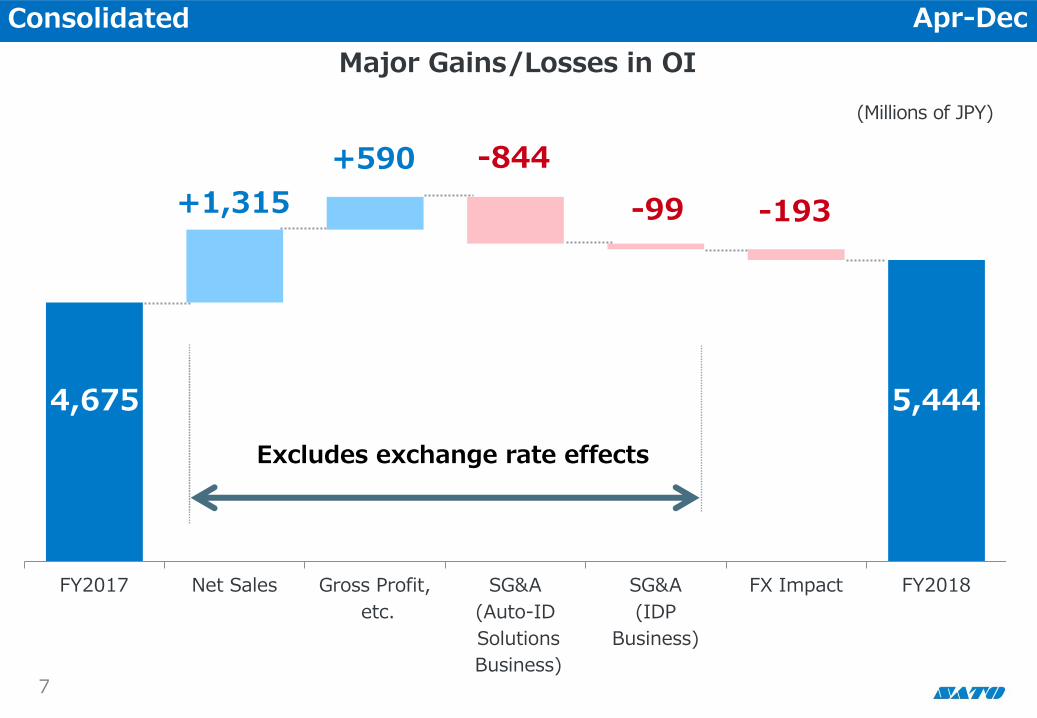
FY2017 Net Sales Gross Profit,
etc.
SG&A
(Auto-ID
Solutions
Business)
SG&A
(IDP
Business)
FX Impact FY2018
-193 +1,315
-844 +590
-99
4,675 5,444
7
Excludes exchange rate effects
(Millions of JPY)
Consolidated Apr-Dec
Major Gains/Losses in OI
0
200
400
600
800
1,000
1,200
0
2,000
4,000
6,000
8,000
10,000
12,000
Q1 Q2 Q3 Q4 Q1 Q2 Q3 Q4 Q1 Q2 Q3
Sales OI
FY2016 FY2018 FY2017
8
FY2018 FY2017 Change YoY
excl. FX impact
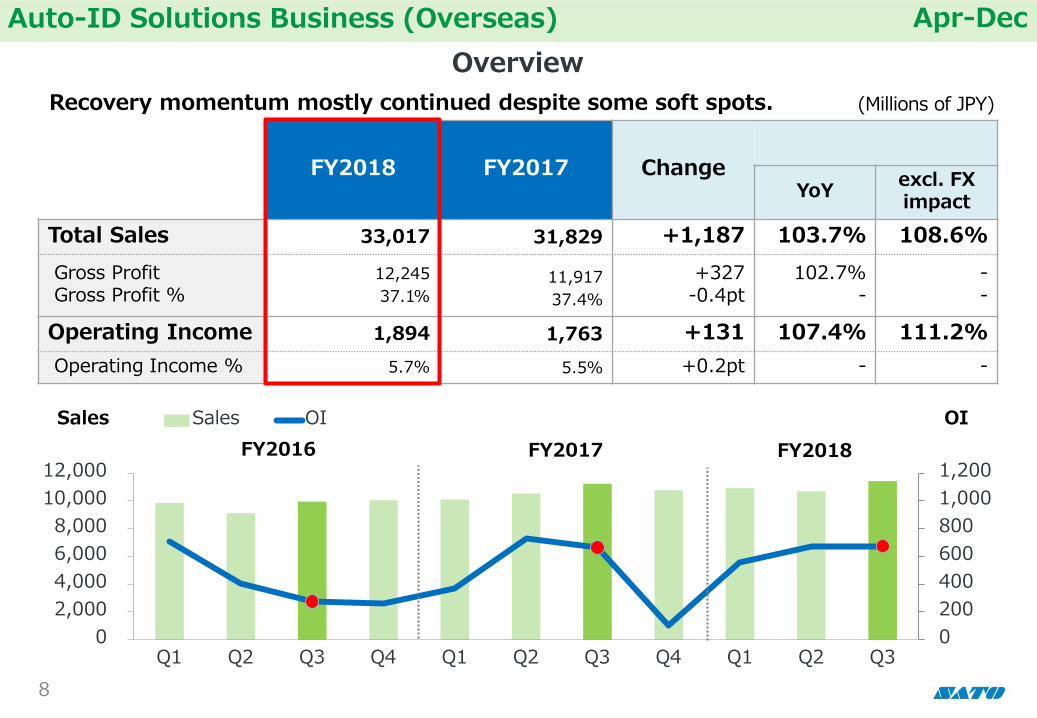
Total Sales 33,017 31,829 +1,187 103.7% 108.6%
Gross Profit Gross Profit %
12,245
37.1% 11,917
37.4%
+327 -0.4pt
102.7% -
- -
Operating Income 1,894 1,763 +131 107.4% 111.2%
Operating Income % 5.7% 5.5% +0.2pt - -
OI Sales
Recovery momentum mostly continued despite some soft spots. (Millions of JPY)
Auto-ID Solutions Business (Overseas) Apr-Dec
Overview
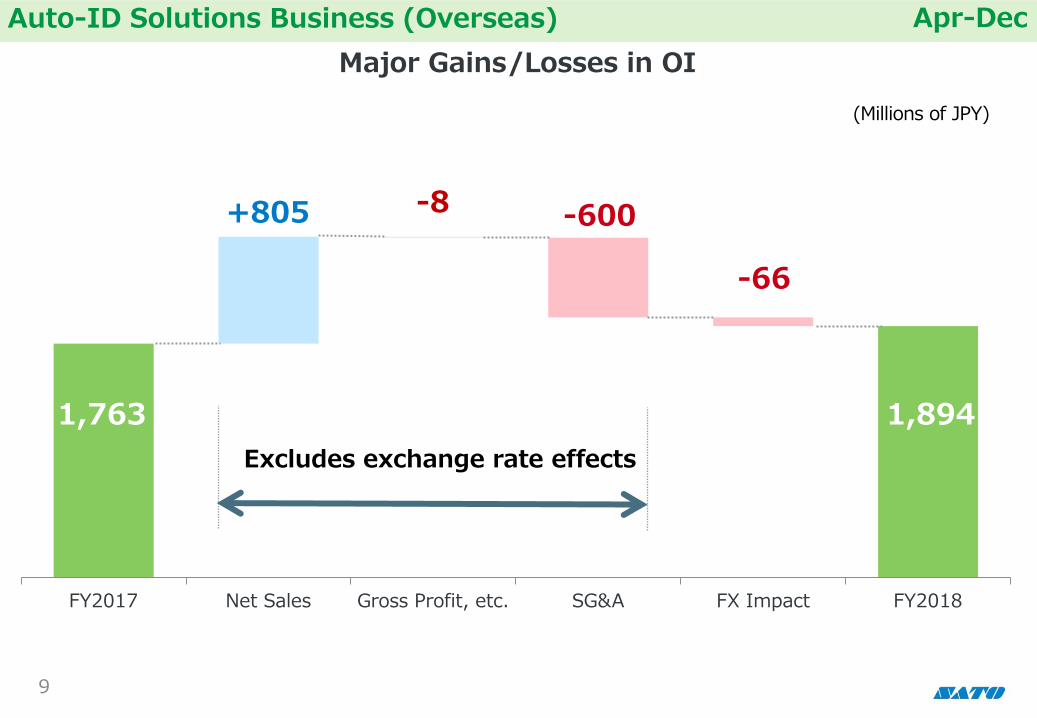
FY2017 Net Sales Gross Profit, etc. SG&A FX Impact FY2018
-600
-66
+805
1,894 1,763
9
-8
Excludes exchange rate effects
(Millions of JPY)
Auto-ID Solutions Business (Overseas) Apr-Dec
Major Gains/Losses in OI

-200
0
200
400
600
800
0
2,000
4,000
6,000
8,000
10,000
Q1 Q2 Q3 Q4 Q1 Q2 Q3 Q4 Q1 Q2 Q3
Base business Sales Primary Labels Sales Base business OI Primary Labels OI
FY2016 FY2018 FY2017
Sales
Base business: Europe and APAC saw increases in sales and OI. Sales and OI fell in the Americas but OI grew in real terms, disregarding the one-off accounting at former SGS in FY17. Primary Labels business: Sales increased while OI jumped due largely to positive FX impact at Okil.
OI
FY2018 FY2017 Change YoY
excl. FX impact
Base business Total Sales 26,270 25,268 +1,002 104.0% 105.4%
Operating Income 1,694 1,724 -30 98.3% 99.1%
Primary Labels Total Sales 6,746 6,561 +185 102.8% 120.9%
Operating Income 271 52 +218 513.5% 611.5%
Eliminations Operating Income -70 -13 -57 - -
(Millions of JPY)
Auto-ID Solutions Business (Overseas) Apr-Dec
Breakdown by Business Segment
10
ベース,
79.6%
プライマ
リー, 20.4%
FY18
33,017
ベース,
79.4%
プライマ
リー, 20.6%
FY17
31,829
ベース,
97.0%
プライマ
リー, 3.0%
FY17
1,763 ベース,
86.2%
プライマリー,
13.8%
FY18
1,894
Operating Income
Sales
Base 79.4%
Primary Labels 20.6%
Base 79.6%
Primary Labels 20.4%
Base
97.0%
Primary Labels 3.0%
Base 86.2%
Primary Labels 13.8%
(Millions of JPY)
OI ratio: Base: 6.8%, Primary Labels: 0.8% OI ratio: Base: 6.4%, Primary Labels: 4.0%
*Ratio excludes eliminations.
Auto-ID Solutions Business (Overseas) Apr-Dec
Breakdown of Sales and OI by Business Segment
11
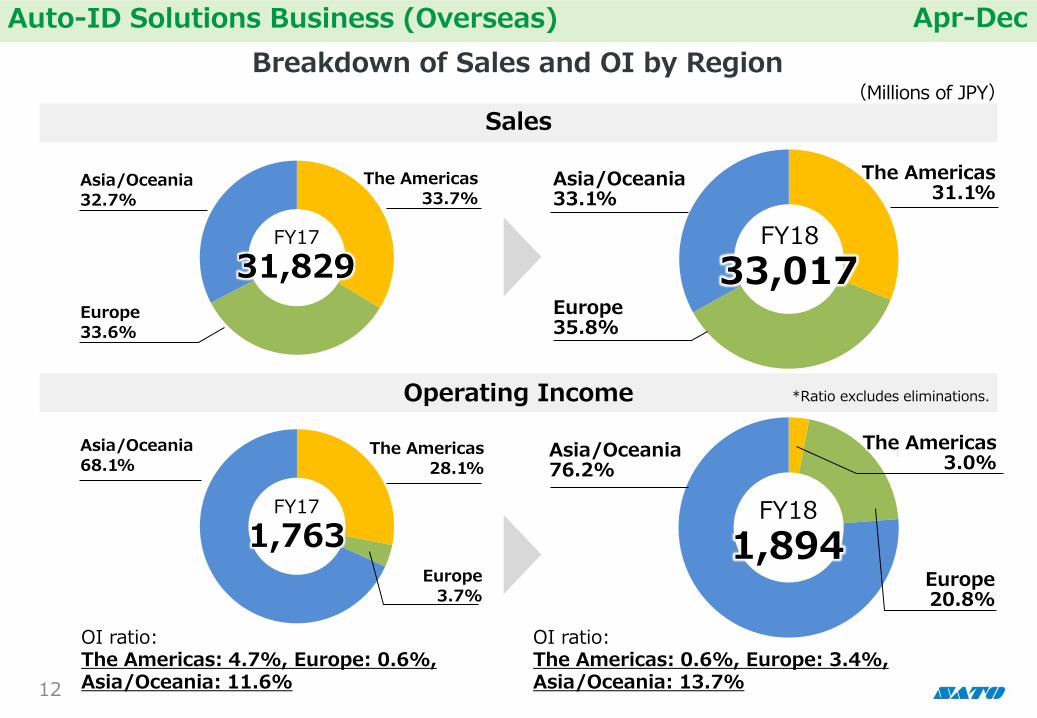
米州, 31.1%
欧州, 35.8%
アジア・
オセアニア,
33.1%
FY18
33,017
米州,
28.1%
欧州, 3.7%
アジア・
オセアニア,
68.2%
FY17
1,763
米州, 3.0% 欧州, 20.8%
アジア・
オセアニア,
76.2%
FY18
1,894
Operating Income
Sales
米州,
33.7%
欧州,
33.6%
アジア・
オセアニア,
32.7%
FY17
31,829
Europe 33.6%
The Americas 33.7%
Asia/Oceania 32.7%
The Americas 28.1%
Asia/Oceania 68.1%
Europe
3.7%
Europe 35.8%
Asia/Oceania 33.1%
Asia/Oceania 76.2%
The Americas 31.1%
The Americas 3.0%
(Millions of JPY)
Europe 20.8%
OI ratio: The Americas: 4.7%, Europe: 0.6%, Asia/Oceania: 11.6%
OI ratio: The Americas: 0.6%, Europe: 3.4%, Asia/Oceania: 13.7%
*Ratio excludes eliminations.
Auto-ID Solutions Business (Overseas) Apr-Dec
Breakdown of Sales and OI by Region
12

0
600
1,200
1,800
0
10,000
20,000
30,000
FY2016 FY2017 FY2018
Base
0
600
1,200
1,800
0
10,000
20,000
30,000
FY2016 FY2017 FY2018
Primary Labels
0
400
800
1,200
1,600
0
3,000
6,000
9,000
12,000
FY2016 FY2017 FY2018
The Americas
0
400
800
1,200
1,600
0
3,000
6,000
9,000
12,000
FY2016 FY2017 FY2018
Europe
0
400
800
1,200
1,600
0
3,000
6,000
9,000
12,000
FY2016 FY2017 FY2018
Asia/Oceania
Sales OI By Business Segment (Millions of JPY; Sales (left axis), OI (right axis))
By Region
Auto-ID Solutions Business (Overseas) Apr-Dec
Sales and OI Trends by Business Segment and Region
13
-400
-200
0
200
400
0
1,000
2,000
3,000
4,000
Q1 Q2 Q3 Q4 Q1 Q2 Q3 Q4 Q1 Q2 Q3
Sales Base business Sales Primary Labels Sales Base business OI Primary Labels OI
FY2016 FY2018 FY2017
14
FY2018 FY2017 Change YoY
excl. FX impact
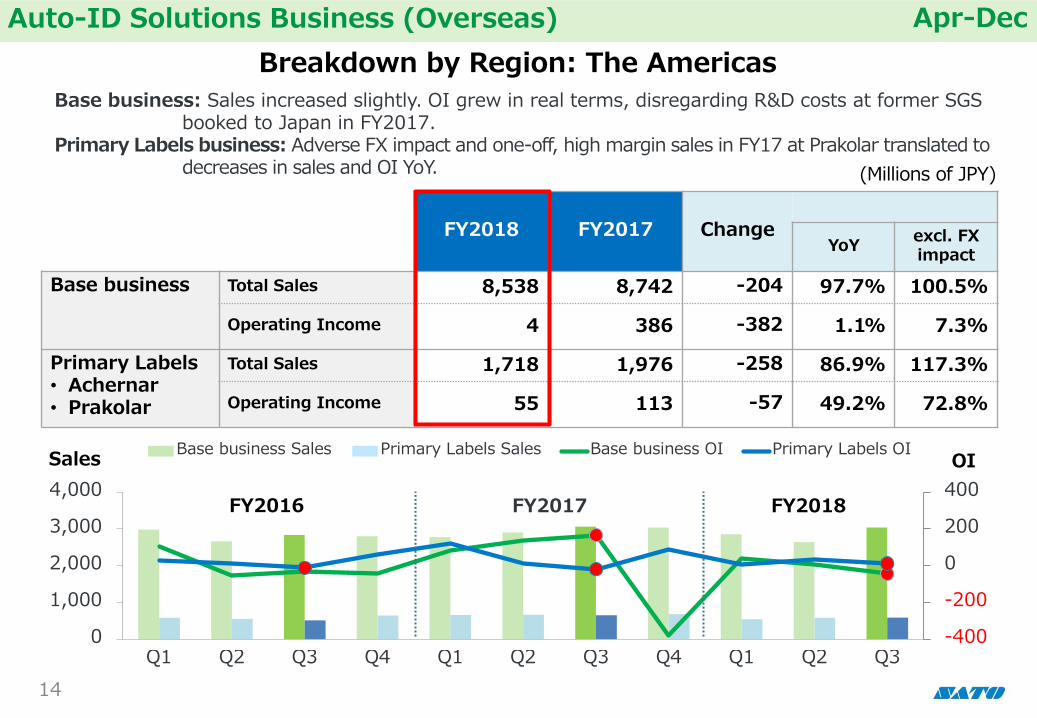
Base business Total Sales 8,538 8,742 -204 97.7% 100.5%
Operating Income 4 386 -382 1.1% 7.3%
Primary Labels • Achernar • Prakolar
Total Sales 1,718 1,976 -258 86.9% 117.3%
Operating Income 55 113 -57 49.2% 72.8%
OI
Base business: Sales increased slightly. OI grew in real terms, disregarding R&D costs at former SGS booked to Japan in FY2017. Primary Labels business: Adverse FX impact and one-off, high margin sales in FY17 at Prakolar translated to decreases in sales and OI YoY. (Millions of JPY)
Auto-ID Solutions Business (Overseas) Apr-Dec
Breakdown by Region: The Americas
-100
-50
0
50
100
150
0
500
1,000
1,500
2,000
2,500
Q1 Q2 Q3 Q4 Q1 Q2 Q3 Q4 Q1 Q2 Q3
Sales Base business Sales Primary Labels Sales Base business OI Primary Labels OI
FY2016 FY2018 FY2017
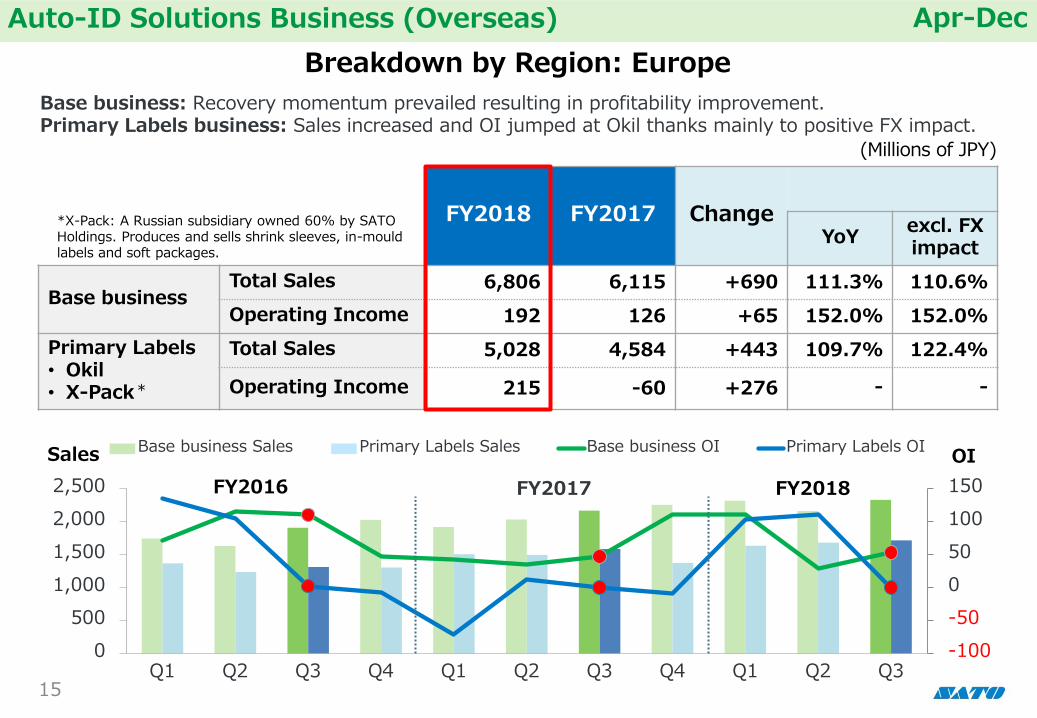
Base business: Recovery momentum prevailed resulting in profitability improvement. Primary Labels business: Sales increased and OI jumped at Okil thanks mainly to positive FX impact.
FY2018 FY2017 Change YoY
excl. FX impact
Base business Total Sales 6,806 6,115 +690 111.3% 110.6%
Operating Income 192 126 +65 152.0% 152.0%
Primary Labels • Okil • X-Pack
Total Sales 5,028 4,584 +443 109.7% 122.4%
Operating Income 215 -60 +276 - -
OI
*
*X-Pack: A Russian subsidiary owned 60% by SATO Holdings. Produces and sells shrink sleeves, in-mould labels and soft packages.
(Millions of JPY)
Auto-ID Solutions Business (Overseas) Apr-Dec
Breakdown by Region: Europe
15

FY2018 FY2017 Change YoY
excl. FX impact
Base business
Total Sales 10,925 10,409 +515 105.0% 106.5%
Operating Income 1,497 1,210 +286 123.7% 122.9%
Base business: Most subsidiaries made satisfactory progress. Transition from selling products to providing solutions progressed thanks to improved mindset in the region.
16
(Millions of JPY)
0
200
400
600
800
0
1,000
2,000
3,000
4,000
Q1 Q2 Q3 Q4 Q1 Q2 Q3 Q4 Q1 Q2 Q3
Sales Sales OI
FY2016 FY2018 FY2017
OI
Auto-ID Solutions Business (Overseas) Apr-Dec
Breakdown by Region: Asia/Oceania

FY2018 FY2017
Change YoY
Mechatronics Sales Consumables Sales
20,168
33,229
20,121
32,849
+46 +379
100.2% 101.2%
Total Sales 53,397 52,971 +426 100.8%
Gross Profit Gross Profit %
26,353
49.4%
25,395
47.9%
+958 +1.4pt
103.8% -
Operating Income 4,691 4,059 +631 115.6%
Operating Income % 8.8% 7.7% +1.1pt -
17
Growth remained solid despite some adverse external environments. (Millions of JPY)
0
500
1,000
1,500
2,000
0
5,000
10,000
15,000
20,000
Q1 Q2 Q3 Q4 Q1 Q2 Q3 Q4 Q1 Q2 Q3
OI Sales Sales OI
FY2016 FY2018 FY2017
Auto-ID Solutions Business (Japan) Apr-Dec
Overview
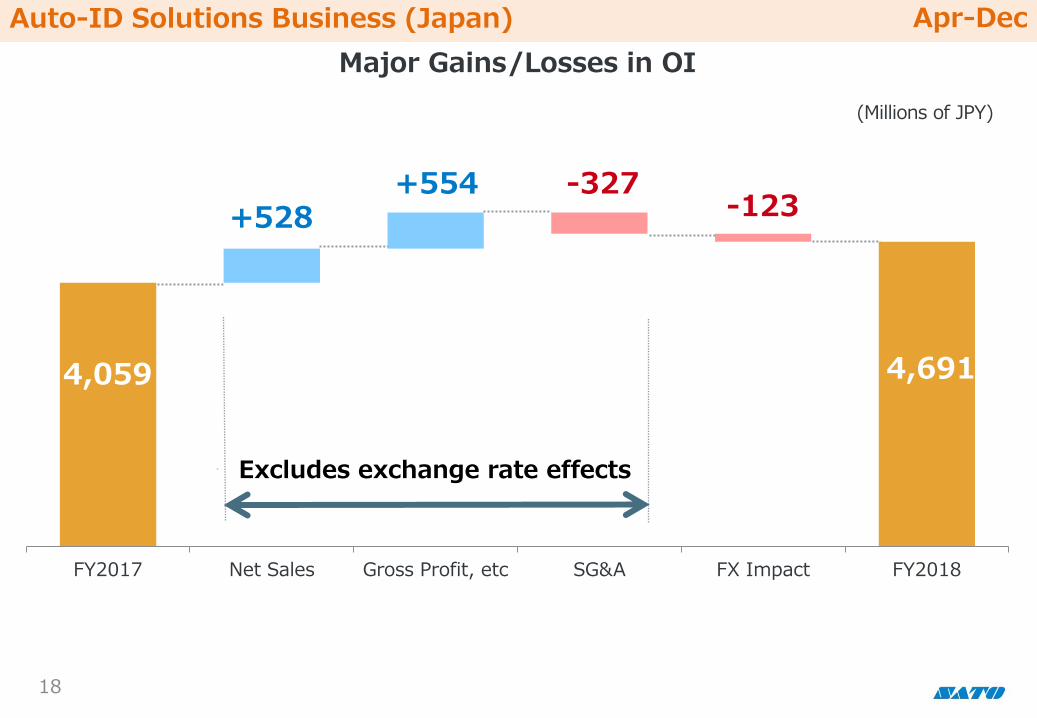
FY2017 Net Sales Gross Profit, etc SG&A FX Impact FY2018
4,691
+528 -327 +554
4,059
18
-123
Excludes exchange rate effects
(Millions of JPY)
Auto-ID Solutions Business (Japan) Apr-Dec
Major Gains/Losses in OI
19
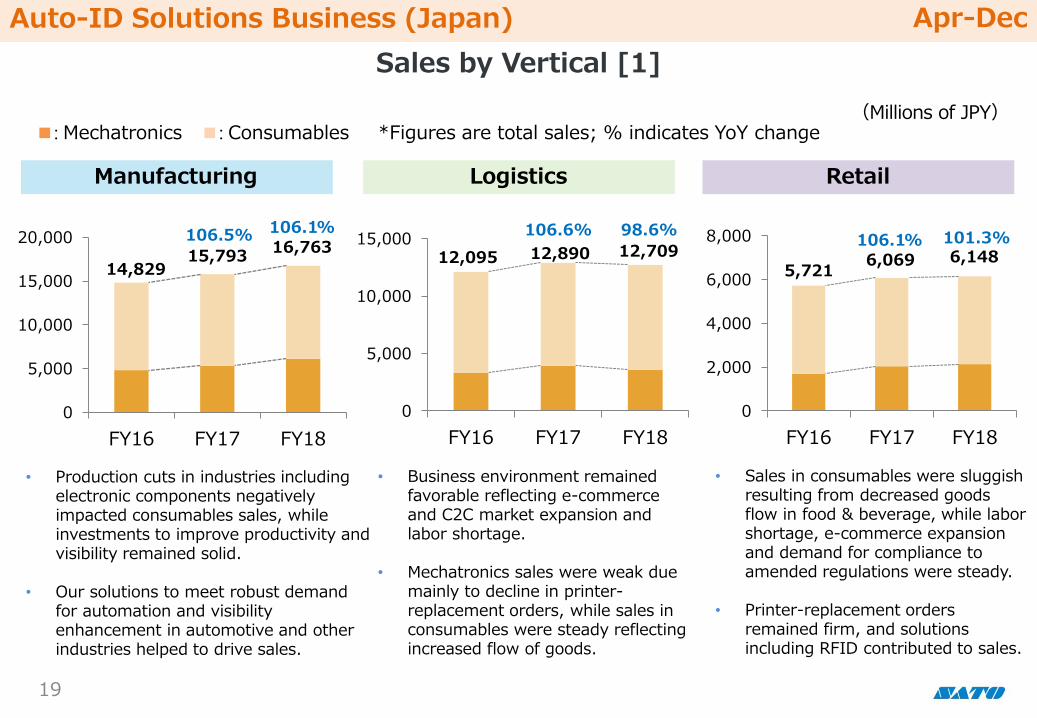
Sales by Vertical [1]
■: Mechatronics ■: Consumables *Figures are total sales; % indicates YoY change (Millions of JPY)
Manufacturing Logistics Retail
0
5,000
10,000
15,000
20,000
FY16 FY17 FY18
千
106.1% 106.5%
14,829 15,793
16,763
0
5,000
10,000
15,000
FY16 FY17 FY18
千
98.6% 106.6%
12,095 12,890 12,709
0
2,000
4,000
6,000
8,000
FY16 FY17 FY18
101.3% 106.1%
5,721 6,069 6,148
• Production cuts in industries including electronic components negatively impacted consumables sales, while investments to improve productivity and visibility remained solid.
• Our solutions to meet robust demand
for automation and visibility enhancement in automotive and other industries helped to drive sales.
• Business environment remained favorable reflecting e-commerce and C2C market expansion and labor shortage.
• Mechatronics sales were weak due mainly to decline in printer-replacement orders, while sales in consumables were steady reflecting increased flow of goods.
• Sales in consumables were sluggish resulting from decreased goods flow in food & beverage, while labor shortage, e-commerce expansion and demand for compliance to amended regulations were steady.
• Printer-replacement orders remained firm, and solutions including RFID contributed to sales.
Auto-ID Solutions Business (Japan) Apr-Dec

20
Health Care Food & Beverage Public
0
2,000
4,000
6,000
FY16 FY17 FY18
千
4,764 4,918 4,969 101.0% 103.2%
0
2,000
4,000
6,000
8,000
FY16 FY17 FY18
千
100.8% 103.5%
5,510 5,703 5,750
0
1,000
2,000
3,000
FY16 FY17 FY18
千
80.6%
134.3%
1,654
2,221
1,789
■: Mechatronics ■: Consumables *Figures are total sales; % indicates YoY change (Millions of JPY)
• Business environment remained favorable due mainly to reinforcement of regulations related to barcode labeling of medicine and medical devices, and labor shortage.
• In addition to barcodes, demand for solutions utilizing RFID and positioning systems remained steady.
• Business environment remained favorable as the industry sought compliance to the amended Food Labeling Act and automation to mitigate labor shortage.
• Opportunities increased in printer
replacements and solutions for law compliance, and demand to improve traceability in the beverage industry stayed in good shape.
• Business environment remained stable.
• Consumables sales slowed down owing to the lack of a large printer order seen in FY17, and to reduced orders from the same customer seeking operational efficiency and order smoothing.
Auto-ID Solutions Business (Japan) Apr-Dec
Sales by Vertical [2]
-500
-400
-300
-200
-100
0
100
0
25
50
75
100
125
150
Q1 Q2 Q3 Q4 Q1 Q2 Q3 Q4 Q1 Q2 Q3
Sales Sales OI
FY2016 FY2018 FY2017
21
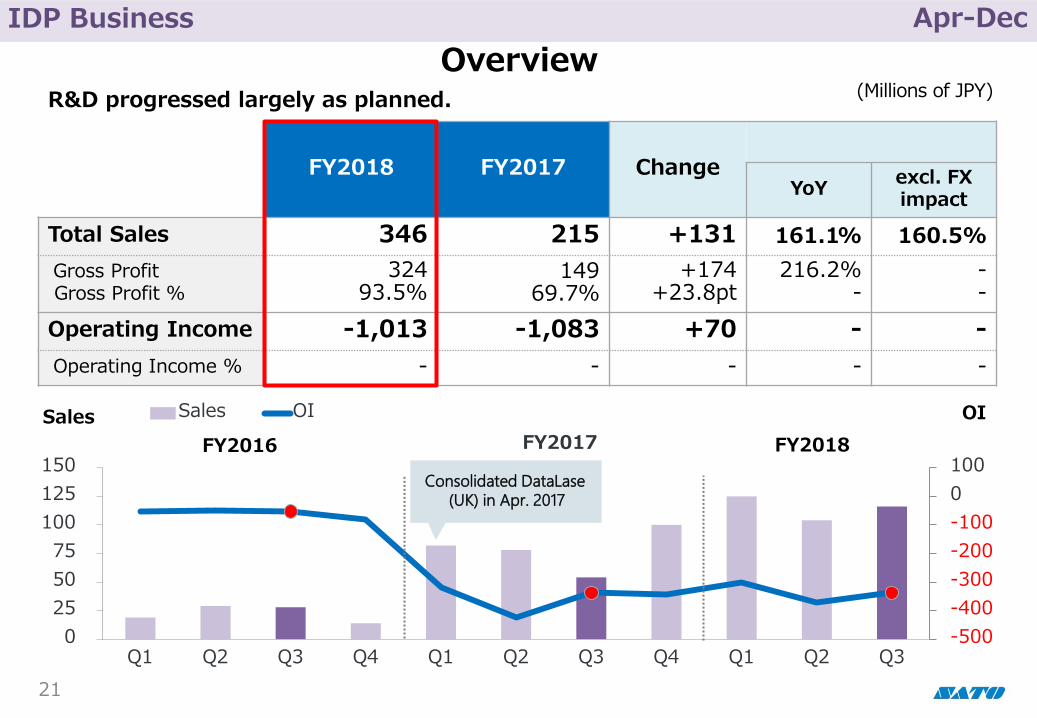
Overview R&D progressed largely as planned.
OI
FY2018 FY2017 Change YoY
excl. FX impact
Total Sales 346 215 +131 161.1% 160.5%
Gross Profit Gross Profit %
324 93.5%
149 69.7%
+174 +23.8pt
216.2% -
- -
Operating Income -1,013 -1,083 +70 - -
Operating Income % - - - - -
(Millions of JPY)
Consolidated DataLase (UK) in Apr. 2017
IDP Business Apr-Dec
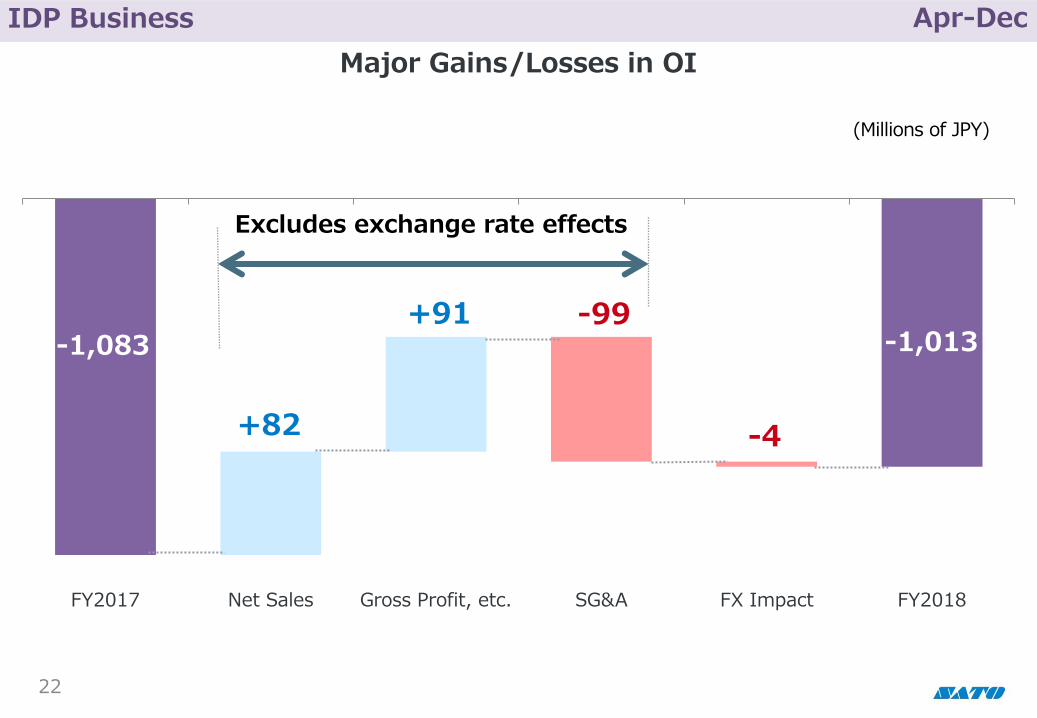
FY2017 Net Sales Gross Profit, etc. SG&A FX Impact FY2018
-1,083
+82 -4
-1,013 +91
22
-99
(Millions of JPY)
IDP Business Apr-Dec
Major Gains/Losses in OI
Excludes exchange rate effects
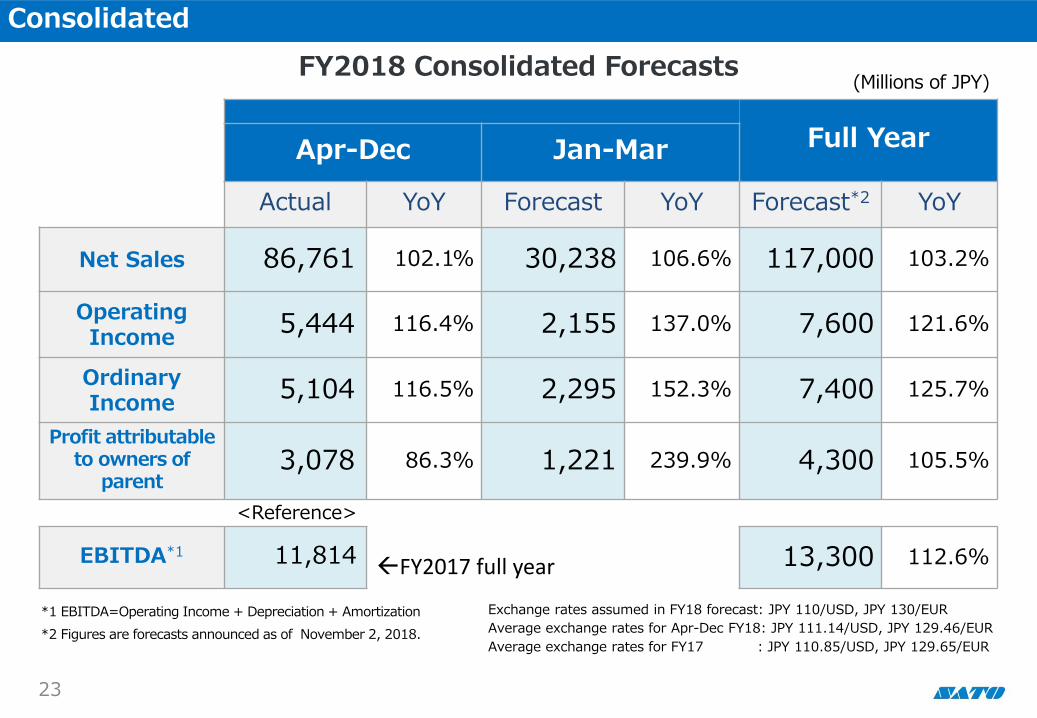
Full Year Apr-Dec Jan-Mar
Actual YoY Forecast YoY Forecast*2 YoY
Net Sales 86,761 102.1% 30,238 106.6% 117,000 103.2%
Operating Income
5,444 116.4% 2,155 137.0% 7,600 121.6%
Ordinary Income
5,104 116.5% 2,295 152.3% 7,400 125.7%
Profit attributable to owners of
parent 3,078 86.3% 1,221 239.9% 4,300 105.5%
EBITDA*1 11,814 13,300 112.6%
(Millions of JPY)
23
Exchange rates assumed in FY18 forecast: JPY 110/USD, JPY 130/EUR
Average exchange rates for Apr-Dec FY18: JPY 111.14/USD, JPY 129.46/EUR
Average exchange rates for FY17 : JPY 110.85/USD, JPY 129.65/EUR
*1 EBITDA=Operating Income + Depreciation + Amortization
*2 Figures are forecasts announced as of November 2, 2018.
<Reference>
FY2017 full year
Consolidated
FY2018 Consolidated Forecasts

24
Appendix
SATO Terminologies P.25 – P.28

SATO Terminologies (1/4)
25
SATO-unique business
concepts/initiatives Description
1 Auto-ID Solutions business
Our business that carries out DCS & Labeling +One. It is specifically about integrating barcode printers/labels,
software and services designed in-house and products from partners to resolve customers’ worksite issues. It
involves matching data with people and things by tagging them with variable information.
It breaks down into Overseas and Japan businesses. The latter is made up of Base and Primary Labels
businesses.
2
Auto-ID Solutions business
overseas: Base business and
Primary Labels business
The overseas segment of our auto-ID Solutions business is made up of Base business (tagging variable
information at worksites) and Primary Labels business (handles fixed information, i.e., labels on products such
as beverages and everyday goods.) The Primary Labels business consists of Achernar (Argentina), Prakolar
(Brazil), Okil (Russia) and X-Pack (Russia).
3 IDP business
Develops, manufactures and sells special materials used mainly in Inline Digital Printing. A reporting segment
established new in FY 2017 as “Materials business,” it was renamed to “IDP business” in FY 2018 to reflect our
focus on IDP technology.
4 Tagging
The physical process of attaching identifier data to things and people. SATO is committed to tagging a diverse
range of objects handled by different businesses, drawing upon a wealth of practical, technical know-how in
auto-ID solutions backed by Genbaryoku.
5
DCS & Labeling +One
(DCS: Data Collection
Systems)
SATO's business model based on a) the systematic collection of data on people and things at business sites
and b) tagging/labeling of information, using accurate, efficient and optimized solutions that incorporate auto-ID
technology such as barcodes and RFID with barcode printers and labels/labeling services.
In line with increasingly sophisticated user needs, SATO also pursues a policy of open innovation and
partnerships to provide value-added "+One" technologies such as voice recognition and location tracking to its
legacy business model to deliver greater customer value.
6 Matching data with people
and things
Connecting people and things at customer sites with information. Ever since our days of pioneering in hand
labelers that tagged price information to products, this concept has remained central to SATO’s business.
7 Genbaryoku Our core competency of going to customer sites to understand their operations and identify the essence of
issues to offer optimized solutions.
SATO-unique business
concepts/initiatives Description
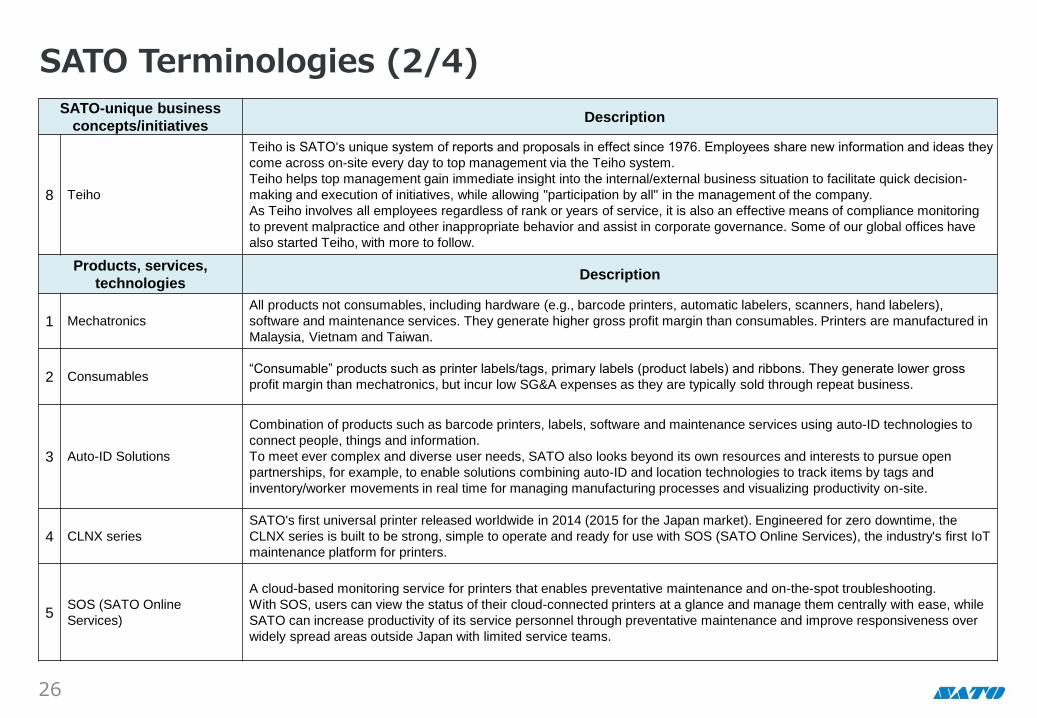
8 Teiho
Teiho is SATO‘s unique system of reports and proposals in effect since 1976. Employees share new information and ideas they
come across on-site every day to top management via the Teiho system.
Teiho helps top management gain immediate insight into the internal/external business situation to facilitate quick decision-
making and execution of initiatives, while allowing "participation by all" in the management of the company.
As Teiho involves all employees regardless of rank or years of service, it is also an effective means of compliance monitoring
to prevent malpractice and other inappropriate behavior and assist in corporate governance. Some of our global offices have
also started Teiho, with more to follow.
Products, services,
technologies Description
1 Mechatronics
All products not consumables, including hardware (e.g., barcode printers, automatic labelers, scanners, hand labelers),
software and maintenance services. They generate higher gross profit margin than consumables. Printers are manufactured in
Malaysia, Vietnam and Taiwan.
2 Consumables “Consumable” products such as printer labels/tags, primary labels (product labels) and ribbons. They generate lower gross
profit margin than mechatronics, but incur low SG&A expenses as they are typically sold through repeat business.
3 Auto-ID Solutions
Combination of products such as barcode printers, labels, software and maintenance services using auto-ID technologies to
connect people, things and information.
To meet ever complex and diverse user needs, SATO also looks beyond its own resources and interests to pursue open
partnerships, for example, to enable solutions combining auto-ID and location technologies to track items by tags and
inventory/worker movements in real time for managing manufacturing processes and visualizing productivity on-site.
4 CLNX series
SATO's first universal printer released worldwide in 2014 (2015 for the Japan market). Engineered for zero downtime, the
CLNX series is built to be strong, simple to operate and ready for use with SOS (SATO Online Services), the industry's first IoT
maintenance platform for printers.
5 SOS (SATO Online
Services)
A cloud-based monitoring service for printers that enables preventative maintenance and on-the-spot troubleshooting.
With SOS, users can view the status of their cloud-connected printers at a glance and manage them centrally with ease, while
SATO can increase productivity of its service personnel through preventative maintenance and improve responsiveness over
widely spread areas outside Japan with limited service teams.
SATO Terminologies (2/4)
26
Products, services, technologies Description
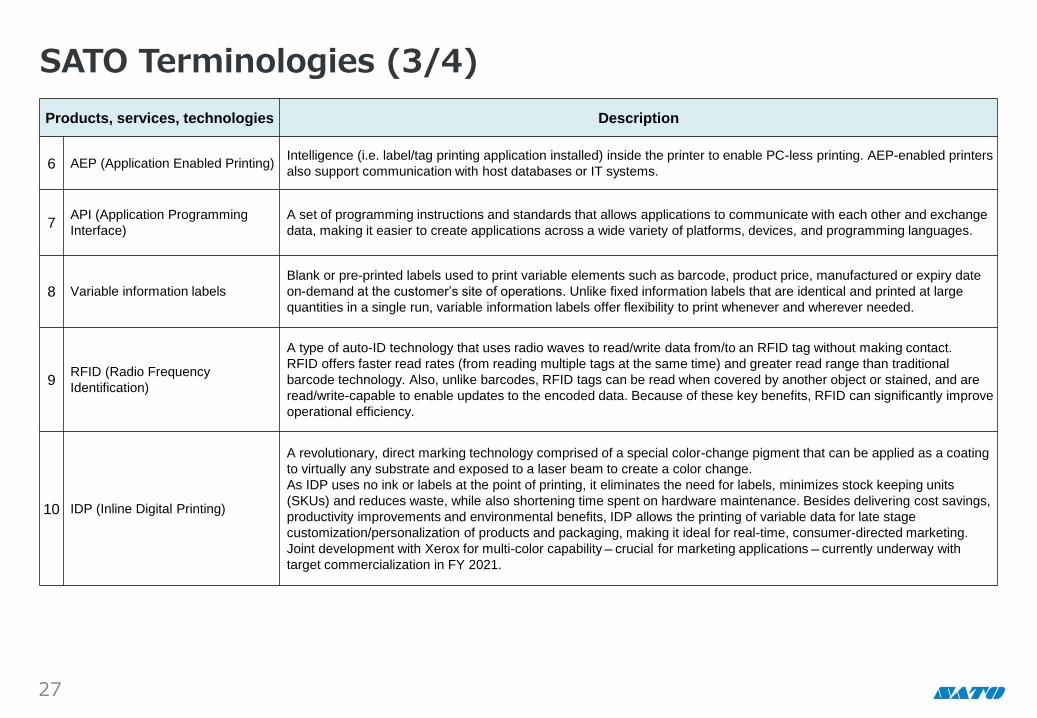
6 AEP (Application Enabled Printing) Intelligence (i.e. label/tag printing application installed) inside the printer to enable PC-less printing. AEP-enabled printers
also support communication with host databases or IT systems.
7 API (Application Programming
Interface)
A set of programming instructions and standards that allows applications to communicate with each other and exchange
data, making it easier to create applications across a wide variety of platforms, devices, and programming languages.
8 Variable information labels
Blank or pre-printed labels used to print variable elements such as barcode, product price, manufactured or expiry date
on-demand at the customer’s site of operations. Unlike fixed information labels that are identical and printed at large
quantities in a single run, variable information labels offer flexibility to print whenever and wherever needed.
9 RFID (Radio Frequency
Identification)
A type of auto-ID technology that uses radio waves to read/write data from/to an RFID tag without making contact.
RFID offers faster read rates (from reading multiple tags at the same time) and greater read range than traditional
barcode technology. Also, unlike barcodes, RFID tags can be read when covered by another object or stained, and are
read/write-capable to enable updates to the encoded data. Because of these key benefits, RFID can significantly improve
operational efficiency.
10 IDP (Inline Digital Printing)
A revolutionary, direct marking technology comprised of a special color-change pigment that can be applied as a coating
to virtually any substrate and exposed to a laser beam to create a color change.
As IDP uses no ink or labels at the point of printing, it eliminates the need for labels, minimizes stock keeping units
(SKUs) and reduces waste, while also shortening time spent on hardware maintenance. Besides delivering cost savings,
productivity improvements and environmental benefits, IDP allows the printing of variable data for late stage
customization/personalization of products and packaging, making it ideal for real-time, consumer-directed marketing.
Joint development with Xerox for multi-color capability-crucial for marketing applications-currently underway with
target commercialization in FY 2021.
SATO Terminologies (3/4)
27

Key acquisitions since 2012 Description
1 Argox Information Co., Ltd.
(Taiwan) [2012] Company engaging in the development, production and sales of entry level printers.
2 Achernar S.A. (Argentina) [2012] Company specializing in primary labels.
3 Magellan Technology Pty
Ltd. (Australia)
[2013] Company from which SATO acquired its healthcare business for PJM (Phase Jitter Modulation), a highly
unique RFID technology that can quickly and accurately identify large volumes of tagged items stacked or stored
in any physical orientation even in the presence of metals and liquids. Now SATO Vicinity Pty Ltd.
4 Okil-Holding, JSC (Russia) [2014] Primary label company in which SATO acquired 75% ownership stake.
5 Prakolar Rótulos
Autoadesivos LTDA.
(Brazil)
[2015] Company specializing in primary labels.
6 DataLase Ltd. (UK) [2017] Company engaging in the development, production and sales of the Inline Digital Printing color-change
pigment and related products. Now a SATO consolidated subsidiary.
SATO Terminologies (4/4)
28
©2019 SATO HOLDINGS CORPORATION. All rights reserved.
Specifications subject to change without notice.
Any unauthorized reproduction of the contents of this presentation, in part or whole, is strictly prohibited.
SATO is a registered trademark of SATO Holdings Corporation and its subsidiaries in Japan, the U.S. and other countries.
All other trademarks are the property of their respective owners.