fy2017* annual report japan/world bank...
TRANSCRIPT

FY2017* ANNUAL REPORT
JAPAN/WORLD BANK GRADUATE SCHOLARSHIP PROGRAM
TABLE OF CONTENTS
Overview: Japan’s Investment in Human Capital in Partnership with the World
Bank.............................................................................................................................................1
Selection of the 2017 Cohort of JJ/WBGSP cholars………………………………………………….9
Administration of the Scholarship Program …….……………………………………………………13
Statistical Tables………………………………………………………………………………………. 16
*FY 2017 covers between July 1,2016 and June 30, 2017

1
FY2017 ANNUAL REPORT
JAPAN/WORLD BANK GRADUATE SCHOLARSHIP PROGRAM
I. Overview: Japan’s Investment in Human Capital in
Partnership with the World Bank Japan's commitment to invest in human resources in developing countries is rooted in its own
experiences after World War II. The country's startling postwar economic growth and its
fundamental transformation from World Bank recipient to major World Bank donor were grounded
in the rapid growth of its broad human resource base. This distinct development pathway has led
Japan in its desire to support the poorest countries in their endeavors to enhance the expertise
and skill levels of aspiring practitioners and leaders and to contribute to policy reform for economic
growth and social development.
Japan has partnered with the World Bank in support of this development objective over the years,
including through two programs administered under the Japan-funded and World Bank–
administered Policy and Human Resources Development Fund (PHRD): (a) the Japan Indonesia
Presidential Scholarship Program (JIPS) and (b) the Joint Japan/World Bank Graduate
Scholarship Program (JJ/WBGSP).
Although they are distinct in country coverage, both programs share the broad objective of
transferring skills and knowledge through graduate studies, with the goal of encouraging and
strengthening the development of human resources in developing countries. And in both
programs, scholars from developing countries commit to return to their home countries to work
after completion of their studies, which ensures that developing countries benefit from the
scholars’ newly acquired knowledge and skills. Program achievements in 2017 are highlighted in
Box 1.
JJ/WBGSP scholars graduate from GRIPS University, 2017. Photo courtesy of Koichi Omori
Japan Indonesia Presidential Scholarship Program
As part of the international effort to support Indonesia’s higher education system, in 2008 the government of Japan gave a one-time grant of $10 million through the Japan Policy and Human Resources Development Fund (PHRD) for scholarships specifically designated for Indonesian fellows. Through this grant, Japan has supported three cohorts from 2008 to 2010 (a total of 43 Indonesian scholars) in undertaking doctoral studies abroad. Each scholar is sponsored by one of the program’s nine partner Centers of Excellence, which are located at Indonesian universities and higher education institutes. The Centers of Excellence are listed in box 2. After graduating, scholars return to work for the Indonesian university partner that sponsored their study and help
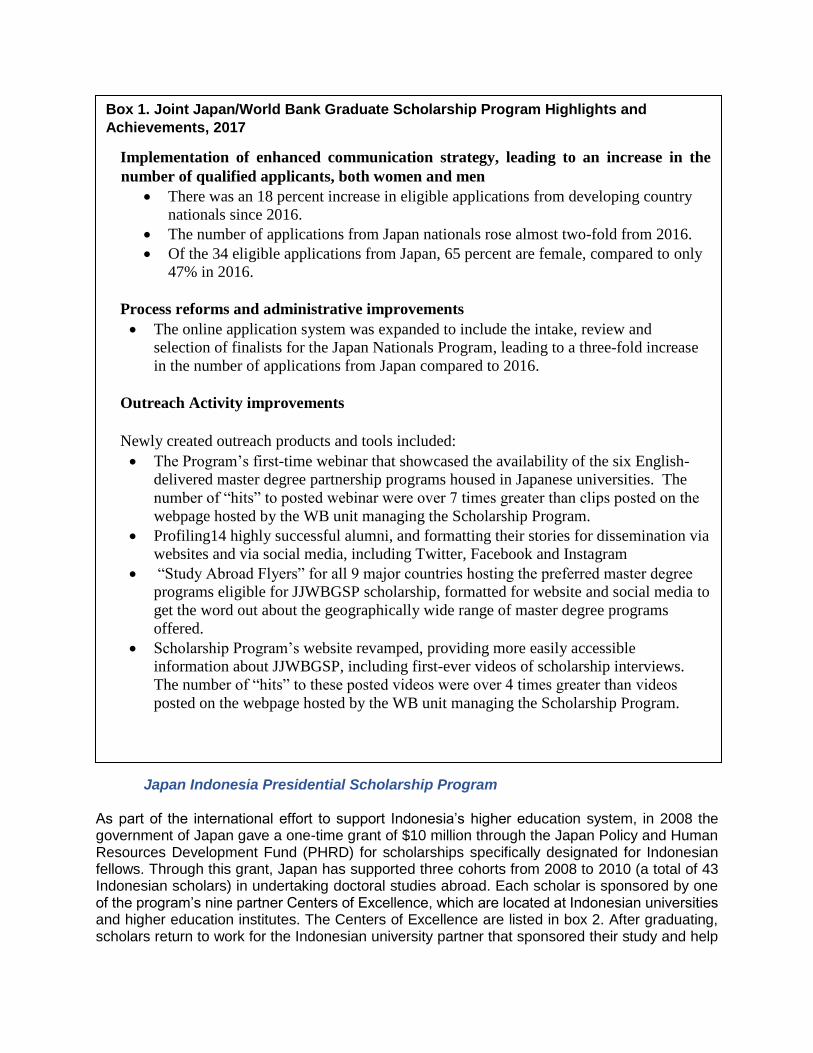
Box 1. Joint Japan/World Bank Graduate Scholarship Program Highlights and
Achievements, 2017
Implementation of enhanced communication strategy, leading to an increase in the
number of qualified applicants, both women and men
• There was an 18 percent increase in eligible applications from developing country
nationals since 2016.
• The number of applications from Japan nationals rose almost two-fold from 2016.
• Of the 34 eligible applications from Japan, 65 percent are female, compared to only
47% in 2016.
Process reforms and administrative improvements
• The online application system was expanded to include the intake, review and
selection of finalists for the Japan Nationals Program, leading to a three-fold increase
in the number of applications from Japan compared to 2016.
Outreach Activity improvements
Newly created outreach products and tools included:
• The Program’s first-time webinar that showcased the availability of the six English-
delivered master degree partnership programs housed in Japanese universities. The
number of “hits” to posted webinar were over 7 times greater than clips posted on the
webpage hosted by the WB unit managing the Scholarship Program.
• Profiling14 highly successful alumni, and formatting their stories for dissemination via
websites and via social media, including Twitter, Facebook and Instagram
• “Study Abroad Flyers” for all 9 major countries hosting the preferred master degree
programs eligible for JJWBGSP scholarship, formatted for website and social media to
get the word out about the geographically wide range of master degree programs
offered.
• Scholarship Program’s website revamped, providing more easily accessible
information about JJWBGSP, including first-ever videos of scholarship interviews.
The number of “hits” to these posted videos were over 4 times greater than videos
posted on the webpage hosted by the WB unit managing the Scholarship Program.

1
to forge a relationship between the Indonesian university and the foreign university. As of June 2017, all 43 JIPS scholars have graduated. This program finalized disbursing its funds and is no longer accepting new applicants
Box 2. Japan Indonesia Presidential Scholarship Program Centers of Excellence
Bandung Institute of Technology (biotechnology)
Bogor Agricultural University (bioenergy)
Bogor Agricultural University (bioindustry and business)
Gadjah Mada University (good corporate governance)
Indonesia University of Education (special needs education)
Open University (distance learning)
Parahyangan Catholic University (infrastructure and urban development)
Parahyangan Catholic University (development of small and medium enterprises)
University of Indonesia (reproductive health)
Joint Japan/World Bank Graduate Scholarship Program
JJ/WBGSP, which started in 1987, targets mid-career professionals working in development
fields. The program provides financing for professionals to study abroad for up to 24 months. To
date, there are over 6000 alumni from 153 countries. Approximately every three years, the World
Bank administers a survey of alumni to track their professional achievements and development
impact after they complete their JJ/WBGSP-funded studies.
The JJ/WBGSP awards scholarships through three subprograms: (a) the Preferred Program, (b)
the Partnership Program, and (c) the Japanese Nationals Program. In 2017, the Partnership
Program is the largest subprogram, with 48 percent of all scholarships awarded under the
program. The Preferred Program is the second-largest subprogram, with 45 percent of the
scholarships awarded since 1987. The Japanese Nationals Program is the smallest subprogram,
awarding 15 scholarships per year and representing 7 percent of all scholarship awardees. Figure
1 and Table 1 provide more detailed time-series data.
Currently there are 227 preferred master’s degree programs for which JJWNGSP scholarships
are available. Typically, fewer than 150 scholarships are offered through this subprogram each
year, so a preferred program is not guaranteed to educate one or more scholars each year. Annex
table A.19 provides a complete list of the preferred programs.
There are 14 partnership master degree programs for which JJWBGSP scholarships are
available. These programs are located in 13 universities, which include five in Japan—the
University of Tokyo, Yokohama National University, the University of Tsukuba, Keio University,
and the Graduate Institute for Policy Studies; two in the United States—Harvard University and
Columbia University; and six in Africa—the University of Yaoundé II in Cameroon, the University
of Cocody –Abidjan in Côte d’Ivoire, the University of Ghana, Makerere University in Uganda, the
University of Zambia, and the University of Kinshasa in the Democratic Republic of Congo.

2
Japanese nationals are permitted to get a scholarship for up to 2 years of financing a masters or
PhD degree, and there is no restriction on their choice of university, as long as the graduate
program focuses on a development topic.
Application and Selection Process
a) Partnerships and Preferred Programs Applicants wishing to apply for scholarships through the Partner and Preferred Programs must
meet the JJ/WBGSP eligibility criteria:
-Be a national of a World Bank member country
-Not hold dual citizenship with a developed country
- Be in good health
- Hold a bachelor’s (or equivalent) degree earned at least three years prior to the
application deadline
- Have three years or more of recent development-related experience after earning a
bachelor’s (or equivalent) degree
-Be accepted unconditionally to enroll in the upcoming academic year for a master’s
degree in at least one of the JJ/WBGSP Preferred or Partner Programs
- Not be an executive director or alternate, a staff member under any type of appointment
of the World Bank Group, or a close relative of the aforementioned by blood or adoption
Preferred Program applicants submit their applications to the university and to the scholarship
program in parallel. For each partner program, the partner university first short-lists eligible
candidates, who are then invited by the JJWBGSP Secretariat to apply for a scholarship.
In 2014, the program launched an online application system to manage the intake and review of
applications for the Preferred Program, and then expanded the system in 2016 to include the
Partnership Program.
The selection process is similar across both programs, with applications for scholarships
processed through a multilevel screening process. First each application is screened to determine
if it meets the eligibility criteria. Each eligible application is reviewed and scored by two
independent expert reviewers, to identify those candidates who have the highest potential to
influence development after completion of their graduate studies. In addition to the scoring,
geographic and gender balances are considered, as well as applicants’ socioeconomic
background in identifying the finalists. The finalists from the Preferred Program are presented
once per year to the JJ/WBGSP Steering Committee (composed of members of the World Bank
Board of Directors and World Bank management) for final review and selection of the recipients.
The finalists from the Partner program are cleared by the Executive Director for Japan on a rolling
basis throughout the year and reported to the full Steering Committee at the end of each Fiscal
Year.
b) Japan Nationals Program Japan Nationals must meet the following eligibility criteria:
- Be a Japanese national - Be in good health - Hold a bachelor’s (or equivalent) degree earned at least three years prior to the
application deadline

3
- Be a current graduate student or be accepted unconditionally to enroll in an upcoming academic year for a graduate degree in a development field Have at least 3 years of full-time paid development-related experience since earning a Bachelor’s degree (or equivalent university degree) and within the past six years from the date of the Application Deadline
- Not employed by the Government of Japan or its related agencies, including local governments and the Central Bank at the time of application
- Not be an executive director or alternate, a staff member under any type of appointment of the World Bank Group, or a close relative of the aforementioned by blood or adoption,
- Have not received any scholarship funds from the Government of Japan to help finance a graduate degree
In 2017, an online application system was created and launched to manage the intake and
review of applications for the Japan Nationals Program. The selection of finalists from Japan
is conducted in two phases. First, two highly experienced reviewers assessed the applications
for eligibility and merit. The program manager creates a list of finalists based on the reviewers’
inputs. The program manager shares the list of all eligible applicants and the rationale for the
selection with the adviser to the Executive Director for Japan before presenting the list of
finalists to the Steering Committee for approval.
Figure 1. JJWBGSP Preferred and Partnerships Awards, 1988-2017
0
50
100
150
200
250
300
350
400
88 89 90 91 92 93 94 95 96 97 98 99 00 01 02 03 04 05 06 07 08 09 10 11 12 13 14 15 16 17
54 4885
79
102109
96103
107
108
127
168
265
100
108254
285
7968
99150
236
205142
105
120
104
136
109910 0
0 023 26 46 60 48 67
67
82
77
9365
87
70
9461
80
63
104
74
83
81112
74
91
60 97
Nu
mb
er o
f S
cho
lars
PartnershipPrograms
PreferredProgram

4
Figure 2. Preferred Program Applicants and Scholars, 2008-2017
0
450
900
1,350
1,800
2,250
2,700
3,150
3,600
4,050
4,500
4,950
13 14 15 16 17
Nu
mb
er o
f S
cho
lars
Regular Program Applicants and Scholars , 2013-2017
Applicants
Eligible
Scholars

5
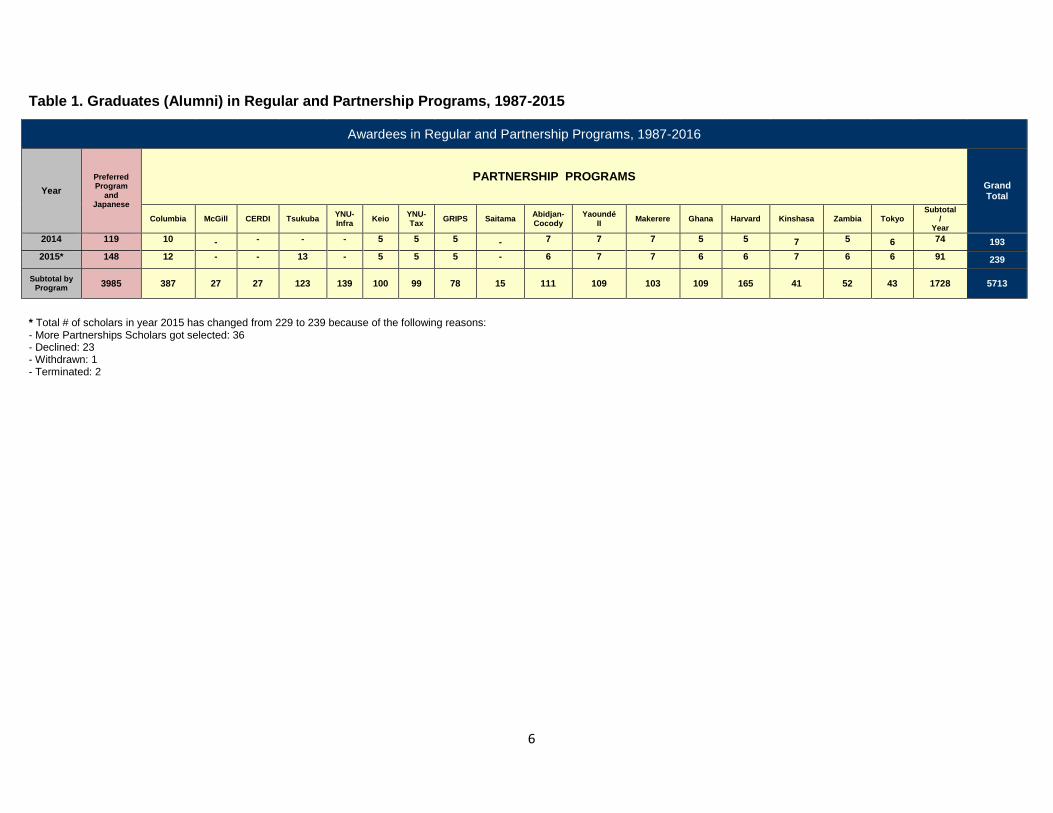
Table 1. Graduates (Alumni) in Regular and Partnership Programs, 1987-2015
Awardees in Regular and Partnership Programs, 1987-2016
Year
Preferred Program
and Japanese
PARTNERSHIP PROGRAMS Grand Total
Columbia McGill CERDI Tsukuba YNU-Infra
Keio YNU- Tax
GRIPS Saitama Abidjan-Cocody
Yaoundé II
Makerere Ghana Harvard Kinshasa Zambia Tokyo Subtotal
/ Year
1987 32 - - - - - - - - - - - - - - - - - 0 32
1988 58 - - - - - - - - - - - - - - - - - 0 58
1989 54 - - - - - - - - - - - - - - - - - 0 54
1990 90 - - - - - - - - - - - - - - - - - 0 90
1991 87 - - - - - - - - - - - - - - - - - 0 87
1992 106 23 - - - - - - - - - - - - - - - 23 129
1993 117 26 - - - - - - - - - - - - - - - 26 143
1994 102 24 11 11 - - - - - - - - - - - - - - 46 148
1995 110 26 8 8 9 9 - - - - - - - - - - - - 60 170
1996 116 25 - 8 - - 5 10 - - - - - - - - - - 48 164
1997 122 24 8 - 10 15 5 - - 5 - - - - - - - - 67 189
1998 146 23 - - - - 5 10 - 5 6 7 6 5 - - - - 67 213
1999 177 22 - - 10 15 5 - - 5 - - 7 6 12 - - - 82 259
2000 274 15 - - - - 5 10 5 - 7 7 7 7 14 - - - 77 351
2001 108 15 - - 10 15 5 - 5 - 7 7 7 7 15 - - - 93 201
2002 118 14 - - - - 5 4 5 - 7 7 7 7 9 - - - 65 183
2003 271 13 - - 10 14 5 5 5 - 7 7 7 - 14 - - - 87 358
2004 300 13 - - - - 5 5 5 - 7 7 6 7 15 - - - 70 370
2005 94 12 - - 10 15 5 5 5 - 7 7 6 7 15 - - - 94 188
2006 82 12 - - - - 5 5 4 - 7 6 7 7 8 - - - 61 143
2007 115 11 - - 9 13 5 5 5 - 7 7 5 7 6 - - - 80 195
2008 165 10 - - - - 5 5 4 - 7 7 4 7 7 - 7 - 63 228
2009 251 10 - - 16 14 5 5 5 - 8 7 6 5 9 7 7 - 104 355
2010 218 12 - - - - 5 5 5 - 7 6 - 7 8 6 6 7 74 292
2011 153 12 - - 12 14 5 5 5 - - - - 7 8 7 8 83 236
2012 118 12 - - - - 5 5 5 - 7 6 7 6 6 7 7 8 81 199
2013 134 11 - - 14 15 5 5 5 - 7 7 7 6 8 7 7 8 112 246
6
Table 1. Graduates (Alumni) in Regular and Partnership Programs, 1987-2015
Awardees in Regular and Partnership Programs, 1987-2016
Year
Preferred Program
and Japanese
PARTNERSHIP PROGRAMS Grand Total
Columbia McGill CERDI Tsukuba YNU-Infra
Keio YNU- Tax
GRIPS Saitama Abidjan-Cocody
Yaoundé II
Makerere Ghana Harvard Kinshasa Zambia Tokyo Subtotal
/ Year
2014 119 10 - - - - 5 5 5 - 7 7 7 5 5 7 5 6 74 193
2015* 148 12 - - 13 - 5 5 5 - 6 7 7 6 6 7 6 6 91 239
Subtotal by Program
3985 387 27 27 123 139 100 99 78 15 111 109 103 109 165 41 52 43 1728 5713
* Total # of scholars in year 2015 has changed from 229 to 239 because of the following reasons: - More Partnerships Scholars got selected: 36 - Declined: 23 - Withdrawn: 1 - Terminated: 2
7
II. Selection of the 2017 Cohort of JJ/WBGSP Scholars
Japanese Nationals Program
The Scholarship Program enlisted the assistance of the World Bank’s Tokyo office, as well as
online professional networks, to recruit qualified applicants. The website of the World Bank’s
Tokyo office hosted a web page for the JJ/WBGSP’s Japanese Nationals Program. And
information on applications for the 2017 cycle was also advertised through media channels
including the Tokyo office’s Facebook page and Twitter.
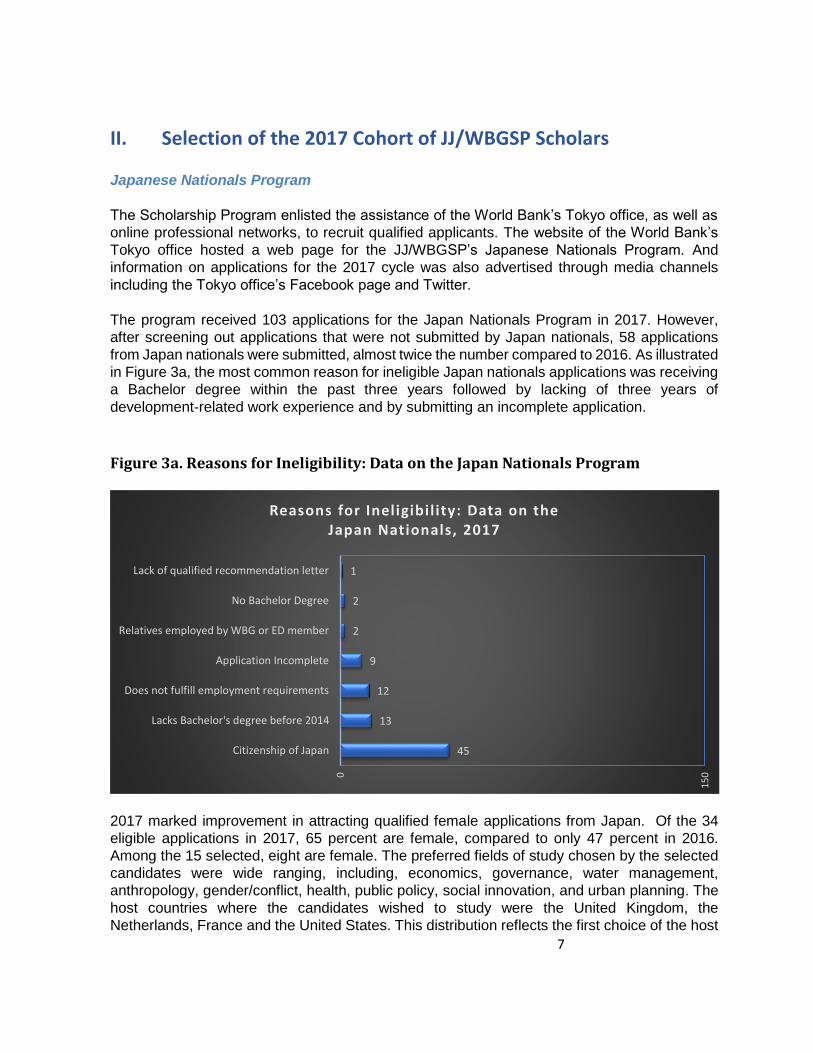
The program received 103 applications for the Japan Nationals Program in 2017. However,
after screening out applications that were not submitted by Japan nationals, 58 applications
from Japan nationals were submitted, almost twice the number compared to 2016. As illustrated
in Figure 3a, the most common reason for ineligible Japan nationals applications was receiving
a Bachelor degree within the past three years followed by lacking of three years of
development-related work experience and by submitting an incomplete application.
Figure 3a. Reasons for Ineligibility: Data on the Japan Nationals Program
2017 marked improvement in attracting qualified female applications from Japan. Of the 34
eligible applications in 2017, 65 percent are female, compared to only 47 percent in 2016.
Among the 15 selected, eight are female. The preferred fields of study chosen by the selected
candidates were wide ranging, including, economics, governance, water management,
anthropology, gender/conflict, health, public policy, social innovation, and urban planning. The
host countries where the candidates wished to study were the United Kingdom, the
Netherlands, France and the United States. This distribution reflects the first choice of the host
45
13
12
9
2
2
1
0
15
0
Citizenship of Japan
Lacks Bachelor's degree before 2014
Does not fulfill employment requirements
Application Incomplete
Relatives employed by WBG or ED member
No Bachelor Degree
Lack of qualified recommendation letter
Reasons for Ineligibil ity: Data on the Japan Nationals, 2017

8
university provided by the candidates. However, many candidates applied to multiple
universities, and the final distribution of the scholars in host countries could vary slightly.
Partnership Program
Through university partnership arrangements, the JJWBGSP Secretariat received close to 200
short-listed applications, of which 97 applicants were awarded scholarships to attend Partner
University Master Programs.
Preferred Program
In 2017, the JJ/WBGSP received 5,217 applications for the Preferred Program for the academic
year 2017-2018, submitted through the online application system. These applications came
from 126 countries. The initial screening found that 2,530 applicants were ineligible. In the
second screening, 15 external reviewers performed online evaluations of 2,687 applicants,
identifying an additional 559 ineligible applications, which left 2,128 eligible applications to be
scored.
The reasons applicants were found ineligible are outlined in figure 3b. Applicants can be
ineligible for more than one reason. Receiving a Bachelors degree within the past three years
was the most common reason for ineligibility, followed by submitting an incomplete application,
and not having the required three years of development-related experience.
Figure 3b. Reasons for Ineligibility: Data on the Preferred Program,
Geographic Distribution (Preferred Program)
1253
1046
478
175
66
49
47
21
12
0
15
0
30
0
45
0
60
0
75
0
90
0
10
50
12
00
13
50
Lacks Bachelor's degree before 2014
Application Incomplete
Does not fulfill employment requirements
Number of years of terciary education less than 3
Lack of qualified recommendation letter
Relatives employed by WBG or ED member
No Bachelor Degree
Receive Japanese funds prior graduate degree
Citizenship of a developed country
Reasons for Ineligibil ity: Data on the Preferred Program, 2017

9
In keeping with the aim of maintaining a geographical distribution of awards that takes into
account the distribution of the world’s population and the distribution of eligible applications, the
result shows that the origin of a large majority of eligible applicants (54%) is coming from Africa,
while the larger part of the finalists is coming from South Asia (42%), followed by Africa region
(23%), Latin America and the Caribbean Region (15%), East Asia and Pacific (8%), East and
Central Asia (7%) and the Middle East and North Africa (5%) showed in Figure 4.
Region-specific data that the program acquired on how applicants heard about the scholarship
will be helpful in further refining the outreach strategy for next year.
Figure 4. Preferred Program Awards: Distribution by Home Region, 2017 (percent)
Gender Distribution (Preferred Program)
As female applicants have historically been greatly outnumbered by male applicants (at a ratio of
1:2), the JJ/WBGSP targeted outreach through gender networks for this year’s call. For example,
the promotional flyers about the program mentioned women specifically in the text and used
images of women as part of the design, with the goal of having women look at these pieces and
imagine that the scholars represented could be them. Although there was a significant increase
in the volume of application submitted by women, the share of eligible applications from women
decreased two percentage point from 2016, at 30 percent. The program intends to continue to
strengthen its outreach to women for the next call for applications, using data on the regional
breakout of eligible and ineligible women applicants in 2017 and the ways they heard about the
scholarship.
With women underrepresented in the pool of eligible applications, the JJ/WBGSP has given—
and continues to give—priority to women in the selection of awardees. The share of women
among award recipients has grown rapidly since the program’s inception, from a low of 19
percent in 1988 to a high of 54 percent in 2011. Since that year there has been a gradual
23%
8%
7%
15%5%
42%
Africa
East Asia
Europe and CentralAsia
Latin America andCaribbean
Middle East andNorth Africa
South Asia
10
decline in female awardees, falling to 41 percent in 2017, but still higher than the 30% share of
eligible applicants (see Table 2).
Table 2. Preferred Program Awards: Distribution by Gender and Home Region, 2017
Africa East AsiaEurope and
Central Asia
Latin America &
Caribbean
Middle East & North
AfricaSouth Asia Total
# Women 6 6 4 7 1 13 37
# Men 15 1 2 7 4 25 54
Total 21 7 6 14 5 38 91
Preferred Program Awards: Distribution by Gender and Home Region, 2017
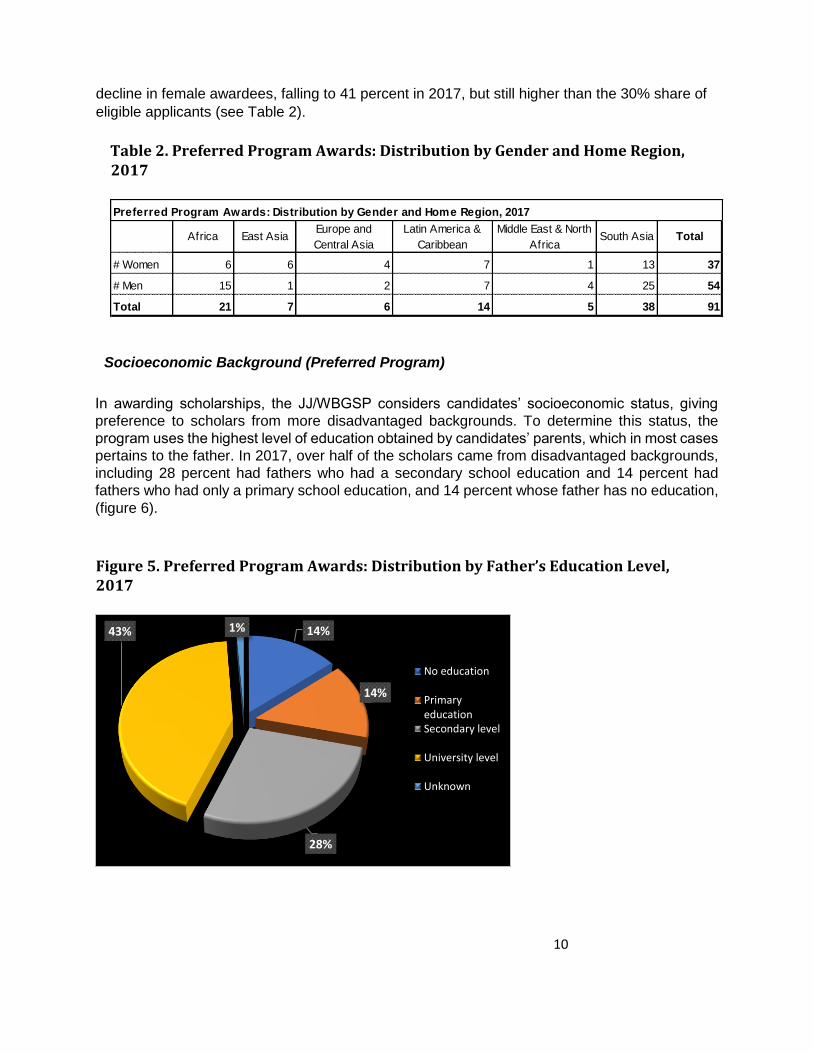
Socioeconomic Background (Preferred Program)
In awarding scholarships, the JJ/WBGSP considers candidates’ socioeconomic status, giving
preference to scholars from more disadvantaged backgrounds. To determine this status, the
program uses the highest level of education obtained by candidates’ parents, which in most cases
pertains to the father. In 2017, over half of the scholars came from disadvantaged backgrounds,
including 28 percent had fathers who had a secondary school education and 14 percent had
fathers who had only a primary school education, and 14 percent whose father has no education,
(figure 6).
Figure 5. Preferred Program Awards: Distribution by Father’s Education Level, 2017
14%
14%
28%
43% 1%
No education
PrimaryeducationSecondary level
University level
Unknown

11
Professional Background (Preferred Program)
By supporting human resource development through its academic programs, the JJ/WBGSP
continues to support institutional capacity building in organizations focused on development. This
is illustrated by the employment distribution of the 2017 finalists: 59 percent come from central,
state, or provincial governments (excluding central banks) in their home countries, and 12 percent
work for domestic or international nongovernmental organizations. In addition, 11 percent work
in central banks, 6 percent in public or private hospitals or health care units, 7 percent in
universities or research institutions, and 1 percent in the private sector (figure 7).
Figure 6. Preferred Program Awards: Distribution by Work Sector, 2017
III. Administration of the Scholarship Program: Improved
Operational Efficiency and Quality Enhancements
The JJ/WBGSP is funded entirely by the government of Japan, as part of its PHRD program, and
effective July 1 2016, is administered by the Development Economics and Chief Economist Vice
Presidency of the World Bank. Quality enhancement and efficiency gains continued in 2017,
directed mainly at improving communication products and outreach efforts, but included as well
work to strengthen partnerships and improve administration processes and products.
7% 4%
59%
8%
1%
11%
6% 2% 2%
Domestic TertiaryUniversity/Academic/Research
Domestic Other Not-for-profit/NGO
Government (excluding CentralBank)
International/Regional Non-profit Organization
Other Private Sector Business
Central Bank
Public or privatehospitals/health care units
Utility Provider (Electric Power,Waste Mngt)
Other/Not provided

12
Communications and Outreach
In 2017, the program accelerated its effort to implement its communications strategy. Examples
include creating:
• The Program’s first-time webinar showcased the availability of the six English-delivered master degree partnership programs housed in Japanese universities. Taking lessons from the webinar initiated and delivered by our partnership program at Harvard, this webinar gave potential applicants insights and information from JJWBGSP scholars currently studying in Japan, as well as from professors and administrators of our partnership programs in Japan. The number of “hits” to posted webinar were over 7 times greater than clips posted on the webpage hosted by the World Bank unit managing the Scholarship Program.
• Communications products targeting developing world populations for which the Scholarship Program has a track record of receiving a disproportionately lower number of quality applications. These efforts included interviewing and creating profiles of 14 highly successful alumni, and formatting their stories and salient quotes for dissemination via websites and via social media, including Twitter, Facebook and Instagram
• “Study Abroad Flyers” for all 9 major countries hosting the preferred master degree programs eligible for JJWBGSP scholarship, formatted for website and social media, to get the word out about the geographically wide range of master degree programs offered.
In addition, the Scholarship Program’s website revamped, providing more easily accessible
information about JJWBGSP, including first-ever videos of scholarship interviews. The number
of “hits” to these posted videos were over 4 times greater than videos posted on the webpage
hosted by the WB unit managing the Scholarship Program.
With the help of these products and tools, the 2017 call for applications was disseminated widely
through the Bank’s internal and external channels. Figures 9 and 10 provides breakdowns of how
applicants heard about the scholarship in 2017. For both Japan nationals and developing country
nationals, the internet search remains an important tool (37 percent) for reaching applicants, and
attention was given to enhancing its content and updating it to make it more user friendly. For
reasons of transparency, the program also published on the website the selection process and
the criteria used to assess applications.

13
Figure 9. How Developing Country Applicants to Preferred Programs Heard about
the Scholarship Program, 2017 (percent)
Figure 10: How Japanese Nationals Applicants Heard about the Scholarship
Program, 2017 (percent)
0%
9%
11%
37%
5%
11%
0%6%
20%
1%0%
Blog
From a previous call for applications
From a previous or current JJ/WBSGPScholar
From an Internet search
Other
Social Media
Through a World Bank office / WorldBank staff located outside my country
Through my employer
Through the overseas university that Iam applying to for a masters degree
Through the World Bank office / WorldBank staff in my country
(blank)
12%
13%
42%
2%
6%
2%
13%10%
From a previous call for applications
From a previous or current JJ/WBSGP Scholar
From an Internet search
Other
Through a World Bank office / World Bankstaff located outside Japan
Through my employer
Through the overseas university that I amapplying this scholarship
Through the World Bank Tokyo office / WorldBank staff member working in the WorldBank Tokyo office

14
Strategic Partnerships
The legal framework for the program was strengthened by updating the scholar award letter
template. Relations with preferred universities continued, updating the list of master’s degree
programs associated with the JJ/WBGSP, and maintaining two-way links with the program’s
website.
Administrative Procedures
Highlights of improved administrate procedures include:
• Continuing to enhance the quality of review of applications by (a) recruiting reviewers
globally (14 of the 16 reviewers were from developing countries across regions), (b)
updating the application form and guidelines to improve the relevance and quality of
information provided in the application, and (c) enhancing the reviewer guidelines and
scoring mechanisms to ensure high quality and uniformity in the assessment of applications
• Switching to an online system for intake and review of applications from Japan nationals.
To conclude, scholars often conclude their studies with an expression of thanks to the funder
and the JJWBGSP Secretariat. In the words of few scholars:

15
STATISTICAL TABLES
Table A1 - Scholarship Awards: Distribution by Region and Gender, 1987-2017
Africa East Asia Europe &
Central Asia Latin America & Caribbean
Middle East & North Africa
South Asia
Part 1 Total
1987- 2013 Total 2053 926 399 653 264 685 301 5,281
# of Men 1336 466 212 372 175 491 157 3209
# of Women 717 460 187 281 89 194 144 2072
2014 Total 96 19 7 17 6 33 15 193
# of Men 63 9 2 7 3 24 3 111
# of Women 33 10 5 10 3 9 12 82
2015 Total 119 24 7 26 12 39 12 239
# of Men 87 11 2 15 7 27 6 155
# of Women 32 13 5 11 5 12 6 84
2016 Total 48 27 13 21 11 49 15 184
# of Men 25 13 9 12 8 36 8 111
# of Women 23 14 4 9 3 13 7 73
2017 Total * 21 7 6 14 5 38 15 106
# of Men 15 1 2 7 4 25 7 61
# of Women 6 6 4 7 1 13 8 45
Total 2,337 1,003 432 731 298 844 358 6,003
# of Men 1,526 500 227 413 197 603 181 3,647
# of Women 811 503 205 318 101 241 177 2356
* 2017 data reflects the number of scholarships awarded. All other data reflect number of scholars who are studying or have completed their degree

16
* Figures in 2017 data reflect the number of scholarships awarded. All other data reflect number of scholars who are studying or have completed their degree
Table A2 - Scholarship Awards: Distribution by Region and Country, 1987-2017 Africa 1987-2013 2014 2015 2016 2017* Total
Angola 7 0 0 0 0 7
Benin 56 5 1 2 0 64
Botswana 21 2 3 1 0 27
Burkina Faso 73 2 3 0 0 78
Burundi 42 0 1 0 1 44
Cameroon 73 4 2 1 1 81
Cape Verde 3 0 0 0 0 3
Central African Republic 41 4 6 1 0 52
Chad 39 3 1 0 0 43
Comoros 21 2 3 0 0 26
Congo, Dem. Rep. of 41 0 1 1 0 43
Congo, Rep. of 32 2 2 0 0 36
Côte d'Ivoire 58 1 4 0 0 63
Djibouti 1 0 0 0 0 1
Eritrea 20 3 4 1 2 30
Ethiopia 115 7 3 4 2 131
Gabon 12 0 0 0 0 12
Gambia The 34 2 3 1 0 40
Ghana 121 2 5 4 1 133
Guinea 45 1 1 0 0 47
Guinea-Bissau 3 0 0 0 0 3
Kenya 129 5 5 1 1 141
Lesotho 20 2 1 0 0 23
Liberia 32 5 2 2 0 41
Madagascar 53 3 2 2 0 60
Malawi 59 2 8 3 1 73
Mali 34 2 2 0 0 38
Mauritania 30 2 0 0 0 32
Mauritius 7 0 0 0 0 7
Mozambique 6 1 0 0 0 7
Namibia 11 1 1 1 0 14
Niger 36 0 2 0 0 38
Nigeria 132 6 15 9 8 170
Rwanda 60 2 4 2 0 68
Sao Tomé & Principe 5 0 0 0 0 5
Senegal 54 1 0 0 0 55
Seychelles 3 0 0 0 0 3
Sierra Leone 65 2 3 2 0 72
Somalia 4 0 0 0 0 4
South Africa 15 0 0 1 0 16
South Sudan 1 1 1 0 0 3
Sudan 62 3 6 1 1 73
Swaziland 13 4 1 1 0 19
Tanzania 96 3 7 1 0 107
Togo 42 1 2 0 0 45
Uganda 110 4 2 0 2 118
Zambia 78 2 1 2 0 83
Zimbabwe 38 4 11 4 1 58
Total 2053 96 119 48 21 2337

17
Table A3 - Scholarship Awards: Distribution by Region and Country, 1987-2017 East Asia & Pacific 1987- 2013 2014 2015 2016 2017* Total Cambodia 36 2 2 1 1 42
China 195 1 2 3 0 201
Fiji 9 1 1 1 0 12
Indonesia 128 2 5 4 0 139
Kiribati 1 0 0 0 0 1
Korea Democratic People's Republic of 16 0 0 0 0 16
Lao PDR 23 0 0 0 0 23
Malaysia 25 1 0 0 0 26
Mongolia 73 1 2 4 2 82
Myanmar 116 1 0 2 1 120
Papua New Guinea 17 1 0 1 0 19
Philippines 114 6 9 8 1 138
Samoa 3 0 0 0 0 3
Thailand 48 0 2 1 1 52
Tonga 4 0 0 0 0 4
Vanuatu 1 0 0 0 0 1
Vietnam 117 3 1 2 1 124
Total 926 19 24 27 7 1003
* Figures in 2017 data reflect the number of scholarships awarded. All other data reflect number of scholars who are studying or have completed their degree
Table A4 - Scholarship Awards: Distribution by Region and Country, 1987-2017 Europe & Central Asia 1987- 2013 2014 2015 2016 2017* Total Albania 20 0 0 0 1 21
Armenia 24 0 1 1 0 26
Azerbaijan 12 0 0 1 0 13
Belarus 10 0 0 0 0 10
Bosnia 5 0 0 0 0 5
Bulgaria 29 0 0 0 0 29
Croatia 4 0 0 0 0 4
Cyprus 1 0 0 0 0 1
Czech Republic 3 0 0 0 0 3
Estonia 4 0 0 0 0 4
Georgia 39 3 0 0 1 43
Hungary 12 0 0 0 0 12
Kazakhstan 18 0 1 1 1 21
Kyrgyz Republic 25 1 2 0 2 30
Latvia 5 0 0 0 0 5
Lithuania 7 0 0 0 0 7
Macedonia FYR 3 0 0 0 0 3
Moldova 12 1 1 0 0 14
Poland 5 0 0 0 0 5
Romania 28 0 0 0 0 28
Russian Federation 23 0 0 1 0 24
Serbia 5 0 0 0 0 5
Slovak Republic 4 0 0 0 0 4
Slovenia 3 0 0 0 0 3
Tajikistan 13 0 0 1 0 14
Turkey 33 0 2 5 1 41
Turkmenistan 6 0 0 1 0 7
Ukraine 14 0 0 0 0 14
Uzbekistan 30 2 0 2 0 34
Yugoslavia 2 0 0 0 0 2
Total 399 7 7 13 6 432 * Figures in 2017 data reflect the number of scholarships awarded. All other data reflect number of scholars who are studying or have completed their degree

18
Table A5 - Scholarship Awards: Distribution by Region and Country, 1987-2017 Latin America & Caribbean 1987 - 2013 2014 2015 2016 2017* Total
Argentina 42 0 2 0 1 45
Bahamas 1 0 0 0 0 1
Belize 2 0 0 0 0 2
Bolivia 30 0 0 0 1 31
Brazil 53 0 4 2 3 62
Chile 42 0 0 1 0 43
Colombia 68 7 4 8 3 90
Costa Rica 17 0 0 0 0 17
Dominica 2 0 0 0 0 2
Dominican Republic 3 1 1 0 0 5
Ecuador 27 0 0 1 0 28
El Salvador 10 0 1 0 0 11
Grenada 4 0 0 0 0 4
Guatemala 9 0 1 0 0 10
Guyana 22 0 0 0 0 22
Haiti 50 0 4 3 1 58
Honduras 11 0 0 0 0 11
Jamaica 11 0 1 0 0 12
Mexico 73 2 1 2 1 79
Nicaragua 13 0 1 0 0 14
Panama 1 0 1 0 0 2
Paraguay 5 0 0 0 0 5
Peru 100 6 4 4 3 117
St. Kitts and Nevis 5 0 0 0 0 5
St. Lucia 7 0 0 0 0 7
St. Vincent 2 0 0 0 0 2
Suriname 1 0 0 0 0 1
Trinidad & Tobago 10 0 0 0 0 10
Uruguay 19 0 0 0 0 19
Venezuela R. B. de 13 1 1 0 1 16
Total 653 17 26 21 14 731
* Figures in 2017 data reflect the number of scholarships awarded. All other data reflect number of scholars who are studying or have completed their degree

19
Table A6 - Scholarship Awards: Distribution by Region and Country, 1987-2017
Middle East & North Africa 1987- 2013 2014 2015 2016 2017* Total
Algeria 38 3 3 3 3 50
Egypt Arab Rep. of 68 1 3 1 0 73
Iran Islamic Rep. of 32 0 1 2 0 35
Iraq 5 0 0 0 0 5
Jordan 27 0 2 2 0 31
Lebanon 8 0 1 0 0 9
Morocco 28 0 0 1 0 29
Syrian Arab Rep. 7 0 1 0 0 8
Tunisia 18 0 1 0 1 20
West Bank & Gaza 16 0 0 0 0 16
Yemen Republic of 17 2 0 2 1 22
Total 264 6 12 11 5 298
* Figures in 2017 data reflect the number of scholarships awarded. All other data reflect number of scholars who are studying or have completed their degree
Table A7 - Scholarship Awards: Distribution by Region and Country, 1987-2017
South Asia 1987- 2013 2014 2015 2016 2017* Total
Afghanistan 23 0 5 1 1 30
Bangladesh 108 7 6 10 5 136
Bhutan 59 7 7 8 16 97
India 183 4 8 9 6 210
Maldives 6 1 0 0 0 7
Nepal 110 4 4 5 3 126
Pakistan 129 8 8 14 4 163
Sri Lanka 67 2 1 2 3 75
Total 685 33 39 49 38 844
* Figures in 2017 data reflect the number of scholarships awarded. All other data reflect number of scholars who are studying or have completed their degree

20
Table A8 - Scholarship Awards: Distribution by Region and Country, 1987-2017
Part 1 1987- 2013 2014 2015 2016 2017* Total
Australia 0 0 0 0 0 0
Belgium 1 0 0 0 0 1
Canada 4 0 0 0 0 4
Ireland 1 0 0 0 0 1
Italy 1 0 0 0 0 1
Japan 288 15 12 15 15 345
Sweden 1 0 0 0 0 1
United Kingdom 1 0 0 0 0 1
United States 4 0 0 0 0 4
Total 301 15 12 15 15 358
* Figures in 2017 data reflect the number of scholarships awarded. All other data reflect number of scholars who are studying or have completed their degree
Table A9 - Total Awardees Regular and Partnership, 1987-2017
Total Awardees 1987- 2013 2014 2015 2016 2017* Total
Total of Developing Member Countries
4,980 178 227 169 91 5,645
Total of Industrial Countries
301 15 12 15 15 358
Total Member Countries
5,281 193 239 184 106 6,003
* Figures in 2017 data reflect the number of scholarships awarded. All other data reflect number of scholars who are studying or have completed their degree
21
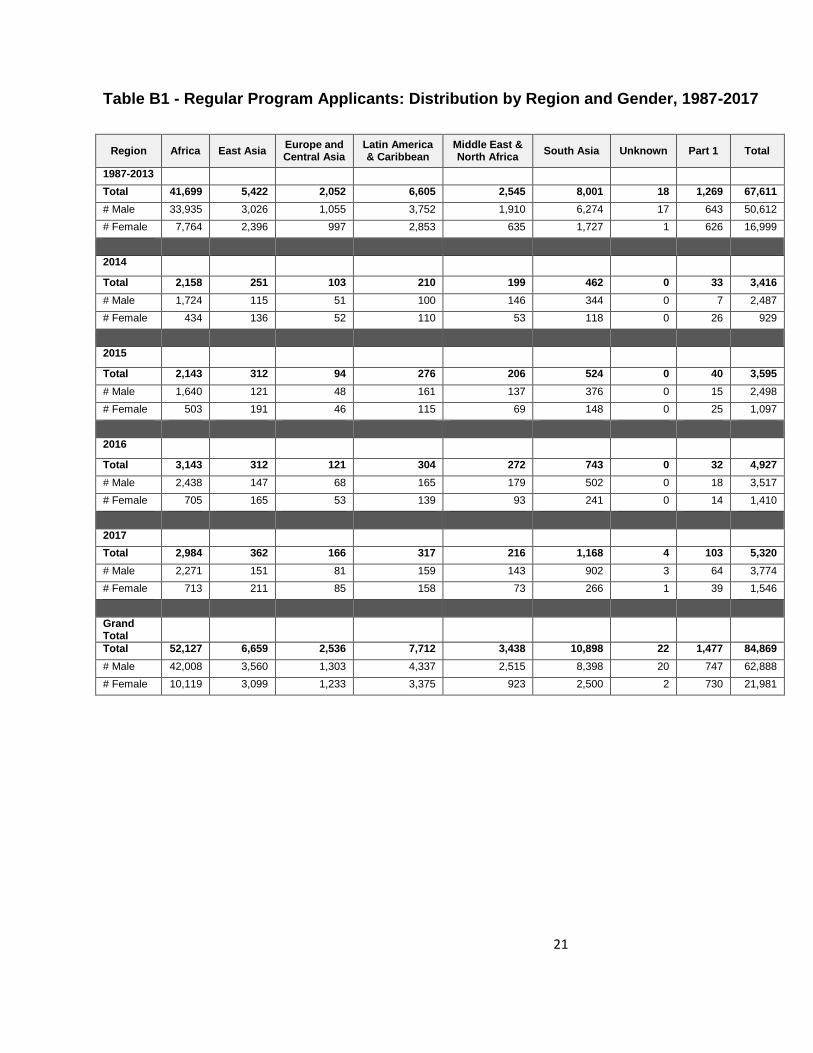
Table B1 - Regular Program Applicants: Distribution by Region and Gender, 1987-2017
Region Africa East Asia Europe and Central Asia
Latin America & Caribbean
Middle East & North Africa
South Asia Unknown Part 1 Total
1987-2013
Total 41,699 5,422 2,052 6,605 2,545 8,001 18 1,269 67,611
# Male 33,935 3,026 1,055 3,752 1,910 6,274 17 643 50,612
# Female 7,764 2,396 997 2,853 635 1,727 1 626 16,999
2014
Total 2,158 251 103 210 199 462 0 33 3,416
# Male 1,724 115 51 100 146 344 0 7 2,487
# Female 434 136 52 110 53 118 0 26 929
2015
Total 2,143 312 94 276 206 524 0 40 3,595
# Male 1,640 121 48 161 137 376 0 15 2,498
# Female 503 191 46 115 69 148 0 25 1,097
2016
Total 3,143 312 121 304 272 743 0 32 4,927
# Male 2,438 147 68 165 179 502 0 18 3,517
# Female 705 165 53 139 93 241 0 14 1,410
2017
Total 2,984 362 166 317 216 1,168 4 103 5,320
# Male 2,271 151 81 159 143 902 3 64 3,774
# Female 713 211 85 158 73 266 1 39 1,546
Grand Total
Total 52,127 6,659 2,536 7,712 3,438 10,898 22 1,477 84,869
# Male 42,008 3,560 1,303 4,337 2,515 8,398 20 747 62,888
# Female 10,119 3,099 1,233 3,375 923 2,500 2 730 21,981
22
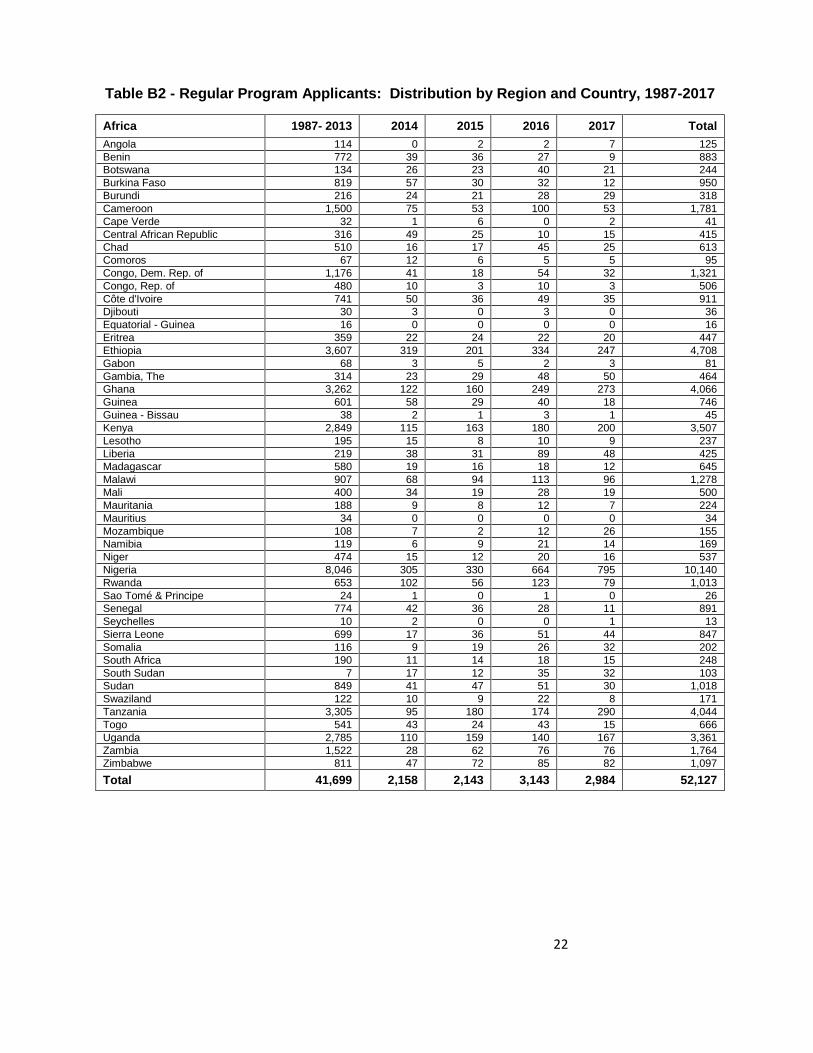
Table B2 - Regular Program Applicants: Distribution by Region and Country, 1987-2017
Africa 1987- 2013 2014 2015 2016 2017 Total
Angola 114 0 2 2 7 125
Benin 772 39 36 27 9 883
Botswana 134 26 23 40 21 244
Burkina Faso 819 57 30 32 12 950
Burundi 216 24 21 28 29 318
Cameroon 1,500 75 53 100 53 1,781
Cape Verde 32 1 6 0 2 41
Central African Republic 316 49 25 10 15 415
Chad 510 16 17 45 25 613
Comoros 67 12 6 5 5 95
Congo, Dem. Rep. of 1,176 41 18 54 32 1,321
Congo, Rep. of 480 10 3 10 3 506
Côte d'Ivoire 741 50 36 49 35 911
Djibouti 30 3 0 3 0 36
Equatorial - Guinea 16 0 0 0 0 16
Eritrea 359 22 24 22 20 447
Ethiopia 3,607 319 201 334 247 4,708
Gabon 68 3 5 2 3 81
Gambia, The 314 23 29 48 50 464
Ghana 3,262 122 160 249 273 4,066
Guinea 601 58 29 40 18 746
Guinea - Bissau 38 2 1 3 1 45
Kenya 2,849 115 163 180 200 3,507
Lesotho 195 15 8 10 9 237
Liberia 219 38 31 89 48 425
Madagascar 580 19 16 18 12 645
Malawi 907 68 94 113 96 1,278
Mali 400 34 19 28 19 500
Mauritania 188 9 8 12 7 224
Mauritius 34 0 0 0 0 34
Mozambique 108 7 2 12 26 155
Namibia 119 6 9 21 14 169
Niger 474 15 12 20 16 537
Nigeria 8,046 305 330 664 795 10,140
Rwanda 653 102 56 123 79 1,013
Sao Tomé & Principe 24 1 0 1 0 26
Senegal 774 42 36 28 11 891
Seychelles 10 2 0 0 1 13
Sierra Leone 699 17 36 51 44 847
Somalia 116 9 19 26 32 202
South Africa 190 11 14 18 15 248
South Sudan 7 17 12 35 32 103
Sudan 849 41 47 51 30 1,018
Swaziland 122 10 9 22 8 171
Tanzania 3,305 95 180 174 290 4,044
Togo 541 43 24 43 15 666
Uganda 2,785 110 159 140 167 3,361
Zambia 1,522 28 62 76 76 1,764
Zimbabwe 811 47 72 85 82 1,097
Total 41,699 2,158 2,143 3,143 2,984 52,127

23
Table B3 - Regular Program Applicants: Distribution by Region and Country, 1987-2017
East Asia 1987- 2013 2014 2015 2016 2017 Total Cambodia 190 13 16 17 18 254
China 1457 19 28 8 5 1,517
Fiji 36 4 4 5 12 61
Indonesia 947 48 61 71 77 1,204
Kiribati 6 1 0 0 1 8
Korea 86 0 3 2 0 91
Lao PDR 67 7 6 6 3 89
Malaysia 152 10 11 9 12 194
Mongolia 187 11 23 28 43 292
Myanmar 679 50 57 38 78 902
Papua New Guinea 74 12 7 10 6 109
Philippines 866 40 46 72 74 1,098
Samoa 13 1 1 2 0 17
Singapore 1 0 0 0 0 1
Solomon Islands 3 0 0 0 1 4
Thailand 234 10 10 11 7 272
Timor - Leste 10 0 0 1 7 18
Tonga 13 0 0 0 0 13
Tuvalu 0 0 0 2 0 2
Vanuatu 5 1 0 3 0 9
Vietnam 396 24 39 27 18 504
Total 5,422 251 312 312 362 6,659

24
Table B4 - Regular Program Applicants: Distribution by Region and Country, 1987-2017
Europe and Central Asia 1987- 2013 2014 2015 2016 2017 Total
Albania 118 2 8 5 6 139
Armenia 89 3 6 5 6 109
Azerbaijan 52 7 5 12 16 92
Belarus 61 1 0 1 1 64
Bosnia 26 1 0 1 1 29
Bulgaria 141 2 1 1 0 145
Croatia 26 0 1 2 1 30
Czech Republic 19 0 0 0 0 19
Estonia 19 0 0 0 0 19
Georgia 136 10 6 3 16 171
Hungary 71 0 0 0 0 71
Kazakhstan 76 9 7 12 23 127
Kosovo 4 2 3 10 8 27
Kyrgyz Rep. 112 8 11 9 20 160
Latvia 15 0 0 0 0 15
Lithuania 23 0 0 0 0 23
Macedonia FYR 19 1 0 2 3 25
Moldova 49 1 1 1 4 56
Montenegro 1 1 0 0 1 3
Poland 55 0 0 0 0 55
Portugal 11 0 0 0 0 11
Romania 153 3 0 0 0 156
Russian Federation 130 6 5 6 3 150
Serbia 85 1 3 0 1 90
Slovak Republic 25 0 0 0 0 25
Slovenia 11 0 0 0 0 11
Tajikistan 54 9 4 12 12 91
Turkey 262 14 14 19 20 329
Turkmenistan 11 1 0 4 2 18
Ukraine 88 3 7 4 4 106
Uzbekistan 110 18 12 12 18 170
Total 2,052 103 94 121 166 2,536

25
Table B5 - Regular Program Applicants: Distribution by Region and Country, 1987-2017
Latin America & Caribbean 1987 - 2013 2014 2015 2016 2017 Total Antigua 13 0 0 1 0 14
Argentina 421 5 12 7 14 459
Bahamas The 15 0 0 0 0 15
Barbados 35 0 0 0 0 35
Belize 12 1 3 3 1 20
Bolivia 306 9 11 1 9 336
Brazil 438 10 29 31 27 535
Chile 320 6 5 13 14 358
Colombia 856 35 42 67 60 1060
Costa Rica 135 4 0 4 5 148
Cuba 2 0 0 0 0 2
Dominica 24 0 1 0 1 26
Dominican Republic 51 0 0 2 1 54
Ecuador 270 4 7 13 18 312
El Salvador 72 1 3 4 0 80
Grenada 26 1 0 0 1 28
Guatemala 77 3 7 3 2 92
Guyana 93 3 5 11 5 117
Haiti 419 46 48 54 40 607
Honduras 95 6 3 3 3 110
Jamaica 146 17 14 9 12 198
Mexico 1179 14 32 26 31 1282
Nicaragua 133 3 6 7 4 153
Panama 28 0 2 0 0 30
Paraguay 54 5 5 1 1 66
Peru 831 24 25 30 33 943
St. Kitts 10 0 1 0 1 12
St. Lucia and Nevis 46 2 1 2 3 54
St. Vincent 24 6 2 3 3 38
Suriname 16 0 1 1 0 18
Trinidad & Tobago 79 2 2 2 2 87
Uruguay 209 0 2 1 3 215
Venezuela R. B. de 168 1 7 5 23 204
West Indies 2 2 0 0 0 4
Total 6,605 210 276 304 317 7,712

26
Table B6 - Regular Program Applicants: Distribution by Region and Country, 1987-2017
Middle East & North Africa 1987 - 2013 2014 2015 2016 2017 Total
Algeria 405 28 21 23 10 487
Bahrain 4 0 0 0 0 4
Djibouti 0 0 0 0 2 2
Egypt Arab Rep. of 768 45 49 85 92 1,039
Iran Islamic Rep. of 220 15 27 33 31 326
Iraq 53 3 24 12 7 99
Israel 1 0 0 0 0 1
Jordan 212 15 16 26 14 283
Kuwait 7 0 0 0 0 7
Lebanon 42 5 6 2 3 58
Libya 10 1 2 1 5 19
Malta 2 0 0 0 0 2
Morocco 256 5 3 6 6 276
Oman 32 0 0 0 0 32
Qatar 1 0 0 0 0 1
Saudi Arabia 12 0 0 0 0 12
Syrian Arab Rep. 65 18 19 15 9 126
Tunisia 155 17 7 13 7 199
West Bank and Gaza 134 30 9 0 0 173
Yemen Republic of 166 17 23 56 30 292
Total 2,545 199 206 272 216 3,438
Table B7 - Regular Program Applicants: Distribution by Region and Country, 1987-2017
South Asia 1987 - 2013 2014 2015 2016 2017 Total Afghanistan 115 33 33 62 497 740
Bangladesh 1411 98 136 128 118 1,891
Bhutan 199 39 44 93 114 489
India 2165 68 87 129 129 2,578
Maldives 47 2 1 0 4 54
Nepal 1536 48 37 77 88 1,786
Pakistan 2030 156 157 214 186 2,743
Sri Lanka 498 18 29 40 32 617
Total 8,001 462 524 743 1,168 10,898
27
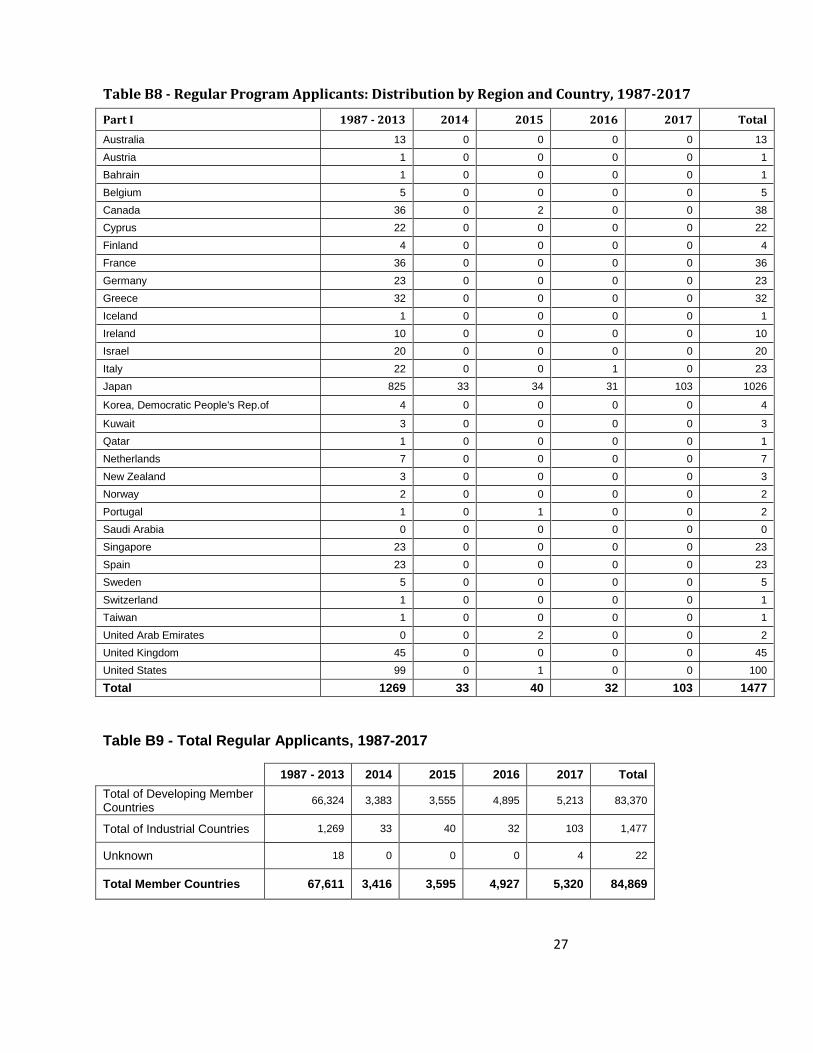
Table B8 - Regular Program Applicants: Distribution by Region and Country, 1987-2017
Part I 1987 - 2013 2014 2015 2016 2017 Total
Australia 13 0 0 0 0 13
Austria 1 0 0 0 0 1
Bahrain 1 0 0 0 0 1
Belgium 5 0 0 0 0 5
Canada 36 0 2 0 0 38
Cyprus 22 0 0 0 0 22
Finland 4 0 0 0 0 4
France 36 0 0 0 0 36
Germany 23 0 0 0 0 23
Greece 32 0 0 0 0 32
Iceland 1 0 0 0 0 1
Ireland 10 0 0 0 0 10
Israel 20 0 0 0 0 20
Italy 22 0 0 1 0 23
Japan 825 33 34 31 103 1026
Korea, Democratic People's Rep.of 4 0 0 0 0 4
Kuwait 3 0 0 0 0 3
Qatar 1 0 0 0 0 1
Netherlands 7 0 0 0 0 7
New Zealand 3 0 0 0 0 3
Norway 2 0 0 0 0 2
Portugal 1 0 1 0 0 2
Saudi Arabia 0 0 0 0 0 0
Singapore 23 0 0 0 0 23
Spain 23 0 0 0 0 23
Sweden 5 0 0 0 0 5
Switzerland 1 0 0 0 0 1
Taiwan 1 0 0 0 0 1
United Arab Emirates 0 0 2 0 0 2
United Kingdom 45 0 0 0 0 45
United States 99 0 1 0 0 100
Total 1269 33 40 32 103 1477
Table B9 - Total Regular Applicants, 1987-2017
1987 - 2013 2014 2015 2016 2017 Total
Total of Developing Member Countries
66,324 3,383 3,555 4,895 5,213 83,370
Total of Industrial Countries 1,269 33 40 32 103 1,477
Unknown 18 0 0 0 4 22
Total Member Countries 67,611 3,416 3,595 4,927 5,320 84,869

28
Table C: Preferred Programs
University Program Country Region
AgroParisTech-ENGREF
Mastère Spécialisé, Action publique pour le développement durable des territoires et de l’agriculture
France Europe
Mastère Spécialisé, Forêt, nature et société
Mastère Spécialisé, Gestion de l’eau
Mastère Spécialisé, Politiques publiques et stratégies pour l’environnement
Mastère Spécialisé, Systèmes d’informations localisées pour l’aménagement des territoires
Mastère Spécialisé, Management des risques sanitaires alimentaires et environnementaux
Mastère Spécialisé, Ingénierie de Produits à l’interface Cuisine-Industrie
Mastère Spécialisé, Management de l’innovation dans les agro-activités et les bio-industries
Asian Institute of Technology
Master's in Agricultural Systems and Engineering
Thailand East Asia
Master's in Aquaculture and Aquatic Resources Management
Master's in Environmental Engineering and Management
Master's in Food Engineering and Bioprocess Technology
Master's in Gender and Development Studies
Master's in Natural Resources Management
Master's in Regional and Rural Development Planning
Master's in Urban Environmental Management
Master's in Water Engineering and Management
Australian National University
Master of Economics
Australia Oceania Master of Environmental Management and Development
Master of International and Development Economics
Master of Environmental and Resource Economics
Brandeis University MS in International Health Policy and Management
United States North America MA in Sustainable International Development

29
Table C: Preferred Programs
University Program Country Region
CATIE, Centro Agronómico Tropical de
Investigación y Enseñanza
Maestría Académica Internacional en Agroforestería y Agricultura Sostenible
Costa Rica Latin America and Caribbean
Maestría Académica Internacional en Manejo y Conservación de Bosques Tropicales y Biodiversidad
Maestría Académica Internacional en Economía, Desarrollo y Cambio Climático
Maestría Profesional en Práctica del Desarrollo
CERDI, Centre d’Etudes et de
Recherches sur le développement
International
Programme de formation en Gestion de la politique economique France Europe
Columbia University
Master of Arts Program in Economics
United States North America
Master of Arts in Economics and Education
Master of Arts in Higher and Post-secondary Education
The Preservice Program in Elementary Inclusive Education
Master of Public Administration
Master of Science in Social Work
Cornell University
Master of Professional Studies in Agriculture and Life Sciences
United States North America Master of Professional Studies in International Development
Master of Public Administration
Master of City and Regional Planning
Duke University
Master of Environmental Management - Residential
United States North America Master of International Development Policy (one year degree)
Master of International Development Policy two year degree)
Master of Public Policy
Harvard University
Master in Public Administration
United States North America Master in Public Policy
Master in Urban Planning

30
Table C: Preferred Programs
University Program Country Region
Master of Public Health Program
Master of International Education Policy
Hiroshima University, Graduate School of
International Development and
Cooperation
Master's Program of the Division of Development Science
Japan East Asia Master's Program of the Division of Educational Development and Cultural and Regional Studies
IHS-Institute for Housing and Urban
Development Studies
MSc in Urban Management & Development Netherlands Europe
Institute of Social Studies
Master of Arts in Development Studies, Major in Agrarian, Food, and Environmental Studies
Netherlands
Europe
Master of Arts in Development Studies, Major in Economics of Development
Master of Arts in Development Studies, Major in Governance, Policy, and Political Economy
Master of Arts in Development Studies, Major in Human
Rights, Gender, and Conflict Studies: Social Justice Perspectives
Master of Arts in Development Studies, Major in Social Policy for Development
ITC-University of Twenty, Faculty of Geo-Information Science and
Earth Observation
MSc in Geo-information Science and Earth Observation for Applied Earth Sciences, with specialization in Earth Resources Exploration
Netherlands Europe
MSc in Geo-information Science and Earth Observation for Applied Earth Sciences, with specialization in Engineering Geology
MSc in Geo-information Science and Earth Observation for Applied Earth Sciences, with specialization in Natural Hazards and Disaster Risk Management
MSc in Geo-Information Science and Earth Observation for Geoinformatics
MSc in Geo-Information Science and Earth Observation for Natural Resources Management
MSc in Geo-Information Science and Earth Observation for Urban Planning and Management
MSc in Geo-Information Science and Earth Observation for Water Resources and Environmental Management
International University of Japan
MA in International Development Japan East Asia
MA in Economics

31
Table C: Preferred Programs
University Program Country Region
MA in Public Management and Policy Analysis
MA in International Relations
MA in International Peace Studies
Johns Hopkins University
SAIS Master of Arts
United States North America
Master of Science (ScM) in Epidemiology
Master of Public Health in Epidemiology
Master of Science in Public Health in Health Policy
Master of Health Science
Master of International Public Policy
Keio University Certificate of “Environmental Innovators Course” under “Media and Governance Master’s Program”
Japan East Asia
Kobe University Master of International Cooperation Studies Japan East Asia
Meiji University
Public Policy Program (MA)
Japan East Asia International Development Policy Program (MA)
Community Planning and Management Program (MA)
Montpellier SupAgro, Centre international
d’études superieures en sciences agronomiques
Master Agronomie et Agroalimentaire (1 yr)
France Europe Master Agronomie et Agroalimentaire (2yr)
Ingénieur Systèmes Agricoles et Agroalimentaires Durables au Sud
Mastère Spécialisé Innovations et Politiques pour une Alimentation Durable
Nagasaki University Master of Tropical Medicine Course Japan East Asia
Pontificia Universidad Católica de Chile
Magister en Economia Chile Latin America and Caribbean
Institute of Tropical Medicine
Master (MSc) in Public Health - International Health
Belgium Europe Master (MSc) en Santé Publique - Politiques et Management des Systèmes de Santé
Master (MSc) en Santé Publique - Contrôle des Maladies
Ritsumeikan University Master’s Program in International Relations
Japan East Asia Master’s Program on Regional Policy and Planning

32
Table C: Preferred Programs
University Program Country Region
International Program for Science and Engineering
International Program for Information Science and Engineering
International Program for Life Sciences
Ritsumeikan Asia Pacific University
Master of Science in Asia Pacific Studies - International Relations
Japan East Asia
Master of Science in Asia Pacific Studies - Society and Culture
Master of Science in International Cooperation Policy - Development Economics
Master of Science in International Cooperation Policy - International Public Administration
Master of Science in International Cooperation Policy - Public Health Management
Master of Science in International Cooperation Policy - Sustainability Sciences
Master of Science in International Cooperation Policy - Tourism and Hospitality
Saitama University International Graduate Program on Civil and Environmental Engineering Japan East Asia
Sciences Po
Master in Development Practice
France Europe
Master in Environmental Policy
Master in Human Rights and Humanitarian Action
Master in International Development
Master in International Economic Policy
Master in International Energy
International Public Management
Joint Master in Journalism and International Affairs
Tohoku University Global Program in Economics and Management Japan East Asia
UNESCO-IHE
MSc in Environmental Planning and Management
Netherlands Europe
MSc in Environmental Science and Technology
MSc in Hydraulic Engineering and River Basin Development
MSc in Hydraulic Engineering - Land and Water Development
MSc in Coastal Engineering and Port Development

33
Table C: Preferred Programs
University Program Country Region
MSc in Hydroinformatics, Modelling, and Information Systems for Water Management
MSc in Hydrology and Water Resources
MSc in Limnology and Wetland Ecosystems (joint program with Egerton University, Kenya and BOKU, Austria)
MSc in Sanitary Engineering
MSc in Urban Water Engineering and Management (joint program with AIT Thailand)
MSc in Water Quality Management
MSc in Water Resources Management
MSc in Water Services Management
MSc in Water Supply Engineering
MSc in Water Conflict Management
MSc in Water Management
MSc in Environmental Technology for Sustainable Development (joint program with AIT Thailand)
MSc in Agricultural Water Management for Enhanced Land and Water Productivity (joint program with AIT Thailand)
Universidad de Chile Magister en Economia
Chile Latin America and Caribbean Magister en Políticas Públicas
Universidad Torcuato di Tella
Maestría en Administración de la Educación
Argentina Latin America and Caribbean
Maestría en Economía
Maestría en Economía Urbana
Maestría en Políticas Educativas
Maestría en Políticas Públicas
Université de Montreal Maîtrise en Santé communautaire
Canada North America Maîtrise en Sciences économiques
Université Laval Maîtrise en Aménagement du Territoire et Développement Régional
Canada North America Maîtrise en Aménagement du Territoire et Développement Régional - avec mémoire

34
Table C: Preferred Programs
University Program Country Region
Maîtrise en Agroéconomie
Maîtrise en Economique
Maîtrise en Economique - avec mémoire
Maîtrise en Administration et évaluation en éducation
Maîtrise en Administration et évaluation en éducation - avec mémoire
Maîtrise en Epidémiologie - avec mémoire (MSc)
Maîtrise en Sociologie
Maîtrise en Sociologie - avec mémoire
University of Bradford
MSc in Development and Project Planning
United Kingdom Europe
MSc in Economics and Finance for Development
MA in International Development Management
MSc in Project Planning and Management
Masters in Public Administration
University of Chicago Master of Public Policy United States North America
University of East Anglia
MSc, Development Economics
United Kingdom Europe
MSc, Economics
MSc, Environment and International Development
MA, Gender Analysis and International Development
MA, International Social Development
MA, Agriculture and Rural Development
University of Leeds
MSc, Economics
United Kingdom Europe
MSc, Economics and Finance
MSc (Eng), Environmental Engineering and Project Management
MSc, Food Science
MA, Gender Studies

35
Table C: Preferred Programs
University Program Country Region
MSc, Geographical Information Systems
MA, Health Management, Planning and Policy
MA, Hospital Management
MSc (Eng), International Construction Management and Engineering
Master of Public Health (International)
University of London, IOE, Institute of
Education
Economics of Education, MA
United Kingdom Europe
Education and International Development, MA
Educational Planning, Economics, and International Development, MA
Education, Gender, and International Development, MA
Education, Health Promotion, and International Development
University of London, London School of
Economics and Political Science
MSc, Management of Information Systems and Digital Innovation
United Kingdom Europe
MSc, Development Management
MSc, Development Studies
MPA, Public Administration
MSc, Economic History
MSc, Economics
MSc, Economics (two-year program)
MSc, Finance
MSc, Finance and Economics
MSc, Gender, Policy, and Inequalities
MSc, Gender, Development, and Globalisation
MSc, Human Resource Management
MSc, Local Economic Development
MSc, Management, Organization, and Governance

36
Table C: Preferred Programs
University Program Country Region
MPA, Public Policy and Administration
MSc, Social Policy and Development
MSc, Social Policy and Planning
University of London, London School of
Hygiene and Tropical Medicine
Master’s, Medical Entomology for Disease Control (formerly Biology and Control of Disease Vectors), MSc
United Kingdom Europe
Master’s, Epidemiology, MSc
Master’s, Health Policy, Planning, and Finance, MSc
Master’s, Public Health (Health Promotion Stream)
Master’s, Immunology of Infectious Diseases, MSc
Master’s, Medical Microbiology, MSc
Master’s, Medical Statistics, MSc
Master’s, Public Health, MSc
Master’s, Public Health in Developing Countries, MSc
Master’s, Reproductive and Sexual Health Research, MSc
University of London, School of Oriental and
African Studies
MSc, Development Economics
United Kingdom Europe
MSc, Finance and Development
MSc, Globalization and Development
MA in Human Rights Law
MSc, Political Economy of Development
University of London, University College
London
Environment and Sustainable Development, MSc
United Kingdom Europe
Environmental Systems Engineering, MSc
MA in Gender Society and Representation
MSc in Pediatrics and Child Health: Global Child Health
MSc in International Public Policy
Urban Development Planning, MSc

37
Table C: Preferred Programs
University Program Country Region
University of Manchester
Development Finance, MSc
United Kingdom Europe
Econometrics, MSc
Economics, MSc
MA, TESOL (Educational Technology)
Globalization and Development, MSc
Human Resource Management and Industrial Relations, MSc
International Development, Development Management, MA
Management and Implementation of Development Projects, MSc
Management and Information Systems, Change, and Development, MSc
University of Reading
MSc, Agricultural Development Economics
United Kingdom Europe
MSc, Agricultural Economics
MSc, Agriculture and Development
MSc, Applied International Development
MSc, Climate Change and Development
MSc, Communication for Innovation and Development
MSc, Development Finance
MSc, Food Security and Development
MSc, Environment and Development
MSc, Food Economics and Marketing
MSc, Research Agricultural and Food Economics
University of Sussex
MSc, in Development Economics
United Kingdom Europe MA in Development Studies
MSc in Economics
MA in Environment, Development, and Policy

38
Table C: Preferred Programs
University Program Country Region
MA in Gender and Development
MSc in International Economics
MA in International Education and Development
MSc in Science and Technology Policy Studies
MA in Anthropology of Development and Social Transformation
Waseda University
MA Program in International Relations, Area Studies
Japan East Asia MA Program in International Relations, International Relations
MA Program in International Relations, International Development and Policy Studies
MA Program in International Relations, Regional Integration in Asia-Pacific
Williams College, Center for Development
Economics
MA in Policy Economics United States North America