fy2017-18 / fy2018-19 biennial budget - nebraska … / fy2018-19 biennial budget nebraska unicameral...
TRANSCRIPT

FY2017-18 / FY2018-19
Biennial Budget
Nebraska Unicameral Legislature
One Hundred Fifth Legislature, First Session
February 2017
Members of the Appropriations Committee
Sen John Stinner (C) Sen Mike McDonnell Sen Kate Bolz (VC) Sen Tony Vargas Sen Robert Clements Sen Dan Watermeier Sen Robert Hilkemann Sen Anna Wishart Sen John Kuehn
i
Table of Contents
A. Summary ........................................................................................................................... 1
B. General Fund Financial Status .................................................................................... 4
1. Financial Status per Committee Preliminary Budget ........................................................ 4 2. Chronology of the General Fund Financial Status ........................................................... 5
C. Cash Reserve Fund Status ........................................................................................... 8
1. Excess of Certified Forecasts ........................................................................................... 9 2. Transfers To / From General Fund .................................................................................. 9 3. Transfers To/From Other Funds ....................................................................................... 9 4. Historical Variance, Projected vs. Actual Receipts .......................................................... 10 5. Cash Reserve Fund - Historical Balances, Revenues, Transfers .................................... 11
D. General Fund Revenues ............................................................................................... 12
1. Revenue Forecasts .......................................................................................................... 12 2. General Fund Transfers-Out ............................................................................................ 14 3. General Fund Transfers-In ............................................................................................... 15
E. General Fund Appropriations ....................................................................................... 17
1. Summary/State Totals-Committee Preliminary Budget .................................................... 17 2. Overview of Significant Increases and Reductions by Major Area .................................. 18 3. List of Significant Increases and Reductions ................................................................... 21 4. Committee Preliminary General Fund Budget by Agency ................................................ 22 5. Committee Preliminary General Fund Budget by State Aid Program .............................. 25 6. Detailed Listing of General Fund Budget Issues .............................................................. 27
F. Comparison to Governors Recommendation ......................................................... 32
1. Financial Status ................................................................................................................ 32 2. General Fund Appropriations – FY18 and FY19 .............................................................. 33 3. General Fund Transfers-In ............................................................................................... 34 4. General Fund Transfers-Out ............................................................................................ 34 5. Cash Reserve Fund transfers .......................................................................................... 34 6. General Fund FY2016-17 Deficit Appropriations ............................................................. 35
G. Statutory Changes Required ........................................................................................ 36
1. New Bill Introduction, Rule 5 ............................................................................................ 36 2. Appropriations Committee Preliminary Budget: Other Bills.............................................. 36 3. Governor Recommendation, Other Bills ........................................................................... 36 4. Mainline Appropriations Bills ............................................................................................ 36
Page 1
SUMMARY
This preliminary budget is the first of several stages in the budget process. It provides a starting point for discussion of the various budget actions suggested at this point in time. Subsequent to the hearings, the Appropriations Committee will formulate its' formal recommendation to the Legislature at which time floor debate and amendment will take place, followed by Governor vetoes and legislative overrides if any.
GENERAL FUND FINANCIAL STATUS
At Sine Die of the 2016 session, the projected financial status for the FY18/FY19 biennium reflected a $234.5 million projected shortfall from the minimum reserve. At that point, FY18/FY19 was the “out year” in the five year financial status and there was no projection for FY20/FY21 biennium. Items which significantly contributed to this shortfall were the use of $99 million of one-time lapsed appropriations to balance the FY16/FY17 biennium and annualization 2016 session bills which cost $5.4 million in FY16-17 but $54.2 million in FY17-18 and $64.4 million in FY18-19. At the July 2016 meeting of the Tax Rate Review Committee (TRR), the General Fund financial status declined to $352.7 million below the minimum reserve when FY2015-16 actual receipts were $120 million below forecast. The financial status deteriorated significantly in November 2016 when the TRR committee again met. The shortfall from the minimum reserve increased from $352.7 million to $895.3 million due mostly to revenue forecasts. Original NEFAB forecasts for FY18 and FY19 were a combined $402.8 million below the previously used preliminary LFO revenue estimates. The NEFAB also reduced their FY16-17 forecast by $172.2 million largely reflecting the $120 million below forecast revenue the prior year. There was some offset with overall lower spending projections totaling $15.4 million over the three year period. The Appropriations Committee Preliminary Budget as set forth here, reduces that $895 million “shortfall” to a $134.7 million level. Although not achieving a balanced budget at this point, the remaining shortfall is at a level that Cash Reserve Fund transfers which have not been incorporated at this point could be utilized to achieve a balanced budget. Going forward, the combination of these actions results in a $54 million structural balance in FY18-19 when comparing on-going revenues and obligations. This $771 million swing was accomplished through a combination of $160 million of reductions in FY16-17 new and carryover appropriations (LB 22), $70.8 million from sales tax due to voluntary collection compliance by Amazon.com, and $124 million of transfers from several cash funds. On the appropriations side, the committee preliminary budget level was substantially below that estimated at the November Tax Rate Review Committee meeting including lower TEEOSA school aid ($98.1 million), University of Nebraska and State Colleges ($98.7), and DHHS provider rates ($106.5 million) Note that even though the FY18/FY19 biennial budget is not “balanced” at this point, there is a $54 million structural balance when comparing on-going revenues and on-going appropriations at the end of FY18-19.
GENERAL FUND REVENUE GROWTH
Revenue estimates for FY2016-17, FY2017-18 and FY2018-19 are the October 2016 forecasts from the Nebraska Economic Forecast Advisory Board (NEFAB). Rate and base adjusted revenue growth implied by the forecasts for the FY18/FY19 biennium average 4.3% (4.0% in FY17-18 and 4.6% in FY18-19). When including the 3.4% growth in the FY16-17 forecast, there is an average growth of 4.0% over the three years that affect the financial status for the upcoming biennium. This reflects growth below the 4.9% historical 35 year average. The Nebraska Economic Forecast Advisory Board (NEFAB) is scheduled to meet February 27, 2017 and again in late April 2017 to review their existing forecasts. Changes in those forecasts could have a significant impact on the projected status as shown in this report. For the “following biennium”, revenue growth is calculated at 6.0% per year using the historical average methodology. The target growth is the historical average of 4.9% but adjusted down to 4.75% to exclude growth
Page 2
that is now negated by indexing of the income tax brackets. Because the revenue growth in the NEFAB forecasts is below average, the revenue growth needed to yield a 4.7% five year average is 6.0% in both FY19-20 and FY20-21. At this point, these calculated amounts very close to the unofficial estimates prepared by the Nebraska Dept. of Revenue (NDR) and Legislative Fiscal Office (LFO) using IHS Economics and Moody’s forecasting information for FY2019-20 but higher than the FY2020-21 calculations.
GENERAL FUND SPENDING GROWTH
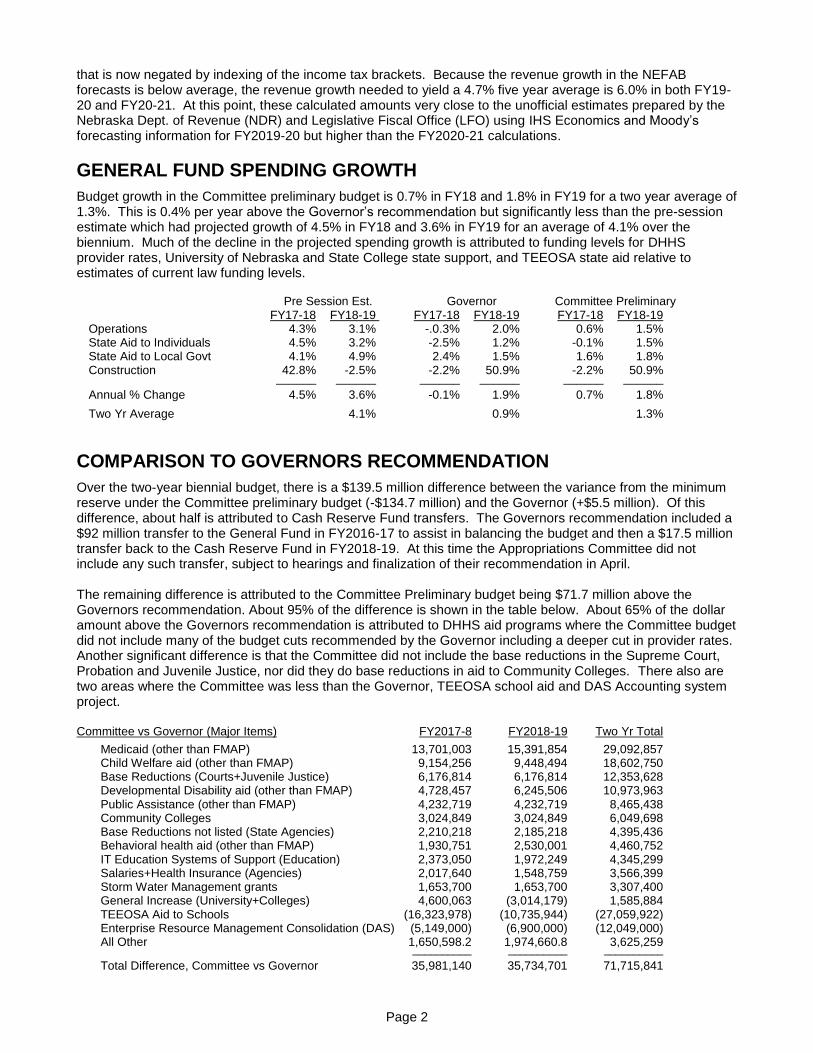
Budget growth in the Committee preliminary budget is 0.7% in FY18 and 1.8% in FY19 for a two year average of 1.3%. This is 0.4% per year above the Governor’s recommendation but significantly less than the pre-session estimate which had projected growth of 4.5% in FY18 and 3.6% in FY19 for an average of 4.1% over the biennium. Much of the decline in the projected spending growth is attributed to funding levels for DHHS provider rates, University of Nebraska and State College state support, and TEEOSA state aid relative to estimates of current law funding levels. Pre Session Est. Governor Committee Preliminary FY17-18 FY18-19 FY17-18 FY18-19 FY17-18 FY18-19 Operations 4.3% 3.1% -.0.3% 2.0% 0.6% 1.5% State Aid to Individuals 4.5% 3.2% -2.5% 1.2% -0.1% 1.5% State Aid to Local Govt 4.1% 4.9% 2.4% 1.5% 1.6% 1.8% Construction 42.8% -2.5% -2.2% 50.9% -2.2% 50.9% ______ ______ ______ ______ ______ ______
Annual % Change 4.5% 3.6% -0.1% 1.9% 0.7% 1.8%
Two Yr Average 4.1% 0.9% 1.3%
COMPARISON TO GOVERNORS RECOMMENDATION
Over the two-year biennial budget, there is a $139.5 million difference between the variance from the minimum reserve under the Committee preliminary budget (-$134.7 million) and the Governor (+$5.5 million). Of this difference, about half is attributed to Cash Reserve Fund transfers. The Governors recommendation included a $92 million transfer to the General Fund in FY2016-17 to assist in balancing the budget and then a $17.5 million transfer back to the Cash Reserve Fund in FY2018-19. At this time the Appropriations Committee did not include any such transfer, subject to hearings and finalization of their recommendation in April. The remaining difference is attributed to the Committee Preliminary budget being $71.7 million above the Governors recommendation. About 95% of the difference is shown in the table below. About 65% of the dollar amount above the Governors recommendation is attributed to DHHS aid programs where the Committee budget did not include many of the budget cuts recommended by the Governor including a deeper cut in provider rates. Another significant difference is that the Committee did not include the base reductions in the Supreme Court, Probation and Juvenile Justice, nor did they do base reductions in aid to Community Colleges. There also are two areas where the Committee was less than the Governor, TEEOSA school aid and DAS Accounting system project. Committee vs Governor (Major Items) FY2017-8 FY2018-19 Two Yr Total
Medicaid (other than FMAP) 13,701,003 15,391,854 29,092,857 Child Welfare aid (other than FMAP) 9,154,256 9,448,494 18,602,750 Base Reductions (Courts+Juvenile Justice) 6,176,814 6,176,814 12,353,628 Developmental Disability aid (other than FMAP) 4,728,457 6,245,506 10,973,963 Public Assistance (other than FMAP) 4,232,719 4,232,719 8,465,438 Community Colleges 3,024,849 3,024,849 6,049,698 Base Reductions not listed (State Agencies) 2,210,218 2,185,218 4,395,436 Behavioral health aid (other than FMAP) 1,930,751 2,530,001 4,460,752 IT Education Systems of Support (Education) 2,373,050 1,972,249 4,345,299 Salaries+Health Insurance (Agencies) 2,017,640 1,548,759 3,566,399 Storm Water Management grants 1,653,700 1,653,700 3,307,400 General Increase (University+Colleges) 4,600,063 (3,014,179) 1,585,884 TEEOSA Aid to Schools (16,323,978) (10,735,944) (27,059,922) Enterprise Resource Management Consolidation (DAS) (5,149,000) (6,900,000) (12,049,000) All Other 1,650,598.2 1,974,660.8 3,625,259 __________ __________ __________
Total Difference, Committee vs Governor 35,981,140 35,734,701 71,715,841
Page 3
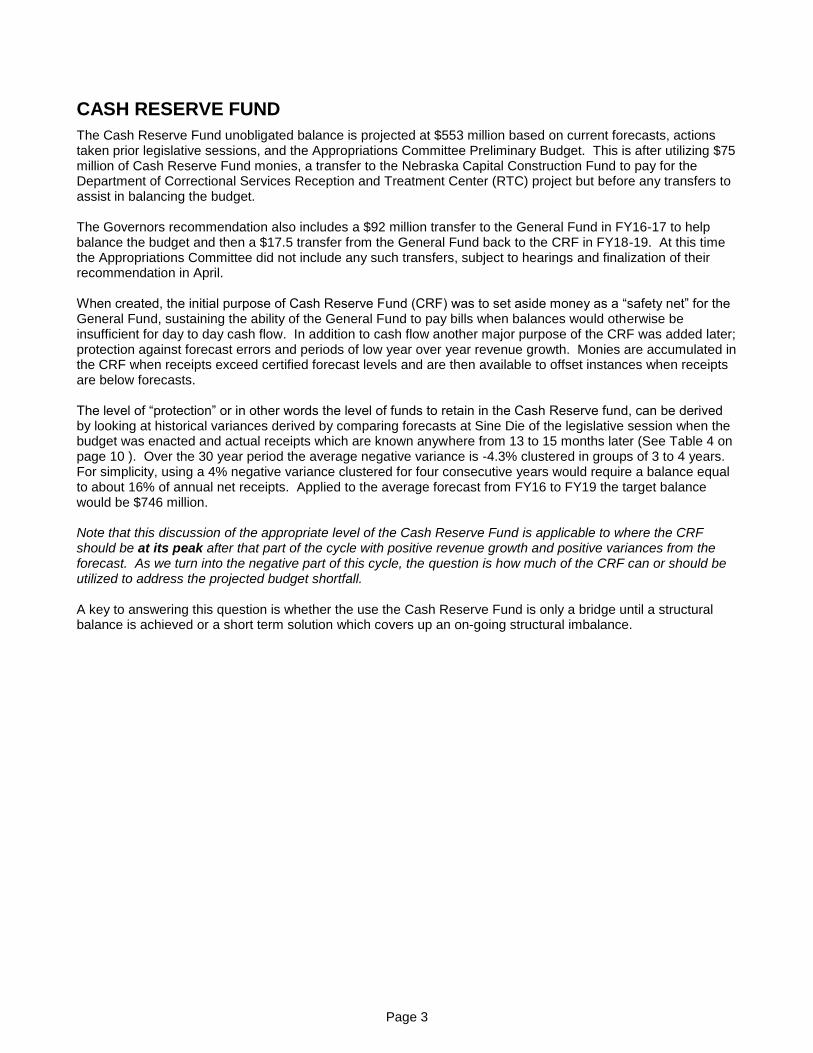
CASH RESERVE FUND
The Cash Reserve Fund unobligated balance is projected at $553 million based on current forecasts, actions taken prior legislative sessions, and the Appropriations Committee Preliminary Budget. This is after utilizing $75 million of Cash Reserve Fund monies, a transfer to the Nebraska Capital Construction Fund to pay for the Department of Correctional Services Reception and Treatment Center (RTC) project but before any transfers to assist in balancing the budget. The Governors recommendation also includes a $92 million transfer to the General Fund in FY16-17 to help balance the budget and then a $17.5 transfer from the General Fund back to the CRF in FY18-19. At this time the Appropriations Committee did not include any such transfers, subject to hearings and finalization of their recommendation in April. When created, the initial purpose of Cash Reserve Fund (CRF) was to set aside money as a “safety net” for the General Fund, sustaining the ability of the General Fund to pay bills when balances would otherwise be insufficient for day to day cash flow. In addition to cash flow another major purpose of the CRF was added later; protection against forecast errors and periods of low year over year revenue growth. Monies are accumulated in the CRF when receipts exceed certified forecast levels and are then available to offset instances when receipts are below forecasts. The level of “protection” or in other words the level of funds to retain in the Cash Reserve fund, can be derived by looking at historical variances derived by comparing forecasts at Sine Die of the legislative session when the budget was enacted and actual receipts which are known anywhere from 13 to 15 months later (See Table 4 on page 10 ). Over the 30 year period the average negative variance is -4.3% clustered in groups of 3 to 4 years. For simplicity, using a 4% negative variance clustered for four consecutive years would require a balance equal to about 16% of annual net receipts. Applied to the average forecast from FY16 to FY19 the target balance would be $746 million. Note that this discussion of the appropriate level of the Cash Reserve Fund is applicable to where the CRF should be at its peak after that part of the cycle with positive revenue growth and positive variances from the forecast. As we turn into the negative part of this cycle, the question is how much of the CRF can or should be utilized to address the projected budget shortfall. A key to answering this question is whether the use the Cash Reserve Fund is only a bridge until a structural balance is achieved or a short term solution which covers up an on-going structural imbalance.

Page 4
PROJECTED GENERAL FUND FINANCIAL STATUS Table 1 shown below includes the projected General Fund Financial Status based on the Appropriations Committee Preliminary budget. Furthermore, for planning purposes, an estimated financial status is also constructed for the following biennium allowing the Legislature to see the future implications of budget actions already taken or being considered.
Table 1 – General Fund Financial Status per Committee Preliminary Budget
Current Year Biennial Budget Following Biennium
February 22, 2017 FY2016-17 FY2017-18 FY2018-19 FY2019-20 FY2020-21
1 BEGINNING BALANCE
2 Beginning Cash Balance 531,652,199 135,071,509 81,369,714 130,540,732 164,360,129
3 Cash Reserve transfers-automatic 0 (11,201,000) 0 0 0
4 Carryover obligations from FY16 (310,603,783) 0 0 0 0
5 Lapse FY16 reapproriations (LB 22) 72,170,032 0 0 0 0
6 Allocation for potential deficits 0 (5,000,000) (5,000,000) (5,000,000) (5,000,000)____________________________________________________ _____________
7 Unobligated Beginning Balance 293,218,448 118,870,509 76,369,714 125,540,732 159,360,129
8 REVENUES & TRANSFERS
9 Net Receipts (Oct 2016 NEFAB+hist avg) 4,395,000,000 4,538,000,000 4,730,000,000 5,030,000,000 5,330,000,000
9a Incorporate Amazon.com (from Governor budget) 11,201,000 28,218,000 31,344,000 34,479,000 37,927,000
10 General Fund transfers-out (217,100,000) (234,970,000) (234,970,000) (232,500,000) (232,500,000)
11 General Fund transfers-in (50,000) 73,120,103 51,187,000 0 0
12 Cash Reserve transfers (current law) 0 0 0 0 0
13 Cash Reserve transfers (new) 0 0 0 0 0
14 2017 Revenue Bills 0 0 0 0 0____________________________________________________ _____________
15 General Fund Net Revenues 4,189,051,000 4,404,368,103 4,577,561,000 4,831,979,000 5,135,427,000
16 APPROPRIATIONS
17 Base Appropriations (2016 Session) 4,411,690,837 4,411,690,837 4,411,690,837 4,411,690,837 4,411,690,837
18 2017 Mainline Budget Actions - Preliminary 0 30,178,061 111,699,145 111,699,145 111,699,145
19 Projected budget increase, following biennium -- 0 0 269,769,621 457,245,870
20 2017 Regular deficits (LB 22) 23,554,965 0 0 0 0
21 2017 Deficit reductions (LB 22) (88,442,716) 0 0 0 0
22 2017 State Claims (LB 171) 394,853 0 0 0 0
23 2017 "A" Bills 0 0 0 0 0____________________________________________________ _____________
24 General Fund Appropriations 4,347,197,939 4,441,868,898 4,523,389,982 4,793,159,603 4,980,635,852
25 ENDING BALANCE
26 Dollar ending balance (per Financial Status) 135,071,509 81,369,714 130,540,732 164,360,129 314,151,277
27 Dollar ending balance (at Minimum Reserve) 259,699,600 -- 265,217,464 -- 294,114,953
28 Excess (shortfall) from Minimum Reserve (124,628,091) -- (134,676,732) -- 20,036,324
29 Biennial Reserve (%) 1.5% 1.5% 3.2%
General Fund Appropriations
30 Annual % Change - Appropriations (w/o deficits) 3.3% 0.7% 1.8% 6.0% 3.9%
31 Two Year Average 3.7% -- 1.3% -- 4.9%
General Fund Revenues
32 Est. Revenue Growth (rate/base adjusted) 3.4% 4.0% 4.6% 5.9% 6.0%
33 Two Year Average 1.9% -- 4.3% -- 6.0%
34 Five Year Average 4.3% -- 3.7% -- 4.7%
35 On-Going Revenues vs Appropriations (158,146,939) (37,500,795) 54,171,018 38,819,397 154,791,148

Page 5
Chronology of the Financial Status
At Sine Die 2015, the projected financial status for the FY18/FY19 biennium reflected a $234.5 million projected shortfall from the minimum reserve. At that point, FY18/FY19 was the “out year” in the five year financial status and there was no projection for FY20/FY21 biennium. Items which significantly contributed to this shortfall was the use of $99 million of one-time lapsed appropriations to balance the FY16/FY17 biennium and annualization of the bills enacted in the 2016 session which cost $5.4 million in FY16-17 but $54.2 million in FY17-18 and $64.4 million in FY18-19.
At the July 2016 meeting of the Tax Rate Review Committee (TRR), the General Fund financial status declined to $352.7 million below the minimum reserve. FY2015-16 revenues were $120 million below forecast. This previous forecast was $17 million above the certified forecast so with forecasts well below the certified, the automatic transfer that had been assumed was negated.
July 2016 TRR Committee Impact on Variance from Min Reserve (Millions of Dollars) FY17 FY18 FY19 Total FY16 Actual vs Est General Fund Net Receipts 0.0 0.0 0.0 (120.0) FY16 Actual vs Est CRF transfers-automatic 17.0 0.0 0.0 17.0 FY16 Actual vs Est Accounting adjustment 0.0 0.0 0.0 (6.0) NDR change in withholding, impact of (indexing (12.9) 0.0 0.0 (12.9) Assumed lapse, FY16 unexpended appropriations 0.0 0.0 0.0 0.0 Change in Minimum Reserve 3.5 0.0 (0.0) 3.5 ______ ______ ______ ______
Total Change – July 2016 TRR Committee (118.3) 0 0 (118.3)
The financial status deteriorated significantly in November 2016 when the TRR committee again met. The shortfall from the minimum reserve increased from $352.7 million to $895.3 million due mostly to revenue forecasts. Original NEFAB forecasts for FY18 and FY19 were a combined $402.8 million below the previously used preliminary LFO revenue estimates. The NEFAB also reduced their FY16-17 forecast by $172.2 million largely reflecting the $120 million below forecast revenue the prior year.
There was some offset with overall lower spending projections. Those projected appropriation levels used the latest estimates for TEEOSA school aid and information from the agency budget request.
November 2016 TRR Committee Impact on Variance from Min Reserve (Millions of Dollars) FY17 FY18 FY19 Total
Revenue Forecasts (revised / original Oct 201) (172.2) (200.3) (202.5) (575.1) Change in Minimum Reserve 0.0 0.0 17.1 17.1 _______ _______ _______ _______
Subtotal - Revenue (172.2) (200.3) (185.4) (557.9) Deficit requests higher than $5M allocation (13.4) 0.0 0.0 (13.4) Retirement - defined benefit plans, actuarial contributions 0.0 (16.8) (18.1) (34.8) DHHS – Higher federal FMAP 0.0 14.7 18.5 33.2 DHHS – aid programs, eligibility/utilization/specific items/rates 0.0 (7.9) 15.4 7.5 Revised estimate of budget increases, all other 0.0 8.7 14.2 22.9 _______ _______ _______ _______
Subtotal - Appropriations (13.4) (1.3) 30.1 15.4 Total Change – November TRR Committee (185.6) (201.6) (155.3) (542.5)
The Appropriations Committee Preliminary Budget as set forth here, reduces that $895 million “shortfall” to a $134.7 million level. Although not achieving a balanced budget at this point, the remaining shortfall is at a level that Cash Reserve Fund transfers which have not been incorporated at this point could be utilized to achieve a balanced budget. Going forward, the combination of these actions results in a $54 million structural balance in FY18-19 when comparing on-going revenues and spending. This $771 million swing was accomplished through a combination of $160 million of reductions in FY16-17 new and carryover appropriations (LB 22), $70.8 million from sales tax due to voluntary collection compliance by Amazon.com, and $124 million of transfers from several cash funds. On the appropriations side, the committee preliminary budget level was substantially below that estimated at the November Tax Rate Review Committee

Page 6
meeting including TEEOSA school aid ($98.1 million), University of Nebraska and State Colleges ($98.7), and DHHS provider rates ($106.5 million) Committee Prelim Budget Impact on Variance from Min Reserve (Millions of Dollars) FY17 FY18 FY19 Total
GF Transfers-in (0.1) 73.1 51.2 124.3 GF Transfers-Out (change vs Nov TRR) 0.0 1.8 1.8 3.7 Assumed Amazon.com sales tax 11.2 28.2 31.3 70.8 "Above certified" forecast to CRF (Amazon sales tax) 0.0 (11.2) 0.0 (11.2) Change in Minimum Reserve 0.0 0.0 (10.1) (10.1) ______ ______ ______ ______
Subtotal - Revenue 11.2 92.0 74.3 177.4 LB 22 - Specific & ATB cuts 88.4 0.0 0.0 88.4 LB 22 - Lapse FY16 / FY17 reapproriations 72.2 0.0 0.0 72.2 Deficits and Claims vs Nov TRR (5.6) 0.0 0.0 (5.6)
DHHS provider rates (compared to Nov TRR 2% per yr) 0.0 41.7 64.8 106.5 University+State Colleges (lump sum vs Nov TRR) 0.0 35.7 63.0 98.7 TEEOSA School Aid (2.1% per yr vs Nov 2016 current law estimate 0.0 30.0 68.1 98.1 DHHS aid programs – eligibility, utilization, specific items 0.0 18.6 19.8 38.4 Retirement - Defined Benefit plans (current est vs Nov TRR) 0.0 15.5 13.2 28.7 All Agencies – Modification cuts (operations) 0.0 12.7 12.6 25.3 All Agencies – Salary & Health Insurance (vs Nov 2016 TRR) 0.0 6.7 16.5 23.2 Special Education (1% per yr vs Nov TRR estimate) 0.0 3.3 6.8 10.1 Corrections - Staffing & Security, annualize special salary increase 0.0 (4.7) (9.5) (14.2) All Other appropriation changes (net) (3.8) 9.9 (0.4) 13.4 ______ ______ ______ ______
Subtotal - Appropriations 158.9 169.5 254.8 583.2 Total Change – Appropriations Committee Prelim Budget 170.1 261.5 329.1 760.6

Page 7
Table 2 Chronology of the Financial Status
FY18 / FY19 FY20 / FY21 (millions of dollars) Biennium Biennium
Sine Die 2016 Session (April 20, 2016) (234.5) NA
FY16 Actual vs Est General Fund Net Receipts (120.0) -- FY16 Actual vs Est CRF transfers-automatic 17.0 -- FY16 Actual vs Est Accounting adjustment (6.0) -- NDR change in withholding, impact of (indexing (12.9) -- Change in Minimum Reserve 3.5 --
July 2016 Tax Rate Review Committee (352.7) NA
Revenue Forecasts (revised / original Oct 2016) (575.1) -- Change in Minimum Reserve 17.1 -- Deficit requests vs $5M allocation (13.4) -- Retirement - defined benefit plans (34.8) -- DHHS - FMAP 33.2 -- DHHS aid programs, (eligibility, utilization, specific items, rates) 7.5 -- Revised estimate of budget increases, all other 22.9 --
Nov 2016 Tax Rate Review Committee (895.3) (1,180.4)
General Fund transfers-in (not in pre-session) 124.3 124.3 General Fund transfers-out (change from Nov TRR) 3.7 12.3 Assumed Amazon.com sales tax 70.8 143.2 "Above certified" forecast to CRF (Amazon sales tax) (11.2) (11.2) Change in Minimum Reserve (10.1) (24.9) Reduce carryover obligations from FY17 3.8 3.8 LB 22 - Lapse FY16 / FY17 reapproriations 72.2 72.2 LB 22 - Specific & ATB cuts 88.4 88.4 Deficits and Claims vs Nov TRR (5.6) (5.6) DHHS - Provider Rates, cut vs 2% per yr 106.5 245.0 University+State Colleges (lump sum vs Nov TRR) 98.7 224.7 Education - TEEOSA at 2.1%/yr vs Fall 2016 estimate 98.1 81.8 DHHS aid programs – eligibility, utilization, specific items 38.4 81.3 Retirement - Defined Benefit plans (current est vs Nov TRR) 28.7 55.1 All Agencies - Modifications 25.3 50.5 All Agencies – Salary & Health Insurance (vs Nov 2016 TRR) 23.2 56.1 Education - Special Education vs Nov TRR estimate 10.1 24.2 Corrections - Staffing & Security (14.2) (33.2) All Other Appropriations items 9.5 12.4
Committee Preliminary Budget (134.7) 20.0

Page 8
CASH RESERVE FUND The Cash Reserve Fund (CRF) is not included as part of the "General Fund Reserve" (which is the statutorily defined ending General Fund balance for a biennium) and was created as a separate and distinct fund to cover cash flow needs within a month or several month period. The Cash Reserve Fund also serves as a “rainy day fund” in that revenues in excess of a “certified forecast” are transferred from the General Fund to Cash Reserve fund at the end of a fiscal year. As the certified forecast is basically the revenue estimate at Sine Die when the budget is finalized, these transfers sequester revenues in excess of that which is needed to balance the budget. The Cash Reserve Fund unobligated balance is projected at $553 million based on current forecasts, actions taken prior legislative sessions, and the Appropriations Committee Preliminary Budget. The Appropriations Committee Preliminary Budget utilizes $75 million of Cash Reserve Fund monies, a transfer to the Nebraska Capital Construction Fund to pay for the Department of Correctional Services Reception and Treatment Center (RTC) project. This project and transfer was also part of the Governors recommendation. The Governors recommendation also includes a $92 million transfer to the General Fund in FY16-17 to help balance the budget and then a $17.5 transfer from the General Fund back to the CRF in FY18-19. At this time the Appropriations Committee did not include any such transfers, subject to hearings and finalization of their recommendation in April.
Table 3 - Cash Reserve Fund Cash Flow
Actual Estimated Estimated Estimated Estimated FY2016-17 FY2017-18 FY2018-19 FY2019-20 FY2020-21 Beginning Balance 730,655,108 637,639,649 573,775,336 566,614,924 566,614,924
Excess of certified forecasts 0 11,201,000 0 0 0
To General Fund per current law 0 0 0 0 0
To Nebr Capital Construction Fund (NCCF) (43,015,459) 0 (7,160,412) 0 (13,276,302)
To Transportation Infrastructure Fund (50,000,000) 0 0 0 0
2017 - Excess from Oral Health Fund 0 150,000 0 0 0
2017 - To General Fund 0 (75,215,313) 0 0 0
2017 - To General Fund 0 0 0 0 0
__________ __________ __________ __________ __________
Ending Balance 637,639,649 573,775,336 566,614,924 566,614,924 553,338,622
When created, the initial purpose of Cash Reserve Fund (CRF) was to set aside money as a “safety net” for the General Fund, sustaining the ability of the General Fund to pay bills when balances would otherwise be insufficient for day to day cash flow. In addition to cash flow another major purpose of the CRF was added later; protection against forecast errors and periods of low year over year revenue growth. Monies are accumulated in the CRF when receipts exceed certified forecast levels and are then available to offset instances when receipts are below forecasts. The level of “protection” or in other words the level of funds to retain in the Cash Reserve fund, can be derived by looking at historical variances derived by comparing forecasts at Sine Die of the legislative session when the budget was enacted and actual receipts which are known anywhere from 13 to 15 months later (See Table 4). Over the 30 year period the average negative variance is -4.3% clustered in groups of 3 to 4 years. For simplicity, using a 4% negative variance clustered for four consecutive years would require a balance equal to about 16% of annual net receipts. Applied to the average forecast from FY16 to FY19 the target balance would be $746 million. Another factor to keep in mind is the need for supplemental funds during a budget down period. One recent illustration is the latest budget shortfall which occurred during the 2008 through -2011 legislative sessions. During that time a total of $986 million of one-time funds were utilized to balance the budget in addition to the various budget cuts that were made. The largest amount of these one-time funds, $653.8 million, came from

Page 9
the federal government through several ARRA programs (FMAP, General and Education stabilization) followed by Cash Reserve Fund transfers ($259 million) and extraordinary cash fund lapses ($73.2 million). While this was a time of unprecedented revenue declines, it illustrates the cumulative impact of multiple year shortfalls. Note that this discussion of the appropriate level of the Cash Reserve Fund is applicable to where the CRF should be at its peak after that part of the cycle with positive revenue growth and positive variances from the forecast. As we turn into the negative part of this cycle, the question is how much of the CRF can or should be utilized to address the projected budget shortfall. A key to answering this question is whether the use the Cash Reserve Fund is only a bridge until a structural balance is achieved or a short term solution which covers up an on-going structural imbalance.
Excess of Certified Forecasts Shown on line 3 of the Financial Status, revenues in excess of "certified" forecasts are required by statute to be transferred from the General Fund to the Cash Reserve Fund. These would take place in July of the fiscal year following completion of that year. FY2015-16 actual receipts were well below the certified forecast thus no transfers in FY2016-17. Also the current forecast for FY2016-17 is the current certified forecast. However, the FY16-17 estimated revenues from Amazon.com which are not in the certified forecast would in fact be above the certified level and is shown as being transferred to the Cash Reserve Fund.
Transfers-To & From General Fund Unlike the automatic transfers that occur after the close of the fiscal year and are statutorily required, other transfers can take place as specifically enacted by the Legislature. No transfers to the General Fund are currently authorized for the five year status.
Transfers To & From Other Funds In the 2013 session, LB 200 provided for a $43,015,459 transfer from the Cash Reserve Fund to the Nebraska Capital Construction Fund (NCCF) sometime between July 1, 2013 and June 30, 2017 at the discretion of the Budget Administrator for construction of a new Central Nebraska Veterans Home to replace the existing facilities. Originally this transfer was shown in FY13-14, however it has been shifted to FY16-17 since the actual transfer has not yet been made. In the 2015 session, the enacted budget called for a $28.2 million of transfers to the NCCF for the State Capitol HVAC project. This included $7,804,292 in FY2015-16, and future transfers of $7,160,412 in FY2018-19, $9,492,568 in FY2020-21, and $3,783,734 in FY2022-23 In the 2016 session, LB 960 provided for a $50 million transfer to a newly created Transportation Infrastructure Bank Fund

Page 10
Table 4 Historical Variance, Projected vs Actual General Fund Receipts
Projected Actual $ % Variance
Millions of $ Sine Die Receipts Variance Negative Positive
FY 1986-87 878.0 886.4 8.4 1.0%
FY 1987-88 924.3 1,016.3 92.0 10.0%
FY 1988-89 988.4 1,133.5 145.1 14.7%
FY 1989-90 1,110.9 1,152.7 41.8 3.8%
FY 1990-91 1,334.6 1,367.1 32.5 2.4%
FY 1991-92 1,493.2 1,490.4 (2.8) -0.2%
FY 1992-93 1,537.3 1,524.7 (12.6) -0.8%
FY 1993-94 1,662.5 1,653.7 (8.8) -0.5%
FY 1994-95 1,729.9 1,706.0 (23.9) -1.4%
FY 1995-96 1,834.3 1,836.7 2.4 0.1%
FY 1996-97 1,918.0 2,009.6 91.6 4.8%
FY 1997-98 1,993.8 2,105.4 111.6 5.6%
FY 1998-99 2,102.9 2,123.9 21.0 1.0%
FY 1999-00 2,326.3 2,403.9 77.6 3.3%
FY 2000-01 2,484.3 2,456.8 (27.5) -1.1%
FY 2001-02 2,646.0 2,365.5 (280.5) -10.6%
FY 2002-03 2,725.7 2,456.4 (269.3) -9.9%
FY 2003-04 2,732.0 2,718.7 (13.3) -0.5%
FY 2004-05 2,775.5 3,037.2 261.7 9.4%
FY 2005-06 3,092.3 3,352.2 259.9 8.4%
FY 2006-07 3,217.0 3,408.3 191.4 5.9%
FY 2007-08 3,389.2 3,506.1 116.9 3.5%
FY2008-09 3,531.7 3,357.5 (174.3) -4.9%
FY2009-10 3,446.7 3,204.7 (242.0) -7.0%
FY2010-11 3,422.2 3,499.7 77.4 2.3%
FY2011-12 3,591.1 3,695.9 104.8 2.9%
FY2012-13 3,767.1 4,052.4 285.3 7.6%
FY2013-14 4,020.7 4,117.40 96.7 2.4%
FY2014-15 4,220.5 4,305.1 84.6 2.0%
FY2015-16 4,481.9 4,308.0 (173.9) -3.9%
FY2016-17 est 4,580.1 4,395.0 (185.1) -4.0%
FY2017-18 est 4,738.3 4,538.0 (200.3) -4.2%
FY2018-19 est 4,932.5 4,730.0 (202.5) -4.1%
Avg Variance -4.3% 4.5%

Page 11
Table 5 Cash Reserve Fund – Historical Balances
Beginning Direct
Deposit Automatic Legislative Cash Ending Balance as % of
Fiscal Yr Balance and Interest Transfers Transfers Flow Balance revenue
FY1983-84 0 37,046,760 na 0 0 37,046,760 4.7% FY1984-85 37,046,760 (1,472,551) na 0 0 35,574,209 4.5% FY1985-86 35,574,209 227,855 na (13,500,000) 0 22,302,064 2.7% FY1986-87 22,302,064 1,428,021 na 0 0 23,730,085 2.7%
FY1987-88 23,730,085 1,654,844 na (7,700,000) 0 17,684,929 1.7%
FY1988-89 17,684,929 139,000 na 32,600,000 0 50,423,929 4.4%
FY1989-90 50,423,929 113,114 na (10,500,000) 0 40,037,043 3.5%
FY1990-91 40,037,043 0 na (8,100,000) 0 31,937,043 2.3%
FY1991-92 31,937,043 0 na (5,000,000) 0 26,937,043 1.8%
FY1992-93 26,937,043 0 na (9,500,000) 0 17,437,043 1.1%
FY1993-94 17,437,043 0 3,063,462 7,250,000 0 27,750,505 1.7%
FY1994-95 27,750,505 0 (8,518,701) 1,250,000 0 20,481,804 1.2%
FY1995-96 20,481,804 0 (20,481,804) 18,189,565 0 18,189,565 1.0%
FY1996-97 18,189,565 0 19,740,786 3,032,333 0 40,962,684 2.0%
FY1997-98 40,962,684 0 91,621,018 0 0 132,583,702 6.3%
FY1998-99 132,583,702 0 111,616,422 (98,500,000) 0 145,700,124 6.9%
FY1999-00 145,700,124 0 20,959,305 (24,500,000) 0 142,159,429 5.9%
FY2000-01 142,159,429 0 77,576,670 (49,500,000) 0 170,236,099 6.9%
FY2001-02 170,236,099 0 0 (60,170,000) 0 110,066,099 4.7%
FY2002-03 110,066,099 66,476,446 0 (87,400,000) (30,000,000) 59,142,545 2.4%
FY2003-04 59,142,545 59,463,461 0 (61,577,669) 30,000,000 87,028,337 3.2%
FY2004-05 87,028,337 8,170,556 108,727,007 (26,758,180) 0 177,167,720 5.8%
FY2005-06 177,167,720 0 261,715,297 (165,266,227) 0 273,616,790 8.2%
FY2006-07 273,616,790 0 259,929,524 (17,458,523) 0 516,087,791 15.1%
FY2007-08 516,087,791 0 191,436,773 (161,978,767) 0 545,545,797 15.6%
FY2008-09 545,545,797 0 116,976,571 (84,330,505) 0 578,191,863 17.2%
FY2009-10 578,191,863 0 0 (110,990,237) 0 467,201,626 14.6%
FY2010-11 467,201,626 0 0 (154,000,000) 0 313,201,626 8.9%
FY2011-12 313,201,626 8,422,528 145,155,092 (33,439,198) (4,461,676) 428,878,372 11.6%
FY2012-13 428,878,372 0 104,789,781 (154,008,427) 4,461,676 384,121,402 9.5%
FY2013-14 384,121,402 0 285,292,610 49,651,294 0 719,065,306 17.5%
FY2014-15 719,065,306 0 96,721,232 (87,951,112) 0 727,835,426 16.9%
FY2015-16 727,835,426 0 84,599,532 (81,779,850) 0 730,655,108 17.0%
FY2016-17 Est 730,655,108 0 0 (93,015,459) 0 637,639,649 14.5%
FY2017-18 Est 637,639,649 150,000 11,201,000 (75,215,313) 0 573,775,336 12.6%
FY2018-19 Est 573,775,336 0 0 (7,160,412) 0 566,614,924 12.0%
FY2019-20 Est 566,614,924 0 0 0 0 566,614,924 11.3%
FY2020-21 Est 566,614,924 0 0 (13,276,302) 0 553,338,622 10.4%

Page 12
GENERAL FUND REVENUES
General Fund Revenue Forecasts
Table 6 General Fund Revenue Forecasts
NEFAB NEFAB NEFAB LFO Prelim LFO Prelim FY2016-17 FY2017-18 FY2018-19 FY2019-20 FY2020-21
Actual/Forecast
Sales and Use Tax 1,585,000,000 1,640,000,000 1,700,000,000 1,790,000,000 1,890,000,000 Individual Income Tax 2,345,000,000 2,445,000,000 2,575,000,000 2,740,000,000 2,915,000,000 Corporate Income Tax 245,000,000 270,000,000 280,000,000 305,000,000 340,000,000 Miscellaneous receipts 220,000,000 183,000,000 175,000,000 195,000,000 185,000,000 ___________ ____________ ____________ ____________ ____________
Total s 4,395,000,000 4,538,000,000 4,730,000,000 5,030,000,000 5,330,000,000
Adjusted Growth
Sales and Use Tax 4.1% 3.4% 3.5% 4.9% 5.2% Individual Income Tax 6.5% 4.1% 5.7% 6.4% 6.4% Corporate Income Tax -17.6% 9.8% 3.6% 8.2% 10.5% Miscellaneous receipts -1.6% -0.2% 2.7% 4.0% 1.5% _________ _________ _________ _________ _________
Total 3.4% 4.0% 4.6% 5.9% 6.0% Five Yr Average 4.3% -- 3.7% -- 4.7%
Revenue Forecasts - Current Biennium (FY17, FY18 and FY19)
Revenue estimates for FY2016-17, FY2017-18 and FY2018-19 are the October 2016 forecasts from the Nebraska Economic Forecast Advisory Board (NEFAB). Rate and base adjusted revenue growth implied by the forecasts for the FY18/FY19 biennium average 4.3% (4.0% in FY17-18 and 4.6% in FY18-19). When including the 3.4% growth in the FY16-17 forecast, there is an average growth of 4.0% over the three years that affect the financial status for the upcoming biennium. This reflects growth below the 4.9% historical 35 year average. THE FORECAST BOARD WILL MEET ON MONDAY FEBRUARY 27, 2017 AND AGAIN IN LATE APRIL 2017 TO REVIEW THE CURRENT FORECASTS. CHANGES TO THESE FORECASTS WILL RESULT IN CHANGES TO THE PROJECTED FINANCIAL STATUS AS NOTED IN THIS REPORT

Page 13
Revenue Forecasts - Following Biennium (FY18 and FY19) The NEFAB does not make official forecasts for the following biennium or what’s commonly referred to as the “out years”. Although different methodologies could be utilized, the revenue estimates used for the following biennium (FY19-20 and FY20-21) are derived by the Legislative Fiscal Office (LFO) using a “capped” historical average methodology. This “smoothing” technique derives “out year” revenue estimates by calculating the level of revenues that would yield a five year average growth (FY17 to FY21) roughly equal to the 34 year historical average (4.9%) less .25% which is the projected impact of indexing the tax brackets as enacted in 20104 (LB987).. Inherent in this methodology is the concept that within any five-year period, below average revenue growth in some years will be offset by above average growth in others and is visually seen in the line graph of historical adjusted revenue growth. The “capped” provision of this methodology means that the derived growth needed in the out-years to achieve the historical average cannot be higher than the “above average” growth years nor lower than the “below average” growth years. Over the past 35 years, there were 12 years in which revenue growth was "below average" (1.0% average) and 23 years in which revenue growth was above average (7.3% average). Because the revenue growth in the NEFAB forecasts is below average, the revenue growth needed to yield a 4.7% five year average is 6.0% in both FY19-20 and FY20-21. Alternative methods are also available for purposes of deriving revenue estimates for the following biennium. In addition to the historical average methodology used in the financial status, both the Nebraska Dept of Revenue (NDR) and Legislative Fiscal Office (LFO) have calculated revenue estimates for these two “out years” using the same models and input from HIS Economics (previously Global Insight) and Moody’s, the national forecasting services used as input into the tax forecast models. While these forecasts work well for the 1 to 3 year forecasts, when extended further they have a tendency to flatten out and follow the 3 year trend into the 4th and 5th year. In other words, they have difficulty picking up changes in the trend. The historical average methodology has been used since 1991 and the “smoothing” technique used for the most part relies on the trend changes As shown in Table 7, the preliminary estimates for the two “out years” arrived at using the historical average concept (as used in the Financial Status) are very close in FY2019-20 but higher in FY2020-21.
Table 7 Comparison of "Out Year" Forecasts
Based on Oct 2016 Revenue Forecasts
Current Status
Average IHS Economics
Average All Forecasts
High Est LFO-Moodys
Low Est NDR IHS
Dollar Forecast (thousands)
FY2019-20 Prelim 5,030,000 5,010,215 5,024,408 5,038,601 5,010,215 FY2020-21 Prelim 5,330,000 5,237,047 5,242,442 5,247,837 5,237,047
Calculated Growth (adjusted)
FY2019-20 Prelim 5.9% 4.3% 4.3% 4.3% 4.3% FY2020-21 Prelim 6.0% 4.7% 4.5% 4.3% 4.7%
Two Year Average 6.0% 4.7% 4.8% 4.9% 4.7% Five Year Average 4.8% 4.4% 4.4% 4.5% 4.4%
$ Difference from Status
FY2019-20 Prelim 0 (19,785) (5,592) 8,601 (19,785) FY2020-21 Prelim 0 (92,953) (87,558) (82,163) (92,953) Cumulative Total 0 (112,738) (93,150) (73,562) (112,738)

Page 14
General Fund Transfers-Out This area tabulates funds that are transferred from the General Fund to another fund within the state treasury. These items have the same effect as an appropriation but are not expended as such and thus are shown under the revenue category (see line 10 on the Financial Status).
Table 8 - General Fund Transfers Out
Excludes CRF Transfers FY2016-17 FY2017-18 FY2018-19 FY2019-20 FY2020-21
Property Tax Credit Fund (202,000,000) (221,000,000) (221,000,000) (221,000,000) (221,000,000) Water Resources Cash Fund (3,300,000) (3,300,000) (3,300,000) 0 0 Cultural Preservation Endowment Fund (750,000) 0 0 (500,000) (500,000) Water Sustainability Fund (11,000,000) (10,670,000) (10,670,000) (11,000,000) (11,000,000) Victim's Compensation Fund (50,000) 0 0 0 0
Total-General Fund Transfers-Out (217,100,000) (234,970,000) (234,970,000) (232,500,000) (232,500,000)
Property Tax Credit Cash Fund Under this program transfers are made to the Property Tax Credit Cash Fund at the discretion of the Legislature. Based on the amount of funds available, monies are then allocated to counties by the ratio of the real property valuation in the county to the real property valuation in the state. Counties then allocate funds as credit to each tax payer again based on their proportionate value. Enacted in 2007, the amount available for credits was $105 million in FY07-08, and $115 million in FY08-09 through FY13-14. During the 2014 session, the FY14-15 amount was increased to $140 million. In the 2015 session, the credit was increased by $64 million increase to a total of $204 million. In the 2016 session, LB 958 made several changes dealing with the Property Tax Credit Act. Previously the property tax credit was distributed based on 100% of the taxable value of real property. Under LB 958, the credit is distributed using “credit allocation valuation” which is 120% of agricultural and horticultural land taxable value and 100% for all other real property except agricultural and horticultural land. This change would shift $20 million of the property tax credit amounts from residential, commercial and industrial, and public service sectors to agriculture so to hold these other sectors harmless, LB958 provided language that the credit amount should be increased by $20 million to a total of $224 million. Note that the General Fund transfer amounts shown are all $3 million less than the credit amount. This is because the credit amount is funded through these General Fund transfers plus an estimated $3 million from any interest that will be earned on the fund balance from the time of transfer to the time of reimbursement payments to the counties, and credits calculated but unpaid relating to properties receiving homestead exemptions.
Water Resources Cash Fund These transfers were originally enacted by LB 701 (2007) for the purpose of (1) aiding compliance efforts regarding the reduction of consumptive uses of water dealing with those natural resources districts which are deemed over or fully appropriated or are bound by an interstate compact or decree; and (2) for a statewide assessment of short- and long-term water management activities and funding needs that are statutorily required. The bill included transfers of $2.7 million in both FY07-08 and FY08-09 and intent language for a $2,700,000 General Fund transfer to occur annually from FY2009-10 through FY2018-19. LB229 enacted during the 2011 Session increased this transfer amount from $2.7 million to $3.3 million per year with no change in the FY2018-19 sunset. Under this current language the transfers are deleted starting in FY2019-20.
Nebraska Cultural Preservation Endowment Fund The Cultural Preservation Endowment Fund was originally created in 1998 with a transfer of $5 million from the General Fund. LB 1165 (2008) provided for an additional $5 million for the endowment fund through a $1 million transfer from the Cash Reserve Fund and another $4 million from the General Fund provided over a series of
Page 15
years. After multiple alterations of the fiscal year transfers, the final transfers, which averaged $500,000 were scheduled to expire at the end of FY2016-17. LB957 (2016) extends the transfers at $500,000 per year starting in FY2017-18 through FY2026-27. The Appropriations Committee Preliminary Budget proposes to not do the transfers for the two years of the current biennium, but extend the transfers another two years through FY2028-29.
Water Sustainability Fund This fund was created through LB906 passed in the 2014 session. Monies for the fund came from General Fund transfers; $21,000,000 in FY2014-15. Of this transfer, $10,000,000 is considered one-time as it was financed by a like transfer from the Cash Reserve Fund to the General Fund. Intent language was include that $11,000,000 General Funds be transferred to the Water Sustainability Fund in each fiscal year beginning in FY2015-16. The Appropriations Committee Preliminary Budget includes the transfer at $10,670,000 for FY18 and FY19, a 3% reduction as included in the Governors recommendation.
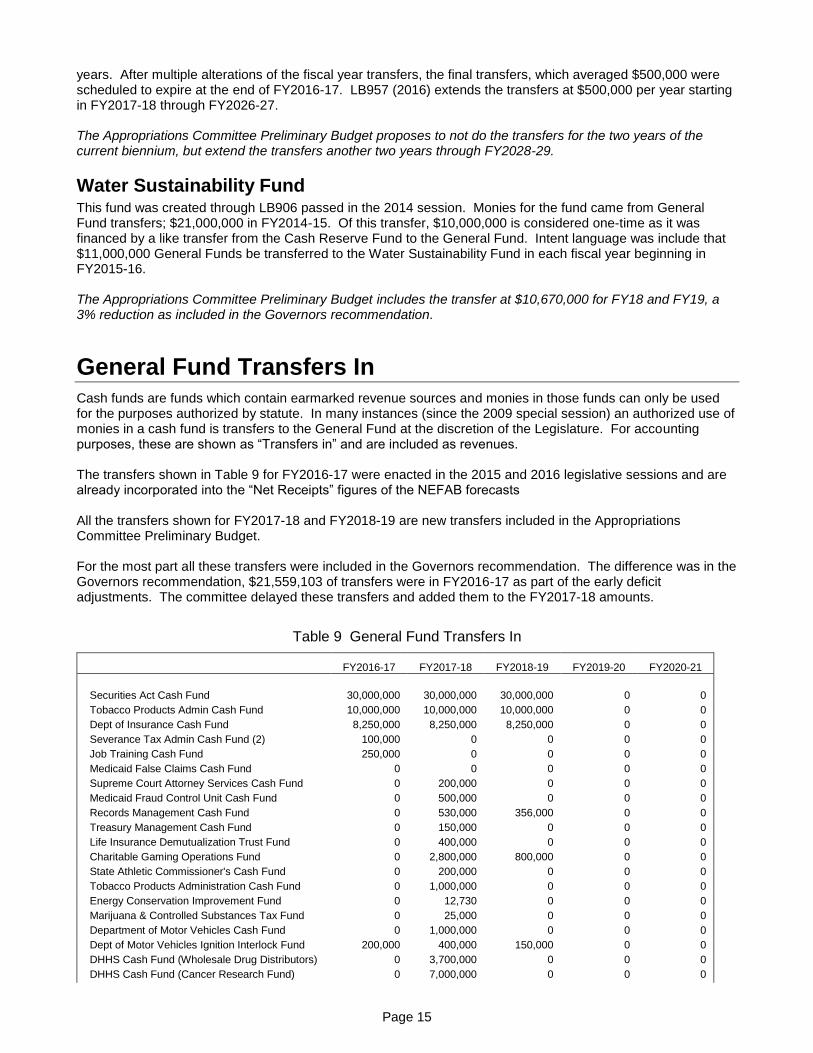
General Fund Transfers In Cash funds are funds which contain earmarked revenue sources and monies in those funds can only be used for the purposes authorized by statute. In many instances (since the 2009 special session) an authorized use of monies in a cash fund is transfers to the General Fund at the discretion of the Legislature. For accounting purposes, these are shown as “Transfers in” and are included as revenues. The transfers shown in Table 9 for FY2016-17 were enacted in the 2015 and 2016 legislative sessions and are already incorporated into the “Net Receipts” figures of the NEFAB forecasts All the transfers shown for FY2017-18 and FY2018-19 are new transfers included in the Appropriations Committee Preliminary Budget. For the most part all these transfers were included in the Governors recommendation. The difference was in the Governors recommendation, $21,559,103 of transfers were in FY2016-17 as part of the early deficit adjustments. The committee delayed these transfers and added them to the FY2017-18 amounts.
Table 9 General Fund Transfers In
FY2016-17 FY2017-18 FY2018-19 FY2019-20 FY2020-21
Securities Act Cash Fund 30,000,000 30,000,000 30,000,000 0 0
Tobacco Products Admin Cash Fund 10,000,000 10,000,000 10,000,000 0 0
Dept of Insurance Cash Fund 8,250,000 8,250,000 8,250,000 0 0
Severance Tax Admin Cash Fund (2) 100,000 0 0 0 0
Job Training Cash Fund 250,000 0 0 0 0
Medicaid False Claims Cash Fund 0 0 0 0 0
Supreme Court Attorney Services Cash Fund 0 200,000 0 0 0
Medicaid Fraud Control Unit Cash Fund 0 500,000 0 0 0
Records Management Cash Fund 0 530,000 356,000 0 0
Treasury Management Cash Fund 0 150,000 0 0 0
Life Insurance Demutualization Trust Fund 0 400,000 0 0 0
Charitable Gaming Operations Fund 0 2,800,000 800,000 0 0
State Athletic Commissioner's Cash Fund 0 200,000 0 0 0
Tobacco Products Administration Cash Fund 0 1,000,000 0 0 0
Energy Conservation Improvement Fund 0 12,730 0 0 0
Marijuana & Controlled Substances Tax Fund 0 25,000 0 0 0
Department of Motor Vehicles Cash Fund 0 1,000,000 0 0 0
Dept of Motor Vehicles Ignition Interlock Fund 200,000 400,000 150,000 0 0
DHHS Cash Fund (Wholesale Drug Distributors) 0 3,700,000 0 0 0
DHHS Cash Fund (Cancer Research Fund) 0 7,000,000 0 0 0

Page 16
FY2016-17 FY2017-18 FY2018-19 FY2019-20 FY2020-21
DHHS Cash (False Medicaid Claims Act) 0 1,200,000 0 0 0
Veteran Cemetery Construction Fund 0 97,000 0 0 0
Nebraska Snowmobile Trail Cash Fund 0 79,121 0 0 0
Racing Commission's Cash Fund 0 150,000 0 0 0
Nebr Motor Vehicle Industry Licensing Fund (3) 0 700,000 0 0 0
State Real Estate Commission's Fund (3) 0 200,000 0 0 0
Metropolitan Class Development Fund 0 22,427 0 0 0
Primary Class Development Fund 0 14,825 0 0 0
Building Renewal Allocation Fund (3) 0 637,000 273,000 0 0
State Building Renewal Assessment Fund 0 602,000 258,000 0 0
Clean‐burning Motor Fuel Development Fund 0 200,000 0 0 0
Waste Reduction and /Recycling Incentive Fund 0 900,000 400,000 0 0
Nebr Litter Reduction & Recycling Cash Fund (3) 0 700,000 200,000 0 0
Petroleum Release Remedial Action Cash Fund 0 1,200,000 500,000 0 0
Comm. on Public Advocacy Operations Cash Fund 0 250,000 0 0 0
Total General Fund Transfers-In 48,000,000 73,120,103 51,187,000 0 0

Page 17
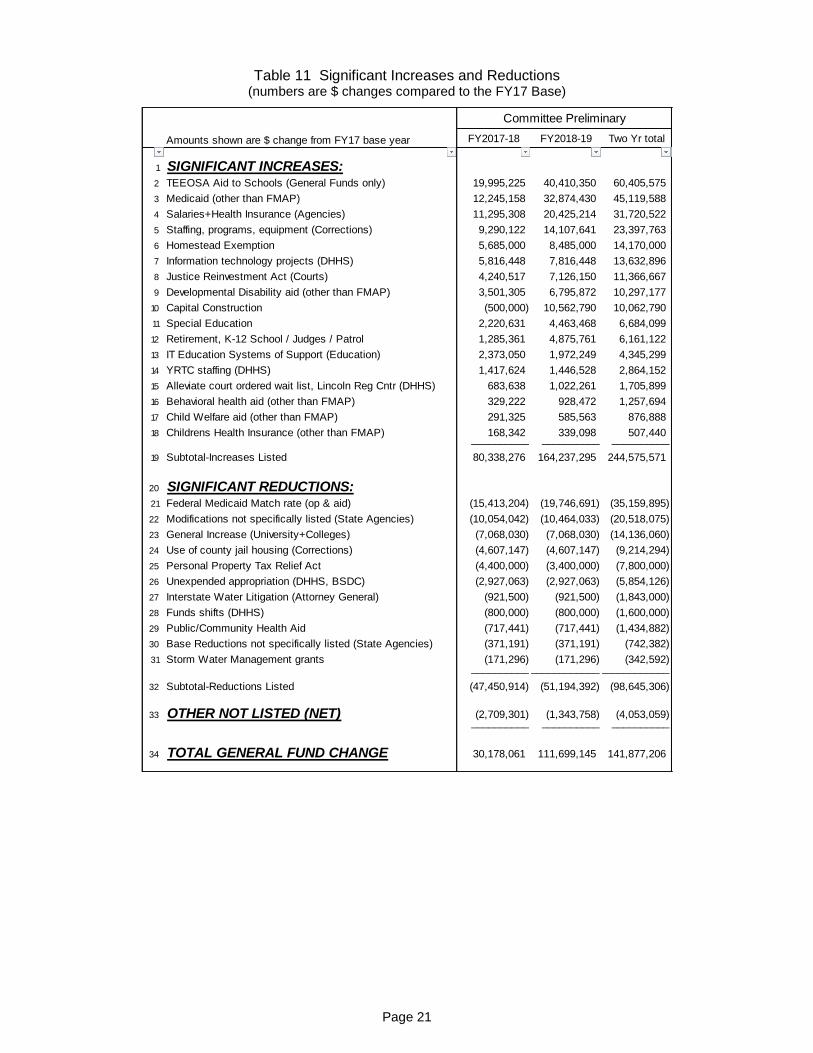
GENERAL FUND APPROPRIATIONS Table 10 shows a summary of the current FY2016-17 General Fund appropriations (excluding deficits) and the Committee Preliminary Recommendation for FY2017-18 and FY2018-19 Table 11 (page 21) provides a one-page summary of the most significant increases and reductions while Table 12 and Table 13 (starting on page 22) contain a listing of proposed appropriations by agency and individual aid programs. A complete listing of individual issues starts on Page 27
Table 10 - Committee Preliminary Budget – General Funds
Committee Preliminary Change over Prior Yr Change over Prior Yr
w/o Deficits Prelim Prelim FY17-18 (w/o deficits) FY18-19 (w/o deficits) 2 Yr Avg
FY2016-17 FY2017-18 FY2018-19 $ % $ % % Change
Agency Operations
University & State /Colleges 635,472,980 628,404,248 628,404,248 (7,068,732) -1.1% 0 0.0% -0.6%
Health & Human Services System 262,140,415 265,839,444 270,614,961 3,699,029 1.4% 4,775,517 1.8% 1.6%
Correctional Services 204,158,501 210,232,155 218,128,328 6,073,654 3.0% 7,896,173 3.8% 3.4%
Courts 179,806,832 185,985,781 190,520,542 6,178,949 3.4% 4,534,761 2.4% 2.9%
State Patrol 60,113,441 61,353,850 61,849,342 1,240,409 2.1% 495,492 0.8% 1.4%
Revenue 27,551,068 27,342,886 27,581,419 (208,182) -0.8% 238,533 0.9% 0.1%
Retirement Board 47,303,239 48,588,600 52,179,000 1,285,361 2.7% 3,590,400 7.4% 5.0%
Other 40 Agencies 164,113,227 161,880,903 163,655,573 (2,232,324) -1.4% 1,774,670 1.1% -0.1%____________ ____________ ____________ _________________ _________________ ______
Total-GF Operations 1,580,659,703 1,589,627,867 1,612,933,413 8,968,164 0.6% 23,305,546 1.5% 1.0%
State Aid to Individuals/Others
Medicaid 850,259,344 849,788,118 866,857,184 (471,226) -0.1% 17,069,066 2.0% 1.0%
Child Welfare Aid 160,193,618 160,484,943 160,779,181 291,325 0.2% 294,238 0.2% 0.2%
Public Assistance 108,094,067 108,094,067 108,094,067 0 0.0% 0 0.0% 0.0%
Developmental disabilities aid 150,667,981 151,917,262 154,564,373 1,249,281 0.8% 2,647,111 1.7% 1.3%
Behavioral Health aid 73,844,769 74,173,991 74,773,241 329,222 0.4% 599,250 0.8% 0.6%
Childrens Health Insurance (SCHIP) 6,440,394 6,163,940 6,208,871 (276,454) -4.3% 44,931 0.7% -1.8%
Aging Programs 10,449,701 10,449,701 10,449,701 0 0.0% 0 0.0% 0.0%
Higher Ed Student Aid programs 7,853,156 7,853,156 7,853,156 0 0.0% 0 0.0% 0.0%
Public Health Aid 6,917,612 6,200,171 6,200,171 (717,441) -10.4% 0 0.0% -5.3%
Business Innovation Act 6,760,000 6,221,200 6,221,200 (538,800) -8.0% 0 0.0% -4.1%
Community health centers 5,783,060 5,783,060 5,783,060 0 0.0% 0 0.0% 0.0%
All Other Aid to Individuals/Other 11,256,968 10,521,398 10,561,588 (735,570) -6.5% 40,190 0.4% -3.1%____________ ____________ ____________ _________________ _________________ ______
Total-GF Aid to Individuals/Other 1,398,520,670 1,397,651,007 1,418,345,793 (869,663) -0.1% 20,694,786 1.5% 0.7%
State Aid to Local Govts
State Aid to Schools (TEEOSA) 952,153,581 972,148,806 992,563,931 19,995,225 2.1% 20,415,125 2.1% 2.1%
Special Education 222,063,117 224,283,748 226,526,585 2,220,631 1.0% 2,242,837 1.0% 1.0%
Property Tax Credit Transfer -- -- -- -- --
Aid to Community Colleges 100,828,308 100,828,308 100,828,308 0 0.0% 0 0.0% 0.0%
Homestead Exemption 72,515,000 78,200,000 81,000,000 5,685,000 7.8% 2,800,000 3.6% 5.7%
Personal Property Tax Relief Act 19,600,000 15,200,000 16,200,000 (4,400,000) -- 1,000,000 100.0% -9.1%
Aid to ESU's 14,051,761 14,051,761 14,051,761 0 0.0% 0 0.0% 0.0%
High ability learner programs 2,342,962 2,342,962 2,342,962 0 0.0% 0 0.0% 0.0%
Early Childhood programs 8,770,164 8,770,164 8,770,164 0 0.0% 0 0.0% 0.0%
Community Based Juvenile Services 6,300,000 6,300,000 6,300,000 0 0.0% 0 0.0% 0.0%
Resources Development Fund 3,140,325 3,140,325 3,140,325 0 0.0% 0 0.0% 0.0%
Other Aid to Local Govt 8,506,246 7,584,950 7,584,950 (921,296) -10.8% 0 0.0% -5.6%____________ ____________ ____________ _________________ _________________ ______
Total-GF Aid to Local Govt 1,410,271,464 1,432,851,024 1,459,308,986 22,579,560 1.6% 26,457,962 1.8% 1.7%
Capital Construction 22,239,000 21,739,000 32,801,790 (500,000) -2.2% 11,062,790 50.9% 21.4%
Total Appropriations 4,411,690,837 4,441,868,898 4,523,389,982 30,178,061 0.7% 81,521,084 1.8% 1.3%

Page 18
The numbers in the Committee Preliminary Budget are the net result of over 300 individual issues which reflect both increases to and reductions from the current year appropriation. A complete listing of individual issues starts on page 27. The following highlights some major changes in each category.
Agency Operations This area accounts for the costs of actually operating state agencies including costs such as employee salaries and benefits, data processing, utilities, vehicle and equipment purchases, fuel and oil, etc... In the FY2017-18 proposed budget, 35.8% of all General Fund appropriations are for agency operations. Although there are 47
state agencies that receive General Fund appropriations, higher education (University of Nebraska and State Colleges) and the six largest agencies (Health and Human Services, Corrections, Courts, State Patrol, Revenue, and Retirement Board) account for 90% of state operations. Note that all of the General Funds for the Retirement Board are actually state contributions for the K-12 School employee retirement plan. They are not shown under aid to local governments as the monies are placed directly into the retirement fund and are not actually paid to a school district. General Funds for agency operations shows a net $8.9 million increase (0.6%) in FY17-18 and a $23.3 million
increase (1.5%) in FY18-19. The most significant increases in operations in FY17-18 are $6.1 million for additional staffing and programming in the Dept. of Correctional Services, $4.2 million for additional probation funding as called for in LB605-Justice Reinvestment Act, $3.2 million to provide on-going base funding for the special pay adjustments certain Correctional Services staff in December 2016, and $5.8 million for two DHHS computer system projects. The budget also includes, $6.4 million for a 1.0% salary increase for state employees, and $4.8 million for a 5.75% increase in health insurance for state employees These increases were offset by several reductions including $10 million of individual modification reductions in 31 different agencies, a $7.1 million reduction in support for the University of Nebraska, and a $2.9 million reduction in base funding needs for the Beatrice State Development (BSDC). Other major operations items include a $4.2 million reduction in the Dept. of Correctional Services to remove the funding for housing inmates in county jails considered one-time pending longer term solutions to the overcrowding issue. The larger increase in FY18-19 reflects the fact that budget reductions in the FY18 base remain at the same level while additional increases are provided for second year salary and health insurance costs ($4.0 million and $5.1 million respectively, Correctional Services staffing and programming (additional $4.8 million), and continued phase-in of LB605-Justice Reinvestment Act (additional $2.9 million.

Page 19
State Aid to Individuals / Others This area has the lowest overall growth in the budget and remains virtually the same as FY17 with a small net reduction of $.9 million (-0.1%) in FY2017-18. Increases in eligibility and utilization in DHHS aid programs ($18.9 million) are mostly offset by $15.4 million savings due to an increase in the Federal Medical Assistance Percentage (FMAP) DHHS provider rates show an $8.2 million reduction in FY2017-18. Rate changes vary by provider with some decreasing, some increasing and others held flat. In the Medicaid Program, nursing facilities and home health providers are increased by 1% each year. Hospitals and reimbursements for items such as durable medical equipment, hearing and prosthetics are cut by 3%percent in FY18. All other providers are held flat. Child welfare providers of congregate care, drug testing and family support services are increased by 1% each year; all others are held flat. Similarly, providers of developmental disabilities services and the behavioral health regions are increased by 1% each year. Other significant increases include annualizing two Medicaid deficits for Medicare Part B premiums ($5.7 million) and federal clawback provisions ($10.4 million). These are partially offset by two reductions in Medicaid related to managed care savings on avoidable episodes of care (-$6.1 million) and increased drug rebates (-$2.3 million).
State Aid to Local Governments Aid to local governments receives a $22.6 million (1.6%) increase in FY2017-18 and another $26.5 million (1.8%) increase in FY2018-19. Because TEEOSA school aid accounts for 69% of all aid to local governments, TEEOSA also significantly influences the growth rate in this category. The Appropriations Committee preliminary budget funds TEEOSA aid at a 2.1% per year increase, $20 million in FY17-18 and an additional $20 million in FY18-19. This level of
funding would require a statutory change as the latest estimates based on current law would call for an increase of $67.6 million (6.9%) in FY17-18 and an additional $55.4 million (5.3%) in FY18-19. The FY17-18 amount is based on the Dept. of Education pre-certification estimate provided in January 2017. The FY18-19 amount is also based on current law but is a Legislative Fiscal Office estimate based on assumptions in valuation and spending growth as arrived at in the October joint meeting of the Fiscal Office, DAS Budget Office, Dept. of Education and Dept. of Revenue, Property Tax division. The preliminary budget also provides for a 1% per year
increase in Special Education ($2.2 million each year). Funding for Community College aid was held flat for each of the next two years. Homestead Exemption reimbursement and the Personal Property Tax Relief act are both based on estimated funding required under current law taking into consideration actual FY16-17 funding needs inflated into the next two. This results in a $5.7 million increase in Homestead exemption reimbursements and a $4.4 million reduction in funding for the Personal Property Tax Relief act.

Page 20
Capital Construction All of the General Funds included in the committee preliminary budget for capital construction are to cover the dollar amounts needed to complete funding of projects approved in previous sessions, commonly referred to as reaffirmations. There is virtually no change in FY2017-18 relative to the FY2016-17 base budget. The $10.6 million increase in FY2018-19 is attributed to the State Capitol HVAC project. With respect to new construction, the Governor and Appropriation Committee included funding for Phase 1 of the Reception and Treatment Center (RTC) project under the Dept. of Correctional Services. This $75 million project, financed with a Cash Reserve Fund transfer to the Nebraska Capital Construction Fund, will combine the Diagnostic and Evaluation Center (DEC) and the Lincoln Correctional Center (LCC) into one facility currently known as the Reception and Treatment Center (RTC). Phase One will expand and/or renovate core support function portions of DEC and LCC to better meet the operational requirements of an inmate population of 1371. It will add 124,236 gross square feet for the following areas: Public Lobby, Administration, Staff Support, Custody Operations, Visitation, Intake and Release, Outpatient Medical/Mental Health (Health Clinic), Medical and Mental Health Housing, and Food Service. The RTC also prepares the secure perimeter and infrastructure to be scaled up for future growth needs. In Phase One, 64 additional medical and behavior health housing beds will be built. The most critical health care bed needs are for skilled nursing and acuity-related medical beds, including isolation, hospice and skilled nursing for chronically, seriously ill inmates who cannot be treated at a lower level of care, and secure behavior health.
Page 21
Table 11 Significant Increases and Reductions (numbers are $ changes compared to the FY17 Base)
Committee Preliminary
Amounts shown are $ change from FY17 base year FY2017-18 FY2018-19 Two Yr total
1 SIGNIFICANT INCREASES:2 TEEOSA Aid to Schools (General Funds only) 19,995,225 40,410,350 60,405,575
3 Medicaid (other than FMAP) 12,245,158 32,874,430 45,119,588
4 Salaries+Health Insurance (Agencies) 11,295,308 20,425,214 31,720,522
5 Staffing, programs, equipment (Corrections) 9,290,122 14,107,641 23,397,763
6 Homestead Exemption 5,685,000 8,485,000 14,170,000
7 Information technology projects (DHHS) 5,816,448 7,816,448 13,632,896
8 Justice Reinvestment Act (Courts) 4,240,517 7,126,150 11,366,667
9 Developmental Disability aid (other than FMAP) 3,501,305 6,795,872 10,297,177
10 Capital Construction (500,000) 10,562,790 10,062,790
11 Special Education 2,220,631 4,463,468 6,684,099
12 Retirement, K-12 School / Judges / Patrol 1,285,361 4,875,761 6,161,122
13 IT Education Systems of Support (Education) 2,373,050 1,972,249 4,345,299
14 YRTC staffing (DHHS) 1,417,624 1,446,528 2,864,152
15 Alleviate court ordered wait list, Lincoln Reg Cntr (DHHS) 683,638 1,022,261 1,705,899
16 Behavioral health aid (other than FMAP) 329,222 928,472 1,257,694
17 Child Welfare aid (other than FMAP) 291,325 585,563 876,888
18 Childrens Health Insurance (other than FMAP) 168,342 339,098 507,440__________ __________ __________
19 Subtotal-Increases Listed 80,338,276 164,237,295 244,575,571
20 SIGNIFICANT REDUCTIONS:21 Federal Medicaid Match rate (op & aid) (15,413,204) (19,746,691) (35,159,895)
22 Modifications not specifically listed (State Agencies) (10,054,042) (10,464,033) (20,518,075)
23 General Increase (University+Colleges) (7,068,030) (7,068,030) (14,136,060)
24 Use of county jail housing (Corrections) (4,607,147) (4,607,147) (9,214,294)
25 Personal Property Tax Relief Act (4,400,000) (3,400,000) (7,800,000)
26 Unexpended appropriation (DHHS, BSDC) (2,927,063) (2,927,063) (5,854,126)
27 Interstate Water Litigation (Attorney General) (921,500) (921,500) (1,843,000)
28 Funds shifts (DHHS) (800,000) (800,000) (1,600,000)
29 Public/Community Health Aid (717,441) (717,441) (1,434,882)
30 Base Reductions not specifically listed (State Agencies) (371,191) (371,191) (742,382)
31 Storm Water Management grants (171,296) (171,296) (342,592)__________ ________________________
32 Subtotal-Reductions Listed (47,450,914) (51,194,392) (98,645,306)
33 OTHER NOT LISTED (NET) (2,709,301) (1,343,758) (4,053,059)__________ __________ __________
34 TOTAL GENERAL FUND CHANGE 30,178,061 111,699,145 141,877,206

Page 22
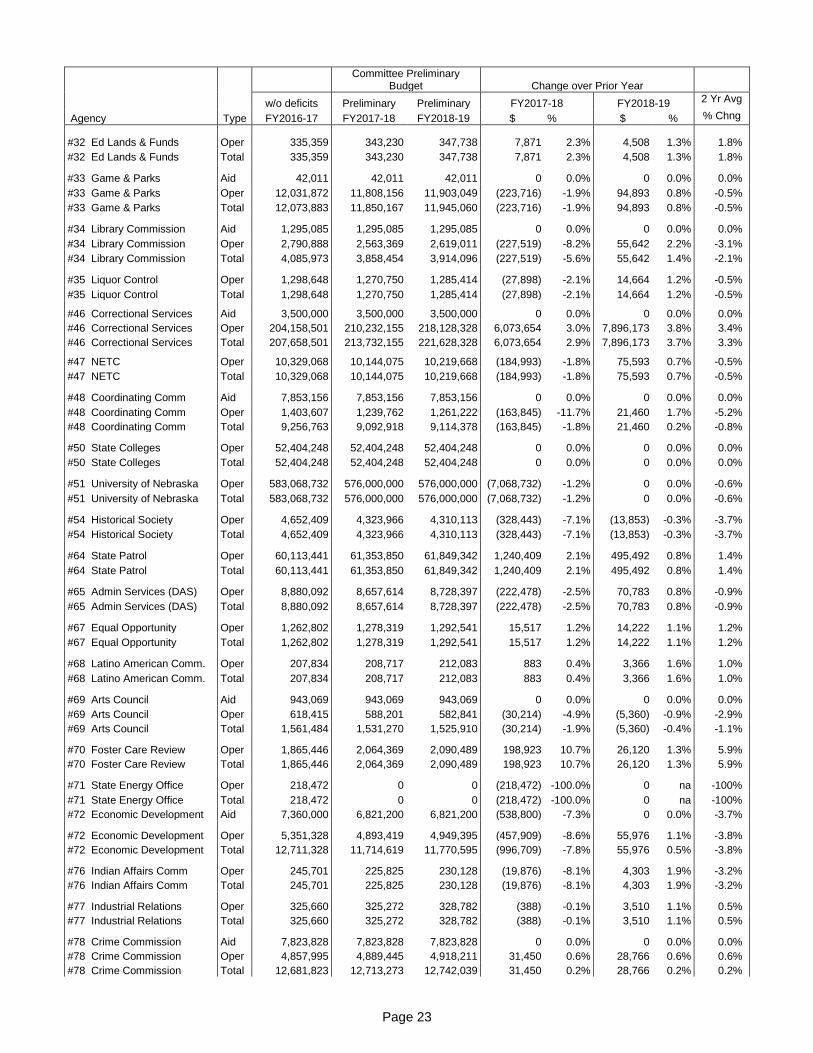
Table 12 General Fund Appropriations by Agency Appropriations Committee Preliminary Budget
Committee Preliminary
Budget Change over Prior Year
w/o deficits Preliminary Preliminary FY2017-18 FY2018-19 2 Yr Avg
Agency Type FY2016-17 FY2017-18 FY2018-19 $ % $ % % Chng
#03 Legislative Council Oper 20,930,311 20,923,169 21,195,007 (7,142) 0.0% 271,838 1.3% 0.6%
#03 Legislative Council Total 20,930,311 20,923,169 21,195,007 (7,142) 0.0% 271,838 1.3% 0.6%
#05 Supreme Court Aid 300,000 300,000 300,000 0 0.0% 0 0.0% 0.0%
#05 Supreme Court Oper 179,806,832 185,985,781 190,520,542 6,178,949 3.4% 4,534,761 2.4% 2.9%
#05 Supreme Court Total 180,106,832 186,285,781 190,820,542 6,178,949 3.4% 4,534,761 2.4% 2.9%
#07 Governor Oper 2,280,286 2,178,103 2,205,430 (102,183) -4.5% 27,327 1.3% -1.7%
#07 Governor Total 2,280,286 2,178,103 2,205,430 (102,183) -4.5% 27,327 1.3% -1.7%
#08 Lt. Governor Oper 149,486 149,357 151,197 (129) -0.1% 1,840 1.2% 0.6%
#08 Lt. Governor Total 149,486 149,357 151,197 (129) -0.1% 1,840 1.2% 0.6%
#09 Secretary of State Oper 2,021,019 2,485,769 2,317,307 464,750 23.0% (168,462) -6.8% 7.1%
#09 Secretary of State Total 2,021,019 2,485,769 2,317,307 464,750 23.0% (168,462) -6.8% 7.1%
#10 State Auditor Oper 2,609,327 2,658,316 2,687,136 48,989 1.9% 28,820 1.1% 1.5%
#10 State Auditor Total 2,609,327 2,658,316 2,687,136 48,989 1.9% 28,820 1.1% 1.5%
#11 Attorney General Oper 7,266,457 6,423,153 6,491,018 (843,304) -11.6% 67,865 1.1% -5.5%
#11 Attorney General Total 7,266,457 6,423,153 6,491,018 (843,304) -11.6% 67,865 1.1% -5.5%
#12 State Treasurer Aid 0 0 0 0 na 0 na na
#12 State Treasurer Oper 1,303,949 1,290,755 1,266,309 (13,194) -1.0% (24,446) -1.9% -1.5%
#12 State Treasurer Total 1,303,949 1,290,755 1,266,309 (13,194) -1.0% (24,446) -1.9% -1.5%
#13 Education Aid 1,203,433,823 1,225,658,778 1,248,356,930 22,224,955 1.8% 22,698,152 1.9% 1.8%
#13 Education Oper 25,498,938 28,223,769 28,365,212 2,724,831 10.7% 141,443 0.5% 5.5%
#13 Education Total 1,228,932,761 1,253,882,547 1,276,722,142 24,949,786 2.0% 22,839,595 1.8% 1.9%
#14 Public Service Comm Oper 2,540,808 2,340,162 2,364,672 (200,646) -7.9% 24,510 1.0% -3.5%
#14 Public Service Comm Total 2,540,808 2,340,162 2,364,672 (200,646) -7.9% 24,510 1.0% -3.5%
#15 Parole Board Oper 7,098,862 7,250,653 7,713,251 151,791 2.1% 462,598 6.4% 4.2%
#15 Parole Board Total 7,098,862 7,250,653 7,713,251 151,791 2.1% 462,598 6.4% 4.2%
#16 Revenue Aid 92,115,000 93,400,000 97,200,000 1,285,000 1.4% 3,800,000 4.1% 2.7%
#16 Revenue Oper 27,551,068 27,342,886 27,581,419 (208,182) -0.8% 238,533 0.9% 0.1%
#16 Revenue Total 119,666,068 120,742,886 124,781,419 1,076,818 0.9% 4,038,533 3.3% 2.1%
#18 Agriculture Aid 975,000 475,000 475,000 (500,000) -51.3% 0 0.0% -30.2%
#18 Agriculture Oper 6,242,820 5,662,109 5,723,024 (580,711) -9.3% 60,915 1.1% -4.3%
#18 Agriculture Total 7,217,820 6,137,109 6,198,024 (1,080,711) -15.0% 60,915 1.0% -7.3%
#21 Fire Marshal Oper 4,356,727 4,087,473 4,107,782 (269,254) -6.2% 20,309 0.5% -2.9%
#21 Fire Marshal Total 4,356,727 4,087,473 4,107,782 (269,254) -6.2% 20,309 0.5% -2.9%
#23 Labor Oper 690,814 636,886 634,675 (53,928) -7.8% (2,211) -0.3% -4.1%
#23 Labor Total 690,814 636,886 634,675 (53,928) -7.8% (2,211) -0.3% -4.1%
#25 DHHS System Aid 1,373,437,632 1,373,764,339 1,394,418,935 326,707 0.0% 20,654,596 1.5% 0.8%
#25 DHHS System Oper 262,140,415 265,839,444 270,614,961 3,699,029 1.4% 4,775,517 1.8% 1.6%
#25 DHHS System Total 1,635,578,047 1,639,603,783 1,665,033,896 4,025,736 0.2% 25,430,113 1.6% 0.9%
#28 Veterans Affairs Oper 1,428,314 1,155,381 1,349,119 (272,933) -19.1% 193,738 16.8% -2.8%
#28 Veterans Affairs Total 1,428,314 1,155,381 1,349,119 (272,933) -19.1% 193,738 16.8% -2.8%
#29 Natural Resources Aid 5,458,361 5,021,692 5,021,692 (436,669) -8.0% 0 0.0% -4.1%
#29 Natural Resources Oper 11,286,789 10,275,032 10,377,285 (1,011,757) -9.0% 102,253 1.0% -4.1%
#29 Natural Resources Total 16,745,150 15,296,724 15,398,977 (1,448,426) -8.6% 102,253 0.7% -4.1%
#31 Military Dept Aid 858,775 608,775 608,775 (250,000) -29.1% 0 0.0% -15.8%
#31 Military Dept Oper 4,485,933 4,363,028 4,386,894 (122,905) -2.7% 23,866 0.5% -1.1%
#31 Military Dept Total 5,344,708 4,971,803 4,995,669 (372,905) -7.0% 23,866 0.5% -3.3%
Page 23
Committee Preliminary
Budget Change over Prior Year
w/o deficits Preliminary Preliminary FY2017-18 FY2018-19 2 Yr Avg
Agency Type FY2016-17 FY2017-18 FY2018-19 $ % $ % % Chng
#32 Ed Lands & Funds Oper 335,359 343,230 347,738 7,871 2.3% 4,508 1.3% 1.8%
#32 Ed Lands & Funds Total 335,359 343,230 347,738 7,871 2.3% 4,508 1.3% 1.8%
#33 Game & Parks Aid 42,011 42,011 42,011 0 0.0% 0 0.0% 0.0%
#33 Game & Parks Oper 12,031,872 11,808,156 11,903,049 (223,716) -1.9% 94,893 0.8% -0.5%
#33 Game & Parks Total 12,073,883 11,850,167 11,945,060 (223,716) -1.9% 94,893 0.8% -0.5%
#34 Library Commission Aid 1,295,085 1,295,085 1,295,085 0 0.0% 0 0.0% 0.0%
#34 Library Commission Oper 2,790,888 2,563,369 2,619,011 (227,519) -8.2% 55,642 2.2% -3.1%
#34 Library Commission Total 4,085,973 3,858,454 3,914,096 (227,519) -5.6% 55,642 1.4% -2.1%
#35 Liquor Control Oper 1,298,648 1,270,750 1,285,414 (27,898) -2.1% 14,664 1.2% -0.5%
#35 Liquor Control Total 1,298,648 1,270,750 1,285,414 (27,898) -2.1% 14,664 1.2% -0.5%
#46 Correctional Services Aid 3,500,000 3,500,000 3,500,000 0 0.0% 0 0.0% 0.0%
#46 Correctional Services Oper 204,158,501 210,232,155 218,128,328 6,073,654 3.0% 7,896,173 3.8% 3.4%
#46 Correctional Services Total 207,658,501 213,732,155 221,628,328 6,073,654 2.9% 7,896,173 3.7% 3.3%
#47 NETC Oper 10,329,068 10,144,075 10,219,668 (184,993) -1.8% 75,593 0.7% -0.5%
#47 NETC Total 10,329,068 10,144,075 10,219,668 (184,993) -1.8% 75,593 0.7% -0.5%
#48 Coordinating Comm Aid 7,853,156 7,853,156 7,853,156 0 0.0% 0 0.0% 0.0%
#48 Coordinating Comm Oper 1,403,607 1,239,762 1,261,222 (163,845) -11.7% 21,460 1.7% -5.2%
#48 Coordinating Comm Total 9,256,763 9,092,918 9,114,378 (163,845) -1.8% 21,460 0.2% -0.8%
#50 State Colleges Oper 52,404,248 52,404,248 52,404,248 0 0.0% 0 0.0% 0.0%
#50 State Colleges Total 52,404,248 52,404,248 52,404,248 0 0.0% 0 0.0% 0.0%
#51 University of Nebraska Oper 583,068,732 576,000,000 576,000,000 (7,068,732) -1.2% 0 0.0% -0.6%
#51 University of Nebraska Total 583,068,732 576,000,000 576,000,000 (7,068,732) -1.2% 0 0.0% -0.6%
#54 Historical Society Oper 4,652,409 4,323,966 4,310,113 (328,443) -7.1% (13,853) -0.3% -3.7%
#54 Historical Society Total 4,652,409 4,323,966 4,310,113 (328,443) -7.1% (13,853) -0.3% -3.7%
#64 State Patrol Oper 60,113,441 61,353,850 61,849,342 1,240,409 2.1% 495,492 0.8% 1.4%
#64 State Patrol Total 60,113,441 61,353,850 61,849,342 1,240,409 2.1% 495,492 0.8% 1.4%
#65 Admin Services (DAS) Oper 8,880,092 8,657,614 8,728,397 (222,478) -2.5% 70,783 0.8% -0.9%
#65 Admin Services (DAS) Total 8,880,092 8,657,614 8,728,397 (222,478) -2.5% 70,783 0.8% -0.9%
#67 Equal Opportunity Oper 1,262,802 1,278,319 1,292,541 15,517 1.2% 14,222 1.1% 1.2%
#67 Equal Opportunity Total 1,262,802 1,278,319 1,292,541 15,517 1.2% 14,222 1.1% 1.2%
#68 Latino American Comm. Oper 207,834 208,717 212,083 883 0.4% 3,366 1.6% 1.0%
#68 Latino American Comm. Total 207,834 208,717 212,083 883 0.4% 3,366 1.6% 1.0%
#69 Arts Council Aid 943,069 943,069 943,069 0 0.0% 0 0.0% 0.0%
#69 Arts Council Oper 618,415 588,201 582,841 (30,214) -4.9% (5,360) -0.9% -2.9%
#69 Arts Council Total 1,561,484 1,531,270 1,525,910 (30,214) -1.9% (5,360) -0.4% -1.1%
#70 Foster Care Review Oper 1,865,446 2,064,369 2,090,489 198,923 10.7% 26,120 1.3% 5.9%
#70 Foster Care Review Total 1,865,446 2,064,369 2,090,489 198,923 10.7% 26,120 1.3% 5.9%
#71 State Energy Office Oper 218,472 0 0 (218,472) -100.0% 0 na -100%
#71 State Energy Office Total 218,472 0 0 (218,472) -100.0% 0 na -100%
#72 Economic Development Aid 7,360,000 6,821,200 6,821,200 (538,800) -7.3% 0 0.0% -3.7%
#72 Economic Development Oper 5,351,328 4,893,419 4,949,395 (457,909) -8.6% 55,976 1.1% -3.8%
#72 Economic Development Total 12,711,328 11,714,619 11,770,595 (996,709) -7.8% 55,976 0.5% -3.8%
#76 Indian Affairs Comm Oper 245,701 225,825 230,128 (19,876) -8.1% 4,303 1.9% -3.2%
#76 Indian Affairs Comm Total 245,701 225,825 230,128 (19,876) -8.1% 4,303 1.9% -3.2%
#77 Industrial Relations Oper 325,660 325,272 328,782 (388) -0.1% 3,510 1.1% 0.5%
#77 Industrial Relations Total 325,660 325,272 328,782 (388) -0.1% 3,510 1.1% 0.5%
#78 Crime Commission Aid 7,823,828 7,823,828 7,823,828 0 0.0% 0 0.0% 0.0%
#78 Crime Commission Oper 4,857,995 4,889,445 4,918,211 31,450 0.6% 28,766 0.6% 0.6%
#78 Crime Commission Total 12,681,823 12,713,273 12,742,039 31,450 0.2% 28,766 0.2% 0.2%

Page 24
Committee Preliminary
Budget Change over Prior Year
w/o deficits Preliminary Preliminary FY2017-18 FY2018-19 2 Yr Avg
Agency Type FY2016-17 FY2017-18 FY2018-19 $ % $ % % Chng
#81 Blind & Visually Impaired Aid 176,890 196,890 196,890 20,000 11.3% 0 0.0% 5.5%
#81 Blind & Visually Impaired Oper 971,637 947,228 957,688 (24,409) -2.5% 10,460 1.1% -0.7%
#81 Blind & Visually Impaired Total 1,148,527 1,144,118 1,154,578 (4,409) -0.4% 10,460 0.9% 0.3%
#82 Deaf & Hard of Hearing Oper 1,016,914 998,178 1,008,192 (18,736) -1.8% 10,014 1.0% -0.4%
#82 Deaf & Hard of Hearing Total 1,016,914 998,178 1,008,192 (18,736) -1.8% 10,014 1.0% -0.4%
#83 Community Colleges Aid 100,828,308 100,828,308 100,828,308 0 0.0% 0 0.0% 0.0%
#83 Community Colleges Total 100,828,308 100,828,308 100,828,308 0 0.0% 0 0.0% 0.0%
#84 Environmental Quality Aid 2,141,196 1,969,900 1,969,900 (171,296) -8.0% 0 0.0% -4.1%
#84 Environmental Quality Oper 3,922,413 3,678,502 3,726,752 (243,911) -6.2% 48,250 1.3% -2.5%
#84 Environmental Quality Total 6,063,609 5,648,402 5,696,652 (415,207) -6.8% 48,250 0.9% -3.1%
#85 Retirement Board Oper 47,303,239 48,588,600 52,179,000 1,285,361 2.7% 3,590,400 7.4% 5.0%
#85 Retirement Board Total 47,303,239 48,588,600 52,179,000 1,285,361 2.7% 3,590,400 7.4% 5.0%
#87 Account/Disclosure Oper 498,468 464,160 471,044 (34,308) -6.9% 6,884 1.5% -2.8%
#87 Account/Disclosure Total 498,468 464,160 471,044 (34,308) -6.9% 6,884 1.5% -2.8%
#91 Tourism Commission Aid 250,000 0 0 (250,000) -100.0% 0 na -100.0%
#91 Tourism Commission Total 250,000 0 0 (250,000) -100.0% 0 na -100.0%
#93 Tax Equal/Review Comm Oper 837,359 865,231 877,497 27,872 3.3% 12,266 1.4% 2.4%
#93 Tax Equal/Review Comm Total 837,359 865,231 877,497 27,872 3.3% 12,266 1.4% 2.4%
Construction-Total Total 22,239,000 21,739,000 32,801,790 (500,000) -2.2% 11,062,790 50.9% 21.4%
OPERATIONS 1,580,659,703 1,589,627,867 1,612,933,413 8,968,164 0.6% 23,305,546 1.5% 1.0%
STATE AID 2,808,792,134 2,830,502,031 2,877,654,779 21,709,897 0.8% 47,152,748 1.7% 1.2%
CONSTRUCTION 22,239,000 21,739,000 32,801,790 (500,000) -2.2% 11,062,790 50.9% 21.4%
TOTAL GENERAL FUNDS 4,411,690,837 4,441,868,898 4,523,389,982 30,178,061 0.7% 81,521,084 1.8% 1.3%

Page 25
Table 13 General Fund Appropriations by Individual Aid Program Appropriations Committee Preliminary Budget
Committee Preliminary Change over Prior Year 2 Yr
w/o Deficits Preliminary Preliminary FY2017-18 FY2018-19 Avg %
Agency Aid Program FY2016-17 FY2017-18 FY2018-19 $ % $ % Chnge
#05 Courts Court Appointed Special Advocate 300,000 300,000 300,000 0 0.0% 0 0.0% 0.0%
#13 Education TEEOSA State Aid to Education 952,153,581 972,148,806 992,563,931 19,995,225 2.1% 20,415,125 2.1% 2.1% #13 Education Special Education 222,063,117 224,283,748 226,526,585 2,220,631 1.0% 2,242,837 1.0% 1.0% #13 Education Aid to ESU's 14,051,761 14,051,761 14,051,761 0 0.0% 0 0.0% 0.0% #13 Education High ability learner programs 2,342,962 2,342,962 2,342,962 0 0.0% 0 0.0% 0.0% #13 Education Early Childhood grant program 3,770,164 3,770,164 3,770,164 0 0.0% 0 0.0% 0.0% #13 Education Early Childhood Endowment 5,000,000 5,000,000 5,000,000 0 0.0% 0 0.0% 0.0% #13 Education Nurturing Healthy Behaviors 400,000 400,000 400,000 0 0.0% 0 0.0% 0.0% #13 Education School Lunch 392,032 392,032 392,032 0 0.0% 0 0.0% 0.0% #13 Education Textbook loan program 465,500 465,500 465,500 0 0.0% 0 0.0% 0.0% #13 Education School Breakfast reimbursement 561,042 561,042 561,042 0 0.0% 0 0.0% 0.0% #13 Education Adult Education 214,664 214,664 214,664 0 0.0% 0 0.0% 0.0% #13 Education Learning Communities Aid 500,000 500,000 500,000 0 0.0% 0 0.0% 0.0% #13 Education Summer Food Service grants 130,000 130,000 130,000 0 0.0% 0 0.0% 0.0% #13 Education High School Equivalency Assistance 750,000 750,000 750,000 0 0.0% 0 0.0% 0.0% #13 Education Step Up to Quality Child Care - Scholarship 100,000 100,000 100,000 0 0.0% 0 0.0% 0.0% #13 Education Step Up to Quality Child Care - Bonuses 69,000 69,000 69,000 0 0.0% 0 0.0% 0.0% #13 Education Vocational Rehabilitation 470,000 470,000 470,000 0 0.0% 0 0.0% 0.0%
#16 Revenue Homestead Exemption 72,515,000 78,200,000 81,000,000 5,685,000 7.8% 2,800,000 3.6% 5.7% #16 Revenue Personal Property Tax Relief Act 19,600,000 15,200,000 16,200,000 (4,400,000) -22.4% 1,000,000 6.6% -9.1%
#18 Agriculture Riparian Vegetation grants 975,000 475,000 475,000 (500,000) -51.3% 0 0.0% -30.2%
#25 HHS System Behavioral Health Aid 73,844,769 74,173,991 74,773,241 329,222 0.4% 599,250 0.8% 0.6% #25 HHS System Medical student assistance/RHOP 787,086 709,086 709,086 (78,000) -9.9% 0 0.0% -5.1% #25 HHS System Childrens Health Insurance 6,440,394 6,163,940 6,208,871 (276,454) -4.3% 44,931 0.7% -1.8% #25 HHS System Public Assistance 108,094,067 108,094,067 108,094,067 0 0.0% 0 0.0% 0.0% #25 HHS System Medicaid 850,259,344 849,788,118 866,857,184 (471,226) -0.1% 17,069,066 2.0% 1.0% #25 HHS System Child Welfare Aid 160,193,618 160,484,943 160,779,181 291,325 0.2% 294,238 0.2% 0.2% #25 HHS System Community developmental disabilities 150,667,981 151,917,262 154,564,373 1,249,281 0.8% 2,647,111 1.7% 1.3% #25 HHS System Community health centers 5,783,060 5,783,060 5,783,060 0 0.0% 0 0.0% 0.0% #25 HHS System Health Aid 6,917,612 6,200,171 6,200,171 (717,441) -10.4% 0 0.0% -5.3% #25 HHS System Care Management 2,315,560 2,315,560 2,315,560 0 0.0% 0 0.0% 0.0% #25 HHS System Area agencies on aging 8,134,141 8,134,141 8,134,141 0 0.0% 0 0.0% 0.0%
#29 Nat Resources Nebr Water Conservation Fund 2,318,036 1,881,367 1,881,367 (436,669) -18.8% 0 0.0% -9.9% #29 Nat Resources Resources Development Fund 3,140,325 3,140,325 3,140,325 0 0.0% 0 0.0% 0.0%
#31 Military Dept Governors Emergency Program 250,000 0 0 (250,000) -100.0% 0 na -100.0%

Page 26
Committee Preliminary Change over Prior Year 2 Yr
w/o Deficits Preliminary Preliminary FY2017-18 FY2018-19 Avg %
Agency Aid Program FY2016-17 FY2017-18 FY2018-19 $ % $ % Chnge
#31 Military Dept Guard tuition assistance 608,775 608,775 608,775 0 0.0% 0 0.0% 0.0%
#33 Game & Parks Niobrara Council 42,011 42,011 42,011 0 0.0% 0 0.0% 0.0%
#34 Library Comm Local libraries 1,295,085 1,295,085 1,295,085 0 0.0% 0 0.0% 0.0%
#46 Corrections Vocational and Life Skills Program 3,500,000 3,500,000 3,500,000 0 0.0% 0 0.0% 0.0%
#48 Coord. Comm Nebr Opportunity Grant Program 6,868,156 6,868,156 6,868,156 0 0.0% 0 0.0% 0.0% #48 Coord. Comm Access College Early Scholarship 985,000 985,000 985,000 0 0.0% 0 0.0% 0.0%
#69 Arts Council Aid to arts programs 943,069 943,069 943,069 0 0.0% 0 0.0% 0.0%
#72 Econ Develop State aid to development districts 500,000 500,000 500,000 0 0.0% 0 0.0% 0.0% #72 Econ Develop Business Innovation Act 6,760,000 6,221,200 6,221,200 (538,800) -8.0% 0 0.0% -4.1% #72 Econ Develop Grow Nebraska 100,000 100,000 100,000 0 0.0% 0 0.0% 0.0%
#78 Crime Comm Juvenile services grants 587,812 587,812 587,812 0 0.0% 0 0.0% 0.0% #78 Crime Comm Community Based Juvenile Services aid 6,300,000 6,300,000 6,300,000 0 0.0% 0 0.0% 0.0% #78 Crime Comm Crimestoppers program 13,457 13,457 13,457 0 0.0% 0 0.0% 0.0% #78 Crime Comm County Justice Reinvestment Grants 500,000 500,000 500,000 0 0.0% 0 0.0% 0.0% #78 Crime Comm Victim Witness assistance 52,559 52,559 52,559 0 0.0% 0 0.0% 0.0% #78 Crime Comm Crime Victims reparations 20,000 20,000 20,000 0 0.0% 0 0.0% 0.0% #78 Crime Comm Violence Prevention Grants 350,000 350,000 350,000 0 0.0% 0 0.0% 0.0%
#81 Blind & Vis Imp Blind rehabilitation 176,890 196,890 196,890 20,000 11.3% 0 0.0% 5.5%
#83 Comm Colleges Aid to Community Colleges 100,828,308 100,828,308 100,828,308 0 0.0% 0 0.0% 0.0%
#84 Environ Quality Superfund cleanup 316,200 316,200 316,200 0 0.0% 0 0.0% 0.0% #84 Environ Quality Storm Water Management grants 1,824,996 1,653,700 1,653,700 (171,296) -9.4% 0 0.0% -4.8%
#91 Tourism Comm Tourism grant program 250,000 0 0 (250,000) -100.0% 0 na -100.0%
Aid to Individuals/Other 1,398,520,670 1,397,651,007 1,418,345,793 (869,663) -0.1% 20,694,786 1.5% 0.7% Aid to Local Government 1,410,271,464 1,432,851,024 1,459,308,986 22,579,560 1.6% 26,457,962 1.8% 1.7%
Total State Aid 2,808,792,134 2,830,502,031 2,877,654,779 21,709,897 0.8% 47,152,748 1.7% 1.2%

Page 27
Detailed List – Specific General Fund Adjustments
(Appropriations Committee Preliminary Budget – Amounts are $ change from FY17 Base)
Agency Prog Issue Type FY2017-18 FY2018-19
3 Legislative Council 122 Reduce Contractual Services (Prog 122) Oper (50,000) (50,000) 3 Legislative Council 123 Eliminate travel and training (Prog 123) Oper (25,000) (25,000) 3 Legislative Council 123 Reduce Printing expense (Prog 123) Oper (25,000) (25,000) 3 Legislative Council 126 Reduce operating expenses (Prog 126) Oper (17,000) (14,500) 3 Legislative Council 127 Delay Printing a Reissue Volume of the Statutes (Prog 127) Oper (136,447) (136,447) 3 Legislative Council 501 Annualize LB317 (2015) withdraw from Rail Compact Oper (15,000) (15,000) 3 Legislative Council 501 Increased organization dues (Prog 501) Oper 7,613 14,991 3 Legislative Council 501 Reduce senator travel allocation from $2,500 to $1,500 Oper (40,000) (40,000) 5 Supreme Court 52 Annualize LB605A, 2015, Justice Reinvestment Act Oper 30,280 167,968 5 Supreme Court 67 Annualize LB605A, 2015, Justice Reinvestment Act Oper 2,304,828 2,765,817 5 Supreme Court 67 Transfer between Programs 67 and 435 - No Net GF Impact Oper 3,264,361 3,264,361 5 Supreme Court 420 Annualize LB919A, 2016, veteran’s treatment court pilot project Oper 58,750 58,750 5 Supreme Court 435 Annualize LB605A, 2015, Justice Reinvestment Act Oper 1,935,689 4,360,333 5 Supreme Court 435 Transfer Between Programs 67 and 435 - No Net GF Impact Oper (3,264,361) (3,264,361) 7 Governor 2 Health Insurance (Prg. 007) Oper (1,400) (1,400) 7 Governor 21 Reduce General Funds per Request (Prg. 021) Oper (65,690) (65,690) 7 Governor 21 Reduce personnel expenses Oper (65,482) (65,482) 8 Lt. Governor 8 Health Insurance ( Prg. 008) Oper (1,900) (1,900) 9 Secretary of State 22 Annualize E-Notary Funding (Prg. 022) Oper (12,068) (17,132) 9 Secretary of State 45 Shift former HAVA Funding from Cash to General (Prg. 045) Oper 190,810 210,810 9 Secretary of State 45 Election Software and Hardware Maintenance (Prg. 045) Oper 273,439 78,804 10 Auditor 506 Upgrade from Microsoft 2007 to current version (Prg. 506) Oper 16,030 16,030 11 Attorney General 496 Water Litigation Funding (Prg. 496) Oper (921,500) (921,500) 12 Treasurer 24 Reduce Staffing (Prg. 024) Oper (9,211) (9,211) 12 Treasurer 24 Reduce Postage and Printing (Prg. 024) Oper (5,600) (8,400) 12 Treasurer 659 Annualize LB 756 (2016) Oper (11,182) (44,349) 13 Education 25 Eliminate early childhood education specialist per intent language Oper (95,000) (95,000) 13 Education 25 Expand Step Up to Quality funding (prog. 25). Oper 225,000 450,000 13 Education 25 Funds to support IT education (prog. 25). Oper 2,373,050 1,972,249 13 Education 158 Increase special education aid by 1.0% (prog. 158). Aid 2,220,631 4,463,468 13 Education 158 Increase state aid for TEEOSA by 2.1% (prog. 158). Aid 19,995,225 40,410,350 13 Education 351 Transfer State Independent Living Grant (prog. 351). Aid (30,111) (30,111) 13 Education 351 Matching funds, vocational rehabilitation services (prog. 351). Aid 39,210 79,400 14 Public Service Comm 54 Correct Duplicate funding due to LB938 (2016) (Prg. 054) Oper (136,071) (136,071) 14 Public Service Comm 54 Reallocate Salaries to NUSF – Communications (Prg. 054) Oper (58,218) (60,055) 14 Public Service Comm 54 Reallocate Salaries to NUSF - GIS mapping (Prg. 054) Oper (36,199) (37,399) 15 Parole Board 358 Increase in Services Costs for additional people on parole Oper 0 390,000 15 Parole Board 358 New Office Space Rent Oper 132,000 132,000 15 Parole Board 358 Reduction in Board of Parole staff and operations Oper (215,000) (215,000) 15 Parole Board 358 Salary Increase for Parole Officers per LB598, 2015 Oper 154,443 154,443 16 Revenue 102 Annualize LB774-2016, relates to TANF. (Prog 102) Oper (115,967) (115,967) 16 Revenue 102 Annualize LB889-2016, School Readiness Tax Credit (Prog 102) Oper (96,309) (96,309) 16 Revenue 102 Annualize LB886-2016, Emerg Responders Incentive (Prog 102) Oper (55,601) (55,601) 16 Revenue 102 Annualize LB884-2016, Affordable Housing Tax Credit (Prog 102) Oper 329,097 25,746 16 Revenue 102 Eliminate funded authorized positions. (Prog. 102) Oper (635,853) (635,853) 16 Revenue 108 Annualize LB 683 (2016) Homestead Exemption (Prog 108) Aid 38,100 43,600 16 Revenue 108 Est increased costs, Homestead Exemption. (Prog 108) Aid 5,646,900 8,441,400 16 Revenue 109 Adjust Personal Property Tax Exemption. (Prog. 109) Aid (4,400,000) (3,400,000) 16 Revenue 112 Appropriations Shift from Cash General Fund (Prog 112) Oper 0 198,509 18 Agriculture 78 Reduce aid, Riparian Vegetation Management (Prog. 078) Aid (500,000) (500,000) 18 Agriculture 78 Reduction of Animal Industry staff. (Prog. 078) Oper (425,551) (436,349) 18 Agriculture 78 Eliminate package inspections. (Prog. 078) Oper (135,354) (139,690) 18 Agriculture 78 Reduce data center program development. (Prog. 078) Oper (100,000) (100,000)
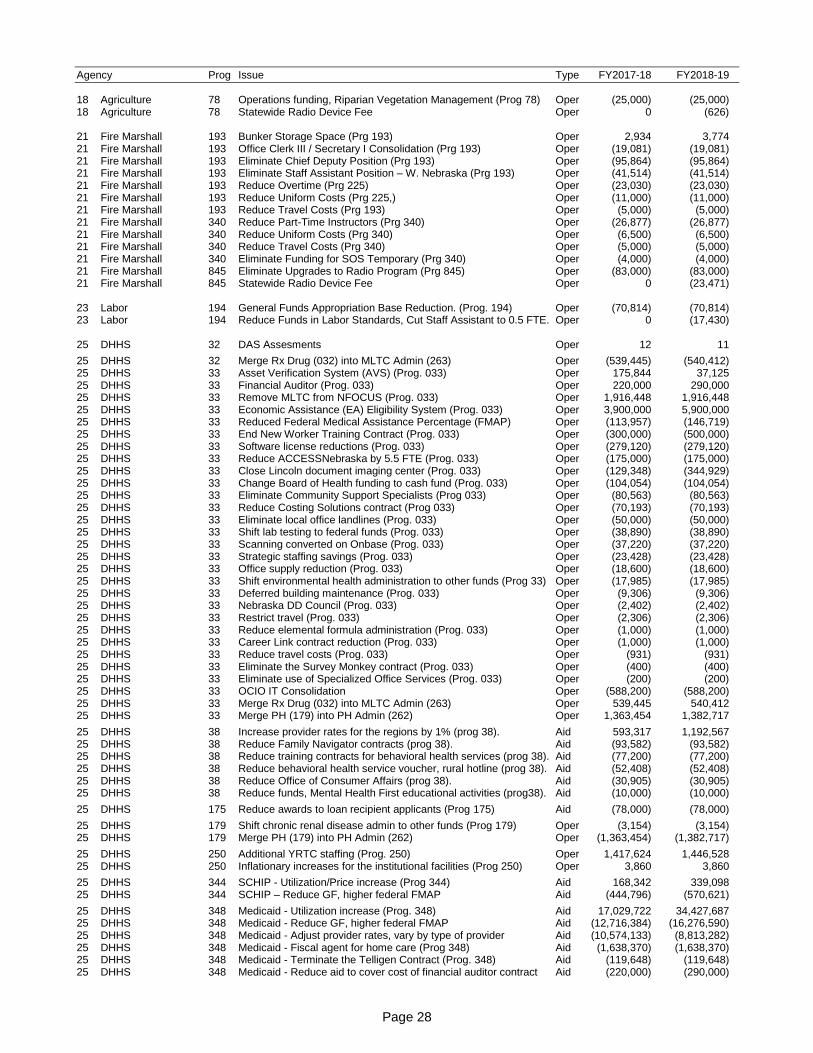
Page 28
Agency Prog Issue Type FY2017-18 FY2018-19
18 Agriculture 78 Operations funding, Riparian Vegetation Management (Prog 78) Oper (25,000) (25,000) 18 Agriculture 78 Statewide Radio Device Fee Oper 0 (626) 21 Fire Marshall 193 Bunker Storage Space (Prg 193) Oper 2,934 3,774 21 Fire Marshall 193 Office Clerk III / Secretary I Consolidation (Prg 193) Oper (19,081) (19,081) 21 Fire Marshall 193 Eliminate Chief Deputy Position (Prg 193) Oper (95,864) (95,864) 21 Fire Marshall 193 Eliminate Staff Assistant Position – W. Nebraska (Prg 193) Oper (41,514) (41,514) 21 Fire Marshall 193 Reduce Overtime (Prg 225) Oper (23,030) (23,030) 21 Fire Marshall 193 Reduce Uniform Costs (Prg 225,) Oper (11,000) (11,000) 21 Fire Marshall 193 Reduce Travel Costs (Prg 193) Oper (5,000) (5,000) 21 Fire Marshall 340 Reduce Part-Time Instructors (Prg 340) Oper (26,877) (26,877) 21 Fire Marshall 340 Reduce Uniform Costs (Prg 340) Oper (6,500) (6,500) 21 Fire Marshall 340 Reduce Travel Costs (Prg 340) Oper (5,000) (5,000) 21 Fire Marshall 340 Eliminate Funding for SOS Temporary (Prg 340) Oper (4,000) (4,000) 21 Fire Marshall 845 Eliminate Upgrades to Radio Program (Prg 845) Oper (83,000) (83,000) 21 Fire Marshall 845 Statewide Radio Device Fee Oper 0 (23,471) 23 Labor 194 General Funds Appropriation Base Reduction. (Prog. 194) Oper (70,814) (70,814) 23 Labor 194 Reduce Funds in Labor Standards, Cut Staff Assistant to 0.5 FTE. Oper 0 (17,430) 25 DHHS 32 DAS Assesments Oper 12 11
25 DHHS 32 Merge Rx Drug (032) into MLTC Admin (263) Oper (539,445) (540,412) 25 DHHS 33 Asset Verification System (AVS) (Prog. 033) Oper 175,844 37,125 25 DHHS 33 Financial Auditor (Prog. 033) Oper 220,000 290,000 25 DHHS 33 Remove MLTC from NFOCUS (Prog. 033) Oper 1,916,448 1,916,448 25 DHHS 33 Economic Assistance (EA) Eligibility System (Prog. 033) Oper 3,900,000 5,900,000 25 DHHS 33 Reduced Federal Medical Assistance Percentage (FMAP) Oper (113,957) (146,719) 25 DHHS 33 End New Worker Training Contract (Prog. 033) Oper (300,000) (500,000) 25 DHHS 33 Software license reductions (Prog. 033) Oper (279,120) (279,120) 25 DHHS 33 Reduce ACCESSNebraska by 5.5 FTE (Prog. 033) Oper (175,000) (175,000) 25 DHHS 33 Close Lincoln document imaging center (Prog. 033) Oper (129,348) (344,929) 25 DHHS 33 Change Board of Health funding to cash fund (Prog. 033) Oper (104,054) (104,054) 25 DHHS 33 Eliminate Community Support Specialists (Prog 033) Oper (80,563) (80,563) 25 DHHS 33 Reduce Costing Solutions contract (Prog 033) Oper (70,193) (70,193) 25 DHHS 33 Eliminate local office landlines (Prog. 033) Oper (50,000) (50,000) 25 DHHS 33 Shift lab testing to federal funds (Prog. 033) Oper (38,890) (38,890) 25 DHHS 33 Scanning converted on Onbase (Prog. 033) Oper (37,220) (37,220) 25 DHHS 33 Strategic staffing savings (Prog. 033) Oper (23,428) (23,428) 25 DHHS 33 Office supply reduction (Prog. 033) Oper (18,600) (18,600) 25 DHHS 33 Shift environmental health administration to other funds (Prog 33) Oper (17,985) (17,985) 25 DHHS 33 Deferred building maintenance (Prog. 033) Oper (9,306) (9,306) 25 DHHS 33 Nebraska DD Council (Prog. 033) Oper (2,402) (2,402) 25 DHHS 33 Restrict travel (Prog. 033) Oper (2,306) (2,306) 25 DHHS 33 Reduce elemental formula administration (Prog. 033) Oper (1,000) (1,000) 25 DHHS 33 Career Link contract reduction (Prog. 033) Oper (1,000) (1,000) 25 DHHS 33 Reduce travel costs (Prog. 033) Oper (931) (931) 25 DHHS 33 Eliminate the Survey Monkey contract (Prog. 033) Oper (400) (400) 25 DHHS 33 Eliminate use of Specialized Office Services (Prog. 033) Oper (200) (200) 25 DHHS 33 OCIO IT Consolidation Oper (588,200) (588,200) 25 DHHS 33 Merge Rx Drug (032) into MLTC Admin (263) Oper 539,445 540,412 25 DHHS 33 Merge PH (179) into PH Admin (262) Oper 1,363,454 1,382,717
25 DHHS 38 Increase provider rates for the regions by 1% (prog 38). Aid 593,317 1,192,567 25 DHHS 38 Reduce Family Navigator contracts (prog 38). Aid (93,582) (93,582) 25 DHHS 38 Reduce training contracts for behavioral health services (prog 38). Aid (77,200) (77,200) 25 DHHS 38 Reduce behavioral health service voucher, rural hotline (prog 38). Aid (52,408) (52,408) 25 DHHS 38 Reduce Office of Consumer Affairs (prog 38). Aid (30,905) (30,905) 25 DHHS 38 Reduce funds, Mental Health First educational activities (prog38). Aid (10,000) (10,000)
25 DHHS 175 Reduce awards to loan recipient applicants (Prog 175) Aid (78,000) (78,000)
25 DHHS 179 Shift chronic renal disease admin to other funds (Prog 179) Oper (3,154) (3,154) 25 DHHS 179 Merge PH (179) into PH Admin (262) Oper (1,363,454) (1,382,717)
25 DHHS 250 Additional YRTC staffing (Prog. 250) Oper 1,417,624 1,446,528 25 DHHS 250 Inflationary increases for the institutional facilities (Prog 250) Oper 3,860 3,860
25 DHHS 344 SCHIP - Utilization/Price increase (Prog 344) Aid 168,342 339,098 25 DHHS 344 SCHIP – Reduce GF, higher federal FMAP Aid (444,796) (570,621)
25 DHHS 348 Medicaid - Utilization increase (Prog. 348) Aid 17,029,722 34,427,687 25 DHHS 348 Medicaid - Reduce GF, higher federal FMAP Aid (12,716,384) (16,276,590) 25 DHHS 348 Medicaid - Adjust provider rates, vary by type of provider Aid (10,574,133) (8,813,282) 25 DHHS 348 Medicaid - Fiscal agent for home care (Prog 348) Aid (1,638,370) (1,638,370) 25 DHHS 348 Medicaid - Terminate the Telligen Contract (Prog. 348) Aid (119,648) (119,648) 25 DHHS 348 Medicaid - Reduce aid to cover cost of financial auditor contract Aid (220,000) (290,000)

Page 29
Agency Prog Issue Type FY2017-18 FY2018-19
25 DHHS 348 Medicaid - Managed Care Savings on Avoidable Episodes of Care Aid (6,114,252) (6,114,252) 25 DHHS 348 Medicaid - Increased Medicaid Drug Rebates Aid (2,300,000) (2,300,000) 25 DHHS 348 Medicaid - Medicare Part B Premium Increase (annualize deficit) Aid 5,761,146 5,539,296 25 DHHS 348 Medicaid - Federal Clawback Increase (annualize deficit) Aid 10,420,693 12,182,999
25 DHHS 354 Child Welfare - provider rate adjustment Aid 291,325 585,563
25 DHHS 365 Inflationary increases for the institutional facilities Oper 59,252 119,818 25 DHHS 365 Reduce FTE at the Hastings Regional Center (prog. 365). Oper (118,406) (118,406) 25 DHHS 365 Reduce 2.0 FTE at the Lincoln Regional Center (prog. 365). Oper (111,473) (111,473)
25 DHHS 421 BSDC - Inflationary increases for the institutional facilities Oper (1,987) (3,977) 25 DHHS 421 BSDC - Reduce GF, higher federal FMAP Oper (306,772) (383,465) 25 DHHS 421 BSDC - Decrease appropriation base for BSDC (prog. 421). Oper (2,927,063) (2,927,063) 25 DHHS 421 BSDC - Discontinue contracts for support (prog. 421). Oper (568,196) (568,196) 25 DHHS 421 BSDC - Discontinue contract for day services (prog. 421). Oper (175,000) (175,000)
25 DHHS 424 DD aid - clients served through the DD Custody Act (prog. 424). Aid 302,042 302,042 25 DHHS 424 DD aid - persons transitioning from high school (prog. 424). Aid 1,697,234 3,474,752 25 DHHS 424 DD aid - Reduce GF, higher federal FMAP Aid (2,252,024) (2,899,480) 25 DHHS 424 DD aid - Provider rate increase of 1% per year Aid 1,502,029 3,019,078
25 DHHS 514 Health Aid - Base Reduction Aid (717,441) (717,441)
25 DHHS 519 Inflationary increases the institutional facilities Oper 18,500 36,948 25 DHHS 519 Contractual support staff from General to Fed funds (prog. 519). Oper (800,000) (800,000) 25 DHHS 519 New Kearney vets home, shift costs General to cash (prog. 519). Oper (494,800) (494,800) 25 DHHS 519 Reduce base, medication dispensing machine savings (prog. 519). Oper (401,258) (401,258) 25 DHHS 519 Terminate pharmacy contracts, medication dispensing savings. Oper (200,000) (200,000)
25 DHHS 870 Inflationary increases the institutional facilities Oper 8,676 15,992 25 DHHS 870 Open 5th Unit at Norfolk Sex Offender Treatment (prog. 870). Oper 683,638 1,022,261 28 Vets Affiars 36 Annualize two positions authorized by LB 754 (2016) (Prog. 36). Oper 44,612 46,506 28 Vets Affiars 36 Eliminate Staff Assistant, Military and Veterans Affairs (Prog. 36). Oper (47,476) (47,476) 28 Vets Affiars 36 Reduce the health insurance base (Prog. 36). Oper (30,000) (30,000) 28 Vets Affiars 36 Reduce one-time costs, agency’s LB 754 fiscal note (Prog. 36). Oper (13,500) (13,500) 28 Vets Affiars 37 Use available cash funds to offset General Fund Oper (250,000) (80,000) 29 Natural Resources 304 Reduce funding, Soil and Water Conservation Fund (Prog. 304) Aid (436,669) (436,669) 29 Natural Resources 334 Reduction of research and data collection functions. (Prog 334) Oper (926,480) (926,480) 29 Natural Resources 334 Defer planned equipment replacements and upgrades. (Prog 334) Oper (200,000) (200,000) 31 Military Dept 192 Governor's Emergency Program, use cash to offset General Aid (250,000) (250,000) 31 Military Dept 544 Reduced state support of ARNG facilities (Prog. 544). Oper (160,246) (160,246) 31 Military Dept 544 Statewide Radio Device Fee Oper 0 (2,512) 31 Military Dept 545 Statewide Radio Device Fee Oper 0 (9,421) 32 Ed Lands & Funds 529 Health insurance correction (prog. 529). Oper 2,885 2,885 33 Game and Parks 549 Base Reduction Oper (168,521) (168,521) 33 Game and Parks 617 Base Reduction Oper (192,435) (192,435) 33 Game and Parks 846 Statewide Radio Device Fee Oper 0 (21,355) 34 Library Commission 252 Office space lease expense. (Prog. 252) Oper 22,990 46,893 34 Library Commission 252 Eliminate Info Infrastructure Support Tech 1 FTE. (Prog. 252). Oper (70,493) (72,574) 34 Library Commission 252 Eliminate Information Services Librarian. 1 FTE (Prog. 252) Oper (60,747) (62,767) 34 Library Commission 252 Eliminate Library Services Technician. 1 FTE (Prog. 252) Oper (48,153) (49,632) 34 Library Commission 252 Eliminate Research Analyst I. 1 FTE ( Prog. 252) Oper (43,860) (45,070) 34 Library Commission 252 Eliminate Administrative Secretary position. 1 FTE (Pog. 252) Oper (38,502) (39,585) 34 Library Commission 252 Eliminate Federal Aid Administrator. .5 FTE (Prog.252) Oper (33,625) (34,510) 35 Liquor Control 73 Reduction in Commercial Air Expenditure (Prog. 73) Oper (11,330) (11,330) 35 Liquor Control 73 Reduction in State Owned Transportation Expenditure (Prog. 73). Oper (11,013) (11,013) 35 Liquor Control 73 Reduction in Lodging Expenditure (Prog. 73) Oper (10,000) (10,000) 35 Liquor Control 73 Reduce Other Operating Costs Expenditure (Prog. 73) Oper (8,773) (8,773) 35 Liquor Control 73 Reduce Conference Registration Expenditure (Prog. 73) Oper (3,000) (3,000) 46 Corrections 200 Remove County Jail Funding, temporary program Oper (4,607,147) (4,607,147) 46 Corrections 200 Annualize LB867A, 2016: DCS adopt regulations Oper 43,621 43,621 46 Corrections 200 One-time cash fund to offset General Fund amount Oper (1,000,000) 0 46 Corrections 200 Critical Under Resourced Issues, additional staffing Oper 959,775 970,712 46 Corrections 200 Evidence‐Based Practices: additional staffing Oper 574,223 691,667 46 Corrections 200 Health Services: additional staffing Oper 701,034 508,941 46 Corrections 200 Information Technology and Radios Oper 741,580 740,950 46 Corrections 200 Protective Service staffing: 55 in FY18, 135 in FY19 Oper 3,124,205 8,006,066

Page 30
Agency Prog Issue Type FY2017-18 FY2018-19
46 Corrections 200 State Radio System Device Fees Oper 0 (27,636) 46 Corrections 200 Base funding for special pay adjustments, December 2016 Oper 3,189,305 3,189,305 47 NETC 533 TV Network Fiber Costs (Prog. 533, Priority 16 of 16) Oper 30,000 30,000 47 NETC 533 Research & Communications position – 1FTE (Prog. 533) Oper (82,600) (82,600) 47 NETC 533 UNTV Contracted Services – 1FTE (Prog. 533) Oper (70,500) (70,500) 47 NETC 533 Media Services Help Desk position – 1FTE (Prog. 533) Oper (59,700) (59,700) 47 NETC 533 TV Operating Expenses (Prog. 533) Oper (40,936) (40,936) 47 NETC 566 Radio Operating Expenses. (Prog. 566) Oper (31,916) (31,916) 47 NETC 566 Radio Program Acquisition. (Prog. 566) Oper (14,000) (14,000) 48 Postsecond Coord 640 Eliminate Data Analyst position. (Program 640) Oper (70,480) (71,756) 48 Postsecond Coord 640 Eliminate Administrative Secretary position. (Program 640) Oper (47,421) (48,439) 48 Postsecond Coord 640 Eliminate funds, health insurance reserve. (Program 640). Oper (24,561) (17,762) 48 Postsecond Coord 640 Discontinue SHEEO membership, VFA subscription. (Prog 640) Oper (19,705) (19,705) 48 Postsecond Coord 640 Eliminate tuition reimbursement, employees. (Prog 640) Oper (6,000) (6,000) 48 Postsecond Coord 640 Discontinue SHEEO Higher Edu Policy Conference. (Prog 640) Oper (6,000) (6,000) 48 Postsecond Coord 640 Reduce budgeted travel funds. (Program 640) Oper (5,785) (5,785) 48 Postsecond Coord 640 Reduce non-personnel operating expenses. (Program 640) Oper (5,714) (5,714) 50 State Colleges 48 Leave at current year level Oper 0 0 51 University of Nebr 515 Base Reduction Oper (7,068,732) (7,068,732) 54 Historical Society 553 Expiration of Sesquicentennial Commission (Prg. 553) Oper 0 (94,000) 54 Historical Society 553 Reduce funding, Sesquicentennial Commission (Prg. 553) Oper (36,964) 0 54 Historical Society 648 Eliminate One-Time Funding - Mainstreet Project Oper (100,000) (100,000) 54 Historical Society 648 Publication Staff (Prg. 648) Oper (107,805) (109,960) 54 Historical Society 648 Reference Hours and Service (Prg. 648) Oper (65,482) (66,473) 54 Historical Society 648 Neligh Mill State Historic Site (Prg. 648) Oper (32,022) (32,624) 54 Historical Society 648 Historic Preservation Staff (Prg. 648) Oper (31,268) (31,952) 54 Historical Society 648 Cather and Neihardt Contracts (Prg. 648) Oper (10,169) (10,169) 64 State Patrol 100 Change in costs, Deferred Retirement Option Plan (DROP) Oper 3,222 (70,318) 64 State Patrol 100 Increased retirement costs, LB467-2016 contributions Oper 15,409 24,517 64 State Patrol 100 Transfer two Information Technology positions to the OCIO Oper (167,180) (167,180) 64 State Patrol 100 Facility rental cost savings in Scottsbluff Oper (100,000) (100,000) 64 State Patrol 100 Reduce the amount of cash paid out in overtime Oper (253,587) (238,003) 64 State Patrol 100 Reduce funds budgeted for information technology Oper (163,653) (163,653) 64 State Patrol 100 Have Roads pick up Patrol’s share of 511 Weather Line Oper (107,500) (107,500) 64 State Patrol 100 Reduce Supplies & Equipment by approximately 8% Oper (32,290) (32,290) 64 State Patrol 100 Reduce conference and training travel costs, approx. 10% Oper (19,938) (19,938) 64 State Patrol 100 Reduce Promotional Materials, approx. 50% Oper (5,000) (5,000) 64 State Patrol 100 Reduce Dues & Subscriptions, professional associations Oper (3,127) (3,127) 64 State Patrol 850 State Radio System Device Fees Oper 0 (262,138) 65 Admin Services 101 NITC Administrative Manager (Prg. 101) Oper (39,695) (41,104) 65 Admin Services 169 Eliminate Federal Liaison Funding (Prg. 169) Oper (3,500) (3,500) 65 Admin Services 509 Reduce AS Assessment (Prg. 509) Oper (1,455) (1,109) 65 Admin Services 509 Health Insurance (Prg. 509) Oper (71,735) (71,735) 65 Admin Services 560 Reduce repair and maintenance, Governor's residence. Oper (19,306) (19,306) 65 Admin Services 605 Restructuring of Personnel Staff (Prog. 605) Oper (170,252) (174,015) 68 Latino-American 537 Funding for Commissioners travel to meetings (Prog. 537) Oper 3,500 3,500 68 Latino-American 537 Base Reduction Oper (6,235) (6,235) 69 Arts Council 326 Accumulated benefits, one retiring employee. (Prog. 326) Oper 14,460 0 69 Arts Council 326 Reduce staff services for constituents. (Prog. 326) Oper (10,500) (10,500) 69 Arts Council 326 Reduce funding for staff development. (Prog. 326) Oper (8,100) (8,100) 69 Arts Council 326 Eliminate contractual services for database support. (Prog. 326) Oper (7,897) (7,897) 69 Arts Council 326 Eliminate scheduled computer replacement. (Prog. 326) Oper (7,500) (7,500) 69 Arts Council 326 Eliminate funding for Statewide Arts Conference. (Prog. 326) Oper (6,000) (6,000) 69 Arts Council 326 Eliminate travel costs, Arts Council & review panels Prog 326) Oper (5,000) (5,000) 69 Arts Council 326 Eliminate funding dedicated for database update. (Prog.326) Oper (5,000) (5,000) 69 Arts Council 326 Eliminate consulting services for strategic planning. (Prog. 326) Oper (5,000) (5,000) 70 Foster Care Review 353 Annualize LB746, continue base funding for Childrens Commission Oper 190,000 190,000 70 Foster Care Review 353 Reduce operating costs (Prog. 353) Oper (19,568) (19,568) 71 Energy Office 106 One-time item, LB 469 (2015) state energy plan (Prog106) Oper (218,472) (218,472)

Page 31
Agency Prog Issue Type FY2017-18 FY2018-19
72 Economic Develop 601 Reduction of operating costs. (Prog 601) Oper (42,000) (42,000) 72 Economic Develop 603 Reduce Business Innovation commercialization grants (Prog 603) Aid (488,800) (488,800) 72 Economic Develop 603 Eliminate funding for GROW Nebraska. (Prog 603) Aid (50,000) (50,000) 72 Economic Develop 603 Reduce management consultant services. (Prog. 603) Oper (270,000) (270,000) 72 Economic Develop 603 Eliminate Econ Develop Business Consultant position (Prog 603) Oper (78,745) (78,745) 72 Economic Develop 603 Eliminate Econ Develop Consultant position, research (Prog 603) Oper (75,119) (75,119) 72 Economic Develop 603 Reduce Econ Develop Manager position .36 FTE. (Prog 603) Oper (29,273) (29,273) 72 Economic Develop 603 Reduce vehicle mileage allotment. (Prog. 603) Oper (25,000) (25,000) 76 Indian Commission 584 Cut all Overtime (Prog. 584) Oper (7,297) (7,297) 76 Indian Commission 584 Transportation Reduction (Prog. 584) Oper (692) (692) 76 Indian Commission 584 Health Insurance Adjustment Oper (16,424) (16,424) 77 Industrial Relations 490 Base Reduction Oper (4,000) (4,000) 77 Industrial Relations 531 Additional Health Insurance.(Prog 531) Oper 8,648 8,648 77 Industrial Relations 531 Eliminate printing the CIR Reporter. (Prog. 531) Oper (3,000) (3,000) 77 Industrial Relations 531 Reduce Operating Costs. (Prog. 531) Oper (2,957) (2,957) 77 Industrial Relations 531 Reduce Legal Counsel. (Prog. 531) Oper (1,850) (1,850) 77 Industrial Relations 531 Reduce Court Reporter Costs. (Prog. 531) Oper (1,000) (1,000) 78 Crime Commission 198 Reduce admin costs, County Justice Reinvestment Grant Oper (79,109) (79,109) 78 Crime Commission 201 Annualize LB 843-2016 - Sexual Assault Payment Program Oper 108,600 108,600 78 Crime Commission 215 Annualize LB 505A-2016, Criminal history record information Oper (30,000) (30,000) 81 Blind/Vis Impaired 357 Replace fed funds, serve clients without a vocational goal. Aid 20,000 20,000 81 Blind/Vis Impaired 357 Shift federal portion of rent surcharge to general funds. Oper 11,513 11,513 81 Blind/Vis Impaired 357 Reduce 1.0 FTE Counselor position (prog. 357). Oper (47,395) (47,395) 82 Deaf/Hard of Hrng 578 Reduce operating costs (Prog. 578) Oper (30,000) (30,000) 83 Community Colleges 151 Leave at current year level Aid 0 0 84 Environ Quality 513 Reduction in stormwater grant program. (Prog 513) Aid (171,296) (171,296) 84 Environ Quality 513 Staffing reductions in Air and Water Quality programs (Prog 513) Oper (146,244) (146,244) 84 Environ Quality 513 Reduction of Community Right-to-Know functions (Prog 513) Oper (80,000) (80,000) 84 Environ Quality 513 Reduction in water quality testing. (Prog 513) Oper (39,263) (39,263) 84 Environ Quality 513 Eliminate position, groundwater management program. (Prog 513) Oper (33,263) (33,263) 84 Environ Quality 513 Statewide Radio Device Fee Oper 0 (626) 85 Retirement Board 515 State Patrol Plan, actuarially required contribution (Prog 515) Oper (184,180) 2,174,262 85 Retirement Board 515 Judges’ Plan, actuarially required contribution (Prog 515) Oper 118,714 979,000 85 Retirement Board 515 Omaha School Plan, 2% of salary, service annuity. (Prog 515) Oper 231,080 342,099 85 Retirement Board 515 School Plan, 2% of salary contribution. (Prog 515) Oper 1,119,747 1,380,400 87 Account/Disclosure 94 Lower operations and workers comp costs (Prg. 094) Oper (2,157) (2,157) 87 Account/Disclosure 94 Reduce base General Funds by 8% Oper (39,705) (39,705) 91 Tourism Comm 618 Reduction of General Funds allocated for state aid. (Prog. 618) Aid (250,000) (250,000) 93 Tax Equalization 115 Funding shift from Cash Fund to General Fund. (Prog. 115) Oper 20,000 20,000 93 Tax Equalization 115 Hold Fewer Hearing Outside of the Lincoln Office. (Prog 115) Oper (5,974) (5,974) 99 Construction 101 Change in construction relative to FY17 Const (500,000) 10,562,790 All Agencies --- DAS Accounting / NIS charges Oper 466,388 477,552 All Agencies --- FY18 / FY19 Salary Increases Oper 6,449,354 10,453,008 All Agencies --- FY18 / FY19 Health Insurance Increases Oper 4,984,351 10,255,144 Total Adjustments (Operations) Oper 8,968,164 32,273,710 Total Adjustments (State Aid) Aid 21,709,897 68,862,645 Total Adjustments (Construction) Const (500,000) 10,562,790
Total General Fund Budget Adjustments Total 30,178,061 111,699,145

Page 32
COMPARISON TO GOVERNORS RECOMMENDATION
Committee Preliminary Budget Governors Recommendation Tax Rate Review Committee (Nov 2016)
Current Year Biennial Budget Current Year Biennial Budget
FY2016-17 FY2017-18 FY2018-19 FY2016-17 FY2017-18 FY2018-19
1 BEGINNING BALANCE
2 Beginning Cash Balance 531,652,199 135,071,509 81,369,714 531,652,199 263,176,405 203,882,544
3 Cash Reserve transfers-automatic 0 (11,201,000) 0 0 (32,710,103) 0
4 Carryover obligations from FY16 (310,603,783) 0 0 (310,603,783) 0 0
5 Lapse FY16 reapproriations (LB 22) 72,170,032 0 0 77,454,598 0 0
6 Allocation for potential deficits 0 (5,000,000) (5,000,000) 0 (5,000,000) (5,000,000)_______________________________________ _______________________________________
7 Unobligated Beginning Balance 293,218,448 118,870,509 76,369,714 298,503,014 225,466,302 198,882,544
8 REVENUES & TRANSFERS
9 Net Receipts (Oct 2016 NEFAB+hist avg) 4,395,000,000 4,538,000,000 4,730,000,000 4,395,000,000 4,538,000,000 4,730,000,000
9a Incorporate Amazon.com (from Governor budget) 11,201,000 28,218,000 31,344,000 11,201,000 28,218,000 31,344,000
10 General Fund transfers-out (217,100,000) (234,970,000) (234,970,000) (216,660,000) (234,970,000) (234,970,000)
11 General Fund transfers-in (50,000) 73,120,103 51,187,000 21,509,103 51,656,000 51,187,000
12 Cash Reserve transfers (current law) 0 0 0 0 0 0
13 2017 Cash Reserve transfers (new) 0 0 0 92,000,000 0 (17,500,000)
14 2017 Revenue Bills 0 0 0 0 0 0_______________________________________ _______________________________________
15 General Fund Net Revenues 4,189,051,000 4,404,368,103 4,577,561,000 4,303,050,103 4,382,904,000 4,560,061,000
16 APPROPRIATIONS
17 Appropriations (2015 Session) 4,411,690,837 4,411,690,837 4,411,690,837 4,411,690,837 4,411,690,837 4,411,690,837
18 2017 Mainline Budget Adjustments 0 30,178,061 111,699,145 0 (5,803,079) 75,964,444
20 Projected budget increase, following biennium 0 0 0 0 0 0
19 2017 Regular deficits (LB 22) 23,554,965 0 0 20,054,965 0 0
21 2017 Deficit reductions (LB 22) (88,442,716) 0 0 (93,763,944)
22 2017 State Claims 394,853 0 0 394,854 0 0
23 2017 "A" Bills 0 0 0 0 (1,400,000) (1,400,000)_______________________________________ _______________________________________
24 General Fund Appropriations 4,347,197,939 4,441,868,898 4,523,389,982 4,338,376,712 4,404,487,758 4,486,255,281
25 ENDING BALANCE
26 Dollar ending balance (per Financial Status) 135,071,509 81,369,714 130,540,732 263,176,405 203,882,544 272,688,263
27 Dollar ending balance (at Minimum Reserve) 259,699,600 -- 265,217,464 125,331,556 -- 267,187,319
28 Excess (shortfall) from Minimum Reserve (124,628,091) -- (134,676,732) 137,844,849 -- 5,500,944
29 Biennial Reserve (%) 1.5% 1.5% -5.9% 3.1%
General Fund Appropriations
30 Annual % Change - Appropriations (w/o deficits) 3.3% 0.7% 1.8% 3.3% -0.1% 1.9%
31 Two Year Average 3.7% -- 1.3% 3.7% -- 0.9%
CASH RESERVE FUND FY2016-17 FY2017-18 FY2018-19 FY2016-17 FY2017-18 FY2018-19
Beginning Balance 730,655,108 637,639,649 573,775,336 730,655,108 545,639,649 503,134,439
Excess of certified forecasts (line 3 in Status) 0 11,201,000 0 0 32,710,103 0
To/from Gen Fund per current law 0 0 0 0 0 0
To Nebr Capital Construction Fund (NCCF) (43,015,459) 0 (7,160,412) (43,015,459) 0 (10,005,129)
To Transportation Infrastructure Fund (50,000,000) 0 0 (50,000,000) 0 0
2017 - Excess from Oral Health Training Fund 0 150,000
2017 - To / From General Fund 0 0 0 (92,000,000) 0 17,500,000
2017 - To NCCF (Corrections) 0 (75,215,313) 0 0 (75,215,313) 0____________ ____________ ____________ ____________ ____________ ____________
Projected Unobligated Ending Balance 637,639,649 573,775,336 566,614,924 545,639,649 503,134,439 510,629,310
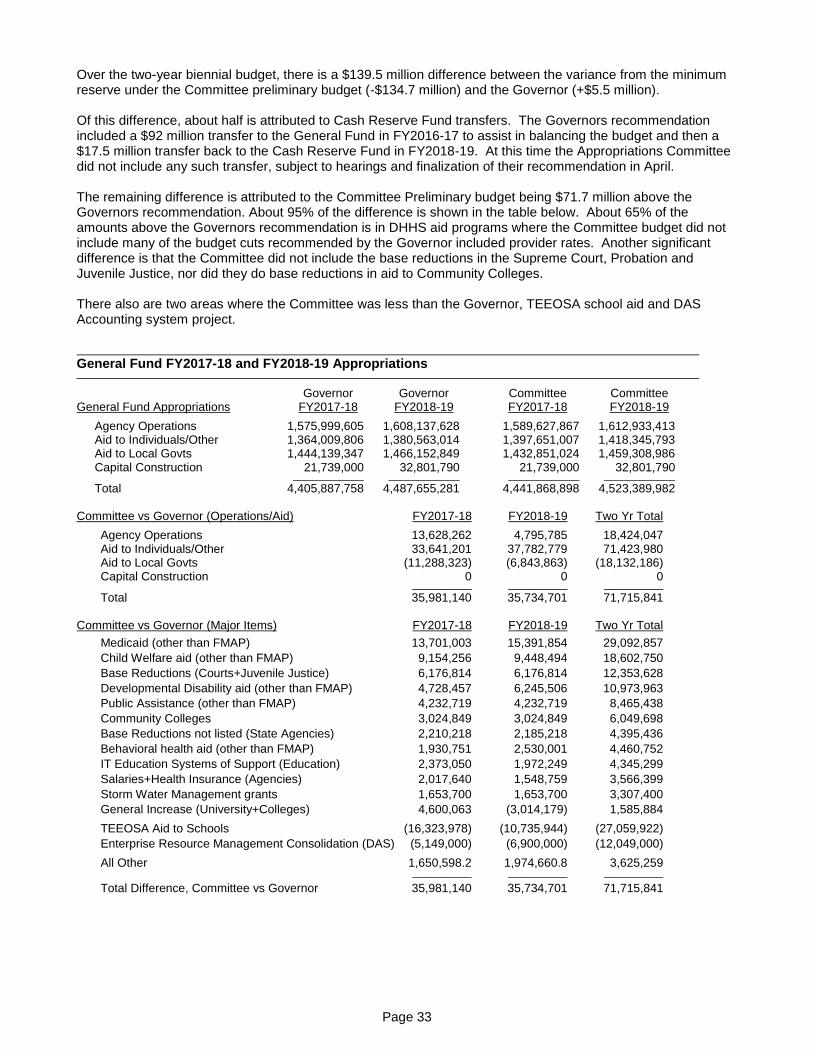
Page 33
Over the two-year biennial budget, there is a $139.5 million difference between the variance from the minimum reserve under the Committee preliminary budget (-$134.7 million) and the Governor (+$5.5 million). Of this difference, about half is attributed to Cash Reserve Fund transfers. The Governors recommendation included a $92 million transfer to the General Fund in FY2016-17 to assist in balancing the budget and then a $17.5 million transfer back to the Cash Reserve Fund in FY2018-19. At this time the Appropriations Committee did not include any such transfer, subject to hearings and finalization of their recommendation in April. The remaining difference is attributed to the Committee Preliminary budget being $71.7 million above the Governors recommendation. About 95% of the difference is shown in the table below. About 65% of the amounts above the Governors recommendation is in DHHS aid programs where the Committee budget did not include many of the budget cuts recommended by the Governor included provider rates. Another significant difference is that the Committee did not include the base reductions in the Supreme Court, Probation and Juvenile Justice, nor did they do base reductions in aid to Community Colleges. There also are two areas where the Committee was less than the Governor, TEEOSA school aid and DAS Accounting system project.
General Fund FY2017-18 and FY2018-19 Appropriations
Governor Governor Committee Committee General Fund Appropriations FY2017-18 FY2018-19 FY2017-18 FY2018-19
Agency Operations 1,575,999,605 1,608,137,628 1,589,627,867 1,612,933,413 Aid to Individuals/Other 1,364,009,806 1,380,563,014 1,397,651,007 1,418,345,793 Aid to Local Govts 1,444,139,347 1,466,152,849 1,432,851,024 1,459,308,986 Capital Construction 21,739,000 32,801,790 21,739,000 32,801,790 ____________ ____________ ____________ ____________
Total 4,405,887,758 4,487,655,281 4,441,868,898 4,523,389,982 Committee vs Governor (Operations/Aid) FY2017-18 FY2018-19 Two Yr Total
Agency Operations 13,628,262 4,795,785 18,424,047 Aid to Individuals/Other 33,641,201 37,782,779 71,423,980 Aid to Local Govts (11,288,323) (6,843,863) (18,132,186) Capital Construction 0 0 0 __________ __________ __________
Total 35,981,140 35,734,701 71,715,841 Committee vs Governor (Major Items) FY2017-18 FY2018-19 Two Yr Total
Medicaid (other than FMAP) 13,701,003 15,391,854 29,092,857
Child Welfare aid (other than FMAP) 9,154,256 9,448,494 18,602,750
Base Reductions (Courts+Juvenile Justice) 6,176,814 6,176,814 12,353,628
Developmental Disability aid (other than FMAP) 4,728,457 6,245,506 10,973,963
Public Assistance (other than FMAP) 4,232,719 4,232,719 8,465,438
Community Colleges 3,024,849 3,024,849 6,049,698
Base Reductions not listed (State Agencies) 2,210,218 2,185,218 4,395,436
Behavioral health aid (other than FMAP) 1,930,751 2,530,001 4,460,752
IT Education Systems of Support (Education) 2,373,050 1,972,249 4,345,299
Salaries+Health Insurance (Agencies) 2,017,640 1,548,759 3,566,399
Storm Water Management grants 1,653,700 1,653,700 3,307,400
General Increase (University+Colleges) 4,600,063 (3,014,179) 1,585,884
TEEOSA Aid to Schools (16,323,978) (10,735,944) (27,059,922)
Enterprise Resource Management Consolidation (DAS) (5,149,000) (6,900,000) (12,049,000)
All Other 1,650,598.2 1,974,660.8 3,625,259 __________ __________ __________
Total Difference, Committee vs Governor 35,981,140 35,734,701 71,715,841

Page 34
General Fund Transfers-In (2 Yr Total) Governor* Committee Difference
Securities Act Cash Fund 60,000,000 60,000,000 0 Tobacco Products Administration Cash Fund 20,000,000 20,000,000 0 Department of Insurance Cash Fund 16,500,000 16,500,000 0
Severance Tax Administration Cash Fund (50,000) (50,000) 0 Supreme Court Attorney Services Cash Fund 200,000 200,000 0 Medicaid Fraud Control Unit Cash Fund 500,000 500,000 0 Records Management Cash Fund 886,000 886,000 0 Treasury Management Cash Fund 150,000 150,000 0 Life Insurance Demutualization Trust Fund 400,000 400,000 0 Charitable Gaming Operations Fund 3,600,000 3,600,000 0 State Athletic Commissioner's Cash Fund 200,000 200,000 0 Tobacco Products Administation Cash Fund 1,000,000 1,000,000 0 Energy Conservation Improvement Fund 12,730 12,730 0 Marijuana & Controlled Substances Tax Admin. Fund 25,000 25,000 0 Department of Motor Vehicles Cash Fund 1,000,000 1,000,000 0 DMV Ignition Interlock Fund ** (change and new) 550,000 550,000 0 DHHS Cash Fund (Wholesale Drug Distributors) 3,700,000 3,700,000 0 DHHS Cash Fund (Cancer Research Fund) 7,000,000 7,000,000 0 DHHS Cash (False Medicaid Claims Act) 1,200,000 1,200,000 0 Veteran Cemetery Construction Fund 97,000 97,000 0 Nebraska Snowmobile Trail Cash Fund 79,121 79,121 0 Racing Commission's Cash Fund 150,000 150,000 0 Nebraska Motor Vehicle Industry Licensing Fund ** 700,000 700,000 0 State Real Estate Commission's Fund ** 200,000 200,000 0 Metropolitan Class Development Fund 22,427 22,427 0 Primary Class Development Fund 14,825 14,825 0 Building Renewal Allocation Fund ** 910,000 910,000 0 State Building Renewal Assessment Fund 860,000 860,000 0 Clean‐burning Motor Fuel Development Fund 200,000 200,000 0
Waste Reduction and Recycling Incentive Fund 1,300,000 1,300,000 0 Nebraska Litter Reduction and Recycling Cash Fund ** 900,000 900,000 0 Petroleum Release Remedial Action Cash Fund 1,700,000 1,700,000 0 Comm. on Public Advocacy Operations Cash Fund 250,000 250,000 0 Legal Education for Public Service Loans Fund 95,000 0 (95,000) ____________ ____________ ____________
Total - GF Tramsfers In 124,352,103 124,257,103 (95,000) * Amounts shown under the Governors column include FY2016-17 fund transfers included in the early deficit bills. The Committee did not include them at that time but did include them in FY2017-18 amounts.
** Require statutory authorization to transfer funds to the General fund
General Fund Transfers-Out (2 Yr Total) Governor Committee Difference
Property Tax Credit Fund (442,000,000 (442,000,000) 0 Water Sustainability Fund (21,340,000) (21,340,000) 0 Water Resources Cash Fund (6,600,000) (6,600,000) 0 Cultural Preservation Endowment Fund 0 0 0 Victims Compensation Fund 0 0 0 ____________ ____________ ____________
General Fund Transfers In (469,940,000) (469,940,000) 0
Cash Reserve Fund Transfers (2 Yr Total) Governor Committee Difference From General Fund 17,500,000 0 (17,500,000) From Oral Health Training (unused balance) 0 150,000 150,000 To General Fund (92,000,000) 0 92,000,000 To NCCF (Corrections RTC construction project) (75,215,313) (75,215,313) 0 ____________ ____________ ____________
Cash Reserve Fund Transfers (149,715,313) (75,065,313) 74,650,000

Page 35
General Fund Deficits (FY2016-17) Governor Committee Difference
Regular Deficits Education - TEEOSA - lower Insurance Premium Tax 316,161 316,161 0 PSC - Increase expenses relating to a new commissioner 9,758 9,758 0 Revenue - Homestead Exemption, adjust to actual tax loss 2,235,000 2,235,000 0 DHHS – Medicaid, Medicare Part B Premium Increase 3,264,087 3,264,087 0 DHHS – Medicaid, Medicare Prescription Drug Benefit Clawback 5,263,256 5,263,256 0 DHHS - Child Welfare, Nebraska Families Collaborative 7,803,559 7,803,559 0 DHHS - Develop Disability aid, HCBS residential providers 1,163,144 4,663,144 3,500,000
Specific Cuts Auditor - reduce for waived health insurance coverage (22,000) (22,000) 0 Treasurer - reduce for actual health insurance coverage (15,000) (15,000) 0 Treasurer - State Disbursement Unit - One-time fund shift (50,000) (50,000) 0 Treasurer - Long Term Care Savings Plan - align with spending (11,081) (11,081) 0 Education - Delete funding, Master Teacher Program Aid (470,000) (470,000) 0 Parole - Salary increase will not occur in FY 2017 for Board members (9,790) (9,790) 0 Revenue - Personal Prop Tax Relief Act - updated NDR est (5,800,000) (5,800,000) 0 Agriculture - Reduce the Riparian Vegetation Aid Program (300,000) (300,000) 0 Agriculture - Reduce the Riparian Vegetation Aid Program (oper) (10,000) (10,000) 0 DHHS - SCHIP - Reduce appropriation based on expenditure rate (1,400,000) (1,400,000) 0 DHHS - Public Assistance - reduce to match est expenditures (10,000,000) (10,000,000) 0 DHHS - Medicaid - prior year drug rebates (15,000,000) (15,000,000) 0 DHHS - Medicaid - Reduce appropriation based on expenditure rate (7,525,000) (7,525,000) 0 DHHS - Delay opening Lincoln Reg Cntr unit until FY 2017-18 (1,000,000) (1,000,000) 0 DHHS - BSDC - one-time fund shift (5,000,000) (5,000,000) 0 DHHS - BSDC - reduce appropriation to match estimated expenditures(3,500,000) (3,500,000) 0 Military - Governors Emergency Fund - eliminate base appropriation (250,000) (250,000) 0 DED - Community and Rural Develop, one-time fund shift (32,015) (32,015) 0 Crime Comm - Community corrections - one-time fund shift (100,000) (100,000) 0 DEQ - Storm Water Management Grants - reduce funding (900,000) (300,000) 600,000
Across the Board Cut (various agencies) (42,369,058) (37,647,830) 4,721,228 ____________ __________ __________
Total General Fund FY17 Deficit Appropriations (73,708,979) (64,887,751) 8,821,228
LAPSE FY2016-17 REPPROPRIATIONS (77,454,598) (72,170,032) 5,284,566

Page 36
STATUTORY CHANGES REQUIRED
New Bill Introduction, Rule 5 Rule 5 of the “Rules of the Nebraska Unicameral Legislature” authorizes the Appropriations Committee to introduce new bills in conjunction with the issuance of their Preliminary Report. The intent of the rule is to give the committee the opportunity to review budget requests, develop an initial recommendation and then proceed to hearing on proposed funding levels while other standing committees can hear the new bills that enable the recommendation.
THE SPECIFICS OF THE COMMITTEE PRELIMINARY BUDGET DO NOT REQUIRE INTRODUCTION OF NEW BILLS
Any statutory changes required to carry out the Appropriations Committee Preliminary Budget could be accomplished with bills already introduced as noted below.
Appropriations Committee Preliminary Budget
The Committee Preliminary budget would require statutory changes relating to TEEOSA school aid (multiple bills
in the Education Committee) and authorization for cash fund transfers to the General Fund (LB 23)
Governor Recommendation The Governors Recommendation would require statutory changes relating to TEEOSA school aid and several budget modification reductions. The following were listed in the Governor’s budget document.
LB 333 Eliminate the State Disability program LB 334 Change Department of Health and Human Services provisions relating to families LB 335 Change provisions relating to a child care market rate survey LB 336 Provide a fee for registry checks under the Child Protection and Family Safety Act
No specific bill was referenced with respect to a statutory change in TEEOSA to achieve the Governors recommended level.
Mainline Appropriations Bills The following bills are the standard appropriations bills as introduced by the Governor that authorize the bulk of state government expenditures. They are listed here for information only.
LB 22 Provide for deficit appropriations (Speaker Scheer, at the request of the Governor)
LB 23 Provide for transfers of funds and terminate funds
LB 327 Appropriate funds for state government expenses (Speaker Scheer, at the request of the Governor)
LB 328 Appropriations for legislative salaries (Speaker Scheer, at the request of the Governor)
LB 329 Appropriate funds, salaries of constitutional officers (Speaker Scheer, at the request of the Governor)
LB 330 Provide appropriations for capital construction (Speaker Scheer, at the request of the Governor)
LB 331 Create and transfer funds (Speaker Scheer, at the request of the Governor)
LB 332 Cash Reserve Fund transfers (Speaker Scheer, at the request of the Governor)