fy20 annual report
TRANSCRIPT
FY20 ANNUAL REPORT
For
per
sona
l use
onl
y

FROST & SULLIVAN
2020 Leader: Australian Data Centre Services Radar Report
2019 Winner: Visionary Innovation Leadership Award, Global Data Centre Infrastructure and Operations
2017 Winner: Data Centre Services Growth Excellence
2016 Winner: Data Centre Services Growth Excellence Leadership Award
2014 Winner: Australia Data Centre Service Provider of the Year Award
UPTIME BRILL AWARDS, ASIA-PACIFIC
2019 Winner: Best Practices Award - Global Data Centre Infrastructure and Operations Visionary Innovation Leadership Award
2015 Winner: Efficient IT in the Product Solutions category
DATACENTER DYNAMICS AWARDS
2018 Winner: Data Centre Operations Team of the Year, Asia-Pacific
2018 Winner: Data Centre Operations Team of the Year, Global
2018 Winner: Data Centre Design Team of the Year, Global
2014 Winner: S1 Sydney – Innovation in the Mega-Data Centre
DELOIT TE TECH FAST AWARDS
2014 #1 Deloitte Technology Fast 50 Australia
2014 #6 Deloitte Technology Fast 500 APAC
2017 #5 highest revenue of Fast 100 companies
2014 #3 fastest-growing Australian company over the past three years
QUEENSLAND AWARDS
2016 Winner: AXON – Industrial and Primary Industries category
2016 Winner: AXON – Infrastructure and Platforms Innovation of the Year
ARN ICT INDUSTRY AWARDS
2017 Highly Commended: Jeff Van Zetten, Head of Engineering and Design – Technical Excellence
2015 Winner: AXONVX – Best Telecommunications Initiative of the Year
2014 Winner: Telecommunications Vendor of the Year
2015 Winner: Service Provider of the Year
2014 Winner: Service Provider of the Year
MASTER BUILDERS ASSOCIATION EXCELLENCE IN CONSTRUCTION AWARDS
2018 Winner: B2 – Brisbane – Best commercial building $5 - $50M
2016 Winner: S1 Sydney – Communications Buildings
LORD MAYOR’S BUSINESS AWARDS
2017 Winner: B2 data centre – Port of Brisbane Award for Investment in Brisbane category
DATACLOUD ASIA
2017 Excellence in Data Centre IT Architecture and Design
Information Security Management System (ISMS) certification
(B1, B2, S1, S2, M1, M2, C1 and P1)
Environmental Management System certification
(M1, S1, C1, B2 and P1)
Quality Management System certification
(B1, B2, S1, M1, M2, C1 and P1)
ISO 27001:2013 ISO 9001:2015 ISO 14001:2015 NABERS
M1 Melbourne S1 Sydney
QualityISO 9001
EnvironmentISO 14001
UPTIME INSTITUTE
InformationSecurityISO 27001
AWARDS AND CERTIFICATIONS
NEXTDC Limited and controlled entities | FY20 Annual Report 2
For
per
sona
l use
onl
y

Highlights 4
Letter from The Chairman and CEO 6
About NEXTDC 10
Our People and Culture Strategies 16
Directors’ Report 19
Remuneration Report 30
Auditor’s Independence Declaration 50
Corporate Governance Statement 51
Financial Report 52
Directors’ Declaration 98
Independent Auditor’s Report to the Members 99
Shareholder Information 105
Corporate Directory 107
1 July 2019 to 30 June 2020 | NEXTDC Limited | ABN 35 143 582 521
For
per
sona
l use
onl
y

9
12 6
13,051INTERCONNECTIONS
1,364CUSTOMERS
CLOUD ON‑RAMPS
DATA CENTRES
PUBLIC CLOUDS
HIGHLIGHTS
NEXTDC Limited and controlled entities | FY20 Annual Report 4
For
per
sona
l use
onl
y

248
100%
EMPLOYEES
1,364
640+PARTNERS
CARBON NEUTRAL CORPORATE OPERATIONS
NEXTDC Limited and controlled entities | FY20 Annual Report 5
For
per
sona
l use
onl
y

Craig ScroggieCEO
LETTER FROM THE CHAIRMAN AND CEO
Douglas FlynnChairman
On behalf of NEXTDC, we welcome our shareholders to this year’s Annual Report, which covers the 12-month financial reporting period ending 30 June 2020. This year’s financial report details a year of strong growth, including improved benchmarks for new sales, infrastructure development, revenue and EBITDA performance.
In May 2020, we celebrated our 10th anniversary since foundation, bringing closure to a decade in which NEXTDC has diligently focussed on our vision of building the nation’s leading data centre infrastructure platform for the digital age. Shortly after this, our sustained growth saw NEXTDC’s market capitalisation elevate the Company into the ASX 100 index. It has been an exciting journey watching the Company grow from a start-up, to becoming one of Australia’s 100 largest publicly listed companies by market capitalisation in just ten years.
Both milestones allowed us to reflect on our achievements, setting new industry standards for reliability, efficiency, sustainability, connectivity and security. Additionally, it pinpointed the start of the next decade, which promises further accelerated growth and innovation. Whilst the past ten years has seen us build a scalable and sustainable platform, it is the opportunities in the next ten years that excite us the most.
Acceleration of the 4th industrial revolution – the cyber physical ageDigital transformation continues to change the world in exciting and disruptive ways. Today, any individual with a smart phone has the sum of all human knowledge in the palm of their hands and the potential to collaborate with over 4.5 billion other people. Meanwhile, Government and enterprise organisations continue to invest to engage in an enormous online community and now rely on information technology, in some form or another, to manage many, if not most, operational processes involving communications, transactions, compliance, data, privacy and governance.
Industry analysts, IDC1 have estimated that the total volume of data in existence is doubling every 18 - 24 months and that rate of growth is accelerating as a range of technology megatrends including cloud computing, blockchain, the internet of things, mobile 5G, augmented reality and artificial intelligence continue to be applied in new and extended ways. This expected increase in demand for digital infrastructure is clearly represented in NEXTDC’s FY20 financial statements. Over the last 12 months, we experienced a record level of sales with contracted utilisation increasing by 17.4MW, a number which represents by far the single largest sales performance in the company’s ten year history, comprehensively beating the previous record (12.3MW) set in FY19.
Statistics define future growthIDC2 research from late 2019, continues to support our confidence for industry growth in data centre services.
1 https://www.emc.com/leadership/digital-universe/2014iview/executive-summary.htm2 https://www.idc.com/getdoc.jsp?containerId=prUS453407193 https://www.idc.com/getdoc.jsp?containerId=IDC_P332144 https://www.idc.com/getdoc.jsp?containerId=prAP454312195 https://www.idc.com/getdoc.jsp?containerId=US46640120
It forecasts3 that global investment in public cloud services and infrastructure will more than double over the period from 2019 to 2023. Public cloud spending is expected to grow from $229 billion in 2019 to nearly $500 billion in 2023. This represents a CAGR of 22.3%. The prediction for APAC is even stronger with a CAGR of 33.9%4 for the same services with the market almost tripling to reach $76.1 billion over the stated time period. IDC identified Australia as APAC’s second largest market with current spending of $3.9 billion annually on cloud infrastructure and services.
Power, Secure, ConnectServicing this digital acceleration with the world’s best practices is what NEXTDC excels at and that has been the source of the Company’s sustained growth over the last ten years. We provide the critical infrastructure that secures the data, powers the platforms and systems processing it and connects the people, organisations and communities that are dependent on this technology.
Global pandemic driving accelerated technology adoptionWhile cost efficiencies, productivity improvements and customer experience enhancements have been driving the adoption of these megatrends in recent years, a one-in-100-year health crisis during FY20 has served to steepen the growth curve and accentuate the role of digital infrastructure as an essential service.
The extraordinary events that have unfolded globally as a result of the COVID-19 pandemic introduced new barriers to traditional business models including social distancing, closed borders, grounded flights and supply chain disruptions. In a matter of weeks, the global economy was forced to re-think how people live and work, how organisations interact, collaborate, and sell with businesses immediately turning their focus to their infrastructure platforms to support new ways of working. These macro impacts on all industries have in turn driven exponential increases in data usage and therefore increased the dependence organisations and individuals have on digital infrastructure. IDC forecasted5 in June 2020 that COVID-19 has pushed the digital transformation initiatives for many organisations ahead by two to three years as a digital response to the crisis.
New ways of doing businessThis global pandemic has generated new standard operating procedures for many organisations and these are often activities that rely on digital platforms and connected ecosystems to function. This pivotal moment in history is now also sparking a new round of innovation that leverages digital solutions to meet present challenges and in readiness for future unexpected change. The flexibility, agility, and resilience that is inherent in cloud platforms, colocation facilities and connected
NEXTDC Limited and controlled entities | FY20 Annual Report 6
For
per
sona
l use
onl
y

ecosystems have been critical to enabling organisations to respond quickly, keep their teams connected, enact business continuity plans and set a course for the less predictable future.
Video collaboration providers are a leading example of user growth and platform adoption instigated by widespread mandated social distancing. In March Microsoft6 said it had seen a 110% increase in daily users since November. In April Microsoft reported that daily users had jumped a further 70%, increasing to more than 75 million daily active users. During the same time, we saw massive online demand from retailers as they ramped up online stores to meet increased demand from customers needing to shop from home.
The new transformed workplaceNew trends such as working from home, remote teaching and learning, online shopping, virtual events, entertainment on-demand, video meetings, and contactless sales and customer engagement processes are further driving demand for digital infrastructure services. Data centres such as those built and operated by NEXTDC, and the connected ecosystems they house, are critical to enabling these new essential services to maintain some degree of normality in a time of great upheaval.
Similarly, large numbers of individuals have a new requirement to access Government services or stay in contact with loved ones through social media tools and platforms. As a result, we have seen significant growth of new and upgraded connectivity services and revenues in Q3 and Q4 of FY20, as organisations pivoted to online systems and rapidly deployed new virtual capacity. There was also an accelerated deployment of secondary systems as organisations bolstered redundancy, back-up and disaster recovery planning as new realities heightened the need for 100% availability of their critical systems.
Increased demand for remote, technical expertiseNew social distancing and stay-at-home mandates during the COVID-19 crisis placed added emphasis on our professional services. Our highly skilled technical services teams are 100% focussed on delivering outstanding service to our customers when onsite assistance is required. As a direct result of the pandemic, during Q3 and Q4 of FY20, we saw a noticeable uptick in demand for our connectivity and remote support services. In a landscape where social distancing and restricted physical access is paramount to the safety, health and wellbeing of everyone and with many customers looking to provision new and upgraded connectivity, our teams stepped in where required, to manage the hands-on tasks that were often previously undertaken directly by customers. The agility of our service delivery teams in this area has been very well received by customers. We expect there will be a flow-on effect when the situation stabilises. This will see this revenue stream continue to grow, based on the efficiency and convenience it introduces to organisations which would otherwise have required frequent visits to our data centre facilities.
Renewed focus on safety and wellbeingAt NEXTDC, safety is everyone’s responsibility and developing a safety-first culture is an ongoing key business priority.
NEXTDC’s commitment to providing and maintaining a safe and healthy work environment has faced some unique challenges in FY20 and during the COVID-19 pandemic, resulting in our establishment of new processes and protocols across the business to protect our customers, suppliers and teams. We continue to commit the resources necessary to maintain a
6 https://www.theverge.com/2020/4/29/21241972/microsoft-teams-75-million-daily-active-users-stats7 https://www.gartner.com/en/newsroom/press-releases/2018-12-04-gartner-identifies-the-top-10-trends-impacting-infras#:~:text=Winser.,-Death%20
of%20the&text=Gartner%20predicts%20that%20by%202025,down%20their%20traditional%20data%20center8 https://www.globenewswire.com/news-release/2019/11/05/1941389/0/en/The-global-hybrid-cloud-market-was-valued-at-USD-40-62-billion-in-2017-and-
is-expected-to-reach-a-value-of-USD-138-63-billion-by-2023-at-a-CAGR-of-22-70-during-the-forecast-period-.html#:~:text=Filings%20Media%20Partners-,The%20global%20hybrid%20cloud%20market%20was%20valued%20at%20USD%2040.62,during%20the%20forecast%20period%20(2018
9 https://www.globenewswire.com/news-release/2019/11/05/1941389/0/en/The-global-hybrid-cloud-market-was-valued-at-USD-40-62-billion-in-2017-and-is-expected-to-reach-a-value-of-USD-138-63-billion-by-2023-at-a-CAGR-of-22-70-during-the-forecast-period-.html#:~:text=Filings%20Media%20Partners-,The%20global%20hybrid%20cloud%20market%20was%20valued%20at%20USD%2040.62,during%20the%20forecast%20period%20(2018
10 https://www.gartner.com/en/newsroom/press-releases/2020-04-03-gartner-cfo-survey-reveals-74-percent-of-orgs-to-shift-some-employees-to-remote-work-permanently
safe working environment, and ensure the ongoing operation of the business and health of our team.
In addition to our COVID response, we have implemented strategies to renew and enhance our workplace safety management across both our operational and capital works portfolios. We continuously review and improve our systems and work closely with our stakeholders, including customers and suppliers, to align ourselves with industry best practice, and achieve our ultimate goal of zero injuries.
A central role for data centres in present and future transformationEven before COVID-19, leading research and advisory firm, Gartner7, was predicting that 80% of all organisations will shift their workloads to colocation and cloud-based computing models by 2025, with the global market for Hybrid Cloud8 expected to reach a value of $138.6 billion by 2023. It is now expected that these predictions will be conservative as the present situation continues to evolve and digital innovation accelerates. With a more distributed workforce, organisations are seeking to bring their critical infrastructure within closer proximity to the clouds and other services that are enabling their digital transformations.
New challenges driving Hybrid and Multi-Cloud adoptionPost COVID-19 research from Global Workplace Analytics9 showed that as many as 77% of knowledge workers want to continue working from home at least some of the time while 74% of organisations surveyed by Gartner10 in April 2020 were planning for some workers to be permanently remote. Hybrid computing and extended connectivity solutions are key to supporting working from home initiatives. Increasingly, customers are looking to connect to multiple clouds for disparate workloads based on which platform is the best and most cost effective for the task at hand. Our flexible national AXON platform – which connects to all of them – is making that choice possible, convenient, and affordable. This accelerating Hybrid and Multi-Cloud adoption continues to be the primary driver of demand as enterprises transition from their inefficient, legacy office-based data centres and migrate to the security, scalability and network flexibility offered by colocation data centres such as those operated by NEXTDC.
Where the cloud lives™NEXTDC is where the cloud lives. Hybrid and Multi-Cloud strategies create a new world of possibilities, helping customers harness the digital age by bringing on-premise data centre infrastructure and public and private cloud platforms together within our ecosystem, and seamlessly connecting them. Combining legacy infrastructure with on-demand, pay-per-use computing facilitates reduces costs and provides flexibility to rapidly scale up and down in response to internal or external change. By accessing fit-for-purpose technology when and how it suits them, organisations can focus on technology strategies that increasingly reflect the dynamic and fluid nature of the ever-changing global landscape we are experiencing today. By supporting the complex security, data sovereignty, and privacy imperatives that all play a role in helping organisations decide where their information will live, they can retain focus on their unique vision and purpose.
Hyperscale data centres connecting a Multi-Cloud universeOur strategic partnerships with the world’s leading technology companies such as AWS (Amazon Web Services), Microsoft,
NEXTDC Limited and controlled entities | FY20 Annual Report 7
For
per
sona
l use
onl
y

Google, IBM, Oracle and Alibaba continue to grow. When combined with our extensive Cloud Centre partner ecosystem of over 640 of Australia’s ICT services providers, this ubiquitous cloud connectivity allows us to offer our customers the widest range of choice for the delivery of their Multi-Cloud enterprise architectures. Recent analysis from Modor Intelligence11 estimated that the global Data Centre Interconnect market is expected to grow by 14% during the 2020 - 2025 forecast period, while nominating connectivity to cloud and growing demand for content-based delivery as the driver behind this growth.
NEXTDC houses Australia’s richest cloud ecosystem and offers a comprehensive portfolio of rapidly deployed, scalable connectivity services across our facilities, metro networks, national fabric and into diverse international digital environments. We are already seeing customer demand for connectivity growing rapidly, a trend that will only continue as organisations proactively address their security, business continuity and customer experience challenges through resilient, flexible intelligent networks.
Enterprise customer growthSuccess in attracting hyperscale customers to NEXTDC is a critical component to continued growth in our enterprise customer base. As public cloud providers build their expanded availability zones within our facilities, this has a roll-on effect on attracting enterprise customers who are looking to take advantage of the resilience, connectivity costs and performance advantages of placing their critical physical infrastructure within close proximity to the cloud platforms that are enabling their digital transformation.
This phenomenon shows in the FY20 performance within the NEXTDC sales organisation. Crucial to the growth performance during FY20, we attracted 180 new enterprise customers across the data centre footprint. Especially pleasing is the fact that our new customers are coming from a large diversity of industry verticals including Government, financial services and insurance, resources, health, media and entertainment, professional services and retail. Going forward, as an organisation we will be investing significantly in growing this focus on direct customer relationships by verticals, side-by-side with our focus on hyperscale and technology services partnerships.
Innovation, engineering, and design complianceIn FY20, NEXTDC continued to be recognised for its global leadership in engineering and design that delivers industry leading customer experience, energy efficiency and safety outcomes. NEXTDC’s B2 and M2 data centres were the first and remain the only facilities in Australia to receive Uptime Institute (UI) Tier IV certification of Constructed Facility.
Our newest second generation facilities have already achieved UI Tier IV Design certification and are now completing the official UI Tier IV certification process for the built environment. With S2 having achieved final completion in support of unprecedented demand soon after the end of FY20, and P2 opening to the public in July, our second-generation expansion is well underway, and we now look to S3, NEXTDC’s first third-generation facility.
Raising the bar through operational excellenceOur focus on supporting our customers through operational excellence continued in FY20, ensuring NEXTDC’s facilities retain their position as the safest, most resilient and energy efficient data centres in the Australian market. The Uptime Institute’s (UI) Gold Operational Sustainability standard, which S1, P1, B2 and M2 have achieved, recognises the multiple organisational, supply chain and human factors that must be actively managed in order to deliver a 100% uptime guarantee.
Our data centres are the only colocation facilities in the Southern Hemisphere to achieve this level of independently
11 https://www.mordorintelligence.com/industry-reports/data-center-interconnect-market12 https://www.nextdc.com/news/nextdc-earns-acclaim-frost-sullivan-its-technology-and-customer-focus-data-centre-industry13 https://www.nextdc.com/news/frost-sullivan-recognises-nextdc-leader-australian-data-centre-market
certified operational excellence, and NEXTDC intends to add its newest facilities to this list in due course. It is well worth keeping in mind that success in the data centre arena goes well beyond designing and building to the industry’s highest standard but maintaining and operating them also.
International validation of NEXTDC qualityNEXTDC continues to accumulate international endorsement of its continued pursuit of excellence in the data centre industry. During Q2 FY20, leading global industry analyst Frost & Sullivan12 announced that NEXTDC was the winner of its 2019 Global Visionary Innovation Leadership award and recognised as their Global Company of the Year. Judged against some of the biggest data centre services providers in the world, this award demonstrated that our business, facilities and operations out-perform the competition when measured against a range of criteria including vision, growth, innovation, culture, sustainability and technical sophistication.
On a local level, the 2020 Frost Radar13 report released in May 2020 recognised NEXTDC as the market leader in the Australian data centre industry based on its established growth and innovation metrics, and commitment to delivering customer value. Frost & Sullivan commended NEXTDC on its commitment to innovation and sustainable operations as well as continued research, development investments, and its effective strategic partnerships.
Energy efficiency and sustainability leadershipNEXTDC maintains its commitment to delivering the highest levels of energy efficiency driven by innovative design, engineering, and operational excellence. Offering customers Australia’s most environmentally friendly, sustainably managed data centres is a core objective. Our M1 and S1 data centres have become the first in Australia to achieve a National Australian Built Environment Rating System (NABERS) 5-Star rating for energy efficiency. Achieving this unparalleled benchmark demonstrates our global leadership in energy efficiency and sustainability. NEXTDC is proud to own and operate its own solar array on the roof of its M1 data centre and has also been a Principal Partner to the Melbourne Renewable Energy Project (MREP) since its inception in 2014.
Real-time facility tuning for optimal efficiencyOur award-winning facilities management, central operations and engineering teams collaborate closely to continually improve the efficiency of the facilities. Together they have implemented an in-house-developed operational framework that optimises performance through a real-time tuning Regimen that adjusts cooling plant settings such as fan speeds, water pressure and approach temperatures to align computing load with prevailing external weather conditions. This critical body of work has continued to improve our industry leading power efficiency which in turn reduces the power costs and carbon footprint of IT for our customers.
Building the platform for the digital economyIn the past 12 months, NEXTDC once again set new benchmarks with a capital development program that exceeded FY19’s record levels. Continuing to build geo-diversity around cloud availability is an important component of our vision and purpose to design, engineer and operate the critical digital infrastructure that will support our customers’ needs to digitally transform their operations and thrive in the information economy.
Continually extending the availability and geo-diversity of our world class infrastructure and supporting our customers’ growth requirements in existing and new availability zones are key drivers behind the decisions we make on where to invest the Company’s capital.
NEXTDC Limited and controlled entities | FY20 Annual Report 8
For
per
sona
l use
onl
y

Facilitating hyperscale growth in VictoriaAnticipated hyperscale growth in Victoria has materialised during FY20 with large orders necessitating a tripling of capacity at the M2 site and representing the decentralisation of cloud availability from Sydney, some three years ago when we began development of the M2 site in Melbourne’s north. The first of six new data halls built with unprecedented flexibility for customised internal design and capacity optimisation, delivered through design and engineering innovation, is scheduled to be handed over to customers during FY21 and into FY22.
Supporting continued demand growth in Sydney
During FY20, growth in demand from customers in NSW saw the Company reach contracted utilisation of 36MW in this region, with additional customer demand forecast in the near term. This growth saw us reach a significant capacity milestone, setting plans in motion for the construction of our first third-generation data centre, S3 Sydney, which will enhance our support of in-region growth and the digitalised infrastructure requirements of organisations locally.
S2 30MW multi-storey hyperscale development
During FY19 we welcomed early access customers into our S2 Sydney data centre. Throughout FY20 we continued to deliver further capacity for multiple customers. S2 is a ground-breaking development in the context of the data centre industry in Australia, delivering 30MW of critical capacity and interconnectivity to the local market. Utilising new design innovations and technical excellence benchmarks in a multi-storey development, demand for space in S2 remains strong. Contracted utilisation is outstripping expectations and increased to more than 20MW at the end of FY20, with a strong pipeline of opportunity in FY21 to support the growing digital infrastructure requirements of customers in the near-term. This represents a significant opportunity for NEXTDC to further extend its lead in the data centre industry as we move into our third-generation developments and beyond.
Delivering digital growth opportunities to WA
Just after FY20 year end, our second-generation facility in Perth, P2 was formally opened and represents a significant new technology platform in the city’s CBD which is set to accelerate economic development in the region. Largely built during the reporting period, completing P2 Perth represented one of the two major capital investments NEXTDC made during FY20 along with S2 Sydney. P2 has a planned capacity of 20MW and will provide inventory to service digital growth in this region for years to come.
P2 has been UI Tier IV certified for Design with Construction certification underway. Its connection by subsea cable to Sydney and Singapore ensures that it provides an unprecedented opportunity for local, national, and global enterprises to expand their digital footprint in this region. Directly connected to P1, it opened with immediate access to Western Australia’s most connected ecosystem of partners, ICT service providers and cloud platform on-ramps. By providing geographic diversity from P1, the new facility delivers unprecedented opportunity for customers to strengthen their availability and business continuity risk profiles through new opportunities to address redundancy, back-up, and disaster recovery within region. It is also creating increased two-way opportunities for organisations to trade, partner and compete in and out of the global digital economy.
Capital raising to fund future growth
Land for S3 was purchased in FY19 with design completed, building approval received and initial earthworks beginning during FY20. Located at Gore Hill, 10km from the Sydney CBD, S3 will be NEXTDC’s largest development to date, targeting a total IT capacity of 80MW, which will deliver significant capacity to hyperscale, enterprise and government customers for years to come.
In order to ensure the Company had adequate funds to continue to deliver sufficient inventory to meet customer demand, NEXTDC undertook an $862 million capital raising in Q4 of FY20 through an institutional placement as well as a Share Purchase Plan for retail investors. As a result of this capital raising, Phase 1 of S3 is fully funded and is expected to come online during 2H FY22.
Network connectivity development
Driven by organic growth as well as organisations responding to new pandemic-induced business continuity challenges around resilience planning, remote working, and online transactions, NEXTDC’s Data Centre Interconnect (DCI) and AXON connectivity services once again experienced strong growth during FY20. Our connectivity services enable customers and partners to connect to and leverage the national NEXTDC ecosystem of cloud and other service providers quickly and easily from anywhere on our national platform.
NEXTDC supports Australia’s largest number of direct connection capabilities to the world’s leading cloud platforms including the only direct access to both Microsoft and Amazon Web Services from the Perth market. In addition to increased demand for direct cloud connectivity from within our facilities, during 2H FY20, many customers bolstered their redundancy, back-up, and disaster recovery planning as dependence on technology grew. By leveraging our metro-based DCI services to connect primary and secondary points of presence our customers gain further assurance there is no single point of failure in their search for 100% availability of their critical systems.
Planning for the next decade of infrastructure developments
In FY20 we continued to review emerging market opportunities in both Singapore and Japan and the Company continues to assess future possible expansion opportunities. We have established offices in each location and see exciting opportunities to leverage the acknowledged excellence and the success the Company has had in Australia into the fastest growing economic region in the world, Asia. Like all activities we undertake, we view these opportunities as generational in nature and remind ourselves that people frequently overestimate what they can achieve in one year and underestimate what can be built in a decade. Our exciting journey and many valuable lessons learnt over the past ten years is an important reminder of that.
This is only the beginning
Over the next few years, we will witness some of the most significant technology advances in our history. With individuals, businesses and Governments adopting technology built on technology, there will be an exponential rate of change, paving the way to a dynamically advanced future that, in some cases, is challenging to predict. The need for organisations to continue adapting to change through technology innovation has only accelerated in response to the one-in-100-year global health crisis that has emerged in 2020. As the world adapts to new norms of social distance and online engagement, one thing we are confident about is the ongoing role NEXTDC will play as the leading infrastructure platform for the digital economy – powering, securing and connecting the world’s most valuable resource – data.
On behalf of NEXTDC, we thank you for your ongoing support as we continue our exciting growth trajectory and look forward to sharing more about the success, recent developments and future strategic direction of the Company at our upcoming Annual General Meeting (AGM).
Craig ScroggieCEO
Douglas FlynnChairman
NEXTDC Limited and controlled entities | FY20 Annual Report 9
For
per
sona
l use
onl
y

ABOUT NEXTDC
VISION AND PURPOSE
NEXTDC’s vision is to help enterprises harness the digital age, improving our society through the advancement of technology.
NEXTDC’s purpose is to be the leading customer-centric data centre services company, delivering solutions that power, secure and connect enterprise.
NEXTDC value proposition and business strategyNEXTDC is an ASX 100-listed technology company enabling business transformation though customer-focussed, innovative data centre outsourcing solutions, connectivity services and infrastructure management software.
As Asia’s most advanced Data Centre as-a-Service (DCaaS) provider with a nationwide network of Tier III and Tier IV facilities, we deliver enterprise-class colocation services to local and international organisations. With a focus on safety, resilience, sustainability and carbon neutrality, we are building the infrastructure platform for the digital economy by delivering industry leading performance in the three critical components of data centre excellence: Power, Security and Connectivity.
NEXTDC is Australia’s most environmentally advanced and certified data centre provider, leading the industry with award-winning engineering solutions, and best-in-class operations. We are the only data centre centre provider to receive Climate Active certification (formally National Carbon Offset Standard), the only Australian Government endorsed carbon neutral certification. NEXTDC is the only data centre provider to achieve NABERS 5-Star certification, an independently certified and assessed rating for energy efficiency. This allows us to deliver customers the lowest total cost of operations in Australia.
NEXTDC is extending its leadership in data centre services through our advanced Data Centre Infrastructure Management (DCIM) software platform, ONEDC.
NEXTDC is where the cloud lives. Our Cloud Centre partner marketplace comprises the country’s largest independent ecosystem of carriers, cloud service and ICT service providers, enabling our customers to source and connect with the critical services they need to build integrated Hybrid Cloud deployments and accelerate their digital transformations.
NEXTDC’s carrier and vendor neutrality is the foundation of the Company’s channel-preferred sales model – delivering flexibility and scale to partners and end-customers with best-of-breed data centre services.
Uniquely for Australia, NEXTDC’s nationwide data centre footprint allows customers and partners to access nationally standardised services and benefit from unified management to ensure the quality, consistency and reliability of IT services and ensure the sovereignty of their data.
NEXTDC is a technology pioneer, connecting Australia to the world’s leading networks and cloud platforms and integrating the next generation of IT services, to enable its customers to take advantage of the extraordinary opportunities introduced by a digitally interconnected world.
Safety FirstAt NEXTDC, safety is everybody’s responsibility. NEXTDC recognises that the health and safety of its customers, suppliers and staff are of the highest priority. NEXTDC fosters a safety-first culture with hazard identification, incident prevention and the active management of all WHS issues being cultural cornerstones of the organisation and key to its success.
NEXTDC is 100% committed to our goal of achieving zero injuries across the business and we continue to commit the resources necessary in order to achieve this goal. NEXTDC continues to promote a safety-first culture which encourages team members to speak up and report any hazards or incidents, all of which are then actively managed.
NEXTDC continues to implement and refine strategies to improve our workplace safety management processes across both our operational and capital works portfolios. We work closely and share safety learnings with our stakeholders, including customers and suppliers, to align with industry best practice and to seek to eliminate conditions which may pose a risk to anyone who works in or visits a NEXTDC data centre.
NEXTDC Limited and controlled entities | FY20 Annual Report 10
For
per
sona
l use
onl
y

NEXTDC’s business features
Carrier and vendor neutralityNEXTDC maintains true neutrality in the marketplace and adopts a partner-preferred go-to-market strategy. By not offering IT managed services and not competing with the ICT channel unless customers mandate it, more organisations are encouraged to join NEXTDC’s nationwide Cloud Centre community and leverage the diverse onsite connectivity options available to develop ‘best-of-breed’ integrated solutions for their customers. As customer demands grow, building a platform that is available to every potential partner and customer, irrespective of which other partners they choose, is critical to creating a flexible, preferred offering for every cloud computing provider, commercial enterprise and Government agency.
Simplified national data centre serviceA key competitive advantage for NEXTDC is the Company’s nationwide data centre footprint located across five of Australia’s largest capital cities: Sydney, Melbourne, Brisbane, Canberra, and Perth. This allows organisations to engage a single, nationwide data centre partner under one contract, offering consistent pricing, service level agreements and an industry leading 100% uptime guarantee to ensure one consistent and seamless customer experience, regardless of location. In addition to reducing the administrative burden on customers, NEXTDC works closely with each customer to enable them to expand and scale seamlessly to manage their data centre service effectively and efficiently.
World-class facilities and globally recognised expertiseNEXTDC’s expert in-house Engineering team adds significant value through meticulous operational cadence and intimate customer engagement on all non-standard design requirements. The same award-winning engineers who design and build our facilities to the industry’s highest standards, work collaboratively with NEXTDC customers to help them create customised solutions that meet their specific needs. NEXTDC offers market-leading levels of reliability and availability including a 100% uptime guarantee. This level of assurance and low risk strategy is critical to businesses adopting cloud services, which is teamed with globally recognised best practises around energy efficiency, helping to lower energy costs and our carbon footprint.
Security and compliance for risk managementThe Australian Privacy Act and other Government-initiated regulations and recommendations for the protection of sensitive information places comprehensive compliance obligations on Government agencies and enterprise. This often restricts data service users from utilising offshore data storage, leading many organisations to increase control over access to their data by having it hosted in the same legal jurisdiction as their base of operations. As an Australian-owned company, NEXTDC can ensure its role in protecting the data sovereignty of information and infrastructure complies with all Federal Government Security standards.
Every NEXTDC data centre is rigorously secured and protected by strict security systems and multi-layered authentication protocols that protect against unauthorised access. This is achieved without impeding the convenience of those who do have the right of entry. NEXTDC also rigorously adheres to globally recognised best practice standards in the increasingly important area of data security and facilities management. It is critical for us to maintain the efficiency and effectiveness of security and access to our facilities so that we comply with all regulations at the same time as optimising the customer experience. The security excellence we offer is independently verified by ISO 27001:2013 Information Security Management System (ISMS) certification.
CONTINUING TO SUPPORT CHANNEL PARTNERS
Our channel-preferred strategy has resulted in NEXTDC successfully engaging a diverse range of value-adding partners from all over Australia and the world. At the end of FY20, the Company had a total of more than 640 partner organisations including a broad range of local and international cloud platforms, as-a-Service providers, independent software vendors, telecommunications carriers and other connectivity partners.
We continue to up-skill and resource partners to introduce their customers to our facilities, as well as create leads and opportunities generated by our marketing activities. As the business continues to scale, we continue to focus the sales organisation toward the greatest growth opportunities for the business.
NEXTDC’s partner ecosystem includes, but is not limited to:
Global public cloud providers:AWS, Microsoft, Google, IBM, Oracle, and Alibaba
Large IT services providers:NTT Group, Atos, DXC, NEC, IBM, Thomas Duryea Logicalis, Data#3, Interactive, Infosys, Wipro
Telecommunications providers:Optus, Telstra, Vocus, TPG, AT&T, PCCW, Superloop and CenturyLink
Specialist cloud and managed service providers:Iron Mountain, Netskope, Nexthop, Over the Wire, Blue Connections, ZettaNet, Brennan IT, Cloud Plus and Somerville Group
NEXTDC Limited and controlled entities | FY20 Annual Report 11
For
per
sona
l use
onl
y

Hubs for connectivityNEXTDC’s Cloud Centre community is the largest independent network of IT service providers, carriers and cloud providers in Australia. By colocating with a neutral provider like NEXTDC, customers have the flexibility to source and connect to a myriad of expertise and ICT services. Complementing the direct physical connections offered within NEXTDC facilities, our agile AXON virtual interconnectivity platform enables customers to very quickly activate scalable and private connections at incredibly high speeds to any number of clouds and ICT services on-demand, including the Federal Government ICON network. AXON also offers customers direct inter-capital connectivity services between all major capital cities in Australia.
Products and servicesNEXTDC is dedicated to providing world-class data centre services and solutions that are scalable, flexible and accessible. NEXTDC’s product strategy has been designed to ensure we deliver solutions that optimise power efficiency, offer maximum security and enable direct, high performance cloud connectivity for organisations of all sizes, while delivering unprecedented levels of reliability, cost efficiency and agility.
Data Centre-as-a-Service solutionsNEXTDC’s hyperscale colocation services consist of secure, high-density data centre outsourcing solutions. We deliver the highest possible levels of resilience and reliability, and
world-class technical services designed to support our customers on the ground. Customers host their own IT infrastructure within one or many NEXTDC data centres, leveraging our facilities and resources as an extension of their own business. Our DCaaS model has been designed to offer scalability and flexibility throughout the entire infrastructure lifecycle, with data centre solutions ranging from quarter racks to multiple contiguous racks to large custom caged areas for customers to design and custom fit their space to suit their own specific requirements.
Universal connectivity solutionsCustomers and partners residing anywhere within NEXTDC’s national data centre ecosystem have access to Australia’s largest network of physical and virtual connectivity options with the highest levels of flexibility, security, and resilience. Our highly connected data centres are home to 12 direct on-ramps to the world’s largest cloud platforms, as well as all the major carriers and the biggest cloud solutions providers in this country. Connectivity is the glue that binds the digital economy. No digital transformation strategy is complete without paying close attention to how you are going to connect to your teams, suppliers, partners, and customers. Being able to provide easy access to carriers, Multi-Clouds, and value-adding service providers from within a data centre ecosystem offering a 100% uptime guarantee is a proven roadmap to improved risk management, cost efficiency, network performance and productivity for customers.
CENTRALISED DATA CENTRE ASSET MANAGEMENT
Our ONEDC customer portal is a cloud-based DCIM-as-a-Service platform that provides our partners and customers with a comprehensive, centralised view of all their NEXTDC data centre footprint. Developed in-house, ONEDC aggregates all the tools our customers require to efficiently manage their infrastructure and the services needed at any NEXTDC facility. Service requests, such as booking a car park, a tour, securing meeting room access or technical support, as well as authorising access, unlocking and locking racks and comprehensive reporting capability – including real-time temperature and humiditymonitoring – are all consolidated and viewed through asingle pane of glass.
This innovative platform is continually being improved based on customer feedback around extended functionality they need to better manage their critical infrastructure. Not only does it enhance customer experience, but it also dramatically improves administrative efficiency through self-service features and the automation of manual processes.
During FY20, our in-house ONEDC development team extended reporting capabilities and introduced an improved self-service ticketing capability for customers as well as optimising and integrating multiple back-end systems that power the platform.
NEXTDC Limited and controlled entities | FY20 Annual Report 12
For
per
sona
l use
onl
y

NEXTDC Limited and controlled entities | FY20 Annual Report 13
For
per
sona
l use
onl
y

Cloud Centre ecosystemOur Cloud Centre ecosystem comprises more than 640 partners that fuel the growth of Australia’s digital economy. These partners leverage NEXTDC data centres to house their IT infrastructure and host their own services, thereby enabling their customers to connect directly to them from within the facility. Every partner and customer has the ability to make connections within a data centre through our physical Cross Connect services and virtual connections to clouds, carriers, and suppliers in any data centre on the AXON network.
Furthermore, the new Indigo and Vocus ASC submarine cables connect the East Coast of Australia to Perth and then onto Singapore from our P2 data centre where the cables make landfall via our AXON interconnectivity platform. This ensures that the entire NEXTDC data centre footprint and ecosystem of clouds, carriers and service providers are directly connected to Asia and the world, further delivering on our vision to be the infrastructure platform that enables Australia’s digital economy to thrive.
Seamless data centre infrastructure managementFY20 has also been a year where we paid enormous attention to the continuous improvement of our systems and processes to generate significant operational efficiencies in our management of plant and equipment, customer interactions and our administrative functions. The results of this investment have collectively reduced costs, enhanced internal productivity, and created a better customer experience.
Intelligent Service ManagementUnder an enterprise-wide IT improvement project known as Intelligent Service Management (ISM), customers can now simply login to ONEDC for a real-time view of resources available, or to request a NEXTDC service. This major operational transformation program not only improves the efficiency of the process and cut down ticket provisioning and action times for customers, it allows our Customer Experience Team to be more focussed on offering proactive, high quality, targeted customer support.
There has also been significant attention paid to integrating ONEDC with our CRM and service desk platforms, to help us create a 360-degree view of our customers and all of their interactions with NEXTDC. This level of customer detail empowers our entire team to be data driven and support our customers in a more meaningful way, encouraging an enhanced customer experience across the organisation.
Professional servicesOur Remote Hands services consists of first-class technical assistance on-the-ground at any NEXTDC data centre. Remote Hands enables a flexible approach for customers in managing their critical infrastructure. Leveraging our technical capabilities allows them to get back to focusing on their core business. Our Remote Hands technicians are highly skilled and extensively certified individuals. They are responsible for the ongoing management of our world-class facilities and have been recognised globally by Uptime Institute and DataCenter Dynamics.
Remote Hands services support customers throughout their infrastructure lifecycle, starting with technical advisory, planning, project management and migration stages, right the way through to post migration day-to-day support such as managing deliveries and operational infrastructure support. Our data centre experts are part of the unique customer experience offered by NEXTDC and their abilities to support any challenges around taking full advantage of our premium data centre services adds significant value to the convenience of doing business with us. During the current pandemic, they have been a critical asset to our customers under mandated social distancing rules, providing the eyes and hands that are an important component of maintaining availability of critical digital infrastructure.
Energy efficiency and sustainability leadershipNEXTDC maintains its firm commitment to delivering the highest levels of energy efficiency and building a data centre footprint that is both operationally and sustainably superior to those of competitors. Our facilities have been designed and engineered to deliver extremely high levels of energy efficiency, in turn helping to lower the carbon footprint and total cost of operations
NEXTDC Limited and controlled entities | FY20 Annual Report 14
For
per
sona
l use
onl
y

for our customers. In FY19, NEXTDC’s M1 data centre became the first data centre facility in Australia to achieve a National Australian Built Environment Rating System (NABERS) 5-Star rating for energy efficiency. During FY20, our S1 facility became the second colocation data centre in Australia and the first in New South Wales to achieve a NABERS 5-Star rating.
Achieving this unparalleled benchmark further demonstrates our commitment to global leadership in energy efficiency and sustainability and setting a new industry benchmark for sustainable performance. We also fulfilled all ongoing compliance requirements for ISO 14001 certification for Environmental Management at B2, M1, S1, C1 and P1 with our second-generation facilities continuing to undergo the complex assessment processes required to also achieve ISO 14001 certification. Although certification processes are not as yet finalised, our B1 and M2 facilities are operated and maintained under the same environmental management processes and procedures to comply with the ISO 14001 requirements.
Renewable energyNEXTDC is proud to own and operate its own solar array on the roof of its M1 data centre and has also been a Principal Partner to the Melbourne Renewable Energy Project (MREP) since its inception in 2014. Financial close on this project was achieved during FY18, and the 80MW Crowlands Wind Farm in Victoria, which went live in January 2019. This was another first for a data centre operator in the Asia Pacific region.
A net zero emissions futureWe take every measure to ensure we minimise the use of carbon wherever possible. But where we can’t avoid it, we lean on our strategic relationship with Qantas, who we have partnered with for the procurement of carbon credits through the Qantas Future Planet (QFP) program. As a result of this strategic partnership we have been able to continue our focus on leadership through industry innovation and achieve yet another industry first by having the carbon emissions of our corporate operations audited and accredited under the Australian Climate Active program as being 100% carbon neutral. Our aim in the near future is to offer our customers the opportunity to similarly offset their emissions in our data centres, something that has also never been achieved in the Asia Pacific region.
NEXTDC Limited and controlled entities | FY20 Annual Report 15
For
per
sona
l use
onl
y

OUR PEOPLE AND CULTURE STRATEGIES
Living our corporate values
Our company values define the behaviour and skills that we expect from all employees. Every one of our team members ‘live’ the values every single day, striving to ensure all of our actions align with the behaviours which our values embody. If in doubt, we refer to our values to make the right decision. Our values mean each and every one of our team know what is expected of them and knows what NEXTDC stands for and is striving to achieve.
It means that we will recognise, reward, hire and promote based on their adherence to the six values, each of which is as important as the other.
NEXTDC Limited and controlled entities | FY20 Annual Report 16
For
per
sona
l use
onl
y

WE ARE AN ELITE TEAM WORKING TOGETHER
WITH SUPER STARS PLAYING IN EVERY POSITION.
ONE TEAM
WE ARE OBSESSED WITH DELIVERING THE WORLD’S BEST
CUSTOMER EXPERIENCE.
CUSTOMER FIRST
WE ARE RELENTLESS IN OUR PURSUIT OF EXCELLENCE,
NOT PERFECTION.
PURSUIT OF EXCELLENCE
THE BEST WAY TO PREDICT THE FUTURE IS TO CREATE IT.
BRIGHT IDEAS
WE SPEND OUR MONEY WHERE IT MAT TERS THE MOST.
FRUGAL NOT CHEAP
WE DON’T TALK BULL, WE HAVE CRUCIAL CONVERSATIONS, WE
DISAGREE AND THEN WE COMMIT.
STRAIGHT TALK
OUR CORPORATE
VALUES
Giving back to our local communitiesIn 2018 we launched our ‘Live to Give’ Corporate Social Responsibility (CSR) program and throughout FY20 we participated in a number of initiatives to help make a positive impact within the communities in which we live and work. The key areas of focus through our program see us channel our major efforts toward four core charities and giving programs, which were selected collectively amongst the wider NEXTDC team. ‘Live to Give’ encourages and empowers our teams and the Company to be socially conscious. It is our firm belief that companies can do more than just make money, they can give back to the community and use their success to improve our society. It’s a great honour to be able to commit to supporting our charity partners and to make a meaningful and positive impact on humanity.
NEXTDC’s ‘Live to Give’ program▪ Corporate partnership with The Smith Family, donating $50,000,
and $168,000 since starting of the program in FY19 as well aspromoting staff volunteering and mentoring programs
▪ Partnership with Pledge 1%, enabling staff to devote 1% oftheir time to give back
▪ Continued success of NEXTDC’s workplace giving program with$1:$1 donation matching for Cancer Council, Beyond Blue, TheSmith Family and UN Women; and
▪ Providing all staff with additional paid volunteer days, allowingteams and individuals to spend additional time with theirpreferred charity or in giving back to their local community.
Diversity and InclusionNEXTDC is committed to creating a diverse workplace. Approximately 33% of staff are female while our ethnic diversity is closely representative of the multicultural profile of Australia. This diversity continues to deliver fresh thinking to everything we do and when added to the other workplace benefits we offer in areas such as maternity leave, paternity leave, primary carer leave, our ‘Live to Give’ program and volunteer days, helps to build our status as a preferred Australian employer. We pride ourselves on having built a culture where people join the Company and build long-term successful careers that challenge them and empower them to grow and be the best version of themselves every day.
NEXTDC Limited and controlled entities | FY20 Annual Report 17
For
per
sona
l use
onl
y

Impact of market growth demonstrated by NEXTDC
30 June 2020 30 June 2019 30 June 2018 30 June 2017 30 June 2016
ECONOMIC INDICATORS
Customers1 1,364 1,184 972 772 647
Cross Connects2 13,051 10,972 8,671 6,342 4,575
CAPACITY AND UTILISATION
Operating facilities3 9 9 7 5 5
Installed capacity4 78.8MW 58.4MW 46.4MW 36.0MW 34.7MW
Contracted customer utilisation5 70.0MW 52.5MW 40.2MW 31.5MW 26.1MW
% of installed capacity 89% 90% 87% 88% 75%
Billing customer utilisation6 52.8MW 37.7MW 34.3MW 29.5MW 23.2MW
% of installed capacity 67% 65% 74% 82% 67%
1. Customers: the number of counterparties (including partners) which have executed a Master Services Agreement with NEXTDC. 2. Cross Connects: the number of both physical and elastic cross connections. 3. Operating Facilities: The number of facilities which were operational at the reporting date. 4. Installed Capacity: Includes the total power capability of the data centre space fitted out across all operating facilities. 5. Contracted Customer Utilisation: Total of all sold capacity in MW including customers with deferred contract commencement dates. 6. Billing Customer Utilisation: Total of all sold capacity in MW where the service has commenced.
NEXTDC Limited and controlled entities | FY20 Annual Report 18
For
per
sona
l use
onl
y

Directors’ Report
The Directors present their report on the consolidated entity (referred to hereafter as ‘NEXTDC’, the ‘Company’ or the ‘Group’) consisting of NEXTDC Limited and the entities it controlled at the end of, or during, the year ended 30 June 2020.
Directors The following persons were Directors of the Company during the year, and up to the date of this report:
Douglas Flynn Craig Scroggie Stuart Davis Dr Gregory J Clark AC Sharon Warburton (resigned 31 March 2020) Stephen Smith (appointed 1 July 2019) Jennifer Lambert (appointed 1 October 2019) Dr Eileen Doyle (appointed 26 August 2020)
Principal activities During the year, the principal continuing activities of the Group consisted of the development and operation of independent data centres in Australia.
COVID-19 response NEXTDC’s focus during the pandemic has been on ensuring the continuity of its business and health of its team and customers.
COVID-19 has delivered significant societal and business impacts, which has also impacted NEXTDC at an operational level. Besides implementing appropriate processes throughout all our facilities, including increased sanitisation, our interactions with customers, vendors and suppliers to NEXTDC have been standardised to ensure a consistent and appropriate approach on health practices when dealing with persons attending any NEXTDC facility. All staff, other than those involved in the day-to-day running and ongoing construction and development of NEXTDC’s data centres have been directed to work from home until further notice and provided with all necessary support to do so.
To date COVID-19 has not presented any significant financial impacts for NEXTDC – customer demand remains strong with material customer contract wins in the past six months, and the expectation that demand will continue as organisations accelerate their digital transformations in response to the crisis.
As the uncertainty surrounding COVID-19 continues, NEXTDC’s comprehensive COVID-19 plan will continue to evolve to remain cognisant of the ongoing health threat.
1 EBITDA is a non-statutory financial metric representing earnings before interest, tax, depreciation and amortisation. Non-statutory financial metrics have been extracted from the audited accounts
Operating and financial review During the year, the Company has:
Continued to expand the capacity of its second Sydney site, S2, increasing built capacity from 6MW at the end of FY19 to 22MW at the end of FY20
Progressed the construction of its second Perth site, P2, to the point of opening shortly following FY20 year end
Continued expansion works at its second Melbourne site, M2, with 15MW of new capacity being added
Commenced ground works for the new planned Uptime InstituteTier IV data centre at S3 Sydney
Acquired a site for M3 Melbourne, with works relating to design and planning approvals already commenced
Successfully raised $862 million via an institutional placement and Share Purchase Plan
Contracted 17.4MW of new capacity
Key financial highlights include:
Revenue of $205.2 million vs guidance range of $200 - 206 million (FY19: $179.3 million)
Underlying EBITDA1,2 of $104.6 million vs guidance range of $100 - 105 million (FY19: $85.1 million)
Capital expenditure of $418 million vs underlying guidance range of $340 - 380 million (FY19: $378 million)
Statutory net profit/(loss) after tax of $(45.2) million (FY19: $(9.8) million)
Operating cash flow of $53.9 million (FY19: $39.4 million)
Cash and cash equivalents of $893 million at 30 June 2020
Financial performance NEXTDC achieved a number of significant milestones and enjoyed a period of strong growth in the 12 months to 30 June 2020.
The Group continued to experience significant growth in number of customers, customer orders and data centre revenue. Data centre services revenue for the year increased from $169.7 million to $200.8 million. The increase was largely driven by increased utilisation of data centre services across the business. As at 30 June 2020, NEXTDC was billing for 52.8MW (2019: 37.7MW) of capacity.
2 Underlying EBITDA excludes $1.2 million of costs related to review works into potential data centre investments in Singapore and Japan and a gain on re-assessment of a lease under AASB 16 of $0.2m
NEXTDC Limited and controlled entities | FY20 Annual Report 19
For
per
sona
l use
onl
y
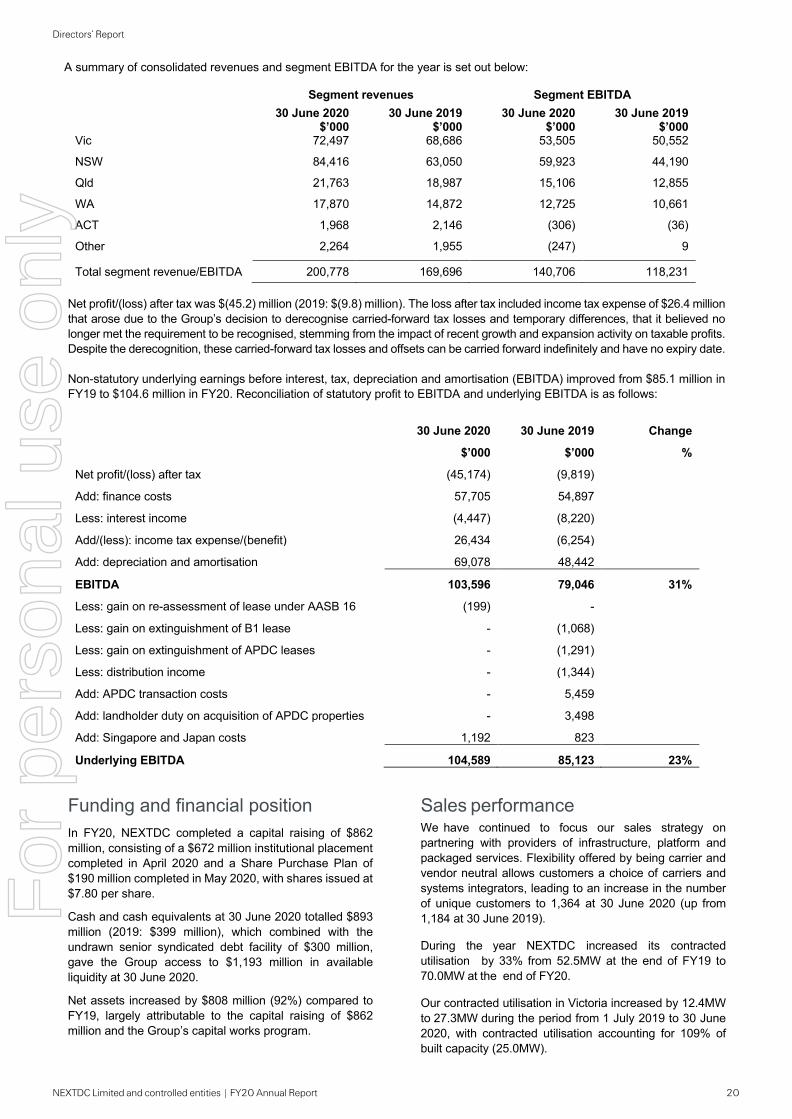
A summary of consolidated revenues and segment EBITDA for the year is set out below:
Segment revenues Segment EBITDA 30 June 2020
$’000 30 June 2019
$’000 30 June 2020
$’000 30 June 2019
$’000 Vic 72,497 68,686 53,505 50,552
NSW 84,416 63,050 59,923 44,190
Qld 21,763 18,987 15,106 12,855
WA 17,870 14,872 12,725 10,661
ACT 1,968 2,146 (306) (36)
Other 2,264 1,955 (247) 9
Total segment revenue/EBITDA 200,778 169,696 140,706 118,231 Net profit/(loss) after tax was $(45.2) million (2019: $(9.8) million). The loss after tax included income tax expense of $26.4 million that arose due to the Group’s decision to derecognise carried-forward tax losses and temporary differences, that it believed no longer met the requirement to be recognised, stemming from the impact of recent growth and expansion activity on taxable profits. Despite the derecognition, these carried-forward tax losses and offsets can be carried forward indefinitely and have no expiry date. Non-statutory underlying earnings before interest, tax, depreciation and amortisation (EBITDA) improved from $85.1 million in FY19 to $104.6 million in FY20. Reconciliation of statutory profit to EBITDA and underlying EBITDA is as follows:
30 June 2020
$’000
30 June 2019
$’000
Change
%
Net profit/(loss) after tax (45,174) (9,819)
Add: finance costs 57,705 54,897
Less: interest income (4,447) (8,220)
Add/(less): income tax expense/(benefit) 26,434 (6,254)
Add: depreciation and amortisation 69,078 48,442
EBITDA 103,596 79,046 31%
Less: gain on re-assessment of lease under AASB 16 (199) -
Less: gain on extinguishment of B1 lease - (1,068)
Less: gain on extinguishment of APDC leases - (1,291)
Less: distribution income - (1,344)
Add: APDC transaction costs - 5,459
Add: landholder duty on acquisition of APDC properties - 3,498
Add: Singapore and Japan costs 1,192 823
Underlying EBITDA 104,589 85,123 23%
Funding and financial position In FY20, NEXTDC completed a capital raising of $862 million, consisting of a $672 million institutional placement completed in April 2020 and a Share Purchase Plan of $190 million completed in May 2020, with shares issued at $7.80 per share.
Cash and cash equivalents at 30 June 2020 totalled $893 million (2019: $399 million), which combined with the undrawn senior syndicated debt facility of $300 million, gave the Group access to $1,193 million in available liquidity at 30 June 2020.
Net assets increased by $808 million (92%) compared to FY19, largely attributable to the capital raising of $862 million and the Group’s capital works program.
Sales performance We have continued to focus our sales strategy on partnering with providers of infrastructure, platform and packaged services. Flexibility offered by being carrier and vendor neutral allows customers a choice of carriers and systems integrators, leading to an increase in the number of unique customers to 1,364 at 30 June 2020 (up from 1,184 at 30 June 2019).
During the year NEXTDC increased its contracted utilisation by 33% from 52.5MW at the end of FY19 to 70.0MW at the end of FY20.
Our contracted utilisation in Victoria increased by 12.4MW to 27.3MW during the period from 1 July 2019 to 30 June 2020, with contracted utilisation accounting for 109% of built capacity (25.0MW).
Directors’ Report
NEXTDC Limited and controlled entities | FY20 Annual Report 20
For
per
sona
l use
onl
y

NSW’s contracted utilisation increased by 4.5MW during FY20 to 36.4MW as at 30 June 2020, with contracted utilisation accounting for 96% of built capacity (38MW).
In Queensland contracted utilisation grew 0.3MW during FY20 to 2.9MW as at 30 June 2020, with contracted utilisation accounting for 46% of built capacity (6.25MW).
WA’s contracted utilisation increased by 0.3MW to 3.0MW during the period from 1 July 2019 to 30 June 2020, with contracted utilisation accounting for 40% of built capacity (7.5MW).
ACT’s contracted utilisation was maintained at 18% (0.4MW) of built capacity (2.0MW).
We are earning revenue from numerous products including white space, rack ready services, project fees and add-on services. During FY20 interconnection generated 8.1% of total recurring revenue.
NEXTDC continues to develop its go-to-market strategy through channel partnerships with major telecommunications and IT service providers, allowing it to increase the breadth and depth of its selling capability without adding to its sales operating cost base.
Continuous innovation As an organisation in Australia’s rapidly growing IT infrastructure sector, it is essential that NEXTDC seek the continuous development and innovation of its systems, products and services.
All data centres have achieved and continue to be certified to ISO 27001 Information Security Management System, and ISO 9001 Quality Management System. These certifications confirm that NEXTDC has an integrated management system that provides a systematic approach to risk management, protection of company information and continuous improvement.
The Group has continued to develop its internal systems and processes in FY20 with the ongoing implementation of online platforms to automate and integrate the management of the customer lifecycle as part of the services we provide.
Ongoing customer demand has seen NEXTDC develop innovative ways to augment data centre capacity beyond the original designs, with the addition of higher power densities and the development of additional data halls. Even though power consumption is increasing as our facilities become more populated, their overall energy efficiency has improved over time through economies of scale and increased utilisation of existing infrastructure.
The continuous process of testing and tuning NEXTDC’s data centres to optimise energy efficiency and stability has seen a marked improvement in the facilities’ Power Usage Effectiveness (PUE). The average PUE throughout the year across all NEXTDC data centres is now 1.30, well below our target of 1.40 and the industry average of approximately 1.70.
The Group continues its strong focus on energy efficiency and sustainability. Our data centre facilities have been engineered to deliver extremely high energy efficiency, lowering the carbon footprint for our customers. Our M1 Melbourne and S1 Sydney data centres have become the first data centres in Australia to achieve a National Australian Built Environment Rating System (NABERS) 5-Star rating for energy efficiency.
NEXTDC owns and operates its own solar array on the roof of its M1 data centre and has also been a Principal Partner to the Melbourne Renewable Energy Project (MREP) since its inception in 2014.
Business strategies and prospects for future financial years The Group continues to develop its strong and growing pipeline of sales opportunities across each of its operating markets. Based on the number of positive utilisation trends such as cloud and mobile computing, growth in internet traffic and data sovereignty we expect that demand for carrier and vendor neutral outsourced data centre services will continue to grow strongly for the foreseeable future.
The Company has a number of strategies to benefit from this growth including but not limited to:
Expanding its presence in data centre markets whereits existing facilities are close to being fully utilised;
Continuing to sell uncontracted space and power inexisting facilities;
Opportunities for growth beyond the existing datacentre footprint; and
Launch of new products.Based on the factors listed above, the Group expects itsrevenue to continue growing in the foreseeable future.
Directors’ Report
NEXTDC Limited and controlled entities | FY20 Annual Report 21
For
per
sona
l use
onl
y

Business risks NEXTDC acknowledges that risk is inherent in all aspects of its business operations and being able to effectively recognise and manage these and the corresponding opportunities is critical for the success and growth of the Company. NEXTDC’s risk management framework is an integral component of its corporate governance and central to achieving its strategic and operational objectives. The rapid growth of the Company over the last few years has meant that the management of its risk profile has required corresponding refinement and development. To ensure that the Company manages evolving enterprise and emerging risks, an independent review exercise was carried out in early 2020 to articulate NEXTDC’s risk settings and appetite in the context of the current operating environment. The outcomes included a revised Risk Appetite Statement endorsed by the Board as well as the identification of key enterprise risks against which they were assessed. Further details on NEXTDC’s Risk Management Framework can be found in the Company’s most recent Corporate Governance Statement which can be located at the Company’s website www.nextdc.com).
NEXTDC has identified the following key business risks divided into seven risk pillars, which could adversely affect its financial performance:
Business Management and Governance Fraud, Bribery and Corruption: Fraud, bribery or any
other unethical behaviour could significantly impact the trust and confidence of its customers, shareholders and other stakeholders in NEXTDC. NEXTDC’s Statement of Delegated Authority has been approved by NEXTDC’s Board and embedded within its processes and procedures. All NEXTDC staff and Directors undergo Code of Conduct training and pursuant to the Company’s Whistleblower Policy, employees are encouraged to come forward and report if they see any unethical behaviour.
Training and Development: Operating and maintaining data centres requires highly trained employees and lack of sufficient training and development could result in safety and environmental incidents, poor efficiencies and low morale. Along with the broader company-wide training and development program, all data centre operations staff receive on the job training and refreshers as required.
Technology Advances: NEXTDC operates in a competitive sector. Any failure to keep up with the latest technology or not having the business systems that supports the scale and pace of business expansion could result in reputational damage and a downturn in customer demand. To mitigate this risk, the Company promotes mutual research and development projects and strategic alliances with its suppliers, regularly attends industry conferences and is a member of the Uptime Institute, an independent thought leader and certification body in IT and data centres. NEXTDC’s Business Transformation Program has been established to supports initiatives that ensures the business evolves to meet the ongoing needs of its customers.
Environment, Work Health, and Safety Work, Health and Safety: NEXTDC recognises health and
safety as its highest priority. Our values, the priorities set by our executives and our policies prioritise this issue and reflect that, at NEXTDC, safety is a key element of every engagement with suppliers, customers and in the development and operation of our data centres. Incident prevention is of utmost importance and vital to the safety of our customers, our suppliers, our team and ultimately, the success of the organisation. NEXTDC’s commitment to providing and maintaining a safe and healthy work environment has faced some unique challenges in FY20, with a focus on applying our safety-first approach to the challenges of the COVID-19 pandemic. In order to deal with this evolving threat, we have established new processes and protocols across the business. We continue to commit the resources necessary to maintain a safe working environment and ensure the ongoing operation of the business and health of our team. In addition to our COVID response, we have implemented strategies to enhance our workplace safety awareness. Safety is everyone’s responsibility in a safety-first culture. Active management of WHS issues both in the operation of data centres and in their development are mandated and central to creating a culture where it is safe to speak up and report any hazards or incidents. NEXTDC has also sought a process of continual review and improvement through its safety assurance programs with the team’s performance and safety initiatives reported to the Board. To further strengthen our safety leadership across the industries we participate in, NEXTDC has also implemented a Construction Safety Management System, which benchmarks our safety performance and activities during the construction of our new data facilities. This system has been rolled out across NEXTDC and is designed to monitor and verify its implementation and results. We continue to work closely and share safety learnings with our stakeholders, including customers and suppliers and to align ourselves with industry best practice. Our ultimate goal is zero injuries.
Energy Usage and Emissions: NEXTDC is dedicated to monitoring and devising the best methods of managing data centres, to ensure energy efficiency and minimise their impact on the environment and our natural resources. Due to the nature of our business, and as our customer loads within our data centres increase year on year, so will our energy usage and emissions. NEXTDC has invested significantly in improving energy efficiencies by focussing on its environmental objectives, operational efficiencies and best in class data centre designs. NEXTDC is committed to the process of achieving NABERS certified rating for our data centres, with each data centre having a target Power Usage Effectiveness (PUE) rating to be as energy efficient as possible.
Climate Change: NEXTDC is committed to contributing to the global effort on climate change and supports the shift towards a low carbon economy in line with the Paris Agreement. This is evident in our initiatives on carbon neutrality and embedding climate change risk management across our business processes. All NEXTDC’s facilities are designed and constructed with sufficient redundancy to ensure our customers’ Service Level Agreements (SLA) for power, temperature and humidity are met, even if there is an energy outage or heatwave. Fuel levels at each data centre are continually monitored and replenished to ensure
Directors’ Report
NEXTDC Limited and controlled entities | FY20 Annual Report 22
For
per
sona
l use
onl
y

the generators can continue to operate for up to 48 hours without utility grid power. Emergency fuel supply contracts are in place with major suppliers to cover the unlikely event of any interruptions extending beyond that capacity. NEXTDC’s Uptime Institute (UI) certification journey for our facilities is another reflection of the exceptional fault tolerance of our data centres and their resilience to the impacts of climate change factors such as heatwaves, bushfires and floods.
Maintain 100% Uptime Guarantee Unable to Provide Service: A catastrophic failure or
equipment malfunction at a NEXTDC data centre could result in the Company not being able to provide power and cooling to support our customers’ equipment, thus breaching our service level agreements and incurring contractual liabilities. To address this risk, all of NEXTDC’s data centres are designed and built with sufficient redundancy in place (including redundant paths for power and cooling) to enable components to go off-line and be repaired or maintained without affecting our customers’ IT equipment. A sound assurance and maintenance program, periodic recovery testings, in-house design expertise and third-party peer review and certification are among the many controls in place to manage the risks of not being able to meet our 100% uptime guarantee.
Building New Sites/Data Centres Development: NEXTDC is involved in the development
of data centres, including the new site for S3 as well as the ongoing expansion at M2 and S2. Generally, development projects have a number of risks including (i) the risk that suitable sites or required planning consents and regulatory approvals, including approvals from the local water authority and the local power distribution grid operator, are not obtained or, if obtained, are received later than expected, or are adverse to NEXTDC’s interests, or are not properly adhered to; (ii) the escalation of development costs (including the costs of construction and fit out and any associated delays) beyond those originally expected; (iii) unforeseen project delays beyond the control of NEXTDC including for example the impact of the COVID-19 pandemic; and (iv) non- performance/breach of contract by a contractor or sub- contractor. Increases in supply or falls in demand could influence the acquisition of sites, the timing and value of sales and carrying value of projects. To fundamentally manage these risks, NEXTDC has implemented governance and management processes designed to drive consistency in the planning, design, engineering, procurement and project and commercial management for each site.
Customer Demand: Development of new and existing data centres is capital intensive and sometimes undertaken without pre-sales commitment from customers. There is a risk that there will not be enough customer demand to achieve a sufficient return on investment. NEXTDC’s business model to become the largest independent, carrier neutral channel ecosystem in the Asia-Pacific region aims to manage this risk by developing sites mindful of market demand and customer needs with the aim of offering a service and connectivity compelling to our customers. NEXTDC’s next-generation of data centres will be particularly focussed on more scalable fit-outs. This will allow us to stay in step with
demand whilst lowering our initial capital outlay. We are also aiming to increase sales by providing complementary products and services.
Ensuring Financial Health of the Company Funding: NEXTDC’s business is capital intensive in
nature and our continued growth relies on the acquisition and development of new and existing data centres, along with investment in new technologies. Failure to obtain sufficient capital on favourable terms may hinder NEXTDC’s ability to expand and pursue growth opportunities, which may reduce competitiveness and have an adverse effect on financial performance. To address this risk, NEXTDC has sought to obtain funding from various sources in order to not become over-reliant on any one form of funding.
Security of Data and Information Physical Security Breach: NEXTDC customers rely on our
physical security to prevent unauthorised access to the space where their equipment resides. A physical security breach to a customer’s space could result in irreversible reputational damage, impact on future opportunities and the ability to retain existing customers. The Company’s facilities are protected by multi-layered security systems and protocols designed to limit access to areas within the data centres only to those with the appropriate authorisation.
Privacy & Data Security: NEXTDC collects a minimal amount of Personally Identifiable Information (PII), limited to activities such as account and contract management, marketing and to permit entry into its facilities. NEXTDC does not store, interact with or manage any data stored on its customers’ equipment. Customers are responsible for managing their own IT equipment and data security. All PII is securely managed in accordance with our Privacy Policy, a document based on the Australian Privacy Act 1998, the GDPR where it is applicable and information security practices based on ISO 27001 controls.
Cyber Risk: According to various recent global and national industry cyber risk reports, cyber incidents and their financial impacts are increasing significantly year on year and cyber criminals are targeting small and large businesses alike. To mitigate these risks, NEXTDC has implemented an information security management system based on ISO 27001 as well as undertaken ongoing penetration and vulnerability testing.
Revenue Generation and Customer Growth Customer Management: NEXTDC is committed to building
a culture that values our customers and provides the best experience for them, from the first to the last point of contact. To manage the risk of ensuring this is central to all phases of the customer lifecycle we have deployed various training and awareness programs across the Company. Besides measuring ourselves against key customer metrics, we continue to evolve our customer resourcing models to ensure we deliver great service and monitor the outcomes and feedback.
Meeting Customer Requirements: Some of our customers and channel partners are large, well established businesses. Not delivering the appropriate solution within the required timeframe to meet their requirements could significantly impact our brand reputation as well as the ability to win further opportunities. To minimise this risk, NEXTDC engages its in-house engineering and project management teams to ensure the customer is provided with the optimal solution, delivered on time and in budget.
Directors’ Report
NEXTDC Limited and controlled entities | FY20 Annual Report 23
For
per
sona
l use
onl
y
Innovating to stay competitive: NEXTDC’s on-goingstrategic initiatives include a focus on research anddevelopment designed to foster innovation andexcellence in data centre development and operations.A large part of that is our interactions with customerswhich are essential in understanding which solutionsand innovations can drive value for customers, demandin the relevant industry sectors and to ensure thatNEXTDC continues to retain its competitive advantage.
The Environmental, Social and Governance Report (located at www.nextdc.com) provides further details on how NEXTDC addresses matters of environmental and social sustainability.
Significant changes in the state of affairs Other than what has already been mentioned in this report, there have been no further significant changes in the state of affairs of the Group during FY20.
Matters subsequent to the end of the financial period No matters or circumstances have arisen since 30 June 2020 that have significantly affected the Group’s operations, results or state of affairs, or may do so in future years.
Likely developments and expected results of operations Likely developments in the operations of the Group that were not finalised at the date of this report include the continued fit out of data centre capacity in existing facilities and the pursuit of further growth opportunities.
Dividends In considering dividend policy the Board considers the demand for capital to invest in growth, its level of retained earnings and the availability of franked earnings. Although the Company is expanding operating cashflow, NEXTDC is some way from paying tax and consequently from generating franking credits. The Company continues to experience strong demand for its services and consequently is continuing to make substantial capital investment into the business. It is unlikely that NEXTDC will pay any dividend in the next two years. Dividends were neither paid nor declared during the year.
Environmental regulation NEXTDC is constantly monitoring and revising the best way to manage our data centres to minimise the impact to the environment. The Group is subject to significant environmental regulation in respect of its data centre operating activities as set out below.
Greenhouse gas and energy data reporting requirements NEXTDC monitors its carbon emissions for reporting and is registered under the National Greenhouse and Energy Reporting Act (“NGER”). Additionally, corporate operations are certified 100% carbon neutral under the Australian Federal Government’s Climate Active program (previously known as the National Carbon Offset Standard, or NCOS). We have continued to achieve carbon neutrality by offsetting emissions associated with our corporate operations and are currently developing a product to offer our customers the opportunity to similarly offset their emissions in our facilities – yet another first for a data centre operator in the Asia Pacific region. NEXTDC’s S1, M1, C1, P1 and B2 data centres are also certified to ISO 14001, Environmental Management System certification. All other data centres are operated and maintained under the same ISO 14001 policies and procedures with the intention of achieving certification in the near future.
Insurance of officers During the period, NEXTDC Limited paid a premium of $1,581,000 (FY19: $809,500) to insure the Directors and officers of the Group.
The liabilities insured include legal costs that may be incurred in defending civil or criminal proceedings that may be brought against individuals in their capacity as officers of entities in the Group and any other liabilities or amounts sought against them in connection with such proceedings. This does not include liabilities that arise from conduct involving a wilful breach of duty by the officers or the improper use by the officers of their position or of information to gain advantage for themselves or someone else or to cause detriment to the Group. The Directors & Officers Liability insurance also covers security claims against the company itself. It is not possible to apportion the premium between amounts relating to the insurance against legal costs to defend the officers and those relating to other liabilities.
Proceedings on behalf of the Company No person has applied to the Court under section 237 of the Corporations Act 2001 for leave to bring proceedings on behalf of the Group, or to intervene in any proceedings to which the Group is a party, for the purpose of taking responsibility on behalf of the Group for all or part of those proceedings.
No proceedings have been brought or intervened in on behalf of the Group with leave of the Court under section 237 of the Corporations Act 2001.
Rounding of amounts The company is of a kind referred to in ASIC Corporations (Rounding in Financial/Directors' Reports) Instrument 2016/191, relating to the ‘rounding off’ of amounts in the financial statements. Amounts in the financial statements have been rounded off in accordance with that Class Order to the nearest thousand dollars, or in certain cases, to the nearest dollar.
Directors’ Report
NEXTDC Limited and controlled entities | FY20 Annual Report 24
For
per
sona
l use
onl
y

Information on Directors
DOUGLAS FLYNN CRAIG SCROGGIE
Chairman Non-Executive Director (since September 2013)
EXPERIENCE AND EXPERTISE Douglas (Doug) was appointed to the Board in September 2013 as an Independent Non-Executive Director and subsequently was appointed as Chairman in April 2014.
Doug has over 30 years of international experience in the media and information and communication technology industries, including holding various senior management and board positions.
Doug is the current Chairman of IMEXHS Limited, a medical imaging technology provider.
Previously, Doug was Chief Executive of newspaper publisher, Davies Brothers Limited, which was acquired by News Corporation in 1989. In 1995, he was appointed the Managing Director of News International Plc.
After leaving News International in 1998, Doug joined Aegis Group Plc and was appointed as CEO in 1999, where he was instrumental in doubling the size of the company and established a global market research business Synovate and internet services business Isobar.
From 2005 to 2008, Doug served as the Chief Executive of facilities management provider Rentokil Initial Plc.
Doug graduated in Chemical Engineering from the University of Newcastle, New South Wales and received a Master of Business Administration with distinction from the University of Melbourne.
OTHER CURRENT DIRECTORSHIPS IMEXHS Limited (March 2020 – present)
FORMER DIRECTORSHIPS Seven West Media Limited iSentia Group Limited APN Outdoor Group Limited Konekt Limited
SPECIAL RESPONSIBILITIES Chairman of the Board Member of the Audit and Risk Management Committee Member of the Remuneration and Nomination
Committee Member of the Investment Committee
INTERESTS IN SHARES AND OPTIONS Doug holds 160,223 fully paid ordinary shares in NEXTDC Limited.
Chief Executive Officer (since June 2012) Managing Director (since November 2010)
EXPERIENCE AND EXPERTISE Craig Scroggie is the Chief Executive Officer and Managing Director of NEXTDC, responsible for driving the business to become one of the world’s fastest growing technology companies. Craig is well recognised for his superior leadership experience within the IT and telecommunications industries across the globe.
Under Craig’s leadership, NEXTDC has grown from a start-up operating only a single data centre (B1 Brisbane) to now being recognised as Australia’s leading Data Centre-as-a-Service company, boasting a national footprint of nine operational data centres across Australia, with an additional two facilities currently in design. The company’s annual data centre services revenues have grown from $1.2 million (FY12) to more than $200 million (FY20). In that time, the Company has earned numerous awards in the technology, business and engineering industries.
Prior to his appointment as Chief Executive Officer, Craig served as a Non-Executive Director of NEXTDC for 18 months and as Chairman of the Audit and Risk Management Committee. Craig has previously held senior leadership positions with Symantec, Veritas Software, Computer Associates, EMC Corporation and Fujitsu. Craig is a Graduate and Fellow of the Australian Institute of Company Directors and a Fellow of the Australian Institute of Management. Craig is a Graduate of the University of Southern Queensland and holds an Advanced Certificate in Information Technology, a Graduate Certificate in Management, a Postgraduate Diploma in Management, and a Master of Business Administration.
OTHER CURRENT DIRECTORSHIPS Craig holds the position of Adjunct Professor in the College of Arts, Social Sciences and Commerce at La Trobe University and currently serves as the Chairman of the La Trobe University Business School.
SPECIAL RESPONSIBILITIES Member of the Investment Committee
INTERESTS IN SHARES AND OPTIONS Craig holds 1,989,191 fully paid ordinary shares and 842,907 performance rights.
Directors’ Report
NEXTDC Limited and controlled entities | FY20 Annual Report 25
For
per
sona
l use
onl
y

STUART DAVIS DR GREGORY J CLARK AC
Non-Executive Director (since September 2013)
EXPERIENCE AND EXPERTISE Stuart has over 30 years’ experience as an international banker with the HSBC Group including roles in Hong Kong, New York, Taiwan, India and Australia. Most recently he was CEO India for the Hongkong and Shanghai Banking Corporation Limited (2009-2012), CEO and Executive Director for HSBC Bank Australia Limited (2002-2009) and CEO HSBC Taiwan (1999-2002). He was a member of the Australian Bankers Association from 2002 to 2009 and Deputy Chairman from 2006 to 2009.
Stuart holds a LLB from Adelaide University and is a Graduate of the Australian Institute of Company Directors.
OTHER CURRENT DIRECTORSHIPS PayPal Australia Limited (July 2016 – present) Bank of South Pacific Limited (September 2017 –present)
FORMER DIRECTORSHIPS
Stuart previously held directorships with subsidiaries of HSBC Group until 2012, Built Holdings Pty Ltd. and Moboom Limited.
SPECIAL RESPONSIBILITIES Chairman of the Remuneration and Nomination
Committee Member of the Audit and Risk Management Committee
INTERESTS IN SHARES AND OPTIONS Stuart holds 38,160 fully paid ordinary shares in NEXTDC Limited.
Non-Executive Director (since April 2014)
EXPERIENCE AND EXPERTISE Dr Gregory J Clark AC is a world-renowned technologist, businessman and scientist, with extensive corporate and Board experience in Australia, the USA and Europe.
Dr Clark was previously on the Board of the ANZ Banking Group where he chaired the Board’s Technology Committee and was a member of the Risk, Governance and Human Resources Committees.
Dr Clark brings to the Board international business experience and a distinguished career in micro-electronics, computing and communications. He was previously Principal of Clark Capital Partners, a US based firm that has advised internationally on technology and the technology marketplace.
During his career, Dr Clark also held senior executive roles at IBM, News Corporation and Loral Space and Communications. At IBM he was a senior scientist in their Research Division in NY. At News Corporation he was President of Technology and on the Executive Committee with responsibility for all technical aspects of digital media creation and delivery. Dr Clark was responsible for News Corporation’s transformation of its media assets from an analogue platform into a digital platform for both program creation and delivery. In addition, he was responsible for all technology companies within News Corporation.
He was Chief Operating Officer at Loral Space and Communications, the world’s largest commercial satellite manufacturer and one of the largest operators, with responsibility for all development, manufacturing, marketing and sales.
While at News Corporation and Loral Space and Communications, Dr Clark was Chairman and/or on the Board of a number of wholly owned subsidiaries including Globalstar, SatMex, Skynet, SpaceSystemLoral, Kesmai, Etak and others.
OTHER CURRENT DIRECTORSHIPS Dr Clark is currently Chairman of the Australian National University Advisory Board for the Research School of Physics and Engineering. He is also currently on the Board of the Sydney University Physics Foundation and Questacon, the National Science and Technology Centre.
FORMER DIRECTORSHIPS Dr Clark served as a director on the Board of the ANZ Banking Group which he stepped down from in November 2013 after nine years of service.
SPECIAL RESPONSIBILITIES Member of the Remuneration and Nomination
Committee Member of the Investment Committee
INTERESTS IN SHARES AND OPTIONS Gregory holds 66,048 fully paid ordinary shares in NEXTDC Limited.
Directors’ Report
NEXTDC Limited and controlled entities | FY20 Annual Report 26
For
per
sona
l use
onl
y

STEPHEN SMITH JENNIFER LAMBERT
Non-Executive Director (since 1 July 2019)
EXPERIENCE AND EXPERTISE
Steve Smith is widely respected amongst the global ICT community. Steve has a deep background and expertise in managing market leading technology businesses, particularly in the data centre industry.
Steve served as CEO and President of Equinix Inc for over a decade (2007-2018), transforming it into the largest enterprise data centre platform in the world. Under Steve’s leadership Equinix grew from 17 data centres operating in 10 markets and a US$2 billion market cap, to approximately 200 data centres with a US$38 billion market cap and operations in 24 countries on five continents.
Based in the San Francisco Bay Area, Steve is currently a Managing Director of GI Partners, a US based investment fund focussed on data centre, data transport, wireless and tech-enabled infrastructure investments in North America. Prior to his time at GI Partners and Equinix, Steve held senior leadership positions at Hewlett Packard (2005-2006) which included serving as its Senior Vice President - Worldwide HP Services; Lucent Technologies Inc. (2004-2005), where he was appointed as Vice President, GlobalProfessional and Managed Services and Electronic DataSystems Corporation (EDS) (1987-2004), where he servedin a number of capacities including Chief Sales Officer andPresident, Asia-Pacific.
Steve also had a successful eight-year career in the U.S. Army where, among other roles, he was aide de-camp to the office of the Commander in Chief of the U.S. Armed Forces in the Pacific.
Steve holds a Bachelor of Science in Engineering from the U.S. Military Academy at West Point.
OTHER CURRENT DIRECTORSHIPS Flexential Inc. (April 2018 – present)
FORMER DIRECTORSHIPS
Steve has served on several boards including Volterra Semiconductor Corporation, 3Par Inc, Actian Corporation, NetApp Inc and F5 Networks Inc.
SPECIAL RESPONSIBILITIES Chairman of the Investment Committee
INTERESTS IN SHARES AND OPTIONS
Nil
Non-Executive Director (since 1 October 2019)
EXPERIENCE AND EXPERTISE
Jennifer has extensive business and leadership experience at senior executive and board level with more than 25 years of financial management and accounting experience.
Currently a Non-Executive Director of BlueScope Steel Limited where she is Chair of the Audit Committee, Ms Lambert is also a non-executive director of Mission Australia and a number of other not for profit entities.
Ms Lambert was Group Chief Financial Officer of 151 Property (formerly Valad Property Group) for 13 years where her responsibilities included operational and strategic finance, tax, treasury, legal and compliance. Prior to this, Ms Lambert was a director at PricewaterhouseCoopers specialising in capital raisings, structuring and due diligence for acquisitions and disposals across various industries.
Jennifer holds a Bachelor of Business (Accounting and Finance) from University of Technology Sydney and Master of Economics from Macquarie University. Her professional associations include being a member of The Chartered Accountants Australia New Zealand and a Fellow of the Australian Institute of Company Directors.
OTHER CURRENT DIRECTORSHIPS BlueScope Steel Limited (September 2017 – present)
SPECIAL RESPONSIBILITIES Chair of the Audit and Risk Management Committee
INTERESTS IN SHARES AND OPTIONS Jennifer holds 11,846 fully paid ordinary shares in NEXTDC Limited.
Directors’ Report
NEXTDC Limited and controlled entities | FY20 Annual Report 27
For
per
sona
l use
onl
y
DR EILEEN DOYLE
SHARON WARBURTON
Non-Executive Director (since August 2020) EXPERIENCE AND EXPERTISE Dr Doyle has had an internationally recognised career with close to four decades of diverse business experience at both executive and board level.
Her experience covers a wide range of industries including logistics, port operations, research, property, financial services, manufacturing, building and construction.
Dr Doyle has previously served as the Chairman of the world’s largest export coal loader, PWCS (1998-2009) and Deputy Chairman of CSIRO to 2016, after 10 years of service.
Dr Doyle currently serves on the Board of Boral (2010) and Oil Search Limited (2016) with previous appointments having included directorships at GPT Group (2010-2019), State Super Financial Services (2002-2009), Ross Human Directions Limited (2005–2010), The Australian Mathematical Sciences Institute (2008–2018), Knights Rugby League Ltd (2014–2017) and Bradken Limited (2011–2015). In many of her roles she has also acted as a member on the Audit, Governance and Sustainability Committees. Dr Doyle’s experience also includes appointments at major government bodies Austrade (1999–2005), CSIRO, Newcastle Port Corporation (2001–2002), the National Steering Committee on eHealth and the NSW Innovation and Productivity Council. Dr Doyle holds a Ph.D. in Applied Statistics from the University of Newcastle, was a Fulbright Scholar (Business Management: Columbia University), is a fellow of the Academy of Technological Sciences and Engineering (FTSE inducted 2016) and a Fellow of the Australian Institute of Company Directors (FAICD). Dr Doyle is also a Foundation Fellow of The Australian Association of Angel Investors (FAAAI) and the author of “Call a Business Angel”. OTHER CURRENT DIRECTORSHIPS Boral Limited (2010 – present)
Oil Search Limited (2016 – present) FORMER DIRECTORSHIPS GPT Group (2010 – 2019) SPECIAL RESPONSIBILITIES Member of the Audit and Risk Management Committee
INTERESTS IN SHARES AND OPTIONS
Nil
Non-Executive Director (from April 2017 to March 2020) EXPERIENCE AND EXPERTISE Sharon was an Independent Non-Executive Director until her resignation in March 2020.
Sharon is currently a Non-Executive Director of Wesfarmers, Gold Road Resources and Worley. Sharon has also been a part-time member of the Federal Government’s Takeovers Panel since 2015 and is an Adjunct Professor at Curtin University’s Faculty of Business and Law.
Sharon has previously held positions as Executive Director of Strategy and Finance with Brookfield Multiplex, Chief Planning and Strategy Office of United Arab Emirates based ALDAR Properties PJSC, and senior executive roles with Multiplex, Citigroup, and Rio Tinto.
Sharon is a Fellow of Chartered Accountants Australia and New Zealand. Sharon is a Graduate of the Australian Institute of Company Directors, a Fellow of the Australian Institute of Building and a member of Chief Executive Women. Sharon holds a Bachelor of Business – Accounting and Business Law from Curtin University. INTERESTS IN SHARES AND OPTIONS Sharon held 39,202 fully paid ordinary shares in NEXTDC Limited at the time of her departure.
Directors’ Report
NEXTDC Limited and controlled entities | FY20 Annual Report 28
For
per
sona
l use
onl
y

MICHAEL HELMER
Company Secretary (since February 2015) Michael is also the Chief Legal Officer of NEXTDC Limited.
Michael has over 25 years’ experience in the legal sector and, until joining the Company, served as Director of Legal Services (Asia Pacific) for global software maker Symantec, where he and his team were responsible for advising on compliance, licensing, litigation, privacy and cybersecurity issues throughout the region as well as supporting the regional leadership, sales and engineering teams. Previously Michael was based in London at specialist technology and IP firm Field Fisher Waterhouse. Michael has held senior legal roles in Barclays, Coles Myer and was General Counsel at European on-line shopping site shopsmart.com as well as at Australian anti-malware maker PC Tools. Michael has practised extensively in the areas of technology, data security, privacy, corporate commercial, licensing and FMCG.
He has obtained a Bachelor of Laws, Bachelor of Science (Monash) and is admitted as a legal practitioner in Australia and in England and Wales. Michael is a member of the Association of Corporate Counsel (Australia) having served as their Victorian President as well as a member of its National Board (2012-2014). Michael is a member of the Governance Institute of Australia and holds a Certificate in Governance Practice.
Meetings of Directors The number of meetings of the Company's Board of Directors and of each board committee held during the year, and the number of meetings attended by each director are as follows:
Meetings of Committees Full meetings of
Directors Audit and Risk Management Committee
Remuneration and Nomination Committee
Investment Committee
A B A B A B A B Douglas Flynn 14 14 2 2 3 3 2 2 Craig Scroggie 14 14 N/A N/A N/A N/A 2 2 Stuart Davis 14 14 3 3 3 3 N/A N/A Dr Gregory J Clark AC 14 14 1 1 3 3 2 2 Sharon Warburton 8 8 2 2 1 1 N/A N/A Stephen Smith 14 14 N/A N/A N/A N/A 2 2 Jennifer Lambert 12 12 2 2 N/A N/A N/A N/A
A = Number of meetings attended B = Number of meetings held during the time the Director held office or was a member of the committee during the period N/A = Not applicable. Not a member of the relevant Committee
Directors’ Report
NEXTDC Limited and controlled entities | FY20 Annual Report 29
For
per
sona
l use
onl
y

Remuneration Report – Audited
This report sets out the remuneration arrangements for NEXTDC’s Directors and other Key Management Personnel (KMP) for the year ended 30 June 2020 (FY20). It is prepared in accordance with section 300A of the Corporations Act 2001 (Corporations Act) and has been audited as required by section 308(3C) of the Corporations Act.
This report is divided into the following sections:
Page
1. Message from the Chair of the Remuneration and Nomination Committee 31
2. The Persons covered by this Report 32
3. Overview of Remuneration Governance Framework 32
3.1. Senior Executive Remuneration (SER) Policy 32
3.2. Senior Executive Remuneration Benchmarks 34
3.3. Senior Executive Remuneration Mix 34
3.4. Senior Executive Remuneration and Performance 35
3.5. Variable Remuneration – Short Term Incentive (STI) Plan 36
3.6. Variable Remuneration – Long Term Incentive (LTI) Plan 37
3.7. Risk Management and Clawback Provisions 38
3.8. Non-Executive Director Remuneration Policy 39
4. Employment Terms for Directors and Senior Executives 39
5. STI and LTI Performance outcomes for FY20 40
5.1. STI Vesting Outcomes 40
5.2. LTI Vesting Outcomes 41
6. Statutory Remuneration 41
6.1. Senior Executive Remuneration 41
6.2. Non-Executive Director Remuneration 43
6.3. Changes in Securities Held Due to Remuneration 44
6.4. Director and Senior Executive Shareholdings 47
6.5. Remuneration Received (Non-statutory) 48
NEXTDC Limited and controlled entities | FY20 Annual Report 30
For
per
sona
l use
onl
y

1. MESSAGE FROM THE CHAIR OF THE REMUNERATION AND NOMINATION COMMITTEE
This Remuneration Report details how executive remuneration outcomes are linked to both NEXTDC and individual performance for the 2020 financial year. It details our remuneration policy for FY20 and how it was designed and structured to create alignment between executive remuneration and shareholder outcomes for the reporting period.
In FY20, NEXTDC achieved a number of key performance milestones:
At NEXTDC we are focussed on creating a corporate culture aligned with our core values. The remuneration policies which the Remuneration and Nomination Committee implement aim to reinforce these by recognising and seeking to retain high-calibre talent both in its leadership group and more broadly. A strong corporate culture within these leadership teams and an appropriate Senior Executive remuneration program has driven retention, cohesion, focus and ultimately, success for NEXTDC and its shareholders. In setting the remuneration program, NEXTDC’s Remuneration and Nomination Committee considers a variety of factors with reference to its overall business objectives and priorities, individual performance, cash position, competitive talent markets and feedback from its shareholders. The Committee seeks to incentivise its executives and ensure the Company retains key contributors in order to leverage their expertise and contributions and maximise NEXTDC’s opportunities in the data centre industry. The Committee seeks to balance these factors in remuneration packages that take into account broader considerations such as long-term value to NEXTDC and market competition for talent from private and foreign-owned corporations. To that end the Committee recognises that significant components of executive remuneration need to be conditional on the Company’s success and its positive effects upon shareholders. Factors such as site performance, development objectives, strategic leadership and the value we deliver to our customers are also factors considered in the overall remuneration structure. This year, NEXTDC and the broader community have been impacted by the COVID-19 pandemic, with far-reaching health, social and economic consequences experienced. NEXTDC’s response to this included, but was not limited to, implementing new processes and protocols across the business to protect our customers, suppliers and teams. Some of these measures included implementing work from home arrangements where possible, while ensuring teams remained connected, restricting access to our data centres to essential employees and customers, and supporting our impacted customers. Despite the impact of COVID-19, NEXTDC’s sound business approach, risk management and success in setting and achieving strategic objectives have culminated to result in value accretion for both the Company and shareholders. The Board has considered all factors regarding the impact of the pandemic on not only the Company itself but the broader market and community in assessing remuneration outcomes for the year. In light of the strong performance of NEXTDC and the significant outcomes achieved throughout the year by management, the Board has determined that no discretion be applied to the outcome of awards for the 2020 financial year.
To ensure retention, the Committee is also very mindful of broader trends in the executive space, both with reference to comparator groups in Australian and international markets.
As the new Chairman of the Committee, the whole Committee and I are looking forward to further engaging with you, our shareholders and will be listening closely to your thoughts concerning remuneration policies and practices.
Stuart Davis Chairman – Remuneration and Nomination Committee
Data centre services revenue
$200.8M▲ $31.1M (18%)
Underlying EBITDA
$104.6M▲ $19.5M (23%)
Operating cashflow
$53.9M▲ $14.6M (37%)
Equity raised
$862MCapital expenditure
$418MContracted utilisation
70.0MW▲ 17.4MW (33%)
Remuneration Report – Audited
NEXTDC Limited and controlled entities | FY20 Annual Report 31
For
per
sona
l use
onl
y

2. THE PERSONS COVERED BY THIS REPORT
Key Management Personnel (“KMP”) include Non-Executive Directors and Senior Executives. The term “Senior Executives” refers to the CEO and those executives with authority and responsibility for planning, directing and controlling the activities of the Company and the Group, directly or indirectly.
TABLE 1: KEY MANAGEMENT PERSONNEL
NON-EXECUTIVE DIRECTORS
Name Position
Douglas Flynn Non-Executive Chairman since 30 April 2014 Member of the Audit and Risk Management Committee Member of the Remuneration and Nomination Committee Member of the Investment Committee
Stuart Davis Non-Executive Director Chair of the Remuneration and Nomination Committee* Member of the Audit and Risk Management Committee
Dr Gregory J Clark AC Non-Executive Director Member of the Remuneration and Nomination Committee Member of the Investment Committee
Stephen Smith (appointed 1 July 2019) Non-Executive Director Chair of the Investment Committee*
Jennifer Lambert (appointed 1 October 2019) Non-Executive Director Chair of the Audit and Risk Management Committee*
Sharon Warburton (resigned with effect 31 March 2020)
Former Non-Executive Director Former Member of the Audit and Risk Management Committee Former Member of the Remuneration and Nomination Committee
*Chair appointment made on 1 January 2020
SENIOR EXECUTIVES
Name Position
Craig Scroggie Chief Executive Officer, Managing Director
Simon Cooper Chief Operating Officer
Oskar Tomaszewski Chief Financial Officer
David Dzienciol Chief Customer and Commercial Officer
Adam Scully* Chief Sales Officer *Ceased as KMP on 24 March 2020
3. OVERVIEW OF REMUNERATION GOVERNANCE FRAMEWORK
NEXTDC’s mission is to be the leading customer-centric data centre services company, delivering solutions that power, secure and connect enterprise. The remuneration policy is designed to incentivise and reward Senior Executives for achieving the Company’s overarching objectives of building market-leading sales performance, hosting the country’s largest independent ecosystem of carriers, cloud and IT service providers and enabling customers to source and connect with suppliers and partners in an integrated hybrid cloud environment.
The remuneration framework applicable to the 2020 financial year is outlined and summarised below.
3.1 Senior Executive Remuneration (SER) Policy The Senior Executive Remuneration Policy applies to Senior Executives who are defined as:
The Chief Executive Officer – accountable to the Board for the Company’s performance and long-term planning; Heads of business units, or those with key functional roles, or essential expertise, that report directly to the Chief Executive
Officer; Other executive roles classified as KMP under the Corporations Act; and Other roles or individuals nominated by the Board from time to time.
Remuneration Report – Audited
NEXTDC Limited and controlled entities | FY20 Annual Report 32
For
per
sona
l use
onl
y

FIGURE 1: REMUNERATION GOVERNANCE FRAMEWORK
BOARD Approves the overall remuneration
policy and ensures it is competitive,fair and aligned with the long-terminterests of the Company andshareholders
Approves Senior Executives andother key management personnel remuneration
Assesses company performance anddetermines STI and LTI outcomes forSenior Executives
REMUNERATION AND NOMINATION COMMITTEE The Remuneration and Nomination Committee is delegated responsibility by the Board to make recommendations on: The remuneration policies and
framework Non-Executive Director remuneration Remuneration for Senior Executives
and other key managementpersonnel
The extent of the Senior Executives’achievements against performancetargets and the remunerationoutcomes
Executive incentive arrangements
MANAGEMENT Provides information relevant to
remuneration decisions and makesrecommendations to theRemuneration and NominationCommittee
CONSULTATION WITH SHAREHOLDERS AND OTHER STAKEHOLDERS
REMUNERATION CONSULTANTS AND OTHER EXTERNAL ADVISORS The Remuneration and Nomination Committee may appoint and engage independent advisors directly in relation to Executive remuneration matters. These advisors: Review and provide recommendations on the appropriateness of Senior Executive remuneration Provide independent information to assist with remuneration decisionsAdvice or recommendations provided are used to assist the Board. Remuneration decisions are undertakenthrough the Board and Remuneration and Nomination Committee process.
The SER policy details how executive remuneration is structured, benchmarked and adjusted in response to changes in the circumstances of the Company. NEXTDC’s Senior Executives Total Remuneration Package (TRP) includes the following components, the proportions of which remain unchanged from the previous year:
FIGURE 2: TOTAL FY20 REMUNERATION (IF MAXIMUM INCENTIVE PAYMENTS ARE RECEIVED)
Base Salary Package (36%)
Base Salary Package (includessuperannuation, non-monetary benefits and any applicable fringe benefits tax)
References domestic and international industry benchmarks
STI (28% at risk)
STI that provides a reward forperformance against the annualobjectives
EBITDA gateway Maximum = 75% of Base
LTI (36% at risk)
LTI that provides a securities-basedreward for performance against indicators of long term shareholdervalue creation
Rights vest at TSR Index (must be positive)
Maximum = 100% of Base
Year 1 Year 2 Year 3
50% is paid ascash
50% isdeferred for one year (cashor shares)
Remuneration Report – Audited
NEXTDC Limited and controlled entities | FY20 Annual Report 33
For
per
sona
l use
onl
y

3.2 Senior Executive Remuneration Benchmarks In setting executive remuneration, the Committee references domestic and international industry benchmarks relevant to its market sector, growth and value as well as the individual’s role and performance. Specific care is taken to ensure factors specific to the niche data centre industry are taken into account and to seek to ensure NEXTDC is able to attract, motivate and retain the right talent in the leadership team and more broadly. NEXTDC recognises that competitive pressures for top talent arises both from competitors and major customers at a local and international level. Accordingly, NEXTDC considers the following as fundamental factors in setting executive remuneration packages:
The individual’s contribution to long term revenue and EBITDA growth; Their relevant industry knowledge, experience and connections; and Domestic and international comparators with whom NEXTDC must compete for talent.
The Base Salary Package and TRP levels are set taking into account the above factors, as well as the surrounding market conditions and sentiment, the trajectory of the company's growth, strategic objectives, competency and skillset of individuals, scarcity of talent, changes in role complexities and the geographical spread of the Company.
The Committee is of the view that first-class industry relationships are of critical importance in achieving exceptional financial performance and long-term shareholder value. Accordingly, it will evaluate the TRP against both domestic and international remuneration benchmarks when making its overall assessment.
3.3 Senior Executive Remuneration Mix The Senior Executive remuneration mix refers to the proportion of remuneration that executives can receive as fixed versus any variable “at risk” remuneration. Assuming performance is at a level at which incentives pay out in full, 64% of the TRP remuneration received is performance related.
The graph below sets out the remuneration mix if maximum incentive payments are received for the CEO and other Senior Executive KMP for FY20.
FIGURE 3: FY20 POTENTIAL REMUNERATION MIX
FIXED (36%) AT RISK (64%)
Long Term Incentive (36%) Deferred STI (14%) STI (14%) Base Salary (36%)
Remuneration Report – Audited
NEXTDC Limited and controlled entities | FY20 Annual Report 34
For
per
sona
l use
onl
y

3.4 Senior Executive Remuneration and Performance Although organic growth opportunities continue to be compelling, the Company has strong competition from private and foreign owned corporations. As a result, the Board has determined that significant remuneration opportunities should be contingent on realising the Company’s ongoing growth trajectory. The ability to consistently increase shareholder value is closely tied to NEXTDC maintaining its competitive advantage by being amongst the first to secure valuable sites, build data centre infrastructure and offer a compelling regional footprint for national and international customers. If successful, these components of Company performance are the drivers of tomorrow’s sustainable shareholder value creation.
Senior Executive remuneration and performance is also assessed relative to NEXTDC’s performance over the past five years, as summarised below:
TABLE 2: HISTORICAL COMPANY PERFORMANCE
*Closing share price as at 30 June 2020
FY20 underlying EBITDA excludes non-recurring items such as costs related to review work in the Asia Pacific region (APAC). EBITDA is a non-statutory metric representing earnings before interest, tax, depreciation and amortisation.
▼ 16%
▲ 18% ▲ 23%
Data centre services revenue ($M) Underlying EBITDA ($M) Net profit/(loss) before tax ($M)
▲ 33% ▲ 52% ▲ 102%
Contracted utilisation (MW) Share price* ($) Market capitalisation* ($M)
89.3
117.
6
152.
6
169.
7
200.
8
FY16 FY17 FY18 FY19 FY20
27.7
49.0
62.6
85.1
104.
6 FY16 FY17 FY18 FY19 FY20
1.8
12.9
10.9
(16.
1)
(18.
7)
FY16 FY17 FY18 FY19 FY20
26.1
31.5
40.2
52.5
70.0
FY16 FY17 FY18 FY19 FY20
3.47
4.51
7.56
6.49
9.88
FY16 FY17 FY18 FY19 FY20
849
1,28
2
2,58
7
2,23
0
4,49
6 FY16 FY17 FY18 FY19 FY20
Remuneration Report – Audited
NEXTDC Limited and controlled entities | FY20 Annual Report 35
For
per
sona
l use
onl
y

3.5 Variable remuneration – Short Term Incentive (STI) Plan The highly capital intensive nature of NEXTDC requires infrastructure to be built prior to generating income derived from customer utilisation. With NEXTDC operating in a high-growth industry, the Company needs to continually expand its infrastructure to meet customer demand. It is on this basis that the Board and Committee places emphasis on committed sales, facilities expansion, margin, and EBITDA growth in incentivising Senior Executives.
FINANCIAL YEAR 2020 STI PLAN The purpose of the STI Plan is to provide an incentive for Senior Executives to achieve against the Company’s strategic objectives by delivering or exceeding annual business plan requirements for sustainable superior returns for shareholders. Key terms of the FY20 STI Plan are detailed below.
Feature Description Opportunity Threshold award of 25% of Base Salary Package and a stretch (maximum) award of 75%
of Base Salary Package. Measurement period The Company’s financial year i.e. from 1 July 2019 to 30 June 2020.
Performance metrics The below Company Key Performance Indicators (KPIs) were selected as being the most relevant drivers for improving financial performance and growth in shareholder value and are also common measures amongst NEXTDC’s global competitors.
Metric Weighting Reason for selection
Group EBITDA 1/3 Indicates the Company’s underlying profitability best suited to its stage of development
New retail NMRR* committed
1/3 New NMRR committed is connected to the level of incremental new business signed with NEXTDC’s two key customer segments – retail and wholesale New wholesale NMRR
committed 1/3
No STI can be paid if the EBITDA gateway is not achieved. The FY20 EBITDA gateway was set at 95% of budget. In addition, no STI will be awarded to any individual in breach of the Company’s code of conduct.
Delivery of STI Payments will be in cash unless otherwise determined by the Board and will normally be paid in September following the Measurement Period subject to the deferral of 50% of the final STI payment, which may be delivered in cash or by grant of rights to acquire fully paid ordinary shares.
Deferring 50% of the awarded STI for a period of 12 months is intended to promote sustainability of annual performance over the medium term, acts as a retention mechanism and facilitates the exercise of clawback provisions should the Board determine to exercise its discretion.
Board discretion If the Company’s overall performance during the Measurement Period is substantially lower than expectations and has resulted in a significant loss to shareholders’ value, the Board may abandon the STI Plan for the Measurement Period or adjust STI payouts.
*NMRR = Net Monthly Recurring Revenue
Remuneration Report – Audited
NEXTDC Limited and controlled entities | FY20 Annual Report 36
For
per
sona
l use
onl
y

3.6 Variable remuneration – Long Term Incentive (LTI) Plan
FINANCIAL YEAR 2020 LTI PLAN The aim of the LTI Plan is to provide an incentive for Senior Executives to help achieve the Company’s strategic objectives by delivering performance that will lead to sustainable and superior returns for shareholders. Another purpose of the LTI Plan is to act as a retention mechanism in order to maintain a stable team of performance-focussed Senior Executives. The current LTI Plan is the NEXTDC Limited Equity Incentive Plan (EIP).
Feature Description
Opportunity/Allocation Maximum LTI value was set at 100% of Base Salary Packages.
The LTI grant of Performance Rights is calculated by applying the following formula:
Number of Performance Rights = Base Package x Maximum LTI% ÷ Right Value NB: The Right Value is the volume weighted average share price of Shares over the 10 trading days following the release of the Company’s FY19 results. The “Maximum LTI %” recognises that the stretch level of Rights will be granted when stretch performance is achieved.
Measurement period The Performance Rights measurement period for FY20 is a three (3) year period beginning from the end of trade on the day of release of the FY19 Results and ending upon the end of the day of release of the annual results for FY22. The measurement period for assessing Total Shareholder Return (TSR) performance is aligned with the release of results to ensure that the share price upon which TSR is determined at the start and end of the performance period reflects an informed market.
Performance hurdle The performance condition is market adjusted TSR which compares the TSR of the Company to the TSR of the ASX 200 Accumulation Index (Index) with the vesting percentages to be determined by the following scale:
NEXTDC’s TSR over the Measurement Period
Percentage of Rights that vest
Less than TSR of Index Nil
At TSR of Index 25%
Between TSR of Index and TSR of Index + 5% Pro rata vesting from 25% to 100% on a straight-line basis
TSR of Index + 5% or greater 100%
A positive TSR gateway applies to all offers such that no vesting will occur if shareholder value has not increased over the Measurement Period (i.e. TSR must be positive). The Remuneration and Nomination Committee has again reviewed whether the introduction of a second LTI performance measure is appropriate. It remains the Board’s view that an additional measure is not appropriate at NEXTDC’s current stage of development. The Remuneration and Nomination Committee regards the continued application of a relative TSR performance measure to be the most effective method for aligning long-term executive performance with shareholder wealth outcomes and will review the appropriateness of the single measure LTI program on an annual basis.
Reason for selection TSR was selected as it recognises the total returns (share price movement and dividends assuming they are reinvested into Company shares) that accrue to shareholders over the Measurement Period. This measure creates the most direct alignment between shareholder return and rewards realised by Senior Executives. The measurement period for assessing TSR performance is aligned with the release of results to ensure that the share price upon which TSR is determined at the start and end of the performance period reflects an informed market. Market adjusted TSR was selected to ensure that participants do not receive windfall gains from broad market movements unrelated to the performance of the Senior Executives. The positive TSR gate ensures that Senior Executives cannot benefit from the LTI Plan when shareholders have lost value over the Measurement Period. Vesting commences upon NEXTDC’s TSR matching the Index TSR, with full vesting occurring once NEXTDC’s TSR exceeds the Index TSR by 5% compound annual growth over the performance period. This hurdle has been determined with regard for the historic performance of the ASX 200 Accumulation Index whereby 5% compound annual growth or greater represents upper quartile performance. This would, in the Board’s view, represent an outstanding outcome for the Company.
Remuneration Report – Audited
NEXTDC Limited and controlled entities | FY20 Annual Report 37
For
per
sona
l use
onl
y

Feature Description
Exercise of vested Incentive Rights
Upon vesting the Board will determine the extent to which their value will be delivered in Shares and/or cash. The Board will also determine whether Shares will be issued or acquired for participants via the Employee Share Trust (EST) and if the EST is used, whether new issues or on-market purchases of Shares will be undertaken by the trustee of the EST.
No amount is payable by participants to exercise vested Incentive Rights.
Forfeiture and termination In the event of cessation of employment due to dismissal for cause, all unvested Incentive Rights are forfeited.
In the event of cessation of employment due to resignation, all unvested Incentive Rights are forfeited unless otherwise determined by the Board.
In the event of cessation of employment due to death, total and permanent disability or redundancy, unvested performance rights will continue on-foot and be subject to the original terms as though employment had not ceased, unless the Board determines otherwise.
In any other circumstances the Board has discretion to determine how the unvested Performance Rights will be treated upon cessation of employment with the Company.
Board discretion The Board retains discretion to modify vesting outcomes. Incentive Rights that do not vest will lapse. Board discretion to vary vesting will generally only be applied when the vesting that would otherwise apply is considered by the Board to be inappropriate, and when it would not align with shareholder returns.
Change of Control In circumstances where there is a likely change in the control of NEXTDC, the Board has discretion to determine the level of vesting (if any) having regard to the portion of the performance period elapsed, performance to date against performance conditions and any other factors it considers appropriate.
If an actual change in the control of the Company occurs before the Board can exercise this discretion, unless the Board determines otherwise, unvested Performance Rights will vest and become exercisable in proportion to the Company's performance against the TSR Hurdle up to the date of the change of control.
Malus/Clawback Provisions
The Board retains the ability to reduce or clawback awards where the participant has acted fraudulently or dishonestly or is in material breach of their obligations to the Company; or where the Company becomes aware of material misstatements or omissions in the financial statements of the Company; or any circumstances occur that the Board determines to have resulted in an unfair benefit to the recipient.
Hedging The Company prohibits the hedging of Incentive Rights and Restricted Shares by Participants.
3.7 Risk Management and Clawback Provisions Creating a sound risk management culture is important to NEXTDC. The Company’s STI and LTI Plans have been designed to protect the Company from the risk of unintended or unjustified pay outcomes by allowing risk factors to be taken into account over long periods and by way of a variety of measures that are considered key to the Company’s success. For example:
Basing the STI on a number of performance measures, including an initial gateway hurdle before any STI is able to bepaid (subject also to malus/clawback provisions)
Deferring a component (50%) of STI to ensure alignment with shareholder value and compliance with NEXTDC’s codes ofconduct and corporate governance
Having the weighting of the remuneration mix towards LTI’s to encourage prudent risk taking in line with the long-termobjectives of the Company
While formal shareholding requirements are not imposed for Senior Executives, the CEO has a material holding in NEXTDC shares, which was valued at approximately 15 times base salary at 30 June 2020.
Board discretion is applied to the vesting of all STI’s and LTI’s to ensure any proposed awards are aligned with shareholder returns. As noted in section 3.6, the Board also retains the ability to reduce or clawback awards in the event of serious misconduct or a material misstatement in the Company’s financial statements.
Remuneration Report – Audited
NEXTDC Limited and controlled entities | FY20 Annual Report 38
For
per
sona
l use
onl
y

3.8 Non-Executive Director Remuneration Policy The Non-Executive Director Remuneration Policy applies to Non-Executive Directors of the Company in their capacity as Directors and as members of committees, and may be summarised as follows:
Remuneration comprises:– Board fees– Committee fees– Superannuation– Other benefits– Securities (if appropriate at the time).
Remuneration will be managed within the aggregate fee limit (AFL) or fee pool approved by shareholders of the Company. The Non-Executive Director Remuneration Policy contains guidelines on when the Board should seek adjustment to the
AFL such as in the case of the appointment of additional Non-Executive Directors. Remuneration should be reviewed annually. Non-Executive Directors are not entitled to termination benefits. A policy level of Board Fees (being the fees paid for membership of the Board, inclusive of superannuation and exclusive
of committee fees) will be set with reference to the median of comparable ASX listed companies. Committee fees may be used to recognise additional contributions to the work of the Board by members of committees, but
in a manner that, when combined with Board Fees, will not exceed the 75th percentile of comparable ASX listed companies.
The Company does not currently provide securities as part of Non-Executive Director remuneration.
The document also outlines the procedure that should be undertaken to review Non-Executive Director remuneration and determine appropriate changes.
4. EMPLOYMENT TERMS FOR DIRECTORS AND SENIOR EXECUTIVES
NON-EXECUTIVE DIRECTORS On appointment to the Board, all Non-Executive Directors enter into a service agreement with the Company in the form of a letter of appointment. The letter summarises the Board policies and terms, including compensation relevant to the office of the Director.
All of the current Non-Executive Directors carry an initial contract duration of three years (subject to re-election by shareholders). The employment contracts for the Non-Executive Directors do not carry notice period provisions, nor do they provide for any termination benefits.
Directors must retire from office at the third annual general meeting after the Director was last elected and will then be eligible for re-election. Upon cessation of a Director’s appointment, the Director will be paid his or her Director’s fees on a pro-rata basis, to the extent that they are unpaid.
SENIOR EXECUTIVES Remuneration and other terms of employment for the Chief Executive Officer and other key management personnel are also formalised in service agreements.
The CEO’s base salary package remained consistent at $1.32 million for FY19 and FY20. Since his appointment to the role in 2012, the CEO has overseen the company’s expansion, and has delivered:
118% 138% 140%
Compound annual revenue growth
Compound annual growth in total assets
Compound annual market capitalisation growth
Remuneration Report – Audited
NEXTDC Limited and controlled entities | FY20 Annual Report 39
For
per
sona
l use
onl
y

NEXTDC is unique among ASX-listed companies due to its high capital-intensity and growth prospects requiring further capital to be invested ahead of demonstrable revenues and profits. Most comparable peers are US-based, as is the more comparable executive talent. The Board considered the Company’s long-term strategy and potential and determined that the CEO’s remuneration remains appropriate in context of the skills and experience necessary to lead NEXTDC.
Other major provisions of the agreements relating to service agreements are set out below.
TABLE 3: SERVICE AGREEMENTS
Name Duration of Contract Notice Period Termination Payments1
Craig Scroggie No fixed term 12 months 12 months
Simon Cooper No fixed term 6 months 6 months
Oskar Tomaszewski No fixed term 6 months 6 months
David Dzienciol No fixed term 6 months 6 months
Adam Scully* No fixed term 6 months 6 months *Ceased as KMP on 24 March 2020
5. STI AND LTI PERFORMANCE OUTCOMES FOR FY20
5.1 STI Vesting Outcomes The below performance measures were chosen as being the most relevant drivers for improving financial performance and growing shareholder value. More specifically, the metrics were chosen because:
Group EBITDA: This metric indicates the Company’s underlying profitability at this stage of its development. New NMRR Committed: This metric is connected to the level of incremental new business signed with NEXTDC’s
two key customer segments: Retail and Wholesale.
FIGURE 4: CALCULATION OF STI OUTCOMES
The joint assessment of these three performance objectives in the context of the Company’s overall performance resulted in overall performance falling in between target and stretch for the FY20 performance period. The actual EBITDA and NMRR targets are not quantified as they are considered to be commercially sensitive and are therefore not disclosed in the interests of shareholders.
Based on performance against these three objectives, as well as the Company’s broader performance during FY20, including overall response to the COVID-19 pandemic, maintaining 100% uptime SLA and keeping construction performance on plan, completion of capital raising in challenging market conditions, strong share price performance and transition into the ASX 100 index, the Board has determined to award 100% of the FY20 STI opportunity.
1 Base salary payable if the Company terminates employees with notice, and without cause (for example, reasons other than unsatisfactory performance).
Remuneration Report – Audited
NEXTDC Limited and controlled entities | FY20 Annual Report 40
For
per
sona
l use
onl
y

5.2 LTI Vesting Outcomes The measurement period for the FY17 LTI was between 23 August 2016 and 29 August 2019. The vesting condition attached to the FY17 LTI was based on NEXTDC’s TSR over the measurement period, against the relative performance of the All Ordinaries Accumulation Index (XAOAI).
NEXTDC’s performance against the vesting conditions is summarised below:
Based on the above assessment, the stretch target was achieved, and the Board, having determined that the participants had been instrumental in the Company’s performance over the vesting period, determined that 100% of the LTI granted in FY17 vested, with rights converting to shares following the release of the FY19 Annual Report. The measurement period for the FY18 LTI is for approximately a three-year period, beginning from the end of trade on the day of release of the FY17 results, and ending upon the end of the day of release of the annual results for FY20. The vesting condition attached to the FY18 LTI is based on NEXTDC’s TSR over the measurement period, against the relative performance of the ASX 200 Accumulation Index (Index).
Given vesting is not able to be determined until the end of day of release of the FY20 annual results, the Board will determine vesting following the release of the FY20 Annual Report.
6. STATUTORY REMUNERATION
6.1 Senior Executive Remuneration The following table outlines the remuneration received or due to be received by Senior Executives of the Company during the 2020 and 2019 financial years and has been prepared in accordance with the Corporations Act and the relevant accounting standards. The figures provided under the LTI are based on accounting values and do not necessarily reflect actual payments received during the year.
16.5%
15.1%
10.1%
TSR achieved
TSR required to achieve stretch hurdle
Market TSR
Remuneration Report – Audited
NEXTDC Limited and controlled entities | FY20 Annual Report 41
For
per
sona
l use
onl
y

6. STATUTORY REMUNERATION (CONTINUED)
TABLE 4: STATUTORY REMUNERATION
Name Year Salary Super- contributions
Non- monetary
benefits
Leave Subtotal STI (2)
benefits (1) % of LTI TRP
Total remuneration
package
Craig Scroggie 2020 1,298,997 21,003 1,792 120,737 1,442,529 990,000 32% 666,861 3,099,390
Simon Cooper 2020 468,998 21,003 1,792 (4,790) 487,003 367,500 32% 284,059 1,138,562
Oskar Tomaszewski 2020 448,998 21,003 - 23,081 493,082 352,500 32% 272,169 1,117,751
Adam Scully* 2020 277,116 15,357 - 10,642 303,115 219,672 33% 133,849 656,636
David Dzienciol 2020 448,998 21,003 - 23,049 493,050 352,500 32% 266,762 1,112,312
Total 2020 2,943,107 99,369 3,584 172,719 3,218,779 2,282,172 32% 1,623,700 7,124,651 *Ceased as KMP on 24 March 2020
Name Year Salary Super- contributions
Non- monetary Leave Subtotal STI benefits (1)
% of LTI TRP
Total remuneration
(1) Leave benefits in the basic package includes the net movement of short-term leave benefits such as annual leave and long-term leave benefits such as long service leave.
(2) 50% of the 2019 and 2020 STI will be deferred for 12 months, with employees being able to elect whether this is delivered in cash or equity.
LTI STI Basic Package
LTI STI Basic package
benefits package Craig Scroggie 2019 1,290,000 30,000 1,966 51,262 1,373,228 226,765 11% 548,249 2,148,242
Simon Cooper 2019 469,469 20,531 1,966 7,755 499,721 84,178 11% 205,332 789,230
Oskar Tomaszewski 2019 449,469 20,531 - 36,739 506,739 80,742 10% 196,492 783,973
Adam Scully 2019 379,469 20,531 - 13,407 413,407 68,717 11% 169,764 651,888
David Dzienciol 2019 449,739 20,531 - 3,911 474,181 80,742 11% 188,075 742,999
Total 2019 3,038,145 112,126 3,931 113,074 3,267,276 541,144 11% 1,307,912 5,116,332
Remuneration Report – Audited
NEXTDC Limited and controlled entities | FY20 Annual Report 42
For
per
sona
l use
onl
y

6.2 Non-Executive Director Remuneration Non-Executive Director fees are managed within the current aggregate fee limit of $1,250,000 which was approved by shareholders at the FY18 AGM in November 2018.
The rates of fees including superannuation contributions in respect of the 2020 financial year are as follows:
TABLE 5: NON-EXECUTIVE DIRECTOR FEE SCHEDULE From 1 January 2020 From 1 July 2019
Board Chair $275,000 per annum $275,000 per annum Non-Executive Director $135,000 per annum $135,000 per annum Audit and Risk Management Committee Chair $30,000 per annum $30,000 per annum Remuneration and Nomination Committee Chair $30,000 per annum $25,000 per annum Investment Committee Chair $30,000 per annum - Committee Member $13,000 per annum $13,000 per annum
The changes in fee structure shown above resulted from a restructure of the Board’s Committees effective 1 January 2020.
A new Investment Committee was established to assist management in reviewing and evaluating proposals in relation to the Group’s investment strategy and opportunities. Steve Smith was appointed as Chair of this Committee, joined by Doug Flynn, Greg Clark and Craig Scroggie as Committee members.
At the same time a number of changes were also made to the composition of the Audit and Risk Management and Remuneration and Nomination Committees.
Jennifer Lambert succeeded Stuart Davis as Chair of the Audit and Risk Management Committee, with Stuart Davis and Sharon Warburton continuing as Committee members. Doug Flynn re-joined the Committee following Sharon’s departure in March 2020.
Stuart Davis succeeded Greg Clark as Chair of the Remuneration and Nomination Committee, with Greg Clark and Doug Flynn continuing as Committee members.
These fees are consistent with the Company’s policy of benchmarking fees at the market median. Remuneration received by Non-Executive Directors in FY20 and FY19 is disclosed below.
TABLE 6: NON-EXECUTIVE DIRECTOR REMUNERATION
Name Financial year Board fees Superannuation Total
Douglas Flynn 2020 283,247 21,003 304,250 Dr Gregory J Clark AC 2020 152,512 14,489 167,001
Stuart Davis 2020 162,557 15,443 178,000
Stephen Smith 2020 134,189 2,060 136,249
Jennifer Lambert 2020 106,164 10,086 116,250
Sharon Warburton 2020 107,306 10,194 117,500
Total 2020 945,975 73,275 1,019,250
Douglas Flynn 2019 274,886 26,114 301,000
Dr Gregory J Clark AC 2019 157,991 15,009 173,000
Stuart Davis 2019 162,557 15,443 178,000
Sharon Warburton 2019 146,462 13,968 160,430
Total 2019 741,896 70,534 812,430
Recommended Non-Executive Director Shareholding Non-Executive Directors are encouraged to accumulate shares on their own behalf, over a three-year period, of equivalent value to their average annual Directors’ fees over the three years.
Remuneration Report – Audited
NEXTDC Limited and controlled entities | FY20 Annual Report 43
For
per
sona
l use
onl
y

6.3 Changes in Securities Held Due to Remuneration
TABLE 7: CHANGES IN SECURITIES HELD DUE TO REMUNERATION
Name Instrument Balance at start of the year
Granted Exercised Lapsed Balance at end of the year
Craig Scroggie Performance Rights 626,514 216,393 - - 842,907 Simon Cooper Performance Rights 234,155 80,328 - - 314,483 Simon Cooper Deferred Rights 18,347 6,899 - - 25,246 Oskar Tomaszewski Performance Rights 224,028 77,049 - - 301,077 Adam Scully* Performance Rights 193,814 - - - N/A David Dzienciol Performance Rights 213,570 77,049 - - 290,619 David Dzienciol Deferred Rights - 6,618 - - 6,618
*Ceased as KMP on 24 March 2020
Remuneration Report – Audited
NEXTDC Limited and controlled entities | FY20 Annual Report 44
For
per
sona
l use
onl
y

Performance Rights The following table details performance rights that have been provided to key management personnel.
TABLE 8: PERFORMANCE RIGHTS PROVIDED TO KEY MANAGEMENT PERSONNEL
Name Financial Year
Granted
Number of Performance
Rights
Vested during the year
Forfieted during the
year
Vested and exercisable
at the end of the year
Unvested at the end of the
year
Craig Scroggie 2017 223,325 (223,325) - 223,325 -
2018 194,987 - - - 194,987
2019 208,202 - - - 208,202
2020 216,393 - - - 216,393
842,907 (223,325) - 223,325 619,582
Simon Cooper 2017 83,747 (83,747) - 83,747 -
2018 73,121 - - - 73,121
2019 77,287 - - - 77,287
2020 80,328 - - - 80,328
314,483 (83,747) - 83,747 230,736
Oskar Tomaszewski 2017 80,025 (80,025) - 80,025 -
2018 69,871 - - - 69,871
2019 74,132 - - - 74,132
2020 77,049 - - - 77,049
301,077 (80,025) - 80,025 221,052
Adam Scully* 2017 69,789 (69,789) - N/A N/A
2018 60,934 - - N/A N/A
2019 63,091 - - N/A N/A
193,814 (69,789) - N/A N/A
David Dzienciol 2017 74,442 (74,442) - 74,442 -
2018 64,996 - - - 64,996
2019 74,132 - - - 74,132
2020 77,049 - - - 77,049
290,619 (74,442) - 74,442 216,177 *Ceased as KMP on 24 March 2020
The fair values of each performance right at grant date are as follows:
Financial year granted Fair value at grant date
2017 $1.63
2018 $3.32
2019 $3.07
2020 $4.61# # Except for Craig Scroggie whose rights were granted at a fair value of $3.30
Remuneration Report – Audited
NEXTDC Limited and controlled entities | FY20 Annual Report 45
For
per
sona
l use
onl
y

Deferred Rights The following table details deferred rights that have been provided to those key management personnel who elected to receive the deferred component of their STI in shares rather than cash.
TABLE 9: DEFERRED RIGHTS PROVIDED TO KEY MANAGEMENT PERSONNEL
Name Financial Year
Granted
Number of Deferred Share
Rights
Vested during the year
Forfeited during the
year
Vested and exercisable at the end of the
year
Unvested at the end of the
year
Simon Cooper 2019 18,347 18,347 - 18,347 -
Simon Cooper 2020 6,899 - - - 6,899
David Dzienciol 2020 6,618 - - - 6,618
Total 31,864 18,347 - 18,347 13,517
The fair value of the deferred rights at grant date is as follows:
Financial year granted Fair value at grant date
2019 $6.34
2020 $6.10
Deferred rights under the Senior Executive STI Plan are granted following release of the annual results. The shares vest one year from the grant date. On vesting, each right automatically converts into one ordinary share. Senior Executives do not receive any dividends and are not entitled to vote in relation to the rights during the vesting period. If a Senior Executive ceases employment before the rights vest, they have six months from the cessation of employment or the vesting date, whichever is later, to exercise their deferred rights. Any rights not exercised in this period will automatically lapse.
The fair value of the rights is determined based on the volume weighted average trading price of the Company’s shares over the 10 trading days following release of the Company’s annual results.
Remuneration Report – Audited
NEXTDC Limited and controlled entities | FY20 Annual Report 46
For
per
sona
l use
onl
y

6.4 Director and Senior Executive Shareholdings During FY20, KMP and their related parties held shares in NEXTDC directly, indirectly or beneficially as follows:
TABLE 10: DIRECTOR AND SENIOR EXECUTIVE SHAREHOLDINGS
Holder
Opening balance
Received during the
year as compensation
Received during the
year on the exercise of
an option or right
Other changes
Closing balance
Shares
held nominally at 30 June
2020
DIRECTORS
Douglas Flynn 152,531 - - 7,692 160,223 160,223
Dr Gregory J Clark AC 62,202 - - 3,846 66,048 66,048
Stuart Davis 34,314 - - 3,846 38,160 38,160
Stephen Smith - - - - - -
Jennifer Lambert - - - 11,846 11,846 11,846
Sharon Warburton 39,202 - - (39,202) - -
SENIOR EXECUTIVES
Craig Scroggie 1,981,499 - - 7,692 1,989,191 383,447
Simon Cooper 211,495 - - 3,846 215,341 14,846
Oskar Tomaszewski 150,610 - - - 150,610 -
Adam Scully* 118,480 - - (118,480) - -
David Dzienciol 208,772 - - 3,846 212,618 - *Ceased as KMP on 24 March 2020
The Non-Executive Directors of the Company did not receive any shares in NEXTDC on behalf of the Company in respect of the 2019 and 2020 financial reporting periods.
Loans to Directors and Executives There were no loans to Directors or other key management personnel at any time during the year.
Remuneration Report – Audited
NEXTDC Limited and controlled entities | FY20 Annual Report 47
For
per
sona
l use
onl
y

6.5 Remuneration Received (Non-statutory)
Remuneration received in FY20
The amounts disclosed below as Senior Executive remuneration for FY20 reflect the actual benefits received by each Senior Executive during the reporting period. The remuneration values disclosed have been determined as follows:
Fixed remuneration Fixed remuneration includes base salaries received, paid leave, payments made to superannuation funds, and the taxable value of non-monetary benefits received, and excludes any accruals of annual or long service leave.
Short-term incentives Cash STI represents bonuses that were awarded to each Senior Executive in relation to FY20 performance, which will be paid in FY21. Starting from FY18, 50% of the STI bonuses awarded are deferred for 12 months, with employees being able to elect whether the award will be delivered in cash or equity.
Long term incentives The value of vested rights was determined based on the intrinsic value of the rights at the date of vesting, being the difference between the share price on that date, and the exercise price payable by the Senior Executive. The performance rights that vested in FY20 were granted in 2017.
TABLE 11: REMUNERATION RECEIVED IN FY20
Name Fixed Remuneration
Awarded STI (cash)
Vested LTI Total Value
Craig Scroggie 1,321,792 495,000 1,377,915 3,194,707
Simon Cooper 491,792 183,750 516,719 1,192,261
Oskar Tomaszewski 470,000 176,250 493,754 1,140,004
Adam Scully* 292,473 109,836 430,598 832,907
David Dzienciol 470,000 176,250 459,307 1,105,557
Total 3,046,057 1,141,086 3,278,293 7,465,436 *Ceased as KMP on 24 March 2020
The amounts disclosed above are not the same as the remuneration expensed in relation to each KMP in accordance with accounting standards. The Directors believe that the remuneration received is more relevant to users for the following reasons:
The statutory remuneration expensed is based on historic cost and does not reflect the value of the equity instrumentswhen they are actually received by the Senior Executives
The statutory remuneration shows benefits before they are actually received by the Senior Executives Where rights do not vest because a market-based performance condition is not satisfied (eg. TSR), the company must
still recognise the full amount of expenses even though the Senior Executives will never receive any benefits Share based payment awards are treated differently under the accounting standards depending on whether the
performance conditions are market conditions (no reversal of expense) or non-market conditions (reversal of expensewhen shares fail to vest), even though the benefit received by the Senior Executives is the same (nil where equityinstruments fail to vest).
The information in this section has been audited together with the rest of the remuneration report.
Remuneration Report – Audited
NEXTDC Limited and controlled entities | FY20 Annual Report 48
For
per
sona
l use
onl
y

Audit and non-audit services Details of the amounts paid or payable to the auditor (PricewaterhouseCoopers Australia) for audit and non-audit services during the year are disclosed in Note 23 Remuneration of auditors.
The company may decide to employ the auditor on assignments additional to their statutory audit duties where the auditor’s expertise and experience with the company and/or the group are important.
The board of directors, in accordance with advice provided by the Audit and Risk Management Committee, is satisfied that the provision of the non-audit services is compatible with the general standard of independence for auditors imposed by the Corporations Act 2001. The directors are satisfied that the provision of non-audit services by the auditor did not compromise the auditor independence requirements of the Corporations Act 2001 for the following reasons:
all non-audit services have been reviewed by the Audit and Risk Management Committee to ensure they do notimpact the impartiality and objectivity of the auditor, and
none of the services undermine the general principles relating to auditor independence as set out in APES 110Code of Ethics for Professional Accountants.
Auditor’s independence declaration A copy of the auditor’s independence declaration as required under section 307C of the Corporations Act 2001 is set out on page 50.
Auditor PricewaterhouseCoopers continues in office in accordance with section 327 of the Corporations Act 2001. This
report is made in accordance with a resolution of the Directors.
Craig Scroggie Managing Director and Chief Executive Officer
27 August 2020
Directors' Report
NEXTDC Limited and controlled entities | FY20 Annual Report 49
For
per
sona
l use
onl
y

Auditor’s Independence Declaration As lead auditor for the audit of NEXTDC Limited for the year ended 30 June 2020, I declare that to the best of my knowledge and belief, there have been:
(a) no contraventions of the auditor independence requirements of the Corporations Act 2001 inrelation to the audit; and
(b) no contraventions of any applicable code of professional conduct in relation to the audit.
This declaration is in respect of NEXTDC Limited and the entities it controlled during the period.
Michael Shewan Brisbane Partner PricewaterhouseCoopers
27 August 2020
PricewaterhouseCoopers, ABN 52 780 433 757 480 Queen Street, BRISBANE QLD 4000, GPO Box 150, BRISBANE QLD 4001 T: +61 7 3257 5000, F: +61 7 3257 5999, www.pwc.com.au
Liability limited by a scheme approved under Professional Standards Legislation.
NEXTDC Limited and controlled entities | FY20 Annual Report 50
For
per
sona
l use
onl
y

NEXTDC has established a strong governance framework and continues to be committed to a high level of integrity and ethical standards in all its business practices. Effective and transparent corporate governance is of critical importance to NEXTDC and its Board of Directors (“the Board”). The Board fully supports the intent of the Australian Securities Exchange (“ASX”) Corporate Governance Council’s new 4th edition of Corporate Governance Principles and Recommendations (“4th Edition Governance Principles”). NEXTDC meets all the requirements of 4th Edition Governance Principles.
At NEXTDC, corporate governance refers to the overarching monitoring and reporting environment that supports everything the Company does in the operations of its business. It is the combination of processes, metrics and structures implemented and monitored by the Board and CXO team to inform, direct, manage and scrutinise the Company’s activities to meet its strategic objectives. This provides evidence to investors and Australian Securities & Investments Commission (ASIC) that the Company:
▪ Complies with legislation such as the Corporations Act
▪ Meets expectations as a company listed on the ASX; and
▪ Manages the company, funded by investors, in accordance with best practices.
This is important given that investors want to have confidence that the Company is being managed properly. Elements of NEXTDC’s Corporate Governance to ensure it stays on track to meet strategic objectives include:
▪ An effective risk management framework and internal controls
▪ Procedures, processes and structures, including policies relating to code of conduct, the stock market and businessoperations (e.g. Whistleblower Policy, Anti-bribery and Corruption Policy, Shareholder Communications Policy, ContinuousDisclosure Policy, Energy and Environmental Policy, Information Security Policy, WHS Policy)
▪ Regular reporting to the Board and Senior Executives from department heads to understand how NEXTDC is performing asa company and how NEXTDC is managing its risks
▪ Undertaking internal audits against best practice standards to independently review corporate governance, risks andcontrols, and implement continuous improvements if any gaps are identified; and
▪ Ensuring a sufficient level of management and oversight. Corporate governance roles and responsibilities have beendelegated to various committees and outlined in respective charters at the Board level, Senior Executive level and seniormanagement level.
NEXTDC’s Corporate Governance Framework continues to evolve as it seeks continual improvement in the way it conducts its business. Further details on how NEXTDC’s Corporate Governance aligns with the 4 th Edition Governance Principles can be found in the Company’s FY20 Corporate Governance Statement and Appendix 4G available at www.nextdc.com/our-company/corporate-governance
CORPORATE GOVERNANCE STATEMENT
NEXTDC Limited and controlled entities | FY20 Annual Report 51
For
per
sona
l use
onl
y

NEXTDC LimitedABN 35 143 582 521
Financial reportfor the year ended 30 June 2020
NEXTDC Limited and controlled entities | FY20 Annual Report 52
For
per
sona
l use
onl
y

Financial Report
These financial statements are the consolidated financial statements of the consolidated entity consisting ofNEXTDC Limited (ABN 35 143 582 521) and its subsidiaries. A list of major subsidiaries is included in note 24.NEXTDC Limited is a company limited by shares, incorporated and domiciled in Australia. The financialstatements are presented in the Australian currency.
NEXTDC’s registered office is:20 Wharf St Brisbane QLD 4000
A description of the nature of the consolidated entity's operations and its principal activities is included in theDirectors' Report, which is not part of these financial statements.
The financial statements were authorised for issue by the Directors on 27 August 2020.
The Directors have the power to amend and reissue the financial statements.
Consolidated Statement of Comprehensive Income 54Consolidated Balance Sheet 55Consolidated Statement of Changes in Equity 56Consolidated Statement of Cash Flows 57Notes to the Consolidated Financial Report 58Directors' Declaration 98Independent Auditor's Report to the Members 99Shareholder information 105Corporate directory 107
NEXTDC Limited and controlled entities | FY20 Annual Report 53
For
per
sona
l use
onl
y

Consolidated Statement of Comprehensive IncomeFor the year ended 30 June 2020
Note
30 June2020$'000
30 June2019$'000
REVENUE FROM CONTINUING OPERATIONSData centre services revenue 3 200,778 169,696Other revenue 3 4,447 9,564Total revenue 205,225 179,260
OTHER INCOMEOther income 3 556 3,034
EXPENSESDirect costs (38,052) (33,197)Employee benefits expense (34,015) (30,503)Data centre facility costs (11,423) (9,422)Depreciation and amortisation expense (69,078) (48,442)Professional fees 4 (2,221) (7,003)Marketing costs (568) (465)Office and administrative expenses 4 (11,459) (14,438)Finance costs 4 (57,705) (54,897)Profit/(loss) before income tax (18,740) (16,073)
Income tax benefit/(expense) 20 (26,434) 6,254Profit/(loss) after income tax (45,174) (9,819)
PROFIT/(LOSS) IS ATTRIBUTABLE TO:Owners of NEXTDC Limited (45,174) (9,819)OTHER COMPREHENSIVE INCOMEItems that will not be reclassified to profit or loss - -Changes in the fair value of equity investments at fair value through othercomprehensive income - 4,654Items that may be reclassified to profit or loss - -Exchange differences on translation of foreign operations (63) 127Total comprehensive income (45,237) (5,038)
Attributable to:Owners of NEXTDC Limited (45,237) (5,038)
Cents Cents
EARNINGS/(LOSS) PER SHARE FOR PROFIT/(LOSS)ATTRIBUTABLE TO THE ORDINARY EQUITY HOLDERS OF THEGROUP:Basic earnings/(loss) per share 2 (12.61) (2.86)Diluted earnings/(loss) per share 2 (12.61) (2.86)
The notes following the financial statements form part of the financial report.
NEXTDC Limited and controlled entities | FY20 Annual Report 54
For
per
sona
l use
onl
y

Consolidated Balance SheetAs at 30 June 2020
Note
30 June2020$'000
30 June2019$'000
ASSETSCURRENT ASSETSCash and cash equivalents 892,939 398,999Trade and other receivables 5 45,065 33,856Other assets 6 18,110 14,432Total current assets 956,114 447,287
NON-CURRENT ASSETSProperty, plant and equipment 8 1,670,815 1,328,473Other assets 6 3,344 4,898Intangible assets 9 29,284 23,678Deferred tax assets 21 - 21,552Total non-current assets 1,703,443 1,378,601
TOTAL ASSETS 2,659,557 1,825,888
LIABILITIESCURRENT LIABILITIESTrade and other payables 7 64,885 56,646Other liabilities 2 1Lease liabilities 10 5,057 4,949Revenue received in advance 7,088 5,819Unsecured notes 14 301,811 -Total current liabilities 378,843 67,415
NON-CURRENT LIABILITIESProvisions 1,292 964Revenue received in advance 27,758 19,978Borrowings 14 496,426 793,849Lease liabilities 10 71,777 68,379Total non-current liabilities 597,253 883,170
TOTAL LIABILITIES 976,096 950,585
NET ASSETS 1,683,461 875,303
EQUITYContributed equity 12 1,757,262 905,117Reserves 7,612 6,412Accumulated losses (81,413) (36,226)
TOTAL EQUITY 1,683,461 875,303
The notes following the financial statements form part of the financial report.
NEXTDC Limited and controlled entities | FY20 Annual Report 55
For
per
sona
l use
onl
y

Consolidated Statement of Changes in EquityFor the year ended 30 June 2020
Note
Contributedequity$'000
Reserves
$'000
Accumulatedlosses$'000
Totalequity$'000
Balance at 1 July 2018 904,247 6,005 (16,275) 893,977
Adoption of AASB 15 and 16 - - (14,786) (14,786)Restated total equity at the beginning of the financialyear 904,247 6,005 (31,061) 879,191
Profit/(loss) for the year - - (9,819) (9,819)Transfer to accumulated losses - (4,654) 4,654 -Other comprehensive income - 4,781 - 4,781Total comprehensive income - 127 (5,165) (5,038)
TRANSACTIONS WITH OWNERS IN THEIRCAPACITY AS OWNERS:Contributions of equity, net of transaction costs and tax 12(b) (996) - - (996)Acquisition of treasury shares (38) - - (38)Share based payments - conversion of rights to shares 1,904 (1,904) - -Share based payments - value of employee services 19(c) - 2,068 - 2,068Share based payments - deferred STI - 116 - 116Balance at 30 June 2019 905,117 6,412 (36,226) 875,303
Note
Contributedequity$'000
Reserves
$'000
Accumulatedlosses$'000
Totalequity$'000
Balance at 1 July 2019 905,117 6,412 (36,226) 875,303
Profit/(loss) for the year - - (45,174) (45,174)Other comprehensive income - (50) (13) (63)Total comprehensive income - (50) (45,187) (45,237)
TRANSACTIONS WITH OWNERS IN THEIRCAPACITY AS OWNERS:Contributions of equity, net of transaction costs and tax 12(b) 850,634 - - 850,634Share based payments - conversion of rights to shares 12(b) 1,395 (1,395) - -Share based payments - value of employee services 19(c) - 2,761 - 2,761Share based payments - deferred STI 116 (116) - -Balance at 30 June 2020 1,757,262 7,612 (81,413) 1,683,461
The notes following the financial statements form part of the financial report.
NEXTDC Limited and controlled entities | FY20 Annual Report 56
For
per
sona
l use
onl
y

Consolidated Statement of Cash FlowsFor the year ended 30 June 2020
Note
30 June2020$'000
30 June2019$'000
OPERATING ACTIVITIESReceipts from customers (inclusive of GST) 217,317 196,442Payments to suppliers and employees (inclusive of GST) (115,430) (101,753)
101,887 94,689Transaction costs relating to acquisition of subsidiary - (8,957)Interest paid (51,091) (51,238)Distributions received - 1,344(Payments for)/proceeds from bank guarantees (996) (4,671)Interest received 4,144 8,194Net cash inflow from operating activities 22(a) 53,944 39,361
INVESTING ACTIVITIESPayments for acquisition of subsidiary, net of cash acquired - (153,852)Payments for property, plant and equipment (397,833) (347,146)Payments for financial assets at fair value through other comprehensiveincome - (1,008)Payments for intangible assets (7,097) (12,161)Net cash (outflow) from investing activities (404,930) (514,167)
FINANCING ACTIVITIESProceeds from issue of Notes - 500,750Repayment of borrowings - (29,000)Transaction costs in relation to loans and borrowings (439) (9,186)Proceeds from issues of shares and other equity securities 12(b) 862,024 -Payments for acquisition of non-controlling interest - (5,380)Transaction costs paid in relation to issue of shares 12(b) (16,272) (241)Principal elements of lease payments (387) (1,082)Acquisition of treasury shares - (38)Net cash inflow from financing activities 844,926 455,823
Net increase/(decrease) in cash and cash equivalents 493,940 (18,983)Cash and cash equivalents at the beginning of the year 398,999 417,982Cash and cash equivalents at the end of the year 892,939 398,999
The notes following the financial statements form part of the financial report.
NEXTDC Limited and controlled entities | FY20 Annual Report 57
For
per
sona
l use
onl
y
Notes to the Consolidated Financial Report30 June 2020
Contents of the notes to the consolidated financial report
Page
BUSINESS PERFORMANCE 60
1 Segment performance 60
2 Earnings/(loss) per share 62
3 Revenue and other income 63
4 Expenses 65
OPERATING ASSETS AND LIABILITIES 66
5 Trade and other receivables 66
6 Other assets 66
7 Trade and other payables 67
8 Property, plant and equipment 68
9 Intangible assets 69
10 Leases 71
CAPITAL AND FINANCIAL RISK MANAGEMENT 73
11 Capital risk management 73
12 Contributed equity 73
13 Financial risk management 76
14 Borrowings 80
ITEMS NOT RECOGNISED 81
15 Commitments 81
16 Contingencies 81
17 Events occurring after the reporting period 81
EMPLOYEE REMUNERATION 82
18 Key management personnel 82
19 Share-based payments 82
OTHER 84
20 Income tax 84
21 Deferred tax 86
22 Cash flow information 87
23 Remuneration of auditors 88
24 Interests in other entities 89
25 Parent entity financial information 90
26 Summary of significant accounting policies 91
NEXTDC Limited and controlled entities | FY20 Annual Report 58
For
per
sona
l use
onl
y

Notes to the Consolidated Financial Report30 June 2020(continued)
(a) Basis of preparation
The 2020 financial statements notes have been grouped into the following sections:
• Section 1 Business performance• Section 2 Operating assets and liabilities• Section 3 Capital and financial risk management• Section 4 Items not recognised• Section 5 Employee remuneration• Section 6 Other
Each section sets out the accounting policies applied along with details of any key judgements and estimatesmade or information required to understand the note.
NEXTDC Limited (the Company) is domiciled in Australia. The registered office is 20 Wharf St, Brisbane QLD4000.
The nature of the operations and principal activities of the Company and its controlled entities (referred to as ‘theGroup’) are described in the Segment information.
The consolidated general purpose financial statements of the Group for the year ended 30 June 2020 wereauthorised for issue in accordance with a resolution of the Directors on 27 August 2020.
The financial statements:
• Have been prepared in accordance with the requirements of the Corporations Act 2001 (Cth), AustralianAccounting Standards and other authoritative pronouncements of the Australian Accounting Standards Board(AASB) and International Financial Reporting Standards as issued by the International Accounting StandardsBoard
• Have been prepared on a historical cost basis
• Are presented in Australian dollars and, unless otherwise stated, all values have been rounded to the nearestthousand dollars ($'000) under the option available under the Australian Securities and Investments Commission(ASIC) Corporations (Rounding in Financial/Directors' Report) Instrument 2016/191
• Present reclassified comparative information where required for consistency with the current year’s presentation
• Adopt all new and amended Accounting Standards and Interpretations issued by the AASB that are relevant tothe operations of the Group and effective for reporting periods beginning on or after 1 July 2019
• Do not early adopt any other Accounting Standards and Interpretations that have been issued or amended butare not yet effective.
NEXTDC Limited and controlled entities | FY20 Annual Report 59
For
per
sona
l use
onl
y

Notes to the Consolidated Financial Report30 June 2020(continued)
Business performance
1 Segment performance
(a) Description of segments
Management considers the business from a geographic perspective and has identified six reportable segments,the first five being each state or territory where the Group operates data centre facilities and the last capturingfinancial information from operations that do not naturally fit into any particular geography. These segments donot exist as a separate legal entity, consequently, information such as income tax expense and segment liabilitiesare not prepared and provided to management for review and therefore not presented.
(b) Segment information provided to management
The segment information provided to management for the reportable segments is as follows:
30 June 2020 Vic NSW Qld WA ACT Other Total$'000 $'000 $'000 $'000 $'000 $'000 $'000
Revenue from externalcustomers 72,497 84,416 21,763 17,870 1,968 2,264 200,778Direct and facility costs (16,742) (22,192) (4,947) (3,748) (1,299) (547) (49,475)Employee benefits expense (2,073) (2,159) (1,604) (1,289) (846) (870) (8,841)Other expenses (177) (142) (106) (108) (129) (1,094) (1,756)Segment EBITDA 53,505 59,923 15,106 12,725 (306) (247) 140,706
Depreciation and amortisation (19,124) (25,824) (7,269) (6,269) (5,118) (620) (64,224)Finance charge - (1,325) - - (3,913) (6) (5,244)Segment profit/(loss) beforetax 34,381 32,774 7,837 6,456 (9,337) (873) 71,238
Segment assets 386,231 776,128 128,990 240,832 89,945 9,633 1,631,759Unallocated assets - - - - - 1,027,798 1,027,798Total segment assets 386,231 776,128 128,990 240,832 89,945 1,037,431 2,659,557
(458,728) (860,544) (150,753) (258,702) (91,913)(1,039,695)(2,860,335)30 June 2019 Vic NSW Qld WA ACT Other Total
$'000 $'000 $'000 $'000 $'000 $'000 $'000
Revenue from externalcustomers 68,686 63,050 18,987 14,872 2,146 1,955 169,696Direct and facility costs (16,053) (17,134) (4,471) (3,173) (1,253) (535) (42,619)Employee benefits expense (1,907) (1,604) (1,539) (950) (808) (659) (7,467)Other expenses (174) (122) (122) (88) (121) (752) (1,379)Segment EBITDA 50,552 44,190 12,855 10,661 (36) 9 118,231
Depreciation and amortisation (15,586) (12,743) (6,742) (5,027) (4,886) (1,379) (46,363)Finance charge (1,380) (2,908) (384) (729) (3,878) (6) (9,285)Segment profit/(loss) beforetax 33,586 28,539 5,729 4,905 (8,800) (1,376) 62,583
Segment assets 344,837 587,684 133,476 153,919 91,677 10,137 1,321,730Unallocated assets - - - - - 504,158 504,158Total segment assets 344,837 587,684 133,476 153,919 91,677 514,295 1,825,888
(395,389) (631,874) (146,331) (164,580) (91,641) (514,304)(1,944,119)There was no impairment charge or other significant non-cash item recognised in 2020 (2019: nil).
NEXTDC Limited and controlled entities | FY20 Annual Report 60
For
per
sona
l use
onl
y

Notes to the Consolidated Financial Report30 June 2020(continued)
1 Segment performance (continued)
(c) Other segment information
(i) Profit/(loss) before tax
Management assesses the performance of the operating segments based on a measure of EBITDA. Interestincome and expenditure are not allocated to segments, as this type of activity is driven by the central treasuryfunction, which manages the cash position of the Group.
A reconciliation of profit/(loss) before income tax is provided as follows:30 June
2020$'000
30 June2019$'000
Total segment profit before tax 71,238 62,583Employee benefits expense (non-facility staff) (25,174) (23,036)Interest revenue 4,447 8,220Distributions from investments - 1,344Other income 556 3,034Finance costs (52,461) (45,612)Head office depreciation (4,854) (2,079)Overheads and other expenses (12,492) (20,527)Profit/(loss) before tax (18,740) (16,073)
A reconciliation of depreciation and amortisation is provided as follows:30 June
2020$'000
30 June2019$'000
Segment depreciation and amortisation expense 64,224 46,363Head office depreciation and amortisation expense 4,854 2,079Total depreciation and amortisation expense 69,078 48,442
(ii) Segment liabilities
As noted above, the segment liabilities for each operating segment are not required by executive managementfor purposes of their decision making. As such, these are not provided to management and not categorised.
(d) Segment reporting
Operating segments are reported in a manner consistent with the internal reporting provided to the executivemanagement team. The executive team is responsible for allocating resources and assessing performance of theoperating segments. The executive team is the chief operating decision making body and consists of the ChiefExecutive Officer, Chief Operating Officer, Chief Financial Officer, and Chief Customer and Commercial Officer.
NEXTDC Limited and controlled entities | FY20 Annual Report 61
For
per
sona
l use
onl
y

Notes to the Consolidated Financial Report30 June 2020(continued)
2 Earnings/(loss) per share
(a) Earnings/(loss) per share
30 June2020Cents
30 June2019Cents
Total basic EPS attributable to the ordinary equity holders of the Group (12.61) (2.86)
(b) Diluted earnings/(loss) per share
Total diluted EPS attributable to the ordinary equity holders of the Group (12.61) (2.86)
(c) Reconciliation of earnings/(loss) used in calculating earnings per share
30 June2020$'000
30 June2019$'000
BASIC EARNINGS/(LOSS) PER SHAREProfit/(loss) attributable to equity holders of the Group used in calculating basicEPS:Profit/(loss) used in calculating basic earnings/(loss) per share (45,174) (9,819)
DILUTED EARNINGS/(LOSS) PER SHAREProfit/(loss) from continuing operations attributable to the equity holders of theGroup:Used in calculating diluted earnings/(loss) per share (45,174) (9,819)Profit/(loss) attributable to the equity holders of the Group used incalculating diluted EPS (45,174) (9,819)
(d) Weighted average number of shares used as the denominator
2020Number of
shares
2019Number of
shares
Weighted average number of ordinary shares used as the denominator incalculation basic earnings/(loss) per share 358,311,401 342,913,254Plus potential ordinary shares - -Weighted average number of ordinary shares and potential ordinary shares usedas the denominator in calculating diluted earnings/(loss) per share 358,311,401 342,913,254
(e) Information concerning the classification of securities
(i) Performance rights and deferred rights
The number of performance rights and deferred rights included in the diluted earnings per share calculation isbased on the number of shares that would be issuable if the end of the period were the end of the vesting period.However, they are not included in the calculation where the inclusion would result in a decreased loss per shareor increased earnings per share.
NEXTDC Limited and controlled entities | FY20 Annual Report 62
For
per
sona
l use
onl
y

Notes to the Consolidated Financial Report30 June 2020(continued)
2 Earnings/(loss) per share (continued)(f) Earnings/(loss) per share
(i) Basic earnings/(loss) per share
• the profit/(loss) attributable to owners of the Group, excluding any costs of servicing equity other thanordinary shares
• by the weighted average number of ordinary shares outstanding during the financial year.
(ii) Diluted earnings/(loss) per share
Diluted earnings/(loss) per share adjusts the figures used in the determination of basic earnings per share to takeinto account the weighted average number of additional ordinary shares that would have been outstandingassuming the conversion of all dilutive potential ordinary shares.
3 Revenue and other income
30 June2020$'000
30 June2019$'000
FROM CONTINUING OPERATIONSData centre services revenue 200,778 169,696
Interest income 4,447 8,220Distributions from investments - 1,344Subtotal - other revenue 4,447 9,564
Total revenue 205,225 179,260
Gain on re-assessment of lease under AASB 16 199 -Gain on extinguishment of B1 lease - 1,068Gain on extinguishment of APDC leases - 1,291Other items included in gains 357 675Total other income 556 3,034space(a) Revenue recognised in relation to contract liabilities
The following table shows how much of the revenue recognised in the current reporting period relates tocarried-forward revenue received in advance.
30 June2020$'000
30 June2019$'000
Revenue recognised that was included in the contract liability balance at thebeginning of the yearData centre services revenue 5,008 4,293
NEXTDC Limited and controlled entities | FY20 Annual Report 63
For
per
sona
l use
onl
y

Notes to the Consolidated Financial Report30 June 2020(continued)
3 Revenue and other income (continued)
(b) Revenue recognition
AASB 15 establishes principles for reporting the nature, amount, timing, and uncertainty of revenue and cashflows arising from an entity’s contracts with customers and requires application of a five-step process to identifythe contract with the customer, identify performance obligations in the contract, determine transaction price,allocate the transaction price to the performance obligations and recognise revenue when performanceobligations are satisfied.
Revenue is recognised for the major business activities as follows:
(i) Data centre services
Data centre services revenue primarily consist of recurring monthly service fees and upfront project fees.
Revenue from the provision of recurring monthly service fees is recognised in the accounting period in which theservices are rendered. Project fees primarily comprise installation services relating to a customer’s initialdeployment. As this is not considered to be a distinct service, revenue is deferred and recognised over the termof the contract with the customer, taking into account renewal options that are held by the customer.
The Group applies the practical expedient in the revenue standard and does not disclose information about thetransaction price allocated to remaining performance obligations on contracts that are unsatisfied, as the Grouphas the right to consideration from its customers in an amount that corresponds directly with the value to thecustomer of the Group’s services to date. This is applied to all its data centre services revenue, on the basis thatthe upfront project fees are not a significant portion of each contract.
The Group enters into contracts with customers that guarantee certain performance measures such as uptimeand on time delivery of services. If these guarantees of service performance are not achieved, the Group reducesrevenue for any credits or cash payments that may be due to customers under contract. Key areas of estimationinclude the amount of the service credits, the likelihood that the service credits will be claimed, and the timeperiod over which they impact revenue.
Customer incentives provided by way of upfront discounts are contract assets that are amortised via a reductionin revenue over the expected contract life - refer to Note 6(b).
(ii) Interest income
Interest income is calculated by applying the effective interest rate to the gross carrying amount of a financialasset, except for financial assets that subsequently become credit-impaired. For credit-impaired financial assets,the effective interest rate is applied to the net carrying amount of the financial asset (after deduction of the lossallowance).
(iii) Distributions from investments
Distributions from investments are recognised as revenue when the right to receive payment is established.
NEXTDC Limited and controlled entities | FY20 Annual Report 64
For
per
sona
l use
onl
y

Notes to the Consolidated Financial Report30 June 2020(continued)
4 Expenses
The Group has identified a number of significant expense items below that impacted financial performance for theyear:
Note
30 June2020$'000
30 June2019$'000
EXPENSEFinance costs 4(a) (57,705) (54,897)APDC transaction costs (included in Professional fees) - (5,459)Landholder duty on acquisition of APDC properties (included in Office andadministrative expenses) - (3,498)
(a) Finance costs
Included in finance costs are costs related to unsecured notes on issue and interest expense on lease liabilities.
Refer to note 14 for details on unsecured notes on issue and note 10 for details on interest expense on leaseliabilities for the year.
NEXTDC Limited and controlled entities | FY20 Annual Report 65
For
per
sona
l use
onl
y

Notes to the Consolidated Financial Report30 June 2020(continued)
Operating assets and liabilities
5 Trade and other receivables
Note
30 June2020$'000
30 June2019$'000
Trade receivables 5(a) 37,901 28,320Loss allowance 13(b) (1,349) (741)
36,552 27,579
Interest receivable 5(b) 356 54GST receivable 4,963 6,222Other receivables 3,194 1Total 45,065 33,856
(a) Trade receivables
(i) Classification as trade receivables
Trade receivables are amounts due from customers for goods sold or services performed in the ordinary courseof business. They are generally due for settlement within 30 - 60 days and therefore are all classified as current.Trade receivables are recognised initially at the amount of consideration that is unconditional unless they containsignificant financing components, when they are recognised at fair value. The Group holds the trade receivableswith the objective to collect the contractual cash flows and therefore measures them subsequently at amortisedcost using the effective interest method.
(ii) Fair values of trade and other receivables
Due to the short-term nature of the trade and other receivables, their carrying amount is considered to be thesame as their fair value.
(iii) Impairment and risk exposure
Information about the Group's impairment policies, calculation of loss allowance and exposure to credit risk,foreign currency risk and interest rate risk can be found in note 13.
(b) Interest receivable
Interest receivable relates to interest accrued on term deposits. Credit risk of this is assessed in the samemanner as cash and cash equivalents which is detailed in note 13.
6 Other assets
30 June2020$'000
30 June2019$'000
CURRENTPrepayments 4,312 2,631Capitalised transaction costs 1,492 1,496Security deposits 6(a) 10,724 8,822Customer incentives 6(b) 601 625Other current assets 478 412Contract costs 6(c) 503 446Total other assets - current 18,110 14,432
NEXTDC Limited and controlled entities | FY20 Annual Report 66
For
per
sona
l use
onl
y

Notes to the Consolidated Financial Report30 June 2020(continued)
6 Other assets (continued)
30 June2020$'000
30 June2019$'000
NON-CURRENTCustomer incentives 6(b) 921 1,091Capitalised transaction costs 1,868 3,359Contract costs 6(c) 555 448Total other assets - non-current 3,344 4,898
(a) Security deposits
Included in the security deposits was $9.8 million (2019: $8.8 million) relating to deposits held as security forbank guarantees.
(b) Customer incentives
Where customers are offered incentives in the form of free or discounted periods, the dollar value of the incentiveis capitalised and amortised on a straight-line basis over the expected life of the contract.
(c) Contract costs
Eligible costs that are expected to be recovered are capitalised as a contract cost and amortised over theexpected customer life.
7 Trade and other payables
30 June2020$'000
30 June2019$'000
Trade payables 32,665 44,840Accrued capital expenditure 25,205 5,841Accrued expenses 3,218 2,848Other creditors 3,797 3,117Total trade and other payables 64,885 56,646
(i) Recognition and measurement
Trade and other payables, including accruals, are recorded when the Group is required to make future paymentsas a result of purchases of assets or services provided to the Group prior to the end of financial period. Theamounts are unsecured and are usually paid within 30 days of recognition. Trade and other payables arepresented as current liabilities unless payment is not due within 12 months from the reporting date. They arerecognised initially at their fair value and subsequently measured at amortised cost using the effective interestmethod.
(ii) Fair values of trade and other payables
Due to the short-term nature of trade and other payables, their carrying amount is considered to be the same astheir fair value.
(iii) Risk Exposure
As the majority of payables are in Australian dollars, management does not believe there are any significant risksin relation to these financial liabilities. Refer to note 13 for details of the Group’s financial risk managementpolicies.
NEXTDC Limited and controlled entities | FY20 Annual Report 67
For
per
sona
l use
onl
y

Notes to the Consolidated Financial Report30 June 2020(continued)
8 Property, plant and equipment
Movements
Assetsin the
course ofconstruction
$'000
Land andbuildings
$'000
Plant andmachinery
$'000
Computerequipment
$'000
Officefurniture
andequipment
$'000
Right ofuse assets
$'000Total$'000
30 June 2020Opening net bookamount 363,445 506,439 370,977 7,908 1,180 78,524 1,328,473Additions 384,167 21,501 711 98 5 4,094 410,576Depreciation charge - (12,126) (47,594) (3,538) (389) (3,733) (67,380)Disposal (81) - (3) (34) (25) (711) (854)Transfers (524,156) 237,577 281,593 4,427 559 - -Closing net bookamount 223,375 753,391 605,684 8,861 1,330 78,174 1,670,815
Cost 223,375 773,053 769,118 20,166 2,630 85,415 1,873,757Accumulateddepreciation - (19,662) (163,434) (11,305) (1,300) (7,241) (202,942)Net book amount 223,375 753,391 605,684 8,861 1,330 78,174 1,670,815
Assetsin the
course ofconstruction
$'000
Land andbuildings
$'000
Plant andmachinery
$'000
Computerequipment
$'000
Officefurniture
andequipment
$'000
Right ofuse assets
$'000Total$'000
30 June 2019Opening net bookamount 93,055 202,981 375,629 7,072 1,213 - 679,950Opening BalanceAASB 16 Adjustment - - - - - 271,230 271,230Acquisition ofsubsidiary - 257,525 3,475 7 - - 261,007Additions 365,103 - 701 136 56 257 366,253Depreciation charge - (5,571) (32,830) (3,029) (338) (5,558) (47,326)Disposal - - (4) (64) - (202,573) (202,641)Transfers (94,713) 56,573 34,078 3,786 249 27 -Transfers betweenclasses - (5,069) (10,072) - - 15,141 -Closing net bookamount 363,445 506,439 370,977 7,908 1,180 78,524 1,328,473
Cost 363,445 513,973 488,080 16,753 2,303 82,647 1,467,201Accumulateddepreciation - (7,534) (117,103) (8,845) (1,123) (4,123) (138,728)Net book amount 363,445 506,439 370,977 7,908 1,180 78,524 1,328,473
(a) Property, plant and equipment
Land and buildings are shown at historical cost less any accumulated depreciation and any accumulatedimpairment losses.
NEXTDC Limited and controlled entities | FY20 Annual Report 68
For
per
sona
l use
onl
y

Notes to the Consolidated Financial Report30 June 2020(continued)
8 Property, plant and equipment (continued)
(a) Property, plant and equipment (continued)
Property, plant and equipment is stated at historical cost less depreciation. Costs capitalised include externaldirect costs of materials and services and employee costs.
Subsequent costs are included in the asset's carrying amount or recognised as a separate asset, as appropriate,only when it is probable that future economic benefits associated with the item will flow to the Group and the costof the item can be measured reliably. The carrying amount of any component accounted for as a separate assetis derecognised when replaced. All other repairs and maintenance are charged to profit or loss during thereporting year in which they are incurred.
Depreciation on other assets is calculated using the straight-line method to allocate their cost, net of their residualvalues, over their estimated useful lives as follows:
Category Useful lifeBuildings 40 yearsPlant and machinery 2-25 yearsComputer equipment 1-15 yearsOffice furniture and equipment 5-10 yearsRight-of-use assets 2-42 years
The assets' residual values and useful lives are reviewed, and adjusted if appropriate, at the end of eachreporting year.
An asset’s carrying amount is written down immediately to its recoverable amount if the asset’s carrying amountis greater than its estimated recoverable amount. Gains and losses on disposals are determined by comparingproceeds with carrying amount. These are included in the Consolidated Statement of Comprehensive Income.
9 Intangible assets
30 June2020$'000
30 June2019$'000
Rights and licences 13 13Internally generated software 16,156 7,381Software under development 13,115 16,284Total intangible assets 29,284 23,678
Movements
Rights andlicenses
$'000
Internallygeneratedsoftware
$'000
Softwareunder
development$'000
Total$'000
30 June 2020Opening net book amount at 1 July 2019 13 7,381 16,284 23,678Additions – internally developed - - 7,304 7,304Amortisation - (1,698) - (1,698)Transfers - 10,473 (10,473) -Closing net book amount 13 16,156 13,115 29,284
At 30 June 2020Cost 13 23,434 13,115 36,562Accumulated amortisation - (7,278) - (7,278)Net book amount 13 16,156 13,115 29,284
NEXTDC Limited and controlled entities | FY20 Annual Report 69
For
per
sona
l use
onl
y

Notes to the Consolidated Financial Report30 June 2020(continued)
9 Intangible assets (continued)
Rights andlicences
$'000
Internallygeneratedsoftware
$'000
Softwareunder
development$'000
Total$'000
30 June 2019Opening net book amount at 1 July 2018 13 6,385 6,509 12,907Additions – internally developed - - 11,896 11,896Amortisation - (1,116) - (1,116)Transfer between classes - 2,121 (2,121) -Disposals - (9) - (9)Closing net book amount 13 7,381 16,284 23,678
At 30 June 2019Cost 13 12,961 16,284 29,258Accumulated amortisation - (5,580) - (5,580)Net book amount 13 7,381 16,284 23,678
(a) Intangible assets
RIGHTS AND LICENCES
Certain licences that NEXTDC possesses have an indefinite useful life and are carried at cost less impairmentlosses and are subject to impairment review at least annually and whenever there is an indication that it may beimpaired.
Other licences that NEXTDC acquires are carried at cost less accumulated amortisation and accumulatedimpairment losses. Amortisation is recognised on a straight-line basis over the estimated useful life which isgenerally 25 years. The estimated useful life and amortisation method are reviewed at the end of each annualreporting period.
INTERNALLY GENERATED SOFTWARE
Internally developed software is capitalised at cost less accumulated amortisation. Amortisation is calculatedusing the straight-line basis over the asset’s useful economic life which is generally four to seven years. Theiruseful lives and potential impairment are reviewed at the end of each financial year.
SOFTWARE UNDER DEVELOPMENT
Costs incurred in developing products or systems and costs incurred in acquiring software and licenses that willcontribute to future period financial benefits through revenue generation and/or cost reduction are capitalised tosoftware and systems. Costs capitalised include external direct costs of materials and services and employeecosts.
Assets in the course of construction include only those costs directly attributable to the development phase andare only recognised following completion of technical feasibility and where the Group has an intention and abilityto use the asset.
NEXTDC Limited and controlled entities | FY20 Annual Report 70
For
per
sona
l use
onl
y

Notes to the Consolidated Financial Report30 June 2020(continued)
10 Leases
(a) Leases
(i) Amounts recognised in the Consolidated Balance Sheet
The Consolidated Balance Sheet includes the following amounts relating to leases:30 June
2020$'000
30 June2019$'000
Right-of-use assets *Properties 68,736 68,569Motor Vehicles 176 259Connectivity Links 9,262 9,696
78,174 78,524
* included in the line item ‘Property, plant and equipment’ in the Consolidated Balance Sheet.
Lease liabilitiesCurrent 5,057 4,949Non-current 71,777 68,379
76,834 73,328
Additions to the right-of-use assets during the 2020 financial year were $4.1 million (2019 : $0.3 million).
(ii) Amounts recognised in the Consolidated Statement of Comprehensive Income
The Consolidated Statement of Comprehensive Income shows the following amounts relating to leases:
30 June2020$'000
30 June2019$'000
Depreciation charge on Properties 3,226 5,067Depreciation charge on Motor Vehicles 84 68Depreciation charge on Connectivity Links 423 423Interest expense (included in Finance costs) 5,309 9,373
9,042 14,931
The total cash outflow for leases in 2020 was $5.0 million (2019 : $8.6 million).
(iii) The Group’s leasing activities and how these are accounted for
The Group has a number of leases over property, motor vehicles, and connectivity links that have varying terms,escalation clauses and renewal rights.
Leases are recognised as a right-of-use asset and a corresponding liability at the date at which the leased assetis available for use by the Group. Each lease payment is allocated between the liability and finance cost. Thefinance cost is charged to profit or loss over the lease term so as to produce a constant periodic rate of intereston the remaining balance of the liability for each year. The right-of-use asset is depreciated over the shorter ofthe asset's useful life and the lease term on a straight-line basis.
Assets and liabilities arising from a lease are initially measured on a present value basis. Lease liabilities includethe net present value of the following lease payments:
• fixed payments (including in-substance fixed payments), less any lease incentives receivable
• variable lease payments that are based on an index or a rate
NEXTDC Limited and controlled entities | FY20 Annual Report 71
For
per
sona
l use
onl
y

Notes to the Consolidated Financial Report30 June 2020(continued)
10 Leases (continued)
(a) Leases (continued)
(iii) The Group’s leasing activities and how these are accounted for (continued)
• amounts expected to be payable by the Group under residual value guarantees
• the exercise price of a purchase option if the Group is reasonably certain to exercise that option, and
• payments of penalties for terminating the lease, if the lease term reflects the Group exercising that option.
Lease payments to be made under reasonably certain extension options are also included in the measurement ofthe liability.
The lease payments are discounted using the interest rate implicit in the lease. If that rate cannot be readilydetermined, which is generally the case for leases in the Group, the lessee’s incremental borrowing rate is used.
To determine the incremental borrowing rate, the Group:
• where possible, uses recent third-party financing received by the individual lessee as a starting point,adjusted to reflect changes in financing conditions since third party financing was received
• makes adjustments specific to the lease, eg. term, country, currency and security.
Right-of-use assets are measured at cost comprising the following:
• the amount of the initial measurement of lease liability
• any lease payments made at or before the commencement date less any lease incentives received
• any initial direct costs, and
• restoration costs.
Payments associated with short-term leases of equipment and vehicles and all leases of low-value assets arerecognised on a straight-line basis as an expense in profit or loss. Short-term leases are leases with a lease termof 12 months or less. Low-value assets comprise IT equipment and small items of office furniture.
(iv) Extension and termination options
Extension and termination options are included in a number of property and equipment leases across the Group.These are used to maximise operational flexibility in terms of managing the assets used in the Group’soperations. The majority of extension and termination options held are exercisable only by the Group and not bythe respective lessor.
NEXTDC Limited and controlled entities | FY20 Annual Report 72
For
per
sona
l use
onl
y

Notes to the Consolidated Financial Report30 June 2020(continued)
Capital and financial risk management
11 Capital risk management
The Group's objectives when managing capital are to safeguard its ability to continue as a going concern, so thatit can continue to provide returns to its shareholders and benefits to its stakeholders and to maintain an optimalcapital structure to reduce the cost of capital.
In the future, the Directors may pursue funding options such as debt, sale and leaseback of assets, additionalequity and various other funding mechanisms as appropriate in order to undertake its projects and deliveroptimum shareholders’ return.
The Group intends to maintain a gearing ratio appropriate for a company of its size and growth.
30 June2020$'000
30 June2019$'000
Total borrowings and lease liabilities 875,071 867,177Less: cash and cash equivalents (892,939) (398,999)Net debt (surplus cash) (17,868) 468,178
Total equity 1,683,461 875,303Total capital 1,665,593 1,343,481
Gearing ratio -% 35.0%
The change in the gearing ratio was primarily driven by equity fundraising activities during the period. Refer tonote 12 for movements in ordinary share capital.
The Group manages its capital structure by regularly reviewing its gearing ratio to ensure it maintains anappropriate level of gearing within facility covenants. This ratio is calculated as net debt divided by total capital.Net debt is calculated as total interest bearing financial liabilities, less cash and cash equivalents. Total capital iscalculated as equity, as shown in the Consolidated Balance Sheet, plus net debt.
12 Contributed equity
(a) Share capital
Note
30 June2020
Number ofShares
30 June2020
$
30 June2019
Number ofShares
30 June2019
$
Fully paid ordinary shares 12(c) 455,046,464 1,757,261,639 343,655,108 905,117,323Treasury shares - LFSP 12(e) 861,813 1,851,502 861,813 1,851,502Treasury shares - EST 12(g) 27,702 203,000 27,702 203,000Total share capital 455,935,979 1,759,316,141 344,544,623 907,171,825
NEXTDC Limited and controlled entities | FY20 Annual Report 73
For
per
sona
l use
onl
y

Notes to the Consolidated Financial Report30 June 2020(continued)
12 Contributed equity (continued)
(b) Movements in ordinary share capital
Date Details NotesNumber ofshares $'000
Opening balance 343,113,933 906,26414 September 2018 Conversion of rights to shares (d) 1,402,988 1,904
Transaction costs - (122)
30 June 2019Deferred tax credit/(debit) recognised directly inequity - (874)Sub-total 344,516,921 907,172
Less shares held by NEXTDC Share Plan Pty Ltd (e) (861,813) (1,852)Less shares held by NEXTDC Employee SharePlan Trust (g) (27,702) (203)
30 June 2019 Balance 343,627,406 905,117
Date Details NoteNumber ofshares $'000
Opening balance 344,516,921 907,1723 October 2019 Conversion of rights to shares (d) 876,373 1,5117 April 2020 Issue of capital - institutional investors (c) 86,114,523 671,6937 May 2020 Issue of capital - share purchase plan (c) 24,400,460 190,331
Transaction costs - (16,272)
30 June 2020Deferred tax credit/(debit) recognised directly inequity - 4,882Sub-total 455,908,277 1,759,317
Less shares held by NEXTDC Share Plan PtyLtd (e) (861,813) (1,852)Less shares held by NEXTDC Employee SharePlan Trust (g) (27,702) (203)Balance 455,018,762 1,757,261
(c) Ordinary shares
In April 2020, the Group issued 86,114,523 ordinary shares to institutional investors at a price of $7.80 per share.In May 2020, the Group issued an additional 24,400,460 ordinary shares under a Share Purchase Plan priced at$7.80 per share.
Ordinary shares entitle the holder to participate in dividends and the proceeds on winding up of the Group inproportion to the number of and amounts paid on the shares held. On a show of hands every holder of ordinaryshares present at a meeting in person or by proxy, is entitled to one vote, and upon a poll each share is entitledto one vote.
Ordinary shares have no par value and the Group does not have a limited amount of authorised capital.
(d) Performance rights and deferred share rights
Performance rights and deferred share rights, which subject to satisfaction of a performance hurdle, give rise toan entitlement to the value of an ordinary share in NEXTDC Limited. The Board has discretion to determine if thevalue will be provided in shares, cash or a combination of shares and cash. The Board determined that 100% ofthe FY17 LTI and those FY18 deferred STIs that elected to take shares rather than cash, would vest in shares,with 876,373 shares issued to employees on 2 October 2019.
NEXTDC Limited and controlled entities | FY20 Annual Report 74
For
per
sona
l use
onl
y

Notes to the Consolidated Financial Report30 June 2020(continued)
12 Contributed equity (continued)
(e) Loan funded share plan
The Group operated a legacy Loan Funded Share Plan remuneration scheme which was designed to attract andretain key employees. The arrangement involved the issue of shares to NEXTDC Share Plan Pty Ltd, whose solepurpose was to hold shares as trustee for its beneficiaries (its participants). The participants were required tomeet service requirements before being entitled to access these shares.
The fair value at grant date of the shares was determined using either a Black-Scholes or binomial option pricingmodel that took into account the exercise price, the term of the option, the impact of dilution, the share price atgrant date and expected price volatility of the underlying share, the expected dividend yield and the risk-freeinterest rate for the term of the loan. The assessed fair value was recognised as share-based payments.
30 June2020
30 June2019
Shares held by the Trust but not allocated 861,813 861,813
(f) Dividend reinvestment plan
The Group does not have a dividend reinvestment plan in place.
(g) Other equity
Note2020
Shares2019
Shares
30 June2020$'000
30 June2019$'000
Treasury shares (g)(i) (27,702) (27,702) (203) (203)Total other equity (27,702) (27,702) (203) (203)
(i) Treasury shares
Treasury shares are shares in NEXTDC Limited that are held by the NEXTDC Employee Share Plan Trust (EST)for the purpose of issuing shares under the NEXTDC Limited Employee share scheme. Shares issued toemployees are recognised on a first-in-first-out basis.
Details Number of shares $'000
Balance 30 June 2019 (27,702) (203)Balance 30 June 2020 (27,702) (203)
NEXTDC Limited and controlled entities | FY20 Annual Report 75
For
per
sona
l use
onl
y

Notes to the Consolidated Financial Report30 June 2020(continued)
13 Financial risk management
The Group’s activities expose it to a variety of financial risks: market risk (including interest rate risk and pricerisk), credit risk and liquidity risk. The Group's overall risk management program focuses on the unpredictability offinancial markets and seeks to minimise potential adverse effects on the financial performance of the Group.
At 30 June 2020, NEXTDC had an undrawn A$300 million Syndicated Senior Secured Debt Facility.
The Group’s transactions are predominantly conducted in Australian dollars. Overall, management assesses theGroup’s exposure to financial risk as low. However, the Group does have a financial risk management program inplace.
The Group holds the following financial instruments:30 June
2020$'000
30 June2019$'000
FINANCIAL ASSETSCash and cash equivalents 892,939 398,999Trade and other receivables 45,065 33,856Security deposits 10,724 8,822Total financial assets 948,728 441,677
FINANCIAL LIABILITIESTrade and other payables 64,885 56,646Unsecured notes 798,237 793,849Lease liabilities 76,834 73,328Total financial liabilities 939,956 923,823
(a) Market risk
Market risk is the risk that the fair value or future cash flows of a financial instrument will fluctuate because ofchanges in market prices. Market risk for the Group is comprised of foreign exchange risk and interest rate risk.
(i) Foreign exchange risk
The Group does not have any significant operations outside Australia and its transactions are predominantlyconducted in Australian dollars. Consequently, management has determined that the Group has little exposure toforeign exchange risk. On this basis, the Group does not have any active risk mitigation strategies in relation toforeign exchange risk.
(ii) Cash flow and fair value interest rate risk
The Group’s main interest rate risk arises from its various fixed-rate term deposits, the floating rate tranche ofNotes IV and its senior debt facility (refer to Note 14(b)) which remained undrawn at 30 June 2020.
The floating rate tranche of Notes IV and Notes IV-2 represents 46% of total borrowings, and exposes theGroup's borrowings to changes in interest rates.
The interest rate for the Group’s Notes III unsecured notes, fixed rate tranche of Notes IV, and finance leaseliability are fixed, consequently the interest rate risk in relation to these instruments is limited.
SENSITIVITY
At 30 June 2020, if interest rates had increased by 100 basis points or decreased by 100 basis points from theyear end rates with all other variables held constant, post-tax profit for the period would have been $0.2 millionhigher / $0.2 million lower (2019: $1.5 million higher / $1.5 million lower), mainly as a result of higher/lowerinterest income from cash and cash equivalents and term deposits, offset by the 3 month BBSW variablecomponent on the Notes IV facility.
NEXTDC Limited and controlled entities | FY20 Annual Report 76
For
per
sona
l use
onl
y

Notes to the Consolidated Financial Report30 June 2020(continued)
13 Financial risk management (continued)
(b) Credit risk
Credit risk arises from counterparties holding cash and cash equivalents, security deposits, and trade and otherreceivables.
(i) Cash and cash equivalents and security deposits
Deposits are placed with Australian banks or independently rated parties with a minimum rating of ‘A’ class inboth short term and long term. To reduce exposure deposits are placed with a variety of financial institutions.
The credit quality of financial assets can be assessed by reference to external credit ratings (if available) or tohistorical information about counterparty default rates:
30 June2020$'000
30 June2019$'000
CASH AT BANKA rated 100,000 -AA rated 792,939 398,999TOTAL 892,939 398,999
SECURITY DEPOSITSAA Rated 9,797 8,822Unrated 927 -TOTAL 10,724 8,822
In determining the credit quality of these financial assets, NEXTDC has used the long-term rating from Standard& Poor’s as of July 2020.
(ii) Trade and other receivables
Customer credit risk is managed subject to the Group’s established policy, procedures and control relating tocustomer credit risk management. Credit evaluations are performed on all customers. Outstanding customerreceivables are monitored regularly.
The Group aims to minimise concentration of credit risk by undertaking transactions with a large number ofcustomers. Revenues from data centre services of $76.8m were derived from two customers, contributing$50.2m (25%) and $26.6m (13%) respectively (2019: $42.1m (26%) and $19.1m (12%) respectively). In addition,receivable balances are monitored on an ongoing basis with the intention that the Group’s exposure to bad debtsis minimised.
The maximum exposure to credit risk at the end of the reporting period is the carrying value of each class of thefinancial assets mentioned above and each class of receivable disclosed in Note 5. The Group does not requirecollateral in respect of financial assets.
NEXTDC Limited and controlled entities | FY20 Annual Report 77
For
per
sona
l use
onl
y

Notes to the Consolidated Financial Report30 June 2020(continued)
13 Financial risk management (continued)
(b) Credit risk (continued)
(ii) Trade and other receivables (continued)
The Group applies the simplified approach to providing for expected credit losses prescribed by AASB 9, whichpermits the use of the lifetime expected loss provision for all trade receivables.
To measure the expected credit loss, receivables have been grouped based on days overdue. The methodologyapplied in estimating expected credit losses below is consistent with that applied for the year ended 30 June2019. The impact of COVID-19 on the global economy and how governments, businesses and consumers willrespond is uncertain. This uncertainty is reflected in the Group's assessment of expected credit losses, which issubject to a number of management estimates and judgements.
The judgements and associated assumptions have been made within the context of the impact of COVID-19, andreflect historical experience and other factors that are considered to be relevant, including expectations of futureevents that are believed to be reasonable under the current circumstances, such as the duration of the pandemic,the impacts and actions of governments, the responses of businesses and consumers across different industries,and the associated impact on the global economy. Accordingly, the Group's expected credit loss estimates areinherently uncertain, and as a result, actual results may differ from these estimates.
The loss allowance provision as at 30 June 2020 is determined as follows:
0 to 30 31 to 60 More than 6030 June 2020 Current days past due days past due days past due Total
$'000 $'000 $'000 $'000 $'000Expected loss rate 2% 10% 25% 56% -Gross carrying amount 35,310 1,632 224 735 37,901Loss allowance provision 719 164 56 410 1,349Net receivables 34,591 1,468 168 325 36,552
NEXTDC Limited and controlled entities | FY20 Annual Report 78
For
per
sona
l use
onl
y

Notes to the Consolidated Financial Report30 June 2020(continued)
13 Financial risk management (continued)
(c) Liquidity risk
Prudent liquidity risk management implies maintaining sufficient cash and marketable securities and theavailability of funding through an adequate amount of committed credit facilities to meet obligations when due.
Management also actively monitors rolling forecasts of the Group’s cash and cash equivalents.
(i) Maturities of financial liabilities
The table below analyses the Group’s financial liabilities into relevant maturity groupings based on theircontractual maturities for all non-derivative financial liabilities.
The amounts disclosed in the table are the contractual undiscounted cash flows.
Contractual Maturities of Financial Liabilities Within 12months
Between1 and 5years
Over 5years
Totalcontractual
cashflows
Carryingamount
2020 $'000 $'000 $'000 $'000 $'000
Trade payables 32,665 - - 32,665 32,665Unsecured notes 346,182 523,858 - 870,040 798,237Lease liabilities 4,996 25,589 167,214 197,799 76,834Total non-derivatives 383,843 549,447 167,214 1,100,504 907,736
2019Trade payables 44,840 - - 44,840 44,840Unsecured notes 46,634 900,046 - 946,680 793,849Lease liabilities 5,008 26,709 167,214 198,931 73,328Total non-derivatives 96,482 926,755 167,214 1,190,451 912,017
The cash flows for unsecured notes assume that the early redemption options would not be exercised by theGroup.
(d) Fair value measurements
(i) Trade and other payables
The fair value of trade and other payables is disclosed in Note 7.
(ii) Borrowings
The fair value of borrowings is disclosed in Note 14(d) and Note 14(e).
NEXTDC Limited and controlled entities | FY20 Annual Report 79
For
per
sona
l use
onl
y

Notes to the Consolidated Financial Report30 June 2020(continued)
14 Borrowings
30 June2020$'000
30 June2019$'000
CURRENTUnsecured Notes 14(a) 301,811 -
30 June2020$'000
30 June2019$'000
NON-CURRENTUnsecured notes 14(a) 496,426 793,849
(a) Unsecured notes
At 30 June 2020, the Group had the following Notes on issue:
• $300 million in Notes III, carrying an annual coupon rate of 6.25% paid semi-annually. Although these Notesare due 9 June 2021, the Group also has the option to repay on 9 December 2020. Regardless of whenNotes III is redeemed, an additional 1.5% interest will also be payable on redemption.
• $300 million in Notes IV issued on 17 July 2018, comprising a floating rate tranche of $200 million priced at3.75% over 3-month BBSW and a fixed rate tranche of $100 million at 6%. Notes IV is complementary to the$300 million Notes III, albeit a different maturity date of June 2022, compared to June 2021 for Notes III. IfNotes IV is redeemed prior to the second optional redemption date of 9 December 2020, an additional 1.25%interest will be payable. In addition, the Group may at any time prior to 9 December 2020, redeem all or partof the Notes, upon not less than 7 days and no more than 60 days prior notice.
• $200 million in Notes IV-2 issued on 11 June 2019, comprising a $170 million floating rate tranche priced at3.75% over 90-day BBSW and a $30 million fixed rate tranche priced at 102.466% of par on a coupon of 6%,implying a yield to first call of 4.92%. If Notes IV-2 is redeemed prior to the second optional redemption dateof 9 December 2020, an additional 1.25% interest will be payable. In addition, the Group may at any timeprior to 9 December 2020, redeem all or part of the Notes, upon not less than 7 days and no more than 60days prior notice.
(b) Bank Loan
At 30 June 2020, NEXTDC had an undrawn A$300 million Syndicated Senior Secured Debt Facility. This facilityhas a maturity date of 30 September 2022.
(c) Compliance with loan covenants
The Group has complied with the financial covenants of its borrowing facilities during the 2020 financial year(2019: complied).
(d) Fair value – bank borrowings
Whilst NEXTDC has an existing $300 million bank facility, the facility remained undrawn as at 30 June 2020.
(e) Fair value – unsecured notes
Material differences are identified for the following borrowings:
NEXTDC Limited and controlled entities | FY20 Annual Report 80
For
per
sona
l use
onl
y

Notes to the Consolidated Financial Report30 June 2020(continued)
14 Borrowings (continued)
(e) Fair value – unsecured notes (continued)
2020 2019Carryingamount
$'000Fair value
$'000
Carryingamount$'000
Fair value$'000
Unsecured notes 798,237 781,546 793,849 812,000
(f) Borrowings
Borrowings are initially recognised at fair value, net of transaction costs incurred. Borrowings are subsequentlymeasured at amortised cost. Any difference between the proceeds (net of transaction costs) and the redemptionamount is recognised in profit or loss over the period of the borrowings using the effective interest method. Feespaid on the establishment of loan facilities are recognised as transaction costs of the loan to the extent that it isprobable that some or all of the facility will be drawn down. In this case, the fee is deferred until the draw downoccurs. To the extent there is no evidence that it is probable that some or all of the facility will be drawn down, thefee is capitalised as a prepayment for liquidity services and amortised over the period of the facility to which itrelates.
Items not recognised
15 Commitments
(a) Capital commitments
Capital expenditure contracted for at the end of each reporting year but not recognised as liabilities is as follows:
30 June2020$'000
30 June2019$'000
Property, plant and equipment 82,101 161,698Total capital commitments 82,101 161,698
16 Contingencies
(a) Contingent assets
The Group did not have any contingent assets during the year or as at the date of this report.
(b) Contingent liabilities
The Group did not have any contingent liabilities during the year or as at the date of this report.
GUARANTEES
For information about guarantees given by entities within the Group, please refer to Note 6(a).
17 Events occurring after the reporting period
No matters or circumstances have arisen since 30 June 2020 that have significantly affected the Group'soperations, results or state of affairs, or may do so in future years.
NEXTDC Limited and controlled entities | FY20 Annual Report 81
For
per
sona
l use
onl
y

Notes to the Consolidated Financial Report30 June 2020(continued)
Employee remuneration
18 Key management personnel
(a) Key management personnel compensation
30 June2020
$
30 June2019
$
Short-term employee benefits 6,174,838 4,325,116Post-employment benefits 172,644 182,660Long-term benefits 172,719 113,074Share-based payments 1,623,700 1,307,912Total key management personnel compensation 8,143,901 5,928,762
ComprisingSenior Executives 7,124,651 5,116,332Non-Executive Directors 1,019,250 812,430Total 8,143,901 5,928,762
Detailed remuneration disclosures are provided in the Remuneration Report.
(b) Loans to key management personnel
There were no loans made to key management personnel during the year (2019: nil).
(c) Other transactions with key management personnel
There were no other transactions with key management personnel during the year (2019: nil).
19 Share-based payments
(a) Performance rights
The performance rights plan was established by the Board of Directors to provide long-term incentives to theGroup’s Senior Executives based on total shareholder returns (TSR) taking into account the Group’s financialand operational performance. Under the Plan, eligible participants may be granted performance rights on termsand conditions determined by the Board from time to time. Performance rights were granted during the course ofFY18, FY19 and FY20. The vesting conditions for grants relate to TSR exceeding the ASX 200 AccumulationIndex over the measurement period. Vesting of the rights will be tested on or around the day following the releaseof each of the annual results for the years ended 30 June 2020, 2021 and 2022 respectively.
Performance rights are granted by the Company for nil consideration. The Board has discretion to determine ifthe value will be provided in shares, cash or a combination of shares and cash. Rights granted under the plancarry no dividend or voting rights.
The fair value of the rights at the date of valuation was determined using the Black-Scholes Option Pricing Modelto be equal to the volume weighted-average price (VWAP) ending on the day before the grant date, less thedividends expected over the period from the expected grant date to the completion of the measurement period,adjusted for the expected probability of achieving the vesting conditions.
NEXTDC Limited and controlled entities | FY20 Annual Report 82
For
per
sona
l use
onl
y

Notes to the Consolidated Financial Report30 June 2020(continued)
19 Share-based payments (continued)
(a) Performance rights (continued)
30 June2020
Number ofRights
30 June2020
Average FairValue
30 June2019
Number ofRights
30 June2019
Average fairvalue
Opening balance 2,469,360 $2.64 2,948,960 $1.87Granted during the year 754,809 $4.23 828,285 $3.07Vested during the year (858,026) $1.63 (1,307,885) $1.19Forfeited during the year (39,971) $2.45 - $0.00Closing balance 2,326,172 $3.53 2,469,360 $2.64
(b) Deferred shares - executives short-term incentive scheme
Under the Group’s short-term incentive (STI) scheme for FY19, executives received 50% of the annual STIachieved in cash, with 50% deferred for 12 months. Executives were able to elect whether the deferredcomponent would be delivered in cash or equity. The FY19 tranche of deferred rights were granted in September2019 and will vest on or around September 2020, being 12 months after the date on which they were granted.They automatically convert into one ordinary share each on vesting at an exercise price of nil. The executives donot receive any dividends and are not entitled to vote in relation to the deferred shares during the vesting period.If an executive ceases to be employed by the Group within this period, they will have 6 months from cessation ofemployment or the vesting date (whichever is later) to exercise the deferred share right. Any rights not exercisedwithin this period will automatically lapse.
The number of rights to be granted was determined based on the currency value of the achieved STI divided bythe volume weighted-average price at which the Company’s shares were traded on the Australian SecuritiesExchange over the 10 days following the release of the Group's FY19 results, being $6.10.
2020 2019
Number of rights to deferred shares granted 13,517 18,347
(c) Expenses arising from share-based payment transactions
Total expenses arising from share-based payment transactions recognised during the year as part of employeebenefit expense were as follows:
30 June2020$'000
30 June2019$'000
Performance rights 2,679 2,068Deferred shares issued under the short-term incentive scheme 82 38Total expenses arising from share-based payment transactions 2,761 2,106
NEXTDC Limited and controlled entities | FY20 Annual Report 83
For
per
sona
l use
onl
y

Notes to the Consolidated Financial Report30 June 2020(continued)
Other
20 Income tax
(a) Income tax expense
30 June2020$'000
30 June2019$'000
Current taxAdjustments for current tax of prior periods - 760Sub-total - 760
Deferred income taxDecrease / (increase) in deferred tax assets less deferred tax credited to equity 25,818 (27,138)Increase / (decrease) in deferred tax liabilities 616 20,124Sub-total 26,434 (7,014)
Income tax (benefit)/expense is attributable to:Profit/(loss) from continuing operations 26,434 (6,254)Profit/(loss) from continuing operations 26,434 (6,254)
(b) Numerical reconciliation of income tax expense to prima facie tax payable
30 June2020$'000
30 June2019$'000
Profit/(loss) from continuing operations before income tax expense (18,740) (16,073)Tax at the Australian tax rate of 30% (5,622) (4,822)
Tax effect of amounts which are not deductible (taxable)in calculating taxable income:Adjustments for deferred tax of prior periods (902) -Non-deductible expenses 21 39Share-based payments (848) (1,911)Derecognition of temporary differences 22,827 -Derecognition of tax losses 10,675 -Adjustments for current tax of prior periods - 760Sundry items 283 (320)Income tax (benefit)/expense 26,434 (6,254)
(7,694) 22,327(c) Amounts recognised directly in equity
30 June2020$'000
30 June2019$'000
Aggregate current and deferred tax arising in the reporting period and notrecognised in net profit or loss or other comprehensive income but directlydebited or credited to equity:Current tax debited directly to equity (4,882) (874)Deferred tax expense/(benefit) on change in accounting policy - 6,337
(4,882) 5,463
NEXTDC Limited and controlled entities | FY20 Annual Report 84
For
per
sona
l use
onl
y

Notes to the Consolidated Financial Report30 June 2020(continued)
20 Income tax (continued)
(d) Tax losses
30 June2020$'000
30 June2019$'000
Unused tax losses for which no deferred tax asset has been recognised 35,583 -Potential tax benefit @ 30.0% 10,675 -
Income tax
The income tax expense or revenue for the period is the tax payable on the current period’s taxable incomebased on the applicable income tax rate in Australia adjusted by changes in deferred tax assets and liabilitiesattributable to temporary differences and to unused tax losses.
The current income tax charge is calculated on the basis of the tax laws enacted or substantively enacted at theend of the reporting period in Australia. Management periodically evaluates positions taken in tax returns withrespect to situations in which applicable tax regulation is subject to interpretation. It establishes provisions whereappropriate on the basis of amounts expected to be paid to the tax authorities.
Deferred income tax is provided in full, using the liability method, on temporary differences arising between thetax bases of assets and liabilities and their carrying amounts in the financial statements. However, deferred taxliabilities are not recognised if they arise from the initial recognition of goodwill. Deferred income tax is also notaccounted for if it arises from initial recognition of an asset or liability in a transaction other than a businesscombination that at the time of the transaction affects neither accounting nor taxable profit or loss. Deferredincome tax is determined using tax rates (and laws) that have been enacted or substantially enacted by the endof the reporting period and are expected to apply when the related deferred income tax asset is realised or thedeferred income tax liability is settled.
Deferred tax assets are recognised for deductible temporary differences and unused tax losses only if it isprobable that future taxable amounts will be available to utilise those temporary differences and losses.
Deferred tax assets and liabilities are offset when there is a legally enforceable right to offset current tax assetsand liabilities and when the deferred tax balances relate to the same taxation authority. Current tax assets andtax liabilities are offset where the Group has a legally enforceable right to offset and intends either to settle on anet basis, or to realise the asset and settle the liability simultaneously.
Current and deferred tax is recognised in profit or loss, except to the extent that it relates to items recognised inother comprehensive income or directly in equity. In this case, the tax is also recognised in other comprehensiveincome or directly in equity, respectively.
NEXTDC Limited and controlled entities | FY20 Annual Report 85
For
per
sona
l use
onl
y

Notes to the Consolidated Financial Report30 June 2020(continued)
21 Deferred tax
(a) Deferred tax assets
30 June2020$'000
30 June2019$'000
The balance comprises temporary differences attributable to:Tax losses 10,675 8,329Black-hole expenditure deductible in future years 4,831 1,730Property, plant and equipment 2,104 -Lease liabilities 23,025 21,998Employee benefits 2,402 2,007Loss allowances 405 222Expenses deductible in future years 401 1,752Revenue received in advance 10,455 7,740R&D offsets 2,046 -Total deferred tax assets 56,344 43,778
Set-off of deferred tax liabilities pursuant to set-off provisions (Note 21(b)) (22,842) (22,226)Deferred tax assets not recognised (33,502) -Net deferred tax assets - 21,552
Deferred tax assets may be a combination of unused tax losses, offsets and timing differences based onmanagement’s foreseeable forecasts, to the extent that it is probable that taxable profit will be available againstwhich the losses, offsets and timing differences can be utilised. Significant management judgement is required todetermine the amount of deferred tax assets that can be recognised, based upon the likely timing and level offuture taxable profits together with future tax planning strategies.
During the year, the Group derecognised deferred tax assets in relation to carry-forward tax losses andtemporary differences as it believed they no longer met the requirement to be recognised, stemming from theimpact that the recent growth and expansion activity has had on taxable profits. Despite the derecognition, thesecarry-forward tax losses and offsets can be carried forward indefinitely and have no expiry date.
(b) Deferred tax liabilities
30 June2020$'000
30 June2019$'000
The balance comprises temporary differences attributable to:Accrued interest 107 16Lease assets 21,577 20,553Customer incentives - 515Property, plant and equipment 1,158 874Contract costs - 268Total deferred tax liabilities 22,842 22,226
Set-off of deferred tax liabilities pursuant to set-off provisions (Note 21(a)) (22,842) (22,226)Net deferred tax liabilities - -
NEXTDC Limited and controlled entities | FY20 Annual Report 86
For
per
sona
l use
onl
y

Notes to the Consolidated Financial Report30 June 2020(continued)
22 Cash flow information
(a) Reconciliation of profit after income tax to net cash inflow from operating activities
30 June2020$'000
30 June2019$'000
Profit/(loss) for the year after income tax (45,174) (9,819)Depreciation and amortisation 69,078 48,442Non-cash employee benefits expense share-based payments 2,761 2,183Net (gain) loss on disposal of non-current assets (199) (618)
CHANGE IN OPERATING ASSETS AND LIABILITIES(Increase) / decrease in trade debtors (11,351) 6,875(Increase) / decrease in prepayments and other current assets (2,213) 4,017(Increase) / decrease in interest receivable (302) (27)(Increase) / decrease in cash used in bank guarantee (996) (4,671)(Increase) / decrease in GST (669) (4,205)(Increase) / decrease in other assets (568) (199)(Increase) / decrease in deferred tax assets 26,434 (6,251)Decrease / (increase) in customer incentives 195 193Decrease / (increase) in trade payables 1,712 (6,030)Decrease / (increase) in other operating liabilities (1,627) 6,394Decrease / (increase) in employee entitlements 1,431 1,155(Decrease) / increase in other provisions 898 -Decrease / (increase) in interest payable 6,382 2,123Decrease / (increase) in revenue in advance 8,152 (201)Net cash inflow from operating activities 53,944 39,361
(b) Net cash / (debt) reconciliation
Net cash / (debt)
30 June2020$'000
30 June2019$'000
892,939 398,999(306,868) (4,949)(568,203) (862,228)
Cash and cash equivalents Borrowings - repayable within one year Borrowings - repayable after one year Net cash / (debt) 17,868 (468,178)
892,939 398,999(508,027) (501,660)(367,044) (365,517)
Cash and liquid investments Gross debt - fixed interest rates Gross debt - variable interest rates Net cash / (debt) 17,868 (468,178)
NEXTDC Limited and controlled entities | FY20 Annual Report 87
For
per
sona
l use
onl
y

Notes to the Consolidated Financial Report30 June 2020(continued)
22 Cash flow information (continued)(b) Net cash / (debt) reconciliation (continued)
Otherassets Liabilities from financing activities
Cash$'000
Financeleases due
within1 year$'000
Financeleases
due after1 year$'000
Borrow.due within
1 year$'000
Borrow.due after 1
year$'000
Total$'000
417,982 - (6,042) - (296,912) 115,028(18,983) - - - (494,256) (513,239)
Net cash as at 1 July 2018 Cash flowsOther non-cash movements - (4,949) (62,337) - (2,681) (69,967)Net debt as at 30 June 2019 398,999 (4,949) (68,379) - (793,849) (468,178)
493,940 - - - - 493,940- (108) (3,398) (301,811) 297,423 (7,894)
Cash flowsOther non-cash movements Net cash as at 30 June 2020 892,939 (5,057) (71,777) (301,811) (496,426) 17,868
23 Remuneration of auditors
During the year the following fees were paid or payable for services provided by PricewaterhouseCoopersAustralia (PwC), the auditor of the parent entity, NEXTDC Limited, by PwC's related network firms and bynon-related audit firms:
(a) PwC Australia
Audit and other assurance services2020
$2019
$
Audit and review of financial statements 371,901 325,125Other assurance services
Other assurance services - 45,084Total remuneration for audit and other assurance services 371,901 370,209
Taxation ServicesTax compliance services 46,266 73,902
Total services provided by PwC Australia 418,167 444,111
(b) Network firms of PwC Australia
(i) Audit and other assurance services
Audit and review of financial statements 12,772 13,025
Total remuneration of network firms of PwC Australia 12,772 13,025
NEXTDC Limited and controlled entities | FY20 Annual Report 88
For
per
sona
l use
onl
y

Notes to the Consolidated Financial Report30 June 2020(continued)
23 Remuneration of auditors (continued)
(c) Non-PwC audit firms
NEXTDC Limited did not engage with any other non-PwC audit firms.
Total services provided by PwC 430,939 457,136
24 Interests in other entities
(a) Material subsidiaries
The Group’s principal subsidiaries at 30 June 2020 are set out below. Unless otherwise stated, they have sharecapital consisting solely of ordinary shares that are held directly by the Group, and the proportion of ownershipinterests held equals the voting rights held by the Group.
Name of entity
Place ofbusiness/country of
incorporationOwnership interest held
by the groupPrincipalactivities
2020%
2019%
NEXTDC Holdings Trust No. 1 Australia 100 100
PropertyHoldingCompany
NEXTDC Holdings No. 1 Pty Ltd Australia 100 100HoldingCompany
NEXTDC Holdings Trust No. 3 Australia 100 100
PropertyHoldingCompany
NEXTDC Holdings No. 3 Pty Ltd Australia 100 100HoldingCompany
NEXTDC Limited and controlled entities | FY20 Annual Report 89
For
per
sona
l use
onl
y

Notes to the Consolidated Financial Report30 June 2020(continued)
25 Parent entity financial information
The individual financial statements for the parent entity, NEXTDC Limited, show the following aggregateamounts:
30 June2020$'000
30 June2019$'000
Total current assets 965,247 447,698Non-current assets 1,441,998 1,121,500
TOTAL ASSETS 2,407,246 1,569,198Total current liabilities 378,722 63,382Non-current liabilities 597,237 886,979
TOTAL LIABILITIES 975,959 950,361NET ASSETS 1,431,287 618,837
Shareholders' equityContributed equity 1,757,262 905,117Reserves 7,535 6,285Retained earnings (333,510) (292,565)TOTAL EQUITY 1,431,287 618,837
Profit/(loss) for the year after tax (40,945) (266,311)Total comprehensive income/(loss) for the year (40,945) (261,657)
NEXTDC Limited acquired Asia Pacific Data Centre (“APDC”) on 18 October 2018. Following acquisition, theentities comprising APDC were subsequently wound up, and the underlying properties were transferred to a newentity established by NEXTDC - NEXTDC Holdings Trust No. 1 (refer to note 24). This resulted in the above prioryear loss in the parent entity on derecognition of its investment in APDC, while a corresponding gain wasrecorded in NEXTDC Holdings Trust No. 1 on transfer of the properties.
(a) Reserves
Due to the requirements of accounting standards, the loan provided by NEXTDC Limited (parent entity) toNEXTDC Share Plan Pty Ltd requires the loan in respect of the loan funded share plan to be recorded as anissue of treasury shares and a corresponding debit to equity (treasury share reserve).
(b) Guarantees entered into by the parent entity in relation to the debts of its subsidiaries
As at 30 June 2020, NEXTDC Limited did not have any guarantees in relation to the debts of subsidiaries.
(c) Contingent liabilities of NEXTDC Limited (parent entity)
The parent entity did not have any contingent liabilities as at 30 June 2020 or 30 June 2019.
(d) Contractual commitments by NEXTDC for the acquisition of property, plant and equipment
Contractual commitments detailed in Note 15 relate to NEXTDC Limited as parent entity.
(e) Determining the parent entity financial information
The financial information for the parent entity has been prepared on the same basis as the consolidated financialstatements, except as set out below.
(i) Tax consolidation legislation
NEXTDC Limited and its wholly-owned Australian controlled entities have implemented the tax consolidationlegislation.
NEXTDC Limited and controlled entities | FY20 Annual Report 90
For
per
sona
l use
onl
y

Notes to the Consolidated Financial Report30 June 2020(continued)
25 Parent entity financial information (continued)
(e) Determining the parent entity financial information (continued)
(i) Tax consolidation legislation (continued)
The head entity, NEXTDC Limited, and the controlled entities in the tax consolidated Group account for their owncurrent and deferred tax amounts. These tax amounts are measured as if each entity in the tax consolidatedGroup continues to be a stand-alone taxpayer in its own right.
In addition to its own current and deferred tax amounts, NEXTDC Limited also recognises the current taxliabilities (or assets) and the deferred tax assets arising from unused tax losses and unused tax credits assumedfrom controlled entities in the tax consolidated Group.
The entities have also entered into a tax funding agreement under which the wholly-owned entities fullycompensate NEXTDC Limited for any current tax payable assumed and are compensated by NEXTDC Limitedfor any current tax receivable and deferred tax assets relating to unused tax losses or unused tax credits that aretransferred to NEXTDC Limited under the tax consolidation legislation. The funding amounts are determined byreference to the amounts recognised in the wholly-owned entities’ financial statements.
The amounts receivable/payable under the tax funding agreement are due upon receipt of the funding advicefrom the head entity, which is issued as soon as practicable after the end of each financial year. The head entitymay also require payment of interim funding amounts to assist with its obligations to pay tax instalments.
Assets or liabilities arising under tax funding agreements with the tax consolidated entities are recognised ascurrent amounts receivable from or payable to other entities in the Group.
Any difference between the amounts assumed and amounts receivable or payable under the tax fundingagreement are recognised as a contribution to (or distribution from) wholly-owned tax consolidated entities.
(ii) Investments in subsidiaries, associates and joint venture entities
Investments in subsidiaries are accounted for at cost in the financial statements of NEXTDC Limited.
26 Summary of significant accounting policies
The principal accounting policies adopted in the preparation of these consolidated financial statements are setout below. These policies have been consistently applied to all the years presented, unless otherwise stated. Thefinancial statements are for the consolidated entity consisting of NEXTDC Limited and its subsidiaries. NEXTDCis a public company limited by shares, incorporated and domiciled in Australia.
(a) Reporting Period and Comparative information
These financial statements cover the period 1 July 2019 to 30 June 2020. The comparative reporting period is 1July 2018 to 30 June 2019.
(b) Basis of preparation
This general purpose financial report has been prepared in accordance with Australian Accounting Standardsand interpretations issued by the Australian Accounting Standards Board and the Corporations Act 2001.NEXTDC Limited is a for-profit entity for the purpose of preparing the financial statements.
(i) Compliance with IFRS
The consolidated financial statements of the NEXTDC Group also comply with International Financial ReportingStandards (IFRS) as issued by the International Accounting Standards Board (IASB).
The consolidated financial statements were authorised for issue by the Board of Directors on the date theDirectors' Report is signed. The Directors have the power to amend and reissue the financial statements.
(ii) New and amended standards adopted by the group
The Group has applied the following standards and amendments for the first time for their annual reporting yearcommencing 1 July 2019:• AASB 2017-6 Amendments to Australian Accounting Standards - Prepayment Features with negative
Compensation
NEXTDC Limited and controlled entities | FY20 Annual Report 91
For
per
sona
l use
onl
y

Notes to the Consolidated Financial Report30 June 2020(continued)
26 Summary of significant accounting policies (continued)
(b) Basis of preparation (continued)
(ii) New and amended standards adopted by the group (continued)
• AASB 2017-7 Amendments to Australian Accounting Standards - Long-term Interests in Associates and JointVentures
• AASB 2018-1 Amendments to Australian Accounting Standards - Annual Improvements 2015 - 2017 Cycle• AASB 2018-2 Amendments to Australian Accounting Standards - Plan Amendment, Curtailment or
Settlement• Interpretation 23 Uncertainty over Income Tax Treatments
Other than the new standards listed above, none of the new standards and amendments to standards that aremandatory for the first time for the financial year beginning 1 July 2019 affected any of the amounts recognised inthe current period or any prior period and are not likely to affect future periods.
(iii) Historical cost convention
These financial statements have been prepared under the historical cost convention.
(iv) New standards and interpretations not yet adopted
There are no standards that are not yet effective that would be expected to have a material impact on the Groupin the current or future reporting periods and on foreseeable future transactions.
(c) Critical accounting estimates
Estimates and judgements are continually evaluated and are based on historical experience and other factors,including expectations of future events that may have a financial impact on the entity and that are believed to bereasonable under the circumstances.
This note provides an overview of the areas that involved a higher degree of judgement or complexity, and ofitems which are more likely to be materially adjusted due to estimates and assumptions turning out to be wrong.
(i) Deferred taxation
Deferred tax assets may be a combination of unused tax losses, offsets and timing differences based onmanagement’s foreseeable forecasts, to the extent that it is probable that taxable profit will be available againstwhich the losses, offsets and timing differences can be utilised. Significant management judgement is required todetermine the amount of deferred tax assets that can be recognised, based upon the likely timing and level offuture taxable profits together with future tax planning strategies.
During the year, the Group derecognised deferred tax assets in relation to carry-forward tax losses andtemporary differences as it believed they no longer met the requirement to be recognised, stemming from theimpact that the recent growth and expansion activity has had on taxable profits. Despite the derecognition, thesecarry-forward tax losses and offsets can be carried forward indefinitely and have no expiry date.
(ii) Income taxes
The Group is subject to income taxes in Australia. Judgement is required in determining the provision for incometaxes. There are certain transactions and calculations undertaken during the ordinary course of business forwhich the ultimate tax determination is uncertain. The Group estimates its tax liabilities based on the Group’sunderstanding of the tax law. Where the final tax outcome of these matters is different from the amounts thatwere initially recorded, such differences will impact the current and deferred income tax assets and liabilities inthe period in which such determination is made.
NEXTDC Limited and controlled entities | FY20 Annual Report 92
For
per
sona
l use
onl
y

Notes to the Consolidated Financial Report30 June 2020(continued)
26 Summary of significant accounting policies (continued)
(c) Critical accounting estimates (continued)
(iii) Leases
On adoption of AASB 16 Leases from 1 July 2018, the Group was required to determine the measurement oflease liabilities based on the present value of remaining lease payments, discounted using the Group’sincremental borrowing rate at commencement date. Judgement is required in determining an appropriateincremental borrowing rate, and the Group has determined the rate based on the effective interest rate of its mostrecent borrowings, adjusted to the specific term of each lease. In determining the lease term, managementconsidered all relevant facts and circumstances that create an economic incentive to either exercise an extensionoption, or not exercise a termination option. Extension options are only included in the lease term if it isreasonably certain to be extended. The assessment is reviewed if a significant event or significant change incircumstances occurs which affects this assessment, and that is within the control of the lessee.
(iv) Revenue from contracts with customers
Key judgements in the recognition of revenue from contracts with customers include the identification ofperformance obligations within the contracts, allocation of the transaction price within the contract to the identifiedperformance obligations, treatment of the upfront project fees and treatment of any variable considerationsubsequent to initial commencement. Refer to Note 3 for further details.
(v) Impairment
The Group owns and operates a data centre in Canberra with a carrying value of $90 million (3% of total assets).The data centre is strategically important to the Group, and the Group has invested in recent times to ensure thatthe data centre is competitive. As is common with data centre investments, contracted capacity can lag theinvestment made, and as such the carrying value of C1 is a key area of estimation uncertainty.
The group has assessed the carrying value using a value in use model and has assessed that the recoverableamount is in excess of the carrying value and no impairment arises. The key areas of estimation uncertainty inmaking this assessment are: revenue (data centre operating at a capacity and margin similar to other datacentres in the group), the estimated cost of data centre fit out, and the discount rate.
(d) Employee Share Trust
The Group has formed two entities to administer the Group's employee share schemes. The trusts areconsolidated, as the substance of the relationships are that the trusts are controlled by the Group. Shares held byNEXTDC Share Plan Pty Ltd and NEXTDC Employee Share Plan Trust are disclosed as treasury shares anddeducted from contributed equity.
(e) Share-based payments reserve
The share-based payments reserve is used to recognise:
• the grant date fair value of long-term incentives issued to participants• the grant date fair value of shares issued to participants• the issue of shares held by NEXTDC Share Plan Pty Ltd and NEXTDC Employee Share Plan Trust
(f) Functional and presentation currency
These consolidated financial statements are presented in Australian dollars, which is the Group’s functionalcurrency.
NEXTDC Limited and controlled entities | FY20 Annual Report 93
For
per
sona
l use
onl
y

Notes to the Consolidated Financial Report30 June 2020(continued)
26 Summary of significant accounting policies (continued)
(g) Impairment of assets
Intangible assets that have an indefinite useful life are not subject to amortisation and are tested annually forimpairment, or more frequently if events or changes in circumstances indicate that they might be impaired. Otherassets are tested for impairment whenever events or changes in circumstances indicate that the carrying amountmay not be recoverable. An impairment loss is recognised for the amount by which the asset’s carrying amountexceeds its recoverable amount. The recoverable amount is the higher of an asset’s fair value less costs to selland value in use. For the purposes of assessing impairment, assets are grouped at the lowest levels for whichthere are separately identifiable cash inflows which are largely independent of the cash inflows from other assetsor groups of assets (cash-generating units). Non-financial assets other than goodwill that suffered impairment arereviewed for possible reversal of the impairment at the end of each reporting period.
(h) Cash and cash equivalents
For the purpose of presentation in the Consolidated Statement of Cash Flows, cash and cash equivalentsincludes cash on hand, deposits held at call with financial institutions and term deposits with original maturities ofthree months or less that are readily convertible to known amounts of cash and which are subject to aninsignificant risk of changes in value.
(i) Investments and other financial assets
(i) Classification
From 1 July 2018, the Group classifies its financial assets in the following measurement categories:
• those to be measured subsequently at fair value (either through OCI or through profit or loss), and• those to be measured at amortised cost.
The classification depends on the entity’s business model for managing the financial assets and the contractualterms of the cash flows.
For assets measured at fair value, gains and losses will either be recorded in profit or loss or OCI. Forinvestments in equity instruments that are not held for trading, this will depend on whether the Group has madean irrevocable election at the time of initial recognition to account for the equity investment at fair value throughother comprehensive income (FVOCI).
The Group reclassifies debt investments when and only when its business model for managing those assetschanges.
(ii) Recognition and derecognition
Regular way purchases and sales of financial assets are recognised on trade date, being the date on which theGroup commits to purchase or sell the asset. Financial assets are derecognised when the rights to receive cashflows from the financial assets have expired or have been transferred and the Group has transferred substantiallyall the risks and rewards of ownership.
(iii) Measurement
At initial recognition, the Group measures a financial asset at its fair value plus, in the case of a financial assetnot at fair value through profit or loss (FVPL), transaction costs that are directly attributable to the acquisition ofthe financial asset. Transaction costs of financial assets carried at FVPL are expensed in profit or loss.
Debt instruments
Subsequent measurement of debt instruments depends on the Group’s business model for managing the assetand the cash flow characteristics of the asset. There are three measurement categories into which the Groupclassifies its debt instruments:
NEXTDC Limited and controlled entities | FY20 Annual Report 94
For
per
sona
l use
onl
y

Notes to the Consolidated Financial Report30 June 2020(continued)
26 Summary of significant accounting policies (continued)
(i) Investments and other financial assets (continued)
(iii) Measurement (continued)
Debt instruments (continued)
• Amortised cost: Assets that are held for collection of contractual cash flows where those cash flows representsolely payments of principal and interest are measured at amortised cost. Interest income from thesefinancial assets is included in finance income using the effective interest rate method. Any gain or loss arisingon derecognition is recognised directly in profit or loss and presented in other gains/(losses) together withforeign exchange gains and losses. Impairment losses are presented as separate line item in theconsolidated income statement.
• FVOCI: Assets that are held for collection of contractual cash flows and for selling the financial assets, wherethe assets’ cash flows represent solely payments of principal and interest, are measured at FVOCI.Movements in the carrying amount are taken through OCI, except for the recognition of impairment gains orlosses, interest income and foreign exchange gains and losses which are recognised in profit or loss. Whenthe financial asset is derecognised, the cumulative gain or loss previously recognised in OCI is reclassifiedfrom equity to profit or loss and recognised in other gains/(losses). Interest income from these financialassets is included in finance income using the effective interest rate method. Foreign exchange gains andlosses are presented in other gains/(losses) and impairment expenses are presented as separate line item inthe consolidated income statement.
• FVPL: Assets that do not meet the criteria for amortised cost or FVOCI are measured at FVPL. A gain or losson a debt investment that is subsequently measured at FVPL is recognised in profit or loss and presented netwithin other gains/(losses) in the period in which it arises.
Equity instruments
The Group subsequently measures all equity investments at fair value. Where the Group’s management haselected to present fair value gains and losses on equity investments in OCI, there is no subsequentreclassification of fair value gains and losses to profit or loss following the derecognition of the investment.Dividends from such investments continue to be recognised in profit or loss as other income when the Group’sright to receive payments is established.
Changes in the fair value of financial assets at FVPL are recognised in other gains/(losses) in the consolidatedincome statement as applicable. Impairment losses (and reversal of impairment losses) on equity investmentsmeasured at FVOCI are not reported separately from other changes in fair value.
(iv) Impairment
The group assesses on a forward looking basis the expected credit losses associated with its debt instrumentscarried at amortised cost and FVOCI. The impairment methodology applied depends on whether there has beena significant increase in credit risk. For trade receivables, the group applies the simplified approach permitted byAASB 9, which requires expected lifetime losses to be recognised from initial recognition of the receivables, seenote 13(b) for further details.
(j) Provisions
Provisions for asset replacement and make good obligations are recognised when the Group has a present legalor constructive obligation as a result of past events, it is probable that an outflow of resources will be required tosettle the obligation and the amount has been reliably estimated. Provisions are not recognised for futureoperating losses.
Where there are a number of similar obligations, the likelihood that an outflow will be required in settlement isdetermined by considering the class of obligations as a whole. A provision is recognised even if the likelihood ofan outflow with respect to any one item included in the same class of obligations may be small.
Provisions are measured at the present value of management's best estimate of the expenditure required tosettle the present obligation at the end of the reporting year. The discount rate used to determine the presentvalue is a pre-tax rate that reflects current market assessments of the time value of money and the risks specificto the liability. The increase in the provision due to the passage of time is recognised as interest expense.
NEXTDC Limited and controlled entities | FY20 Annual Report 95
For
per
sona
l use
onl
y

Notes to the Consolidated Financial Report30 June 2020(continued)
26 Summary of significant accounting policies (continued)
(k) Employee benefits
SHORT-TERM OBLIGATIONS
Liabilities for wages and salaries, including non-monetary benefits and annual leave expected to be settled within12 months after the end of each reporting period in which the employees render the related service arerecognised in respect of employees’ services up to the end of the reporting period and are measured at theamounts expected to be paid when the liabilities are settled. The liability for annual leave is recognised inpayables.
OTHER LONG-TERM EMPLOYEE BENEFIT OBLIGATIONS
The liability for long service leave and annual leave which is not expected to be settled within 12 months after theend of the reporting period in which the employees render the related service is recognised in the provision foremployee benefits and measured as the present value of expected future payments to be made in respect ofservices provided by employees up to the end of the reporting period. Consideration is given to expected futurewage and salary levels, experience of employee departures and periods of service. Expected future paymentsare discounted using market yields at the end of the reporting period on national government bonds with terms tomaturity and currency that match, as closely as possible, the estimated future cash outflows.
SHARE-BASED PAYMENTS
Share-based compensation benefits are provided to participants via the Long Term Incentive Plan.
The fair value of performance rights is recognised as an employee benefits expense with a correspondingincrease in equity. The total amount to be expensed is determined by reference to the fair value granted, whichincludes any market performance conditions and the impact of any non-vesting conditions but excludes theimpact of any service and non-market performance vesting conditions.
Non-market vesting conditions are included in the assumptions. The total expense is recognised over the vestingperiod, which is the period over which all of the specified vesting conditions are to be satisfied. At the end of eachperiod, the Group revises its estimates of the number of rights that are expected to vest based on the non-marketvesting conditions. It recognises the impact of the revision to original estimates, if any, in the ConsolidatedStatement of Comprehensive Income, with a corresponding adjustment to equity.
RETIREMENT BENEFIT OBLIGATIONS
Except for the statutory superannuation guarantee charge, the Group does not have any other retirement benefitobligations.
(l) Rounding of amounts
The Company is of a kind referred to in ASIC Corporations (Rounding in Financial/Directors' Reports) Instrument2016/191, relating to the ‘rounding off’ of amounts in the financial statements. Amounts in the financialstatements have been rounded off in accordance with that Class Order to the nearest thousand dollars, or incertain cases, to the nearest dollar.
(m) Goods and Services Tax (GST)
Revenues, expenses and assets are recognised net of the amount of associated GST, unless the GST incurredis not recoverable from the taxation authority. In this case it is recognised as part of the cost of acquisition of theasset or as part of the expense.
Receivables and payables are stated inclusive of the amount of GST receivable or payable. The net amount ofGST recoverable from, or payable to, the taxation authority is included with other receivables or payables in theConsolidated Balance Sheet.
Cash flows are presented on a gross basis. The GST components of cash flows arising from investing orfinancing activities which are recoverable from, or payable to the taxation authority, are presented as operatingcash flows.
NEXTDC Limited and controlled entities | FY20 Annual Report 96
For
per
sona
l use
onl
y

Notes to the Consolidated Financial Report30 June 2020(continued)
26 Summary of significant accounting policies (continued)
(n) Parent entity financial information
The financial information for the parent entity, NEXTDC Limited, disclosed in note 25 has been prepared on thesame basis as the consolidated financial statements.
(o) Assets in the course of construction
Assets in the course of construction are shown at historical cost. Historical cost includes directly attributableexpenditure on data centre facilities which at reporting date, has not yet been finalised and/or ready for use.Assets in the course of construction are not depreciated.
Assets in the course of construction are transferred to property, plant and equipment upon successful testing andcommissioning.
(p) Revenue received in advance
Revenue received in advance primarily relates to the advance consideration received from customers in relationto project fees and service credits, for which revenue is recognised over time.
NEXTDC Limited and controlled entities | FY20 Annual Report 97
For
per
sona
l use
onl
y

Directors' Declaration30 June 2020
In the Directors' opinion:
(a) the financial statements and notes set out on pages 52 to 97 are in accordance with the Corporations Act2001, including:
(i) complying with Accounting Standards, the Corporations Regulations 2001 and other mandatoryprofessional reporting requirements, and
(ii) giving a true and fair view of the consolidated entity's financial position as at 30 June 2020 and ofits performance for the financial year ended on that date, and
(b) there are reasonable grounds to believe that the Company will be able to pay its debts as and when theybecome due and payable, and
(c) at the date of this declaration, there are reasonable grounds to believe that the Group will be able to payits debts as and when they become due and payable, and
Note 26 confirms that the financial statements also comply with International Financial Reporting Standards asissued by the International Accounting Standards Board.
The Directors have been given the declarations by the chief executive officer and chief financial officer requiredby section 295A of the Corporations Act 2001.
This declaration is made in accordance with a resolution of Directors.
Craig ScroggieDirector
Sydney27 August 2020
NEXTDC Limited and controlled entities | FY20 Annual Report 98
For
per
sona
l use
onl
y

Independent auditor’s report To the members of NEXTDC Limited
Report on the audit of the financial report
Our opinion In our opinion:
The accompanying financial report of NEXTDC Limited (the Company) and its controlled entities (together the Group) is in accordance with the Corporations Act 2001 , including:
(a) giving a true and fair view of the Group's financial position as at 30 June 2020 and of its financialperformance for the year then ended
(b) complying with Australian Accounting Standards and the Corporations Regulations 2001 .
What we have audited The Group financial report comprises:
● the consolidated balance sheet as at 30 June 2020● the consolidated statement of comprehensive income for the year then ended● the consolidated statement of changes in equity for the year then ended● the consolidated statement of cash flows for the year then ended● the notes to the consolidated financial statements, which include a summary of significant
accounting policies● the directors’ declaration.
Basis for opinion We conducted our audit in accordance with Australian Auditing Standards. Our responsibilities under those standards are further described in the Auditor’s responsibilities for the audit of the financial report section of our report.
We believe that the audit evidence we have obtained is sufficient and appropriate to provide a basis for our opinion.
Independence We are independent of the Group in accordance with the auditor independence requirements of the Corporations Act 2001 and the ethical requirements of the Accounting Professional and Ethical Standards Board’s APES 110 Code of Ethics for Professional Accountants (including Independence Standards) (the Code) that are relevant to our audit of the financial report in Australia. We have also fulfilled our other ethical responsibilities in accordance with the Code.
PricewaterhouseCoopers, ABN 52 780 433 757 480 Queen Street, BRISBANE QLD 4000, GPO Box 150, BRISBANE QLD 4001 T: +61 7 3257 5000, F: +61 7 3257 5999, www.pwc.com.au
Liability limited by a scheme approved under Professional Standards Legislation.
NEXTDC Limited and controlled entities | FY20 Annual Report 99
For
per
sona
l use
onl
y

Our audit approach An audit is designed to provide reasonable assurance about whether the financial report is free from material misstatement. Misstatements may arise due to fraud or error. They are considered material if individually or in aggregate, they could reasonably be expected to influence the economic decisions of users taken on the basis of the financial report.
We tailored the scope of our audit to ensure that we performed enough work to be able to give an opinion on the financial report as a whole, taking into account the geographic and management structure of the Group, its accounting processes and controls and the industry in which it operates.
Materiality Audit scope Key audit matters
● For the purpose of our auditwe used overall Groupmateriality of $2.6 million,which representsapproximately 2.5% of theGroup's Earnings BeforeInterest, Tax, Depreciationand Amortisation (EBITDA).
● We applied this threshold,together with qualitativeconsiderations, to determinethe scope of our audit and thenature, timing and extent ofour audit procedures and toevaluate the effect ofmisstatements on the financialreport as a whole.
● We chose EBITDA because, inour view, it is the benchmarkagainst which the performanceof the Group is mostcommonly measured.
● We utilised a 2.5% thresholdbased on our professionaljudgement, noting it is withinthe range of commonlyacceptable thresholds.
● Our audit focused on wherethe Group made subjectivejudgements; for example,significant accountingestimates involvingassumptions and inherentlyuncertain future events.
● NEXTDC has data centresoperating in capital citiesacross Australia.
● Amongst other relevant topics,we communicated the followingkey audit matters to the Auditand Risk Committee:− Data centre services
revenue recognition− Non-current asset
additions● These are further described in
the Key audit matters section ofour report.
NEXTDC Limited and controlled entities | FY20 Annual Report 100
For
per
sona
l use
onl
y

Key audit matters Key audit matters are those matters that, in our professional judgement, were of most significance in our audit of the financial report for the current period. The key audit matters were addressed in the context of our audit of the financial report as a whole, and in forming our opinion thereon, and we do not provide a separate opinion on these matters. Further, any commentary on the outcomes of a particular audit procedure is made in that context.
Key audit matter How our audit addressed the key audit matter
Data centre services revenue recognition Refer to Note 3 Revenue and Other income ($201m)
The Group applies AASB 15 Revenue from Contracts with Customers to account for the services it provides to its customers.
Accounting for revenue recognition was a key audit matter due to the:
● significance of revenue to understanding thefinancial results for users of the financialreport;
● complexity involved in applying therequirements of AASB 15 given the number ofrevenue streams and contracts with customerswith bespoke terms and conditions, includingin relation to recurring service fees, upfrontproject fees and service credits;
● judgements required by the Group in applyingthe requirements of AASB 15, such as:
o identifying the performanceobligations under its contracts withcustomers; and
o determining the transaction price,considering the terms in thecontracts relating to recurringservice fees, upfront project fees, andservice credits;
o the method of allocating thetransaction price in the contract tothe performance obligations.
We performed the following procedures, amongst others:
● Assessed whether the Group’s accountingpolicies were in accordance with therequirements of AASB 15 Revenue fromContracts with Customers;
● Evaluated the judgements made by the Groupin applying the accounting policy by obtainingan understanding of the revenue streams andconsidering the terms and conditions of asample of contracts;
● For a sample of contracts for each revenuestream, we:
o developed an understanding of thekey terms of the arrangementincluding parties, term dates,performance obligations andpayment terms;
o considered the Group’s identificationof performance obligations andallocation of the transaction prices tothe performance obligations;
o recalculated the amount of revenuewhich the Group has recognised,taking into account the terms of thecontracts for recurring service fees,upfront project fees, and servicecredits.
● Evaluated the adequacy of the disclosuresmade in Note 3 in light of the requirements ofAustralian Accounting Standards.
NEXTDC Limited and controlled entities | FY20 Annual Report 101
For
per
sona
l use
onl
y

Key audit matter How our audit addressed the key audit matter
Non-current asset additions Refer to Note 8 Property, plant and equipment($1,671m) and Note 9 Intangible assets ($29m)
NEXTDC has continued to invest in new data centres during the period, and to expand its existing data centre infrastructure. These growth projects require significant capital outlay which results in the capitalisation of external and internal costs into Property, Plant and Equipment and Intangible Assets.
During the current year, $411m has been capitalised as additions to Property, Plant and Equipment, while $7m has been capitalised to Intangible Assets.
Costs should be capitalised in line with Australian Accounting Standards which outline the criteria required for costs to be capitalised.
This was a key audit matter because of the:
● significance of the additions balance to theConsolidated Balance Sheet;
● judgement involved in assessing whetherinternally generated intangible assets meetthe criteria for capitalisation by reference tothe appropriate accounting requirements; and
● potential significance of the additions balanceto the Consolidated Statement ofComprehensive Income should the costs notmeet the criteria required for capitalisation.
Our audit approach included testing individually large value additions, while the residual balance of additions were tested on a sample basis.
Additional focus was paid to internal costs capitalised as these are deemed more judgemental. In particular, costs relating to salaries and wages were an area of focus.
We performed the following procedures, amongst others:
● Developed an understanding of and evaluatedthe Group’s cost capitalisation policy;
● Assessed the processes implemented by theGroup for the measurement of capitalisedcosts;
● Sample tested capitalised costs to relateddocumentation, including assessing whetherthey meet the criteria for capitalisation withreference to Australian Accounting Standards;and
● For a sample of assets, assessed the timingand method of transfers from assets in thecourse of construction to the appropriateproperty, plant and equipment asset class,and recalculated the amount of depreciationthat the Group had recognised.
NEXTDC Limited and controlled entities | FY20 Annual Report 102
For
per
sona
l use
onl
y

Other information The directors are responsible for the other information. The other information comprises the information included in the annual report for the year ended 30 June 2020, but does not include the financial report and our auditor’s report thereon.
Our opinion on the financial report does not cover the other information and accordingly we do not express any form of assurance conclusion thereon.
In connection with our audit of the financial report, our responsibility is to read the other information and, in doing so, consider whether the other information is materially inconsistent with the financial report or our knowledge obtained in the audit, or otherwise appears to be materially misstated.
If, based on the work we have performed on the other information that we obtained prior to the date of this auditor’s report, we conclude that there is a material misstatement of this other information, we are required to report that fact. We have nothing to report in this regard.
Responsibilities of the directors for the financial report The directors of the Company are responsible for the preparation of the financial report that gives a true and fair view in accordance with Australian Accounting Standards and the Corporations Act 2001 and for such internal control as the directors determine is necessary to enable the preparation of the financial report that gives a true and fair view and is free from material misstatement, whether due to fraud or error.
In preparing the financial report, the directors are responsible for assessing the ability of the Group to continue as a going concern, disclosing, as applicable, matters related to going concern and using the going concern basis of accounting unless the directors either intend to liquidate the Group or to cease operations, or have no realistic alternative but to do so.
Auditor’s responsibilities for the audit of the financial report Our objectives are to obtain reasonable assurance about whether the financial report as a whole is free from material misstatement, whether due to fraud or error, and to issue an auditor’s report that includes our opinion. Reasonable assurance is a high level of assurance, but is not a guarantee that an audit conducted in accordance with the Australian Auditing Standards will always detect a material misstatement when it exists. Misstatements can arise from fraud or error and are considered material if, individually or in the aggregate, they could reasonably be expected to influence the economic decisions of users taken on the basis of the financial report.
A further description of our responsibilities for the audit of the financial report is located at the Auditing and Assurance Standards Board website at: https://www.auasb.gov.au/admin/file/content102/c3/ar1_2020.pdf . This description forms part of our auditor's report.
NEXTDC Limited and controlled entities | FY20 Annual Report 103
For
per
sona
l use
onl
y

Report on the remuneration report
Our opinion on the remuneration report We have audited the remuneration report included in pages 30 to 48 of the directors’ report for the year ended 30 June 2020.
In our opinion, the remuneration report of NEXTDC Limited for the year ended 30 June 2020 complies with section 300A of the Corporations Act 2001.
Responsibilities The directors of the Company are responsible for the preparation and presentation of the remuneration report in accordance with section 300A of the Corporations Act 2001 . Our responsibility is to express an opinion on the remuneration report, based on our audit conducted in accordance with Australian Auditing Standards.
PricewaterhouseCoopers
Michael Shewan Brisbane Partner 27 August 2020
NEXTDC Limited and controlled entities | FY20 Annual Report 104
For
per
sona
l use
onl
y

Shareholder Information30 June 2020
The following shareholder information was applicable as at 19 August 2020.
Distribution of equity securities
HoldingNumber ofinvestors
Number ofsecurities
100,001 and over 89 373,300,95210,001 - 100,000 1,848 38,275,0975,001 - 10,000 2,700 19,286,5501,001 - 5,000 7,891 20,032,6101 - 1000 11,152 4,151,255Total 23,680 455,046,464
Equity security holders
The names of the twenty largest holders of quoted equity securities are listed below:
Name
Number heldPercentage ofissued shares
1. HSBC CUSTODY NOMINEES (AUSTRALIA) LIMITED 139,126,068 30.572. J P MORGAN NOMINEES AUSTRALIA LIMITED 85,862,154 18.873. BNP PARIBAS NOMINEES PTY LTD <AGENCY LENDING DRP A/C> 33,946,705 7.464. CITICORP NOMINEES PTY LIMITED 30,851,770 6.785. NATIONAL NOMINEES LIMITED 28,480,480 6.266. BNP PARIBAS NOMS PTY LTD <DRP> 10,543,735 2.327. AUSTRALIAN FOUNDATION INVESTMENT COMPANY LIMITED 7,864,487 1.738. HSBC CUSTODY NOMINEES (AUSTRALIA) LIMITED 3,622,352 0.809. UBS NOMINEES PTY LTD 2,472,750 0.5410. HSBC CUSTODY NOMINEES (AUSTRALIA) LIMITED - A/C 2 1,970,085 0.4311. CITICORP NOMINEES PTY LIMITED <COLONIAL FIRST STATE INVA/C> 1,946,784 0.4312. MR CRAIG IAN SCROGGIE 1,605,744 0.3513. NETWEALTH INVESTMENTS LIMITED <WRAP SERVICES A/C> 1,605,078 0.3514. BNP PARIBAS NOMS (NZ) LTD <DRP> 1,537,238 0.3415. BNP PARIBAS NOMINEES PTY LTD <IB AU NOMS RETAIL CLIENTDRP> 1,207,253 0.2716. MIRRABOOKA INVESTMENTS LIMITED 1,178,205 0.2617. BNP PARIBAS NOMINEES PTY LTD HUB24 CUSTODIAL SERV LTD<DRP A/C> 1,024,399 0.2318. HSBC CUSTODY NOMINEES (AUSTRALIA) LIMITED-GSCO ECA 763,694 0.1719. SUAVE INVESTMENTS PTY LTD 756,844 0.1720. PACIFIC CUSTODIANS PTY LIMITED 753,173 0.17
357,118,998 78.50
Unquoted equity securitiesNumberon issue
Numberof holders
Performance rights - issued in FY18 743,078 15Performance rights - issued in FY19 828,285 22Performance rights - issued in FY20 754,809 26Deferred share rights - issued in FY20 13,517 2
NEXTDC Limited and controlled entities | FY20 Annual Report 105
For
per
sona
l use
onl
y
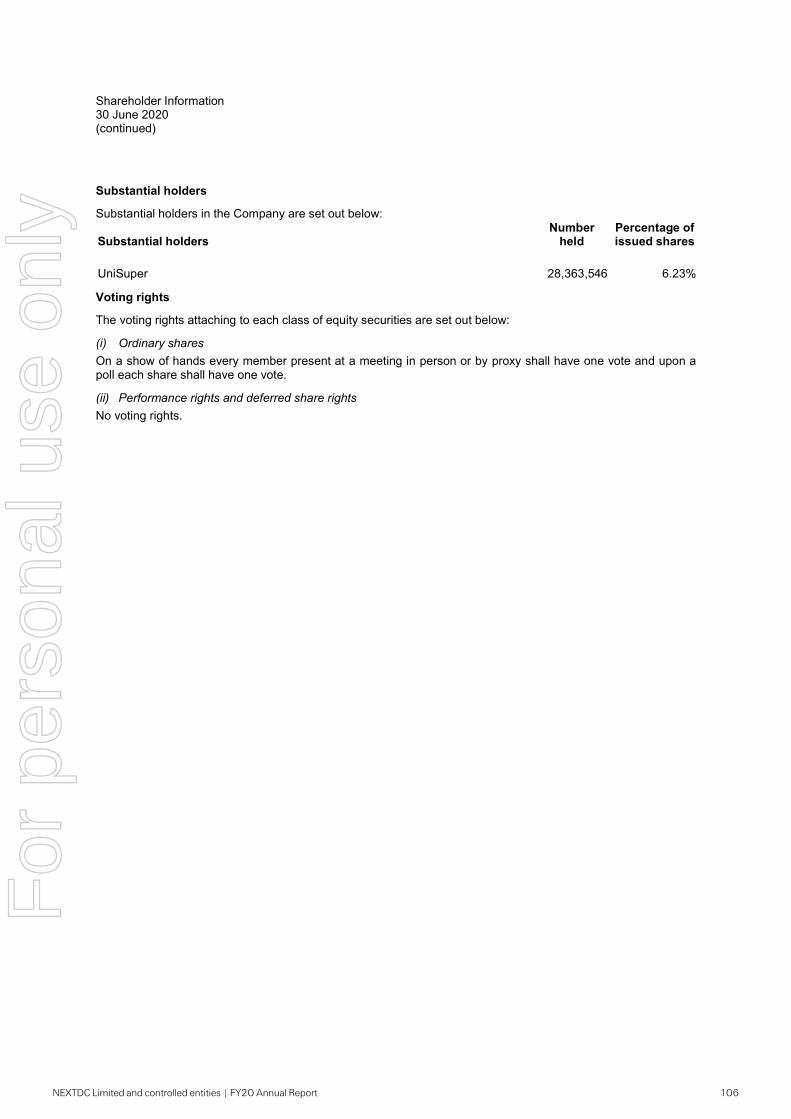
Shareholder Information30 June 2020(continued)
Substantial holders
Substantial holders in the Company are set out below:
Substantial holdersNumberheld
Percentage ofissued shares
UniSuper 28,363,546 6.23%
Voting rights
The voting rights attaching to each class of equity securities are set out below:
(i) Ordinary shares
On a show of hands every member present at a meeting in person or by proxy shall have one vote and upon apoll each share shall have one vote.
(ii) Performance rights and deferred share rights
No voting rights.
NEXTDC Limited and controlled entities | FY20 Annual Report 106
For
per
sona
l use
onl
y

NEXTDC LimitedCorporate Directory
Directors Douglas FlynnChairmanCraig ScroggieChief Executive OfficerStuart DavisNon-Executive DirectorDr Gregory J Clark ACNon-Executive DirectorSharon Warburton (resigned 31 March 2020)Non-Executive DirectorStephen Smith (appointed 1 July 2019)Non-Executive DirectorJennifer Lambert (appointed 1 October 2019)Non-Executive DirectorDr Eileen Doyle (appointed 26 August 2020)Non-Executive Director
Company secretary Michael Helmer
Registered office 20 Wharf StBrisbane Qld 4000Tel: +61 7 3177 4777
Website address www.nextdc.com
Auditor PricewaterhouseCoopers480 Queen StreetBrisbane Qld 4000+61 7 3257 5000
Solicitors Clayton UtzLevel 28, Riparian Plaza71 Eagle StreetBrisbane Qld 4000
Herbert Smith FreehillsANZ Tower161 Castlereagh StreetSydney NSW 2000
Share register Link Market ServicesLevel 21,10 Eagle StreetBrisbane Qld 4000Tel: 1300 554 474 (in Australia)Tel: +61 (2) 8280 7111 (overseas)
Stock exchange listing NEXTDC Limited shares are listed on the AustralianSecurities Exchange (ASX) under ticker code NXT.
NEXTDC Limited and controlled entities | FY20 Annual Report 107
For
per
sona
l use
onl
y

1 July 2019 to 30 June 2020
NEXTDC Limited
ABN 35 143 582 521
where the cloud lives™
For any queries related to NEXTDC’s
Annual Report please contact us at
For
per
sona
l use
onl
y