fy 2016 results - alpha bank · 9m 2013 resultsfy 2013 resultsfy 2016 results 4 i growth drivers...
TRANSCRIPT

F Y 2 0 1 6 R e s u l t s
March 30, 2017

9M 2013 Results FY 2013 Results 2 FY 2016 Results 2
This presentation contains forward-looking statements, which include comments with respect to our objectives and strategies, and the results of our operations and our business,
considering environment and risk conditions.
However, by their nature, these forward-looking statements involve numerous assumptions, uncertainties and opportunities, both general and specific. The risk exists that these
statements may not be fulfilled. We caution readers of this presentation not to place undue reliance on these forward-looking statements as a number of factors could cause future Group
results to differ materially from these targets.
Forward-looking statements may be influenced in particular by factors such as fluctuations in interest rates, exchange rates and stock indices, the effects of competition in the areas in
which we operate, and changes in economic, political, regulatory and technological conditions. We caution that the foregoing list is not exhaustive.
When relying on forward-looking statements to make decisions, investors should carefully consider the aforementioned factors as well as other uncertainties and events.
Pages
I. Macroeconomic Update 3
II. FY 16 Performance Highlights 7
III. FY 16 Performance 20
1. Balance Sheet 20
2. Pre Provision Income 22
3. Asset Quality 26
4. Liquidity 32
5. Capital 35
IV. Appendix 37
Table of Contents

3 FY 2016 Results 3
I. Macroeconomic Update

9M 2013 Results FY 2013 Results 4 FY 2016 Results 4
I
Growth Drivers from 2017 Onwards: Could They Shift to the Investment Side?
Macro Dynamics Remain Weak Reflecting the Lingering Uncertainty
Unemployment Declined with New Jobs in Tourism, Industry
and Public Administration
Business and Consumer Confidence: Two faces of Janus?
-90
-80
-70
-60
-50
-40
-30
-20
-10
0
40
50
60
70
80
90
100
110
Business Confidence in Industry, lhs Business Confidence in Retail Trade, lhs Consumer Confidence Indicator, rhs
Source: ELSTAT, Alpha Bank calculations
Source: IOBE
15
17
19
21
23
25
27
29
-12
-10
-8
-6
-4
-2
0
2
4
2012 2013 2014 2015 2016 2017f 2018f
Public Consumption Net Exports
Private Consumption Investment (inc.inventories)
GDP, % yoy (E.C. forecasts) GDP (Alpha forecasts)
Unemployment Rate (%)
Resilience
Stagnation
Capital
Controls
Unemployment
Rate
pps
Source: ELSTAT, Alpha Bank calculations
-40
-20
0
20
40
60
80
100
120
140
-500.0
-400.0
-300.0
-200.0
-100.0
0.0
100.0
2010 2011 2012 2013 2014 2015 2016
Other Services
Public Adin. & Non-Business Sector*
Tourism
Trade
Construction
Industry
Agriculture
Part-time
Full- time
Bars: Contributions of New Jobs per Sector (yearly change in thousand employees, lhs)
Lines: Full-time and Part-time employment (Index 2010=100, rhs)
* Includes: Public Administration, Defence, Social Security, Education, Health, Arts
thous.
The Greek economy stalled in 2016 for a second consecutive year (2015: -0.2%,
2016: 0.0%), yet showing signs of resilience despite the imposition of capital
controls in July 2015
Private consumption growth was a solid 1.4% in 2016 despite the households’
tax burden, investment remain unchanged, while net exports subtracted 0.5
points from GDP
Our baseline scenario envisages an output expansion at a pace between 1.5%
and 1.7% in 2017. It necessitates an investment growth exceeding 10%, so that
net fixed capital formation, i.e. gross investment minus depreciation, to turn
positive again
New job contracts in private sector referring to part-time and temporary
employment account for 54.7% of total contracts, in 2016, outweighing full time
contracts that account for 45.3%

9M 2013 Results FY 2013 Results 5 FY 2016 Results 5
I
Drivers of the Over-Performance of Primary Surplus (State Budget) in 2016
Against the Target Set
Source: Min.Fin.
Fiscal Performance Better Than Targeted in 2016
Fiscal Discipline Is Getting More Intense . . .
Source: Min.Fin.
. . . But Private Sector Arrears to the State Are Accumulating
% of GDP
-20
-15
-10
-5
0
5
2009 2010 2011 2012 2013 2014 2015 2016e 2017f 2018f
General Government Primary Balance
General Government Balance
General Government Primary BalanceTarget
40.0
95.3
30
40
50
60
70
80
90
100
2010 2013 2015 Q1 2016 Q2 2016 Q3 2016 Q4 2016 2016
Private Arrears to the Public Sector Private Arrears, Quarterly +
in € bn
-0.6
-0.4
-0.2
0
0.2
0.4
0.6
0.8
Personal Income Tax
Property Tax VAT Excise Tax on Fuel
Primary Expenditure
PIB* Expenditure
in € bn
Source: Min.Fin.
* Public Investment Budget
Fiscal outcome, in 2016, is better than targeted on the back of:
tax rate hikes applied upon an almost stable economic activity
government arrears’ clearance at low pace and
the extensive use of electronic transactions.
The most recent budget execution data point to a general government
primary surplus close to 2.0% of GDP for the full-year 2016, well in excess of
the respective program target set for 0.5% surplus
Primary surplus target in 2017 budget is well within reach, conditional on:
a rise in domestic economic activity as well as
the smooth implementation of the agreed structural measures aiming
to curb tax evasion and broaden the tax base

9M 2013 Results FY 2013 Results 6 FY 2016 Results 6
I
Source: ELSTAT
Inflation, Production and Competitiveness
Deflation Pressures Eased
Source: ELSTAT, EC Forecasts Winter 2017
Unit Labour Cost (ULC) and Price Competitiveness
-15
-10
-5
0
5
10
15
-6
-4
-2
0
2
4
6
HICP, lhs
Output Gap, rhs
ULC, rhs 80
85
90
95
100
105
110
115
I II III IV I II III IV I II III IV I II III IV I II III IV I II III IV I II III IV I II III
2009 2010 2011 2012 2013 2014 2015 2016
REER* (ULC based) REER* (CPI based)
Competitiveness
recouped
• Tax hikes
• Risk premium
• Distortions in the
product markets
% %
%
Source: Eurostat
-10
-8
-6
-4
-2
0
2
4
Manufacturing Production (Index, 12-month mov. average % yoy)
Retail Trade (Index, 12-month mov. average % yoy)
Retail Trade excl. Fuel (Index, 12-month mov. average % yoy)
Hard Data: Industrial Production and Retail Sales (Turnover index at current prices)
* Real Effective Exchange Rate
Deflation pressures have eased in 2016 (HICP: 0%) as a result of the significant
increase of tax rates on consumption and the upward trend in energy prices in the
last two months of 2016
Internal devaluation in accordance with labour market flexibility resulted in
significant declines in unit labour cost
It is indicative that real effective exchange rate (REER) measured by unit labour
cost showed significant improvement
However, competitiveness measured by CPI improved only slightly, implying
rigidities in the product market that hamper price adjustments

7 FY 2016 Results 7
II. FY 16 Performance Highlights

9M 2013 Results FY 2013 Results 8 FY 2016 Results 8
Restoration in profitability in 2016 supports capital preservation ahead of further
balance sheet restructuring; FY 16 Profit after Tax at €42mn II
Note: P&L numbers restated for the sale of Serbia
1 Includes €71.9mn related to the acquisition of Visa Europe from VISA Inc. in Q2 2016
Profit & Loss (€ million) FY
2016
FY
2015
yoy %
change
Q4
2016
Q3
2016
qoq %
change
Net Interest Income (NII) 1,924 1,897 1.4% 490 481 1.8%
Fees and commissions Income 318 309 3.0% 81 81 0.1%
Trading & Other Income 1 142 5 … 31 25 …
Operating Income 2,384 2,211 7.8% 602 587 2.5%
Total Operating Expenses (1,226) (1,267) (3.3%) (356) (281) 26.3%
Recurring Operating Expenses (1,108) (1,134) (2.3%) (285) (281) 1.2%
Pre Provision Income (PPI) 1,158 944 22.7% 247 306 (19.3%)
Core Pre Provision Income 1,191 1,123 6.0% 302 297 1.5%
Impairment Losses (1,168) (2,988) (60.9%) (304) (258) 17.7%
Profit/ (Loss) before income tax
(PBT) (10) (2,043) … (57) 48 …
Income Tax 29 807 … 62 (8) …
Profit/ (Loss) after income tax from
Discontinued Operations 23 (135) … 15 1 …
Profit/ (Loss) after income tax 42 (1,372) … 20 41 (51.0%)
Net Interest Margin (NIM) 2.9% 2.7% 3.0% 2.9%
Recurring Cost to Income ratio 48.2% 50.2% 48.6% 48.6%
Core PPI at € 1,191mn for the FY 16, up by 6% yoy, driven by an improved core
revenue performance and operating efficiencies. NIM improved by 20bps yoy to
2.9%
Recurring OPEX at €1,108 million, down by 2.3% yoy. Cost to income ratio at
48.2% for FY 16
Eurosystem funding further reduced to €18.3bn driven by deposits inflows,
EFSF bonds disposals and SME securitisation
NPLs at 38.1%. Cash coverage of 69%, supports implementation of NPE/NPL
reduction plan
LLPs at € 304mn in Q4, with Cost of Risk at 2.01% of gross loans
CET1 ratio increased to 17.1%. Tangible Equity at € 8.7bn. Tangible Book
Value per share at €5.66
Balance Sheet (€ billion) 31/12/2016 31/12/2015
Assets 64.9 69.3
Net Loans 44.4 46.2
Deposits 32.9 31.4
Eurosystem Funding 18.3 24.4
Tangible Equity (TE) 8.7 8.7
Common Equity Tier 1 ratio (CET1) 17.1% 16.6%
NPL ratio 38.1% 36.8%
Cash Coverage 69% 69%
Total Coverage 125% 126%
NPE ratio 53.7% 51.3%
Cash Coverage 49% 50%
Total Coverage 106% 108%

9M 2013 Results FY 2013 Results 9 FY 2016 Results 9
16.8% 6 bps 11 bps 5 bps 17.1% 20bps 17.3% 17.3% 17.0%
CET 1 Sep-16
Period Result
AFS Reserve
RWA impact / Other
CET 1 Dec-16
Sale of Serbia CET 1 Dec-16
Proforma
Total Capital Adequacy Ratio
Dec-16 Proforma
FL CET1 Dec-16
Proforma
CET1 ratio quarterly build up adjusted for the sale of Serbia
II Common Equity Tier I Ratio increased further to 17.3%, including the positive impact
from the sale of Serbia; Fully Loaded ratio at 17%
1 Proforma includes the positive impact from the sale of Serbia
CET1
capital 8,560 8,631
(€ million)
QoQ +50bps
1 1
FL CET 1 at 11.3% even if Tax Credit law 4340/2015 not implemented
17.0%
(6.8%)
+1.1% 11.3%
FL CET 1 Dec-16
Proforma
Tax Credit RWA relief FL CET 1 Dec-16
Proforma
High CET1 ratio at 17.1% at the end of 2016, up by 30bps qoq
CET 1 ratio at 17.3% and Fully Loaded CET 1 ratio at 17.0% adjusted for the impact from
the sale of Serbia
RWA over Total Assets at 78% based on the standardised method
1
Total SREP Capital
Requirement (TSCR)
for 2017 at 12.25%
1
Without implementation of
DTC law
1
9M 2013 Results FY 2013 Results 10 FY 2016 Results 10
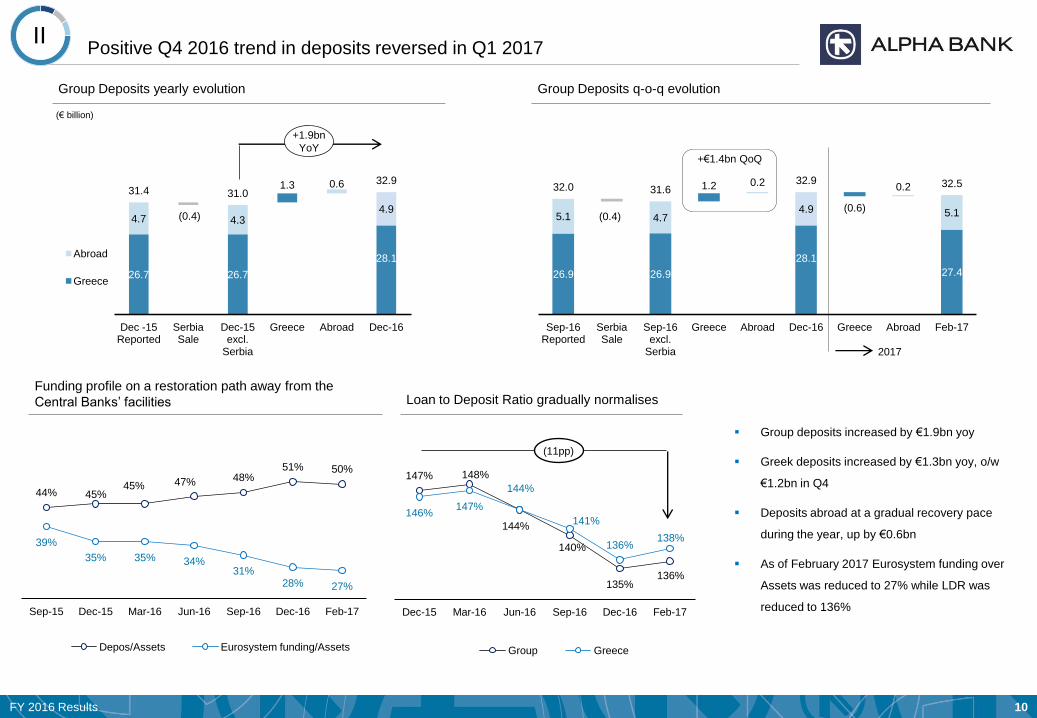
26.7 26.7
1.3
28.1
4.7 4.3
0.6
4.9 (0.4)
31.4 31.0
32.9
Dec -15 Reported
Serbia Sale
Dec-15 excl.
Serbia
Greece Abroad Dec-16
Abroad
Greece
Positive Q4 2016 trend in deposits reversed in Q1 2017 II
44% 45% 45% 47% 48%
51% 50%
39%
35% 35% 34% 31%
28% 27%
Sep-15 Dec-15 Mar-16 Jun-16 Sep-16 Dec-16 Feb-17
Depos/Assets Eurosystem funding/Assets
Group deposits increased by €1.9bn yoy
Greek deposits increased by €1.3bn yoy, o/w
€1.2bn in Q4
Deposits abroad at a gradual recovery pace
during the year, up by €0.6bn
As of February 2017 Eurosystem funding over
Assets was reduced to 27% while LDR was
reduced to 136%
Funding profile on a restoration path away from the
Central Banks’ facilities
Group Deposits yearly evolution
Loan to Deposit Ratio gradually normalises
(€ billion)
147% 148%
144%
140%
135% 136%
146% 147%
144%
141%
136% 138%
Dec-15 Mar-16 Jun-16 Sep-16 Dec-16 Feb-17
Group Greece
(11pp)
+1.9bn
YoY
26.9 26.9
1.2
28.1
(0.6)
27.4
5.1 (0.4) 4.7
0.2
4.9
0.2
5.1
32.0 31.6 32.9 32.5
Sep-16 Reported
Serbia Sale
Sep-16 excl.
Serbia
Greece Abroad Dec-16 Greece Abroad Feb-17
+€1.4bn QoQ
2017
Group Deposits q-o-q evolution

9M 2013 Results FY 2013 Results 11 FY 2016 Results 11
4.8 5.2 4.8
(1.9)
(2.2) (0.3) (1.4)
(0.3) (0.5) 19.6
13.2 13.0
24.4
18.3 17.8
Dec-15 Deposits Inflows
Securities Disposal
Securitisation SME
Other B/S items
Interbank Repo
Dec-16 Feb-17
ECB ELA
Eurosystem reliance down by c.€6bn or -25% YoY;
Repo activity resumed since year end 2016 II
Eurosystem funding YoY reduction
(€ billion)
9.2
1.0 0.3
0.7 0.2
Dec-15 Dec-16 Feb-17 adjusted
Nominal Value Cash Value
(€ billion)
Pillar II reduced significantly, minimal balance
outstanding
o/w -€1.0bn Loans Deleveraging
1
o/w 2.2
EFSF
bonds
1 Adjusted for partial repayment of €700mn nominal value of Pillar II bonds on 14th of March 2017
o/w €1.6bn EFSF sale
0.3
0.6
1.2
Dec-15 Dec-16 Feb-17
Repos transactions up by €0.9bn since Dec. ‘15
€0.6bn
€0.3bn
(€ billion) -€8.9bn
o/w +€0.6bn Repos
-€6.1bn Eurosystem reliance at €18.3bn at the end of 2016,
mainly benefited by inflow of deposits, securities and B/S
deleveraging
Eurosystem funding reduced further in Feb. 2017 to
€17.8bn mainly due to repo transactions
Pillar 2 bonds reduced to €0.3bn to be fully repaid in the
coming months
Interbank repos increased to €1.2bn as of Feb. 2017,
gradually diversifying the Bank’s funding profile
TLTRO II as of end March at €3.1bn
Replacement of ELA funding, apart from banking book
evolution, will be driven by certain refinancing initiatives
with the restoration of market conditions
Covered bonds
Securitisations
Interbank repo
Senior bond issuance

9M 2013 Results FY 2013 Results 12 FY 2016 Results 12
Core PPI FY 16 at €1.2bn
Solid core PPI performance despite B/S deleveraging by €4.4bn II
2.3
(1.1)
1.2 €1.2bn
Core Operating Income
FY 16
Recurring Expenses
FY 16
Core PPI FY 16
2016 Target
1 Restated figures backward due to discontinued operations in Serbia
479 476 477
481
490
2.76% 2.77%
2.81%
2.88%
2.99%
465
475
485
495
505
Q4 15 Q1 16 Q2 16 Q3 16 Q4 16
NII NIM
(€ billion)
Net Interest Margin (NIM) remains strong
1 1
Core PPI1 improved driven by increased NII in Q4
306 9 297 9 0
(4)
302 16
(71)
247
Q3 16 Reported
PPI
Trading and one-off costs
Q3 16 Core PPI
Δ NII Δ Fees Δ OPEX & other income
Q4 16 Core PPI
Trading Οne-off costs
Q4 16 Reported
PPI
(€ million)
€ 54mn impairment of assets
€ 4mn integration costs
€ 13mn other
(1.8) (2.2) (0.4 )
69.3
64.9
Dec-15 Net loans Securities Other Dec-16
Balance sheet deleveraging
(€ billion)
-€4.4bn
(€ million)

9M 2013 Results FY 2013 Results 13 FY 2016 Results 13
(6)
0
11 4 481
490
Q3 16 (restated)
Loans Deposits Funding Bonds & other
Q4 16
NII improvement mainly driven by the decrease in cost of funding II
NII qoq on the back of lower funding cost
(€ million)
Decreasing funding cost both in Eurosystem and time deposits
1.07%
0.93% 0.82% 0.81%
0.75% 0.68%
1.67% 1.59%
1.48%
1.29% 1.21%
Q4 15 Q1 16 Q2 16 Q3 16 Q4 16 Feb-17
New time depos rates Funding cost incl. Pillar II fees
NII yoy
(€ million)
(264) (200)
(385) (307)
(148)
63 78 34
2,228 2,080
318 352
1,897 1,925
FY 15 Loans Deposits Funding Bonds & Others
FY 16
Bonds & Other
Loans
Funding
Depos
o/w €46mn related to Pillar II
and €32mn from ELA-ECB
Basic Balance Sheet Funding sources
56% 63%
35% 25%
8.5% 10%
0.5% 2%
Dec -15 Dec-16
Repos
ECB Funding
ELA Funding
Deposits
+7%
-10%

9M 2013 Results FY 2013 Results 14 FY 2016 Results 14
Fee generation supported by improved performance of our card business II
Income from Cards and Acquiring
Fee & Commission Income up by 3% yoy mainly on the back of
increased card usage
Debit card turnover more than doubled in FY 16 vs. a year ago
Alpha Bank sole Issuer in Greece of Amex & Diners Cards
Alpha is the only Bank accepting cards from all the major Payment
Schemes (Visa, MasterCard, Amex, Diners, China Union Pay)
Upon normalisation of the economic conditions, fee generation from
Loans and Asset Management to further contribute to the Net Fees
& Commission Income
57
64
FY 15 FY 16
12%
(€ million)
Credit and Debit Cards Turnover and Merchant Sales
%
Total
1.8 2.2
1.2
2.5 3.1
4.6
FY 15 FY 16
Credit Debit
40%
60%
Turnover
53%
47%
2x
49%
2.7
4.2
1.6
1.8 4.3
6.1
FY 15 FY 16
Greek cards International cards
37%
63%
30%
70%
(€ billion)
58%
15%
42%
Merchant Acquiring Sales
Net Fees & Commission Income
(€ million)
262.0 275.3
40.1 34.8
6.5 7.8
308.6 317.9
FY 15 FY 16
Investment Banking & Brokerage
Asset Gathering
Commercial Banking
3%
5%

9M 2013 Results FY 2013 Results 15 FY 2016 Results 15
-3.5%
-0.5%
-5.0%
519 501
513 510
103 97
1,134 1,108
Dec -15 Dec-16
Depreciation & Amortization
G&As
Staff costs
1,150 1,120 1,108
(30)
FY 16 Target
Serbia Discontinued operations
FY 16 Target adj. for
Serbia sale
FY 16 Actual adj. for
Serbia sale
OPEX beat target set for FY 16 on the back of the ongoing platform rationalisation II
Recurring Operating Expenses
Employees
(€ million)
(249) (921) (24) (323) (476)
13,856
11,863
Dec-15 Cyprus VSS
Serbia Sale
Abroad Hilton Greece Dec-16
Branches
(76)
(7)
(93)
897
721
Dec-15 Serbia Sale
Abroad Greece Dec-16
Recurring Operating Expenses decreased by 2.3% yoy
(€ million)
-€26mn
-2.3%
-1,993
-14% 65%
54%
50% 48%
2013 2014 2015 2016
Recurring C/I ratio
-176
-20%
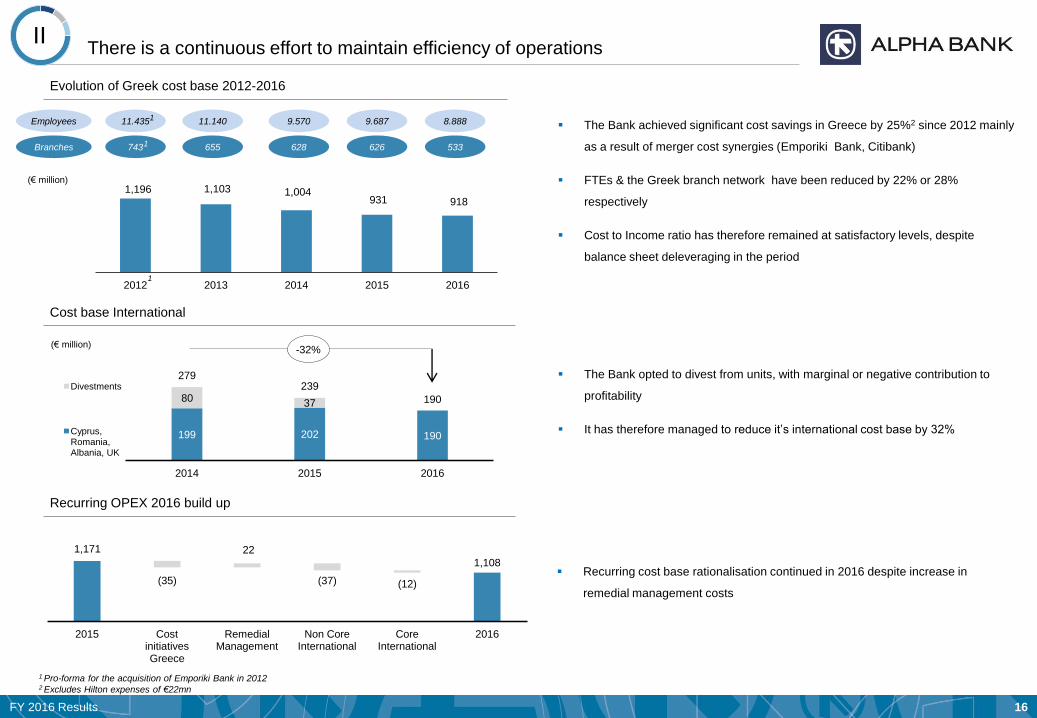
9M 2013 Results FY 2013 Results 16 FY 2016 Results 16
1,196 1,103 1,004 931 918
2012 2013 2014 2015 2016
There is a continuous effort to maintain efficiency of operations II
Evolution of Greek cost base 2012-2016
(€ million)
1 Pro-forma for the acquisition of Emporiki Bank in 2012 2 Excludes Hilton expenses of €22mn
11.435 11.140 9.570 9.687 8.888 Employees
743 655 628 626 533 Branches
Cost base International
(€ million)
199 202 190
80 37
279 239
190
2014 2015 2016
Divestments
Cyprus, Romania, Albania, UK
The Bank achieved significant cost savings in Greece by 25%2 since 2012 mainly
as a result of merger cost synergies (Emporiki Bank, Citibank)
FTEs & the Greek branch network have been reduced by 22% or 28%
respectively
Cost to Income ratio has therefore remained at satisfactory levels, despite
balance sheet deleveraging in the period
The Bank opted to divest from units, with marginal or negative contribution to
profitability
It has therefore managed to reduce it’s international cost base by 32%
1
1
1
-32%
Recurring OPEX 2016 build up
1,171
(35)
22
(37) (12)
1,108
2015 Cost initiatives Greece
Remedial Management
Non Core International
Core International
2016
Recurring cost base rationalisation continued in 2016 despite increase in
remedial management costs

9M 2013 Results FY 2013 Results 17 FY 2016 Results 17
NPL formation by segment - Group Group NPL formation
Decreasing NPL balances in Q4 16 across all business segments II
Note: Write-offs in Q4 16 stood at €322mn
Group NPL ratio at 38.1%
Increased restructuring efforts result in NPL decline
Households NPLs maintained in negative territory suggesting the
peak in 2016
134
307
106 108
(83)
Q4 15 Q1 16 Q2 16 Q3 16 Q4 16
45 22 21 35
(62)
35
(55) (18) (66) (80)
Busin
ess
M
ort
gages
C
onsum
er
Cre
dit
84%
NPL Cash
Coverage
78%
46%
520
214 275
110 77
(225)
Q3' 15 Q4' 15 Q1' 16 Q2' 16 Q3' 16 Q4' 16
(€ million)
NPL
38.1%
(€ million)

9M 2013 Results FY 2013 Results 18 FY 2016 Results 18
1.3 1.4 1.4 1.4
2.0
Q4 15 Q1 16 Q2 16 Q3 16 Q4 16
Non Performing Exposures (NPEs) formation-Greece Group NPE formation
Group NPE formation for Q4 16 declines to 97mn QoQ II
NPE formation in Greece down by -77% yoy
Entries of €0.8bn include new formation and redefaults;
Exits of €0.4bn due to curings, repayments and
liquidations
Restructuring efforts increased by 57% year-on-year
NPE Restructuring effort - Greece
387
844
397
61 100 97
Q3 15 Q4 15 Q1 16 Q2 16 Q3 16 Q4 16
(€ million)
NPE
53.7%
(€ billion)
(€ billion)
17.2
9.0 14.7 0.8
(0.4)
15.1
(0.2)
14.9
10.4
3.9
27.6 12.9
NPEs Greece 30/9/16
Provisions Stock
in Greece 30/9/16
Net NPEs 30/9/16
Entries Exits NPEs 31/12/16
(pre-impairment)
Impairment Q4 16
Net NPEs 31/12/16
EBA FNPLs
EBA NPLs
+57%
NPE formation YoY - Greece
2.8
0.6
FY' 15 FY' 16
-77%
(€ billion)

9M 2013 Results FY 2013 Results 19 FY 2016 Results 19
Cost of Risk declines by 11.3% YoY;
Cash Coverage at 69% for NPLs and 49% for NPEs II
69% 70% 69% 68% 69%
50% 50% 49% 49% 49%
Dec-15 Mar-16 Jun-16 Sep-16 Dec-16
NPL Cash coverage NPE Cash coverage
124% NPL Total
Coverage 124% 125% 126% 126%
107% NPE Total
Coverage 106% 106% 108% 108%
€1.3bn €1.2bn
256 350 258 304
€1.6bn
FY 15 FY 16 Q1 16 Q2 16 Q3 16 Q4 16
Impairment losses AQR Impact
CoR,
bps
227 165
1Excluding Asset Quality Review (AQR)
169
(11.3%)
2151
191
Group NPL and NPE Coverage Group CoR down by 1/4 yoy
(€ million)
201

20 FY 2016 Results 20
III. FY 16 Performance
1. Balance Sheet

9M 2013 Results FY 2013 Results 21 FY 2016 Results 21
5.7
4.4
0.8
44.9
3.4
5.5
1.5
Sep-16
5.7
4.5
0.8
44.4
2.7
5.3
1.5
Dec-16
4.1
8.9
0.3
18.1
13.8
5.5
15.3
Sep-16
66.2
32.0
ELA
ECB
Time
deposits
Core
deposits
Debt
securities
Equity
Other
Liquidity
3.9
9.1
0.6
18.6
14.4
5.2
13.2
Dec-16
64.9
Net loans
PPE
DTA
Other
EFSF bonds
Securities
Cash
66.2
Balance Sheet composition III
Liabilities and equity split Asset split
P&L Asset Quality Capital Balance Sheet
(€ billion) (€ billion)
Net loans
PPE
DTA
Other
EFSF bonds
Securities
Cash
P&L
32.9
ELA
ECB
Time
deposits
Core
deposits
Debt
securities
Equity
Other
64.9

22 FY 2016 Results 22
III-2. Pre Provision Income

9M 2013 Results FY 2013 Results 23 FY 2016 Results 23
Resilient core PPI; NII supported by reduced cost of funding III
P&L Asset Quality Liquidity Capital Balance Sheet
Negative contribution of loans to NII counterbalanced mainly by wholesale
funding
(€ million)
4.8 4.4 5.8 5.5 5.2
19.6 19.7 16.9 15.3 13.2
24.4 24.1 22.7 20.8
18.3
1.67% 1.59% 1.48% 1.29%
1.21%
Dec-15 Mar-16 Jun-16 Sep-16 Dec-16
ECB ELA Funding Cost incl. Pillar II fees
Central Banks funding balances & cost continue to decline
(47) (50) (49) (51) (51)
(110) (91) (85) (71) (60)
551 530 521 517 512
85 87 89 86 89
Q4 15 Q1 16 Q2 16 Q3 16 Q4 16
Bonds & other
Loans
Funding
Depos
477 479
Core PPI breakdown 1
578 564 570 578 586
(307) (273) (270) (281) (285)
271
291 300 297 302
Q4 15 Q1 16 Q2 16 Q3 16 Q4 16
Operating Income Operating Expenses PPI
(€ million)
476
1 Excluding VISA gain
(€ billion)
481 490

9M 2013 Results FY 2013 Results 24 FY 2016 Results 24
(€ billion)
End of
quarter
balances
(bps)
18.3 17.5 18.2 18.1 18.6
13.1 13.5 13.5 13.8 14.4
31.4 31.0 31.7 32.0 32.9
(61) (67) (67) (66) (65)
Q4 15 Q1 16 Q2 16 Q3 16 Q4 16
Core deposits Time deposits
Group deposits spread
Loan and deposit spreads III
929 930 915 907 906
734 726 724 720 716
488 472 476 471 474
432 429 427 427 424
260 262 261 261 261
Q4 15 Q1 16 Q2 16 Q3 16 Q4 16
Consumer Credit - Greece
Small Business Loans - Greece
SEE
Medium & Large Business - Greece
Mortgages - Greece
Reduced net loan balances with declining spreads
Lending spreads
(bps)
(bps)
P&L Asset Quality Liquidity Capital Balance Sheet
Deposit mix & cost evolution
(14) (25)
(31) (34) (34)
(113) (122)
(108) (103) (97)
(127) (122) (112) (106) (102)
Q4 15 Q1 16 Q2 16 Q3 16 Q4 16
Sight and Savings - Greece
SE Europe
Time Deposits - Greece
Deposit spreads
(bps)
End of
quarter
balances
46.2 45.8 45.5 44.9 44.4
460 454 451 448 445
Q4 15 Q1 16 Q2 16 Q3 16 Q4 16
Net Loans Group loans spread
(€ billion)
44%
56%
% Total

9M 2013 Results FY 2013 Results 25 FY 2016 Results 25
Operating expenses III
P&L Asset Quality Liquidity Capital Balance Sheet
€ million FY 16 FY 15 yoy %
Staff costs (501) (519) (3.5%)
General expenses (510) (513) (0.5%)
Depreciation and amortisation
expenses (97) (103) (5.0%)
Recurring OPEX (1,108) (1,134) (2.3%)
Integration costs (6) (9) (33.8%)
Extraordinary/one-off costs (111) (123) (9.9%)
Total OPEX (1,225) (1,267) (3.3%)
132 126 125 124 125
148 122 121 133 135
27
25 23 24 25
307
273 270 281 285
Q4 15 Q1 16 Q2 16 Q3 16 Q4 16
Depreciation & amortisation expenses
General expenses
Staff costs
Recurring OPEX Evolution
(€ million)
1,032 1,024
941 929 897 882
856 820
721
Dec-14 Mar-15 Jun-15 Sep-15 Dec-15 Mar-16 Jun-16 Sep-16 Dec-16
Branches
Bulg
-83 FYROM
-18
o/w Gr 628 627 627 627 626 612 592 565 533
Employees
17,404
15,202 15,149
14,371 14,210 13,856 13,695 13,569 13,481
11,863
Sep-14 Dec-14 Mar-15 Jun-15 Sep-15 Dec-15 Mar-16 Jun-16 Sep-16 Dec-16
Citi
+719
VSS Gr
-2,208 Bulg
-744 FYROM
-240
VSS Cy
-249
o/w Gr 11,781 9,570 9,625 9,680 9,687 9,687 9,679 9,670 9,653 8,888
Serbia
-836
Serbia
-67

26 FY 2016 Results 26
III-3. Asset Quality

9M 2013 Results FY 2013 Results 27 FY 2016 Results 27
Total coverage at 125%
(€ billion)
Coverage of Group non performing loans III
P&L Asset Quality Liquidity Capital Balance Sheet
79% 79% 79% 78% 78%
55% 133%
Dec-15 Mar-16 Jun-16 Sep-16 Dec-16 Collateral Coverage
Total NPL Coverage
47% 47% 45% 45% 46%
69% 115%
Dec-15 Mar-16 Jun-16 Sep-16 Dec-16 Collateral Coverage
Total NPL Coverage
80% 80% 80% 81% 82% 84%
29% 113%
Sep-15 Dec-15 Mar-16 Jun-16 Sep-16 Dec-16 Collateral Coverage
Total NPL
Coverage
69% 70% 69% 68% 69%
56% 125%
Dec-15 Mar-16 Jun-16 Sep-16 Dec-16 Collateral Coverage
Total NPL Coverage
Evolution of coverage for the Group
Busin
ess
Mort
gages
Consum
er
Cre
dit
Cash coverage for the Group at 69% or 125% including collateral coverage of 56%
Total coverage in all segments is well above the 100% mark
69%
56%
125%
NPL Coverage
Collateral
Cash
51.6
19.6 13.4
8.7
3.4
2.5
60.3
23.0
15.9
Gross Loans NPLs Provisions stock
Abroad
Greece 38.1%
NPL ratio
69%
Cash
coverage
38.0%
39.1%
74%
68%

9M 2013 Results FY 2013 Results 28 FY 2016 Results 28
Non-performing exposures (NPEs) also include non-performing forborne loans IΙI
P&L Asset Quality Liquidity Capital Balance Sheet
44.4 (23.0)
(7.6) (1.7)
15.9
60.3
37.3
27.9
Gross loans IFRS NPLs (90 dpd)
Performing loans
FNPLs <90dpd
Individually impaired¹
Performing exposures
NPE perimeter includes NPLs and performing restructured loans
ECB methodology separates the 90 days past due, IFRS non-
performing loans from non-performing exposures (NPE)
The difference between IFRS NPLs and NPEs comes from two areas:
Forborne non performing loans (FNPLs) that are loans currently
below 90dpd, but under full EBA definitions must be considered
as non performing for at least 12 months after the forbearance
measures have been applied
Loans which are either individually impaired or “unlikely to pay”
and are currently below 90dpd, but under full EBA definitions
are considered as non performing exposures (NPEs)
1
1 2
38% 54%
NPL
Ratio
69% 49%
NPL
Coverage
NPE
Ratio
NPE
Coverage
NPE adjustment
(€ billion)
Net loans
Provisions
2
9.9 9.9 9.8 9.4 9.0
6.8 7.0 7.3 7.7 8.2
16.7 16.9 17.1 17.2 17.2
Dec-15 Mar-16 Jun-16 Sep-16 Dec-16
EBA Net FNPL
EBA Net NPLs
(€ billion)
Group Net NPEs evolution
1 Including Unlikely to Pay

9M 2013 Results FY 2013 Results 29 FY 2016 Results 29
Detailed overview of Alpha Bank’s asset quality by portfolio - Group IIΙ
(€ billion) Wholesale SBL Mortgages Consumer Total
Gross loans 26.0 6.6 20.3 7.4 60.3
(-) Provisions (7.1) (2.9) (3.3) (2.6) (15.9)
Net loans 18.9 3.7 17.0 4.8 44.4
NPLs 7.8 5.1 7.1 3.1 23.0
NPL ratio 29.9% 76.4% 34.9% 41.9% 38.1%
NPEs 12.6 5.7 9.5 4.6 32.4
NPE ratio 48.6% 86.3% 46.6% 61.8% 53.7%
NPL collateral 4.5 2.6 4.9 0.9 12.8
NPE collateral 7.5 3.0 6.7 1.1 18.3
Coverage ratio
NPLs 7.8 5.1 7.1 3.1 23.0
(+) Forborne NPLs < 90 dpds 3.2 0.6 2.3 1.5 7.6
(+) Individually impaired1 1.6 0.0 0.1 0.0 1.7
NPEs 12.6 5.7 9.5 4.6 32.4
Forborne NPLs >90dpd 1.2 1.1 1.8 1.4 5.6
Forborne NPLs <90dpd 3.2 0.6 2.3 1.5 7.6
Performing forborne 0.6 0.3 3.5 0.7 5.1
Total forborne 5.0 2.1 7.6 3.6 18.3
92% 57% 57% 50% 46% 35%
84% 57% 69%
49%
58%
59% 51% 52% 69% 71%
29%
24%
56% 56%
149%
116% 107% 103% 115%
105% 113%
81%
125% 106%
NPL NPE NPL NPE NPL NPE NPL NPE NPL NPE
Total
Collateral
Cash
1 Including unlikely to pay
P&L Asset Quality Liquidity Capital Balance Sheet

9M 2013 Results FY 2013 Results 30 FY 2016 Results 30
Loans perimeter managed by NPL Units
NPL Workout Units Analysis III
19.6
0.4
13.7
5.5
32.0 23.9
5.0
3.1
51.6 24.3
18.8
8.6
Total Loans Greece
Non-NPL Management
Units
Retail NPL Management
Unit
WHL NPL Management
Unit
Performing
NPLs
(€ billion)
P&L Asset Quality Liquidity Capital Balance Sheet
NPL Workout Units balances breakdown by segment
5.8 2.9
5.0 4.3 1.2
19.2
3.4
1.0
0.7 1.5
1.6
8.1
9.2
3.9 5.7 5.8
2.8
27.3
Mortgages Consumer SBLs SMEs Corporates Total
Performing
NPLs
Retail
€18.8bn
Wholesale
€8.6bn
1 Including leasing, factoring and International Unit Greece
(€ billion)
Retail NPL Unit manages all retail exposures which are >1dpd and total €18.8bn
In retail c. 3,000 FTEs broken down in
c.600 in Retail NPL Unit
c.480 in branches
c.1,900 in collection and legal firms
WHL NPL Unit manages €8.6bn, out of which €3.1bn are performing loans1
In wholesale c.143 FTEs broken down in (legal outsourcing excluded):
Management & Monitoring: 28 FTEs
Workout: 47 FTEs
Permanent arrears: 68 FTEs

9M 2013 Results FY 2013 Results 31 FY 2016 Results 31
CEPAL - The 1st independent licensed NPL servicer goes live in Greece III
CEPAL was the 1st company to be licensed as a Servicer in Greece.
CEPAL is a partnership between Centerbridge Partners (CP), which has strong track
record in setting up such ventures, and will be the majority shareholder, and Alpha
Bank, which will maintain a minority stake
Strong management team with international experience
The two parties committed significant resources to ramp up the operations of the
Servicer and create independent infrastructure (in terms of Human Resources, IT
infrastructure, processes, etc.)
The platform will service both secured and unsecured retail NPL portfolios
CEPAL is expected to play a significant role in the development of the secondary
market for NPLs as it has been set up as an independent open platform with the aim
to target various clients in the Greek market
The Servicer is part of the bank’s operational plan for NPEs submitted to SSM in
2016. Through the Servicer the Bank aims to:
Alpha Bank to initially assign €4bn to CEPAL, whereas the intention is to increase the
assigned volumes, subject to the Servicer’s performance
Key performance indicators will monitor the performance of the Servicer
The servicer
Introduce international best practices and systems to the Greek NPL servicing market
Consolidate and integrate NPL management & servicing of the bank’s own retail portfolio.
Create a separate specialized business unit to allow for optimized efficiency and performance through scale, human capital investment, talent retention and incentive based compensation structures
Leverage technologies successfully implemented in other markets
Pursue mainly amicable long term NPL solutions with clients, including innovative for the Greek market Real Estate solutions
P&L Asset Quality Liquidity Capital Balance Sheet

32 FY 2016 Results 32
III-4. Liquidity

9M 2013 Results FY 2013 Results 33 FY 2016 Results 33
Eurosystem funding reduced further in Q4 by 2.5bn by deposit inflows, sales of EFSF
bond and a securitisation transaction III
3.2 2.5 2.2
0.5 0.7 0.7
1.9 1.9 1.9
5.0
2.0 2.0 2.0
14.6 14.1 14.0
1.7
0.7 0.5
Sep-16 Dec-16 Feb-17
Pillar II
Securitisations
Bonds
Loans
EFSF Bonds
23.9
22.0
ELA
16.5
ECB
4.8
ECB
5.6
ECB
5.2
ELA
16.8
21.3
ELA
18.3
Eurosystem collateral pool (cash values)
(€ billion)
5.5 5.2 4.8
(1.2) (1.0) (0.3) (0.3)
0.3
15.3
13.2 13.0
20.8
18.3 17.8
Sep-16 Deposits Inflows
Securities Disposal
Secutitisation SME
Other B/S items
Interbank Repo
Dec-16 Feb-17
ECB ELA
Cash
Buffer 3.0 3.6 3.5
o/w 2.2
EFSF
bonds
Eurosystem funding QoQ reduction
(€ billion)
-€2.5bn
Including
proceeds of
Hilton sale
€143mn
P&L Asset Quality Liquidity Capital Balance Sheet
9M 2013 Results FY 2013 Results 34 FY 2016 Results 34
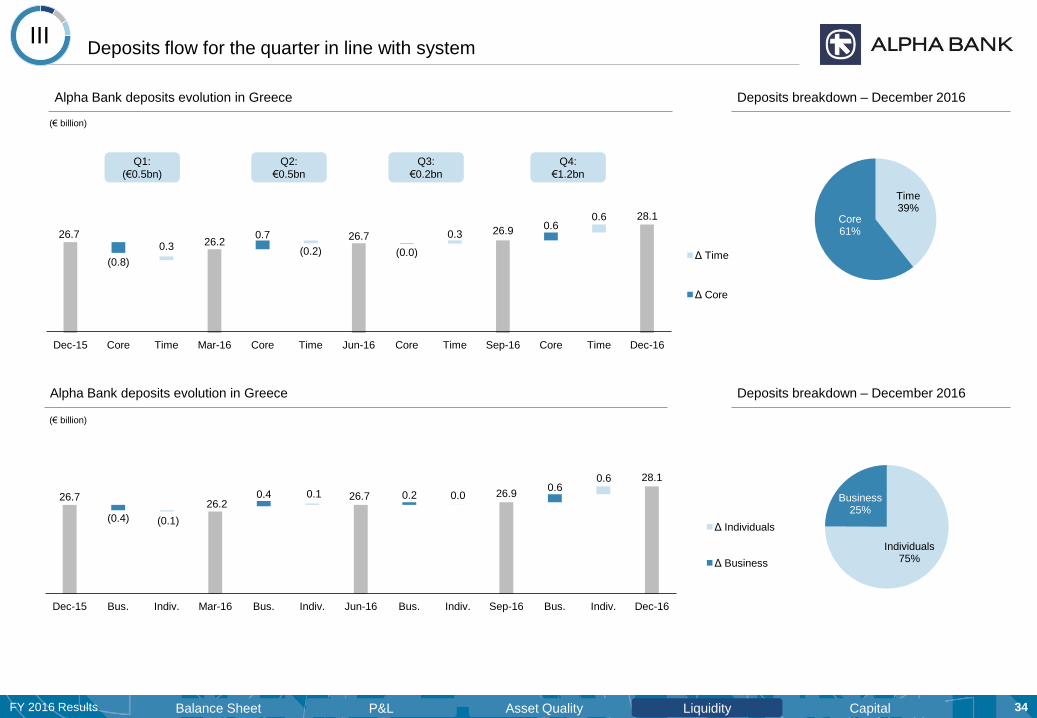
Individuals 75%
Business 25%
26.7 26.2
26.7 26.9
28.1
(0.8)
0.7
(0.0)
0.6
0.3 (0.2)
0.3
0.6
Dec-15 Core Time Mar-16 Core Time Jun-16 Core Time Sep-16 Core Time Dec-16
Δ Time
Δ Core
Alpha Bank deposits evolution in Greece
Deposits flow for the quarter in line with system III
26.7 26.2
26.7 26.9
28.1
(0.4)
0.4 0.2 0.6
(0.1)
0.1 0.0
0.6
Dec-15 Bus. Indiv. Mar-16 Bus. Indiv. Jun-16 Bus. Indiv. Sep-16 Bus. Indiv. Dec-16
Δ Individuals
Δ Business
Q1:
(€0.5bn)
Q2:
€0.5bn
P&L Asset Quality Liquidity Capital Balance Sheet
Deposits breakdown – December 2016
Q3:
€0.2bn
Alpha Bank deposits evolution in Greece
Deposits breakdown – December 2016
Time 39%
Core 61%
(€ billion)
(€ billion)
Q4:
€1.2bn

35 FY 2016 Results 35
III-5. Capital

9M 2013 Results FY 2013 Results 36 FY 2016 Results 36
45.8 45.6
(0.3) (0.1)
0.1
3.9 4.0
1.1 1.0
50.8 50.5
Sep-16 Credit Risk Market Risk Operational Risk
Dec-16
Market Risk
Operational Risk
Credit Risk
III
P&L Asset Quality Liquidity Capital Balance Sheet
Common Equity Tier I Ratio of 17.1%; Fully Loaded ratio at 16.7%
9,077 8,706 8,631 8,662
(371) (76)
31
Ordinary Equity
Intangibles Tangible book value
Regulatory Adjustments
CET1 capital =
Tier I capital
Lower Tier II
Total Regulatory
Capital
Equity to regulatory capital bridge
(€ million)
Dec-16 DTA/Tax Credit impact Phased-in Fully loaded
CET1 (€bn) 4.2 4.0
RWAs1 (€bn) 5.1 5.1
€3.4bn Tax Credit
€0.7bn Other DTA
€3.4bn Tax Credit
€0.2bn Tax Losses
€0.7bn Other DTA
€1.7bn DTA
€3.4bn Tax Credit
16.8% 6 bps 11bps 5 bps 17.1% 16.7%
CET 1 Sep-16
Period Result
AFS Reserve
RWA impact / Other
CET 1 Dec-16
Fully loaded CET1 Dec-16
CET1 ratio build up impacted by decrease of Credit RWAs and a profitable quarter
CET1
capital 8,560 8,631 8,460
(€ million)
1 Risk weighting is100% for the Tax Credit and 250% for the Other DTA
RWAs/ Assets
(€ billion)
Group Risk Weighted Assets (RWAs) development
78% 13.5% Tangible book value/
Tangible Assets

37 FY 2016 Results 37
IV. Appendix

9M 2013 Results FY 2013 Results 38 FY 2016 Results 38
Business Volumes IV
(€ million) Dec 2016 Sep 2016 Jun 2016 Mar 2016 Dec 2015
%
Dec 2016 /
Dec 2015
Group Gross Loans 60,316 60,821 61,418 61,895 62,015 (2.7%)
Mortgages 20,260 20,480 20,541 20,794 20,840 (2.8%)
Consumer Loans 5,749 5,876 5,858 5,848 5,872 (2.1%)
Credit Cards 1 1,676 1,637 1,593 1,409 1,425 17.6%
Small Business Loans 6,640 6,781 6,788 6,792 6,726 (1.3%)
Medium and Large Business Loans 1 25,991 26,047 26,637 27,052 27,151 (4.3%)
of which:
Greece 51,606 51,440 51,975 52,261 52,472 (1.7%)
Mortgages 16,714 16,769 16,834 17,102 17,150 (2.5%)
Consumer Loans 5,225 5,205 5,197 5,161 5,184 0.8%
Credit Cards 1 1,638 1,587 1,543 1,359 1,373 19.3%
Small Business Loans 6,573 6,710 6,712 6,715 6,656 (1.2%)
Medium and Large Business Loans1 21,456 21,169 21,689 21,924 22,109 (3.0%)
of which: Shipping Loans 2,004 1,914 1,938 1,858 1,910 4.9%
Southeastern Europe 8,448 9,082 9,123 9,238 9,164 (7.8%)
Accumulated Provisions (15,907) (15,951) (15,922) (16,069) (15,829) 0.5%
Group Net Loans 44,409 44,870 45,496 45,826 46,186 (3.8%)
Customer Assets 38,342 37,498 37,254 36,643 37,097 3.4%
of which:
Group Deposits 32,946 31,970 31,667 30,963 31,434 4.8%
Sight & Savings 18,572 18,148 18,155 17,456 18,313 1.4%
Time deposits & Alpha Bank Bonds 14,375 13,821 13,512 13,507 13,122 9.5%
Greece 28,062 26,877 26,659 26,204 26,744 4.9%
Sight & Savings 17,021 16,444 16,483 15,823 16,640 2.3%
Time deposits & Alpha Bank Bonds 11,041 10,433 10,177 10,381 10,103 9.3%
Southeastern Europe 4,111 4,294 4,213 3,956 3,866 6.3%
Money Market Mutual Funds 593 664 739 774 800 (25.9%)
Other Mutual Funds 1,286 1,224 1,225 1,221 1,176 9.3%
Private Banking 3,518 3,641 3,623 3,685 3,686 (4.6%)
1 Reclassification of €193mn in Q2 16 from Medium & Large Business Loans to Credit Cards

9M 2013 Results FY 2013 Results 39 FY 2016 Results 39
Passenger 9%
Containers 9%
Product Tankers 13%
Panamax 8%
Suezmax 8% VLCC 8%
Handy max/ Handy size
20%
Panamax 16%
Capesize 9%
Tankers
37%
Dry Bulk
45%
Wholesale loans portfolio structure – Group
Shipping loans portfolio structure
€2.0bn
Diversified business book and shipping portfolio IV
€2.0bn of exposure, to top-names
The portfolio is split into tankers by 37%, containers 9%,
passenger 9% and the rest is dry bulk
Duration of loan portfolio at 5 years
NPL ratio at 9%
Wholesale loans 43%
SBLs 11%
Consumer loans 9%
Credit Cards 3%
Mortgages 34%
Group loans breakdown (FY 16 data)
€60.3bn
Industry 23%
Trade 21%
Construction 17%
Transportation 3%
Tourism 7%
Shipping 6%
Real Estate 7%
Services 6%
Other 10%
€26.0bn

9M 2013 Results FY 2013 Results 40 FY 2016 Results 40
(€ million)
Alpha Private Bank balance increased with Citi acquisition Asset Management impacted by the adverse operating environment
(€ million)
Wealth Management evolution IV
447
158 208
938
916 927
253
157
230
1,638
1,231
1,365
Dec-14 Dec-15 Dec-16
Other AUM Non Money Market Mututal Funds Money Market Mutual Funds
103 98 169
1,296
1,789
2,601
2,085
2,219
1,582 3,484
4,107
4,352
Dec-14 Dec-15 Dec-16
Discretionary Advisory Execution Only

9M 2013 Results FY 2013 Results 41 FY 2016 Results 41
SEE Operations 1 IV
(€ million) Cyprus Δ% Romania Δ% Albania Δ% TOTAL Δ%
Dec-16 yoy yoy yoy yoy
Deposits 1,944 15.4% 1,729 25.0% 438 8.3% 4,111 6.3%
Gross Loans 5,309 0.4% 2,771 (0.8%) 368 0.1% 8,448 (7.8%)
Mortgages 2,472 0.1% 994 4.0% 69 3.2% 3,534 (3.8%)
Consumer Credit 264 (5.6%) 243 (9.7%) 25 22.7% 533 (21.8%)
Businesses 2,573 1.4% 1,534 (2.1%) 274 (2.3%) 4,381 (8.9%)
NPL ratio 55.6% 14.0% 15.8%
NPL Cash coverage 70% 100% 59%
NPL Total coverage 118% 160% 143%
Total Operating Income 160.9 6.9% 140.8 15.6% 20.2 (6.6%) 321.9 9.5%
Operating Expenses
(pre-O/H allocation)1 (52.5) (6.3%) (93.4) (0.5%) (15.0) 4.4% (161.0) (3.6%)
Impairment Losses (225.3) (15.7%) (34.3) (25.4%) (14.2) (84.1%) (273.8) (14.7%)
Profit Before Tax
(pre- O/H allocation) 2 (116.9) … 13.1 … (9.1) … (112.8) (41.9%)
Branches 22 130 35 187
Employees 656 1,832 415 2,903
1 Country View 2 Excluding VSS Cyprus of €31mn
9M 2013 Results FY 2013 Results 42 FY 2016 Results 42
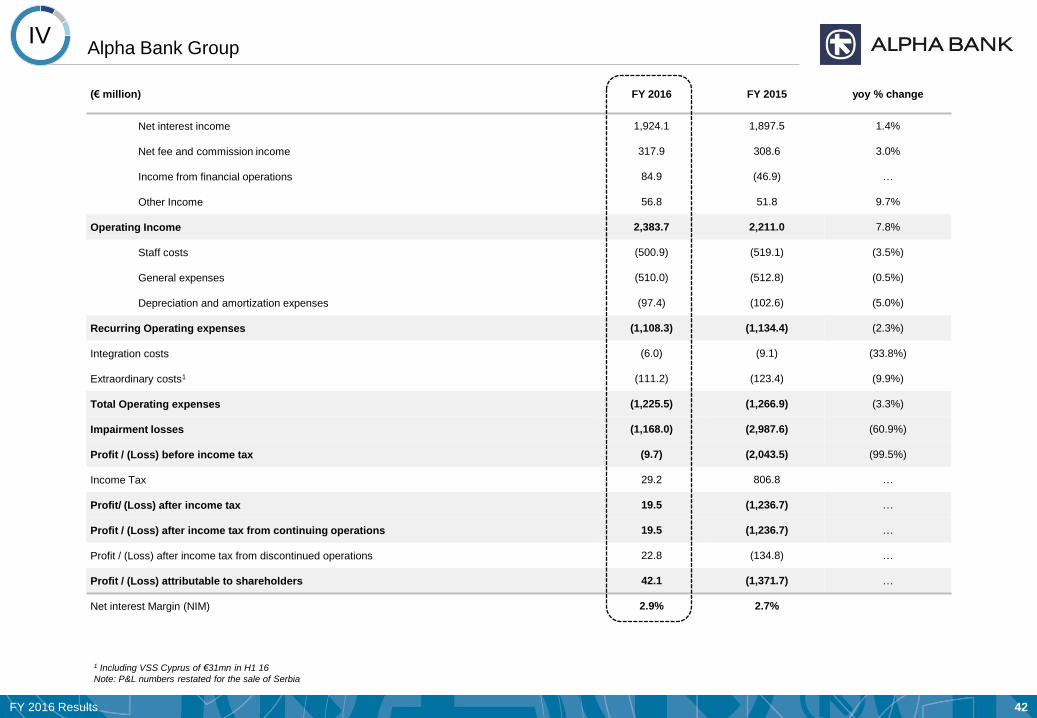
Alpha Bank Group IV
(€ million) FY 2016 FY 2015 yoy % change
Net interest income 1,924.1 1,897.5 1.4%
Net fee and commission income 317.9 308.6 3.0%
Income from financial operations 84.9 (46.9) …
Other Income 56.8 51.8 9.7%
Operating Income 2,383.7 2,211.0 7.8%
Staff costs (500.9) (519.1) (3.5%)
General expenses (510.0) (512.8) (0.5%)
Depreciation and amortization expenses (97.4) (102.6) (5.0%)
Recurring Operating expenses (1,108.3) (1,134.4) (2.3%)
Integration costs (6.0) (9.1) (33.8%)
Extraordinary costs1 (111.2) (123.4) (9.9%)
Total Operating expenses (1,225.5) (1,266.9) (3.3%)
Impairment losses (1,168.0) (2,987.6) (60.9%)
Profit / (Loss) before income tax (9.7) (2,043.5) (99.5%)
Income Tax 29.2 806.8 …
Profit/ (Loss) after income tax 19.5 (1,236.7) …
Profit / (Loss) after income tax from continuing operations 19.5 (1,236.7) …
Profit / (Loss) after income tax from discontinued operations 22.8 (134.8) …
Profit / (Loss) attributable to shareholders 42.1 (1,371.7) …
Net interest Margin (NIM) 2.9% 2.7%
1 Including VSS Cyprus of €31mn in H1 16
Note: P&L numbers restated for the sale of Serbia

9M 2013 Results FY 2013 Results 43 FY 2016 Results 43
Alpha Bank Group IV
(€ million) Q4 2016 Q3 2016 Q2 2016 Q1 2016 Q4 2015 Q3 2015 Q2 2015 Q1 2015
Net interest income 490.1 481.2 476.8 476.0 479.4 480.2 472.6 465.3
Net fee and commission income 81.2 81.1 78.5 77.1 82.0 68.2 76.1 82.3
Income from financial operations 16.0 9.1 56.8 3.0 (90.4) 8.6 9.5 25.3
Other Income 14.9 15.9 14.8 11.2 16.2 9.3 15.3 11.0
Operating Income 602.2 587.3 626.9 567.3 487.3 566.3 573.6 583.9
Staff costs (125.1) (124.1) (125.5) (126.2) (132.0) (129.1) (127.5) (130.5)
General expenses (134.9) (132.8) (121.3) (121.1) (148.1) (126.4) (123.3) (115.0)
Depreciation and amortization expenses (24.7) (24.3) (23.1) (25.3) (26.5) (25.8) (25.3) (25.0)
Recurring Operating expenses (284.6) (281.2) (269.8) (272.7) (306.6) (281.3) (276.1) (270.4)
Integration costs (3.9) (0.4) (1.2) (0.5) (2.7) (3.3) (2.0) (1.1)
Extraordinary costs1 (66.9) 0.2 (16.6) (27.9) (110.3) (24.1) 8.8 2.3
Total Operating expenses (355.5) (281.4) (287.6) (301.0) (419.6) (308.7) (269.3) (269.3)
Impairment losses (303.9) (258.2) (350.0) (255.9) (633.3) (257.7) (1,672.4) (424.1)
Profit / (Loss) before income tax (57.1) 47.8 (10.8) 10.4 (565.7) (0.2) (1,368.2) (109.5)
Income Tax 61.8 (8.1) (9.5) (14.9) 83.6 413.8 318.6 (9.2)
Profit/ (Loss) after income tax 4.7 39.7 (20.3) (4.5) (482.0) 413.6 (1,049.5) (118.7)
Profit / (Loss) after income tax from continuing operations 4.7 39.7 (20.3) (4.5) (482.0) 413.6 (1,049.5) (118.7)
Profit / (Loss) after income tax from discontinued operations 15.4 1.5 3.5 2.3 (51.0) 0.1 (86.7) 2.9
Profit / (Loss) attributable to shareholders 20.1 41.1 (16.8) (2.2) (533.1) 413.6 (1,136.3) (116.0)
Net interest Margin (NIM) 3.0% 2.9% 2.8% 2.8% 2.8% 2.7% 2.6% 2.6%
1 Including VSS Cyprus of €31mn in H1 16
Note: P&L numbers restated for the sale of Serbia

9M 2013 Results FY 2013 Results 44 FY 2016 Results 44
Group Results by Business Unit IV
(€ million)
Retail Commercial &
Corporate SE Europe
Investment Banking &
Treasury
Asset
Management Other Group
Jan-Dec Jan-Dec Jan-Dec Jan-Dec Jan-Dec Jan-Dec Jan-Dec
2016 2015 2016 2015 2016 2015 2016 2015 2016 2015 2016 2015 2016 2015
Operating Income 1,119.8 1,137.1 833.7 874.8 321.9 293.9 36.4 (68.3) 48.7 60.8 23.2 (87.2) 2,383.7 2,211.0
Net Interest Income 1,001.7 1,027.2 684.8 728.4 257.8 272.1 (38.3) (147.2) 14.7 16.4 3.4 0.6 1,924.1 1,897.5
Net fee and Commission Income 111.3 106.8 136.3 134.0 25.0 26.2 8.3 (3.2) 35.6 43.5 1.5 1.4 317.9 308.6
Income from Financial Operations 6.9 6.6 4.7 4.8 29.6 (10.3) 64.2 76.2 1.4 3.0 (21.9) (127.2) 84.9 (46.9)
Other Income 0.0 (3.5) 7.9 7.5 9.5 5.9 2.3 5.9 (2.9) (2.0) 40.1 38.1 56.8 51.8
Operating Expenses (664.3) (669.7) (153.5) (148.3) (213.9) (182.1) (29.7) (31.4) (26.7) (30.4) (137.4) (205.0) (1,225.5) (1,266.9)
Staff Costs (279.8) (293.3) (87.2) (85.1) (116.3) (88.4) (13.0) (13.9) (16.5) (17.8) (26.6) (85.4) (539.5) (583.9)
General Expenses (331.1) (321.9) (46.1) (43.9) (87.2) (84.5) (14.6) (15.4) (8.6) (10.5) (101.0) (104.2) (588.5) (580.4)
Depreciation (53.4) (54.5) (20.2) (19.3) (10.3) (9.1) (2.1) (2.2) (1.6) (2.1) (9.8) (15.4) (97.4) (102.6)
Impairment Losses (352.2) (1,328.4) (536.4) (1,334.6) (273.8) (321.0) 0.0 (2.6) 0.0 0.0 (5.6) (1.2) (1,168.0) (2,987.6)
Profit / (Loss) before tax 103.3 (861.0) 143.8 (608.1) (165.8) (209.2) 6.7 (102.3) 22.0 30.4 (119.8) (293.4) (9.7) (2,043.5)
1 Including VSS Cyprus of €31mn in H1 16
Note: P&L numbers restated for the sale of Serbia
1
1

9M 2013 Results FY 2013 Results 45 FY 2016 Results 45
(€ million) Q4 2016 Q3 2016 Q2 2016 Q1 2016 Q4 2015 Q3 2015 Q2 2015 Q1 2015
Operating Income 276.7 279.7 280.2 283.2 294.9 298.3 286.9 257.0
Net Interest Income 247.0 248.7 250.5 255.5 266.9 273.6 256.6 230.1
Net fee and Commission Income 27.8 29.3 27.9 26.3 28.4 23.9 29.0 25.5
Income from Financial Operations 1.9 1.7 1.8 1.5 1.2 1.8 1.7 1.9
Other Income - - - - (1.7) (1.0) (0.3) (0.5)
Operating Expenses (170.8) (167.3) (166.3) (159.9) (175.2) (171.2) (163.2) (160.0)
Staff Costs (70.1) (69.6) (70.6) (69.5) (74.5) (71.3) (72.0) (75.6)
General Expenses (87.2) (84.4) (82.5) (77.0) (86.4) (86.0) (77.9) (71.6)
Depreciation (13.5) (13.4) (13.1) (13.4) (14.3) (14.0) (13.3) (12.8)
Impairment losses (21.5) (164.7) (96.7) (69.3) (68.9) (192.0) (923.5) (144.0)
Profit / (Loss) before tax 84.3 (52.3) 17.2 54.1 50.8 (65.0) (799.8) (47.0)
RWA e 20,108 20,074 19,882 20,104 20,434 20,325 20,415 20,295
Results I Retail Business Unit IV
Note: P&L numbers restated for the sale of Serbia

9M 2013 Results FY 2013 Results 46 FY 2016 Results 46
Results I Commercial & Corporate Business Unit IV
(€ million) Q4 2016 Q3 2016 Q2 2016 Q1 2016 Q4 2015 Q3 2015 Q2 2015 Q1 2015
Operating Income 205.2 206.7 208.9 212.9 222.5 224.4 218.6 209.3
Net Interest Income 166.6 169.2 172.5 176.6 183.8 189.0 182.4 173.2
Net fee and Commission Income 35.3 34.0 33.3 33.7 35.7 33.0 31.8 33.5
Income from Financial Operations 1.4 1.2 1.3 0.9 0.6 0.6 2.6 1.1
Other Income 2.0 2.3 1.9 1.7 2.4 1.7 1.9 1.5
Operating Expenses (39.7) (38.5) (37.9) (37.4) (39.5) (38.0) (35.9) (34.9)
Staff Costs (22.1) (21.8) (21.9) (21.4) (22.8) (21.3) (20.6) (20.5)
General Expenses (12.4) (11.6) (11.1) (11.0) (11.6) (11.8) (10.6) (10.0)
Depreciation (5.3) (5.0) (4.9) (4.9) (5.1) (4.9) (4.7) (4.5)
Impairment losses (124.8) (54.5) (204.4) (152.8) (420.2) (17.3) (666.3) (230.8)
Profit / (Loss) before tax 40.7 113.8 (33.4) 22.7 (237.2) 169.1 (483.6) (56.4)
RWA e 18,063 18,199 18,459 18,345 17,970 17,980 18,649 18,896
Note: P&L numbers restated for the sale of Serbia

9M 2013 Results FY 2013 Results 47 FY 2016 Results 47
Results I Asset Management Business Unit IV
(€ million) Q4 2016 Q3 2016 Q2 2016 Q1 2016 Q4 2015 Q3 2015 Q2 2015 Q1 2015
Operating Income 13.3 11.9 11.8 11.7 14.6 10.6 16.5 19.2
Net Interest Income 3.8 3.3 3.6 4.0 4.1 4.1 4.1 4.0
Net fee and Commission Income 9.6 9.4 8.5 8.1 8.8 7.2 12.1 15.3
Income from Financial Operations 1.0 0.1 0.1 0.2 2.4 (0.1) 0.5 0.2
Other Income (1.1) (0.9) (0.4) (0.5) (0.8) (0.7) (0.3) (0.3)
Operating Expenses (6.8) (6.6) (6.7) (6.6) (7.1) (7.0) (7.6) (8.7)
Staff Costs (4.0) (4.1) (4.2) (4.3) (4.9) (4.5) (4.1) (4.3)
General Expenses (2.5) (2.1) (2.1) (1.9) (1.6) (2.0) (3.0) (4.0)
Depreciation (0.4) (0.4) (0.4) (0.4) (0.6) (0.5) (0.5) (0.5)
Impairment losses - - - - - - - -
Profit / (Loss) before tax 6.6 5.3 5.1 5.1 7.5 3.6 8.8 10.5
RWA e 293 308 315 326 349 363 362 323
Note: P&L numbers restated for the sale of Serbia

9M 2013 Results FY 2013 Results 48 FY 2016 Results 48
(€ million) Q4 2016 Q3 2016 Q2 2016 Q1 2016 Q4 2015 Q3 2015 Q2 2015 Q1 2015
Operating Income 55.8 (2.0) 13.6 (30.9) (12.0) (47.9) (19.5) 11.0
Net Interest Income 8.3 (6.1) (16.8) (23.7) (44.3) (54.5) (38.6) (9.7)
Net fee and Commission Income 2.1 1.6 2.3 2.2 1.9 (2.7) (3.4) 0.9
Income from Financial Operations 43.5 0.2 26.3 (5.7) 27.2 9.5 19.9 19.6
Other Income 2.0 2.3 1.8 (3.8) 3.2 (0.3) 2.7 0.3
Operating Expenses (7.8) (7.4) (7.3) (7.2) (8.9) (7.8) (7.9) (6.8)
Staff Costs (3.4) (3.2) (3.3) (3.1) (3.9) (3.3) (3.4) (3.3)
General Expenses (3.9) (3.7) (3.5) (3.5) (4.4) (4.0) (3.7) (3.3)
Depreciation (0.5) (0.5) (0.5) (0.5) (0.6) (0.5) (0.8) (0.3)
Impairment losses - - - - (2.6) - - -
Profit / (Loss) before tax 48.0 (9.5) 6.3 (38.1) (23.4) (55.7) (27.4) 4.2
RWA e 4,891 4,993 5,198 5,350 5,215 5,142 5,197 4,738
Results I Investment Banking & Treasury Business Unit IV
Note: P&L numbers restated for the sale of Serbia

9M 2013 Results FY 2013 Results 49 FY 2016 Results 49
Results I SE Europe Business Unit IV
(€ million) Q4 2016 Q3 2016 Q2 2016 Q1 2016 Q4 2015 Q3 2015 Q2 2015 Q1 2015
Operating Income 73.3 80.5 91.6 76.5 75.3 84.3 76.7 57.5
Net Interest Income 63.6 65.1 65.9 63.2 69.0 67.6 67.9 67.6
Net fee and Commission Income 5.8 6.6 6.4 6.3 6.5 6.6 6.2 6.9
Income from Financial Operations 0.1 6.1 18.2 5.2 (2.8) 9.0 1.2 (17.8)
Other Income 3.8 2.8 1.2 1.8 2.6 1.1 1.4 0.8
Operating Expenses1 (49.2) (42.4) (44.8) (77.5) (51.6) (44.7) (42.3) (43.5)
Staff Costs1 (19.9) (19.4) (21.0) (56.0) (24.3) (21.5) (20.9) (21.8)
General Expenses (26.5) (20.6) (21.2) (18.9) (24.9) (20.9) (19.3) (19.4)
Depreciation (2.7) (2.5) (2.6) (2.6) (2.4) (2.2) (2.2) (2.3)
Impairment losses (152.0) (39.0) (49.0) (33.8) (140.5) (48.5) (82.6) (49.3)
Profit / (Loss) before tax1 (127.9) (0.9) (2.2) (34.7) (116.7) (8.9) (48.2) (35.3)
RWA e 6,223 6,345 6,652 6,888 7,356 7,826 8,116 8,403
1 Including VSS Cyprus of €31mn in H1 16
Note: P&L numbers restated for the sale of Serbia

9M 2013 Results FY 2013 Results 50 FY 2016 Results 50
Results I Other Business Unit IV
(€ million) Q4 2016 Q3 2016 Q2 2016 Q1 2016 Q4 2015 Q3 2015 Q2 2015 Q1 2015
Operating Income (22.2) 10.5 20.8 13.9 (108.0) (3.3) (5.7) 29.8
Net Interest Income 0.9 0.9 1.2 0.4 (0.2) 0.4 0.2 0.1
Net fee and Commission Income 0.6 0.2 0.1 0.6 0.7 0.1 0.3 0.2
Income from Financial Operations (31.9) (0.1) 9.2 0.9 (119.0) (12.2) (16.3) 20.3
Other Income 8.2 9.5 10.4 12.0 10.5 8.4 10.1 9.2
Operating Expenses (81.1) (19.1) (24.6) (12.6) (137.4) (40.0) (12.4) (15.2)
Staff Costs (10.2) (7.7) (5.5) (3.2) (68.7) (6.6) (5.1) (5.0)
General Expenses (68.7) (8.9) (17.6) (5.9) (65.2) (29.9) (3.5) (5.6)
Depreciation (2.3) (2.5) (1.5) (3.5) (3.5) (3.5) (3.8) (4.5)
Impairment losses (5.6) (0.0) 0.0 (0.0) (1.2) (0.0) (0.0) (0.0)
Profit / (Loss) before tax (108.9) (8.6) (3.7) 1.4 (246.6) (43.3) (18.1) 14.6
RWA e 1,109 1,149 1,126 1,119 1,149 1,146 1,087 1,008
Note: P&L numbers restated for the sale of Serbia
9M 2013 Results FY 2013 Results 51 FY 2016 Results 51
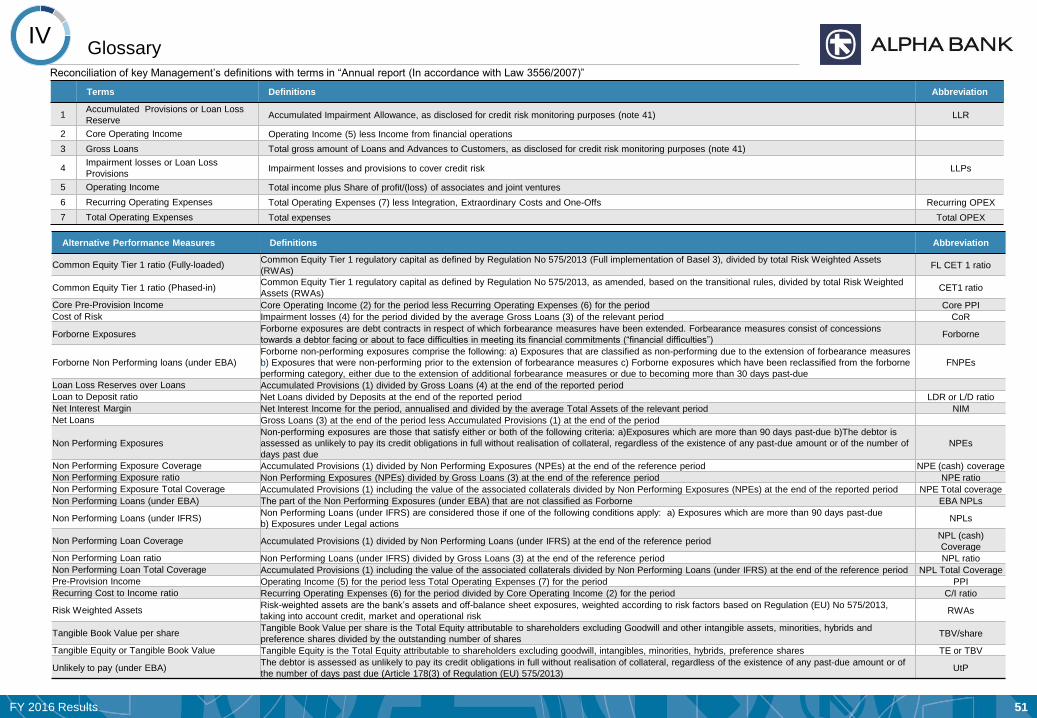
Terms Definitions Abbreviation
1 Accumulated Provisions or Loan Loss
Reserve Accumulated Impairment Allowance, as disclosed for credit risk monitoring purposes (note 41) LLR
2 Core Operating Income Operating Income (5) less Income from financial operations
3 Gross Loans Total gross amount of Loans and Advances to Customers, as disclosed for credit risk monitoring purposes (note 41)
4 Impairment losses or Loan Loss
Provisions Impairment losses and provisions to cover credit risk LLPs
5 Operating Income Total income plus Share of profit/(loss) of associates and joint ventures
6 Recurring Operating Expenses Total Operating Expenses (7) less Integration, Extraordinary Costs and One-Offs Recurring OPEX
7 Total Operating Expenses Total expenses Total OPEX
Glossary IV
Reconciliation of key Management’s definitions with terms in “Annual report (In accordance with Law 3556/2007)”
Alternative Performance Measures Definitions Abbreviation
Common Equity Tier 1 ratio (Fully-loaded) Common Equity Tier 1 regulatory capital as defined by Regulation No 575/2013 (Full implementation of Basel 3), divided by total Risk Weighted Assets
(RWAs) FL CET 1 ratio
Common Equity Tier 1 ratio (Phased-in) Common Equity Tier 1 regulatory capital as defined by Regulation No 575/2013, as amended, based on the transitional rules, divided by total Risk Weighted
Assets (RWAs) CET1 ratio
Core Pre-Provision Income Core Operating Income (2) for the period less Recurring Operating Expenses (6) for the period Core PPI
Cost of Risk Impairment losses (4) for the period divided by the average Gross Loans (3) of the relevant period CoR
Forborne Exposures Forborne exposures are debt contracts in respect of which forbearance measures have been extended. Forbearance measures consist of concessions
towards a debtor facing or about to face difficulties in meeting its financial commitments (“financial difficulties”) Forborne
Forborne Non Performing loans (under EBA)
Forborne non-performing exposures comprise the following: a) Exposures that are classified as non-performing due to the extension of forbearance measures
b) Exposures that were non-performing prior to the extension of forbearance measures c) Forborne exposures which have been reclassified from the forborne
performing category, either due to the extension of additional forbearance measures or due to becoming more than 30 days past-due
FNPEs
Loan Loss Reserves over Loans Accumulated Provisions (1) divided by Gross Loans (4) at the end of the reported period
Loan to Deposit ratio Net Loans divided by Deposits at the end of the reported period LDR or L/D ratio
Net Interest Margin Net Interest Income for the period, annualised and divided by the average Total Assets of the relevant period NIM
Net Loans Gross Loans (3) at the end of the period less Accumulated Provisions (1) at the end of the period
Non Performing Exposures
Non-performing exposures are those that satisfy either or both of the following criteria: a)Exposures which are more than 90 days past-due b)The debtor is
assessed as unlikely to pay its credit obligations in full without realisation of collateral, regardless of the existence of any past-due amount or of the number of
days past due
NPEs
Non Performing Exposure Coverage Accumulated Provisions (1) divided by Non Performing Exposures (NPEs) at the end of the reference period NPE (cash) coverage
Non Performing Exposure ratio Non Performing Exposures (NPEs) divided by Gross Loans (3) at the end of the reference period NPE ratio
Non Performing Exposure Total Coverage Accumulated Provisions (1) including the value of the associated collaterals divided by Non Performing Exposures (NPEs) at the end of the reported period NPE Total coverage
Non Performing Loans (under EBA) Τhe part of the Non Performing Exposures (under EBA) that are not classified as Forborne EBA NPLs
Non Performing Loans (under IFRS) Non Performing Loans (under IFRS) are considered those if one of the following conditions apply: a) Exposures which are more than 90 days past-due
b) Exposures under Legal actions NPLs
Non Performing Loan Coverage Accumulated Provisions (1) divided by Non Performing Loans (under IFRS) at the end of the reference period NPL (cash)
Coverage
Non Performing Loan ratio Non Performing Loans (under IFRS) divided by Gross Loans (3) at the end of the reference period NPL ratio
Non Performing Loan Total Coverage Accumulated Provisions (1) including the value of the associated collaterals divided by Non Performing Loans (under IFRS) at the end of the reference period NPL Total Coverage
Pre-Provision Income Operating Income (5) for the period less Total Operating Expenses (7) for the period PPI
Recurring Cost to Income ratio Recurring Operating Expenses (6) for the period divided by Core Operating Income (2) for the period C/I ratio
Risk Weighted Assets Risk-weighted assets are the bank’s assets and off-balance sheet exposures, weighted according to risk factors based on Regulation (EU) No 575/2013,
taking into account credit, market and operational risk RWAs
Tangible Book Value per share Tangible Book Value per share is the Total Equity attributable to shareholders excluding Goodwill and other intangible assets, minorities, hybrids and
preference shares divided by the outstanding number of shares TBV/share
Tangible Equity or Tangible Book Value Tangible Equity is the Total Equity attributable to shareholders excluding goodwill, intangibles, minorities, hybrids, preference shares TE or TBV
Unlikely to pay (under EBA) The debtor is assessed as unlikely to pay its credit obligations in full without realisation of collateral, regardless of the existence of any past-due amount or of
the number of days past due (Article 178(3) of Regulation (EU) 575/2013) UtP

9M 2013 Results FY 2013 Results 52 FY 2016 Results 52
ALPHA BANK
40, Stadiou Street, 102 52
Athens, Greece
Internet : www.alpha.gr
Reuters : ACBr.AT (shares), GRALFAw.AT (warrants)
Bloomberg : ALPHA GA (shares), ALPHAW GA (warrants)
Vassilios Psaltis Lazaros Papagaryfallou
General Manager – CFO Executive General Manager
[email protected] [email protected]
+30 210 326 2181 +30 210 326 4017
Dimitrios Kostopoulos Elena Katopodi
Manager Assistant Manager
Investor Relations Division Investor Relations Division
[email protected] [email protected]
+30 210 326 4082 +30 210 326 4184
Stella Traka Marios-Ioannis Deportou
Senior Investor Relations Officer Senior Investor Relations Officer
[email protected] [email protected]
+30 210 326 4182 +30 210 326 4199
E-mail : [email protected]
Tel : +30 210 326 4082
+30 210 326 4010
+30 210 326 4185
Alpha Bank Contacts