fy 2012 full year results presentation - boom logistics · 4.financial review fy12 ... $100m 5-year...
TRANSCRIPT

August 2012
FY 2012
Full Year Results
Presentation

Presentation Outline
1.Key Messages
2.Business Strategy
3.Business Performance FY12
4.Financial Review FY12
5.Business Outlook FY13
FY 2012 Full Year Results
1
� Statutory EBIT of $37.2m
� Statutory NPAT of $19.7m
� Core business revenue growth of 11%
� Trading EBIT of $35.5m →→→→ up $12.3m, 53%
� Trading NPAT of $18.5m →→→→ up $13.1m, 246%
� Gearing down from 40% to 36%
� Net Tangible Assets per share increased to $0.52
Record profit growth
underlines Boom’s strategy
and momentum
Note: 1. All Statutory references reflect International Financial Reporting Standards (IFRS) financial information. Trading results reflect non-IFRS financial information and exclude one-off items such as restructuring costs and
impairment charges. 2. Boom’s FY12 Trading EBIT result is a non-IFRS measure that excludes $1.7m of one-off items, comprising a $2.9m profit on sale of the Melbourne tower crane assets in October 2011 less $1.2m of Boom Sherrin
restructuring costs. Boom’s FY12 Trading NPAT is a non-IFRS measure that excludes the after-tax impact of these one-off items, being $1.2m. 3. Gearing = Net Debt / Equity

Strong half-on-half profit improvement momentum
2
$m
Note: 1.Trading results reflect non-IFRS financial information and exclude one-off items such as restructuring costs and impairment charges.
Strong half-on-half profit improvement momentum reflects achievements in repositioning the business over the last 2 years:
� Restructured the business away from metropolitan markets serving the commercial construction sector
� Increased revenue from our core market sectors of mining & resources, energy, utilities & infrastructure where customers require value-added services
� Redeployed assets to regions and market sectors to improve Return on Capital Employed
� Focused on customers who are low cost producers and therefore are well-positioned through commodity cycles
� Focused on ongoing maintenance and operational enhancement projects and therefore less affected by capital deferrals for expansion projects

Key Messages
3
� Strong performance in FY12 to deliver a Trading EBIT of $35.5m, up 53%
� Continued growth in the mining and resources sector which now contributes 62% of total crane logistics revenue
� $100m 5-year maintenance contract win to provide crane logistics support for BHP Billiton’s existing Olympic Dam mine operations. Contract commenced in June 2012
� Business expansion on the Gorgon LNG project, adding transport equipment to our current fleet of cranes
� Successful restructuring of Boom Sherrin to focus on core travel towers business – strong outlook for market demand driven by power distribution infrastructure upgrades and telecommunications projects (e.g. Telstra’s 4G roll-out, NBN)
� We will continue to execute our strategy to:
� Focus on customers who are leaders and low cost producers in their respective markets and therefore are well-positioned through commodity cycles
� Generate strong revenue streams from both on-going maintenance support and project-based activity
� Strengthen our customer value proposition to deliver industrial services based on equipment, people, industry knowledge, engineering expertise and best practice safety and quality systems
� We anticipate a Trading EBIT result between $47m - $50m in FY13 supported by the full-year impact of:
� The BHPB Olympic Dam maintenance contract
� Brisbane depot restructuring in July 2012 and redeployment of assets to core markets in NSW, Central QLD & WA
� Boom Sherrin’s restructured business and reinvestment in travel towers
� Contract improvements to cover accommodation and housing cost escalations in QLD

Business StrategyFocused on leading companies in Australia
4
Delivering industrial services utilising operators and equipment ─ cranes, travel towers, transport and other assets ─ for major customers in the mining & resources, energy, utilities and infrastructure sectors
BHP Billiton ♦♦♦♦ Rio Tinto ♦♦♦♦ BHPB Mitsubishi Alliance
Xstrata ♦♦♦♦ Newmont Boddington Gold ♦♦♦♦ Alcoa
Port Waratah Coal Services ♦♦♦♦ Dalrymple Bay Coal Terminal
Anglo American Metallurgical Coal ♦♦♦♦ Fortescue Metals Group
Monadelphous ♦♦♦♦ Thiess Decmil Kentz JV ♦♦♦♦ Downer Group
Orica ♦♦♦♦ Leighton Contractors ♦♦♦♦ BlueScope Steel
Thiess John Holland ♦♦♦♦ Laing O’Rourke ♦♦♦♦ BP Australia ♦♦♦♦ Esso
Westrac Equipment ♦♦♦♦ Hitachi ♦♦♦♦ Komatsu ♦♦♦♦ Bucyrus
John Holland ♦♦♦♦ Toll Group ♦♦♦♦ Hastings Deering
Telstra ♦♦♦♦ United Group ♦♦♦♦ Brookfield Multiplex
Vestas ♦♦♦♦ Alstrom ♦♦♦♦ REpower ♦♦♦♦ TRUenergy
RCR Engineering ♦♦♦♦ Mermaid Marine Australia
BOC Limited ♦♦♦♦ Hazelwood Power
Loy Yang Power ♦♦♦♦ Belle Banne
Ausgrid ♦♦♦♦ Jemena ♦♦♦♦ Western Power ♦♦♦♦ Powerlink
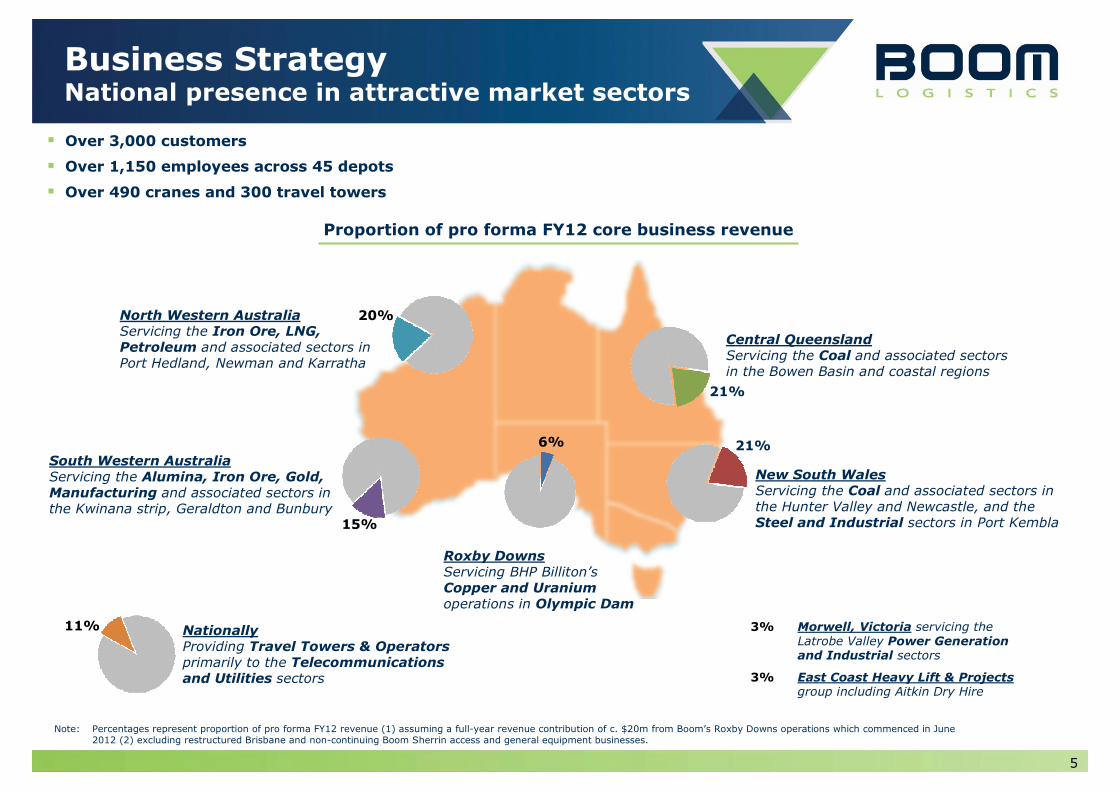
Business StrategyNational presence in attractive market sectors
5
Note: Percentages represent proportion of pro forma FY12 revenue (1) assuming a full-year revenue contribution of c. $20m from Boom’s Roxby Downs operations which commenced in June 2012 (2) excluding restructured Brisbane and non-continuing Boom Sherrin access and general equipment businesses.
� Over 3,000 customers
� Over 1,150 employees across 45 depots
� Over 490 cranes and 300 travel towers
Central QueenslandServicing the Coal and associated sectors in the Bowen Basin and coastal regions
New South WalesServicing the Coal and associated sectors in the Hunter Valley and Newcastle, and the Steel and Industrial sectors in Port Kembla
Roxby Downs Servicing BHP Billiton’s Copper and Uranium operations in Olympic Dam
South Western AustraliaServicing the Alumina, Iron Ore, Gold, Manufacturing and associated sectors in the Kwinana strip, Geraldton and Bunbury
North Western AustraliaServicing the Iron Ore, LNG, Petroleum and associated sectors in Port Hedland, Newman and Karratha
21%
21%
20%
6%
15%
NationallyProviding Travel Towers & Operators primarily to the Telecommunications and Utilities sectors
11% 3% Morwell, Victoria servicing the Latrobe Valley Power Generation and Industrial sectors
3% East Coast Heavy Lift & Projects group including Aitkin Dry Hire
Proportion of pro forma FY12 core business revenue

Business Strategy4 key elements driving growth & returns
6
Boom’s strategy is premised on:
�Safety – for our people, our customers, the community and the environment
�Shareholder Value – to deliver strong value growth for our shareholders
The core elements of our strategy are:
DistinctCustomer
Value Proposition
Focused on
High-Growth Markets
Capital Investmentto drive
Growth & Returns
Building ourOperational Capability
� Delivering industrial services based on equipment, people, industry knowledge, engineering expertise and best practice safety and quality systems
� Sustaining long-term customer relationships in the Mining & Resources, Energy, Utilities and Infrastructure sectors that arestrongly aligned with Boom’s value proposition
� Investing in capital-intensive equipment and operational assets to support our customers’ growth and to drive our Return on Capital Employed performance
� Developing our people, processes and systems to deliver our value proposition to our customers and to generate strong returns for our shareholders

Strategy Execution The last 3 years
7
FY10 FY11 FY12
� Port Kembla crane logistics� Perth crane logistics� Brisbane crane logistics
� Melbourne crane logistics � Boom Sherrin - Sunshine Coast, Toowoomba, Gold Coast, Cairns, Canberra, Melbourne
� James Equipment, GM Baden� Decision to focus on Boom Sherrin’s
travel towers as core business; access business to be managed for cash
� Melbourne Tower Cranes
� Gorgon LNG – TDK JV� Newmont Boddington Gold� Rio Tinto Iron Ore� BHPB Iron Ore
� BHPB Mitsubishi Coal Alliance� Suzlon Energy� Anglo American Coal
� BHPB Olympic Dam� Alcoa� Gorgon LNG – CKJV, Laing O’Rourke
and Leighton Contractors
� $49.2m invested� 45 major crane assets� Average capacity of additions: 127
tonnes
� $22.5m invested� 13 major crane assets� Average capacity of additions: 120
tonnes
� $58.2m invested� 26 major crane assets � Average capacity of additions: 72
tonnes
� $6.9m asset sales� 38 major crane assets� Average capacity of deletions: 40
tonnes
� $5.5m asset sales� 25 major crane assets� Average capacity of deletions: 40
tonnes
� $15.3m asset sales� 56 major crane assets� Average capacity of deletions: 38
tonnes
� Equity raised $82.1m� Net Debt at 30-June $124.9m � Gearing 37%
� Net Debt at 30-June $117.6 � Gearing 40%
� Net Debt at 30-June $113.8m � Gearing 36%
Note: TRIFR = Total Recordable Injury Frequency Rate i.e. the number of recordable injuries per million hours worked in the previous 12 months. Recordable Injuries are Lost Time, Restricted Work and Medical Treatment injuries; minor first aid treatments are not included. Gearing = Net Debt / Equity
Exit non-core businesses
Restructuremetropolitan businesses
Drive growth in core markets ─Contract wins &
renewals
Re-shape fleet ─Invest to support customer growth
Re-shape fleet ─Dispose surplus
assets
Strengthen the balance sheet
Continue our safety journey
towards “zero harm”
� TRIFR of 28.8 – Reduction of 12% from the previous year
� Maintained ISO 9001 & AS4801 accreditation
� TRIFR of 23.5 – Reduction of 25% from the previous year
� TRIFR of 14.4 – Reduction of 39% from the previous year

FY12 Business PerformanceFinancial Highlights
8
Revenue from Core Business 1 11%$284.2m $316.1m
FY11 FY12
�
53%$23.2m $35.5m�Trading EBIT 2
246%$5.4m $18.5m�Trading NPAT
Investment in plant & equipment $33.0m $58.2m�
40% 36%�Gearing
5% 8%�Return on Capital Employed 3
Cash flow from operations & asset disposals
$39.9m $51.7m�
Growth
$0.48 $0.52�Net Tangible Assets per Share
Note: 1. Core business includes Crane Logistics (FY12 revenue $281.2m) and Travel Towers in Boom Sherrin (FY12 revenue $34.9m). Total Group Trading Revenue for FY12 is 349.1m2. Trading EBIT is for the Total Group. Trading EBIT is a non-IFRS measure that excludes $1.7m of one-off items, comprising a $2.9m profit on sale of the Melbourne tower crane assets in
October 2011 less $1.2m of Boom Sherrin restructuring costs. 3. Return on Capital Employed = Trading EBIT divided by Average Capital Employed. Capital Employed = Net Fixed Assets plus Net Working Capital plus Intangible Assets
FY12 Reported EBIT divided by Average Capital Employed excluding Goodwill = 10% (8% in FY11)

53%
$437.9m
$3.8m
$2.1m
FY12 Business PerformanceReturn on Capital Employed (ROCE)
9
ROCE improvement by 3 percentage points driven by strong profit growth:
FY11 Capital Employed
Net working capital
Intangible Assets
$19.2mNet Fixed Assets
$455.4mFY12 Capital Employed
FY11 Trading EBIT
FY12 Trading EBIT
$23.2m
$35.5m
4%
FY11 ROCE
FY12 ROCE
5.0%
8.0%
Note: Return on Capital Employed = Trading EBIT divided by Average Capital EmployedCapital Employed = Net Fixed Assets plus Net Working Capital (Trade Receivables plus Inventory, less Trade Payables) plus Intangible Assets

FY12 Business PerformanceOperational Highlights
10
� Strong improvement in crane logistics: 12% revenue growth, 25% EBIT growth
� Continued growth in the mining and resources sector which now contributes 62% of total crane logistics revenue
� $100m 5-year maintenance contract win to provide crane logistics support for BHP Billiton’s existing Olympic Dam mine operations. Contract commenced in June 2012
� Completion of the Oakland’s Wind Farm construction project – 3 weeks ahead of schedule, OH&S incident free
� Business expansion on the Gorgon LNG project, adding transport equipment to our current fleet of cranes
� Successful restructuring in Boom Sherrin to focus on the core travel towers business and to manage the access and general equipment businesses for cash
� Closure of 6 depots and redeployment of assets to higher yielding regions in the first half of FY12 resulting in 17% EBIT improvement in the second half compared to 2HFY11
� 3% revenue growth in the core travel towers business with no new travel towers in FY12 – investment in FY13 to reinforce Boom’s leading market position in travel towers
� Strong outlook for market demand driven by power distribution infrastructure upgrades and telecommunications projects (e.g. Telstra’s 4G roll-out, NBN)
� Strong progress despite difficult business conditions through the year
� Lower activity due to customer industrial action in the Bowen Basin and the residual impact of FY11 weather events
� Closure of a significant customer mine site in the Bowen Basin
� Pressures on operational costs in housing and accommodation in Queensland and North Western Australia
� Delays in equipment delivery and contract commencements

Financial Review FY12Profit & Loss
11
$m FY11 FY12%
change
Revenue
Crane Logistics 250.3 281.2 12%
Boom Sherrin 72.9 64.0 (12%)
Discontinued businesses 16.8 3.5
Operating Revenue 340.0 348.7 3%
Interest Income 0.4 0.5
Total Revenue 340.4 349.2 3%
Trading EBIT
Crane Logistics 30.9 38.5 25%
Boom Sherrin 7.2 7.9 10%
Discontinued businesses (0.6) 0.2
Central costs (14.3) (11.1) (22%)
Total Trading EBIT 23.2 35.5 53%
Trading EBIT Margin 7% 10%
Interest Expense & Borrowing Costs (15.5) (11.2) (28%)
Tax (2.3) (5.8)
Trading Net Profit after Tax 5.4 18.5 246%
Impairments (39.2) 0.0
Trading Adjustments (3.9) (1.2)
Statutory Net Profit after Tax (37.7) 19.7 152%
� 11% revenue growth from core business (Crane Logistics and travel towers in Boom Sherrin)
� Strong EBIT growth of 25% in Crane Logistics driven by improved business mix and cost management initiatives
� Boom Sherrin revenue change reflects Boom’s “manage for cash” strategy for access and general equipment hire
� Boom Sherrin EBIT margin improvement from 10% in FY11 to 12% in FY12 driven by successful restructuring in 1HFY12 and strong travel towers performance
� Reduction in central costs includes savings from the organisation review to streamline reporting lines nationally in September 2011
� 28% reduction in interest expense and borrowing costs a result of:
─ lower interest rates
─ more favourable debt facility arrangements
Refer to Appendix for Explanatory Notes
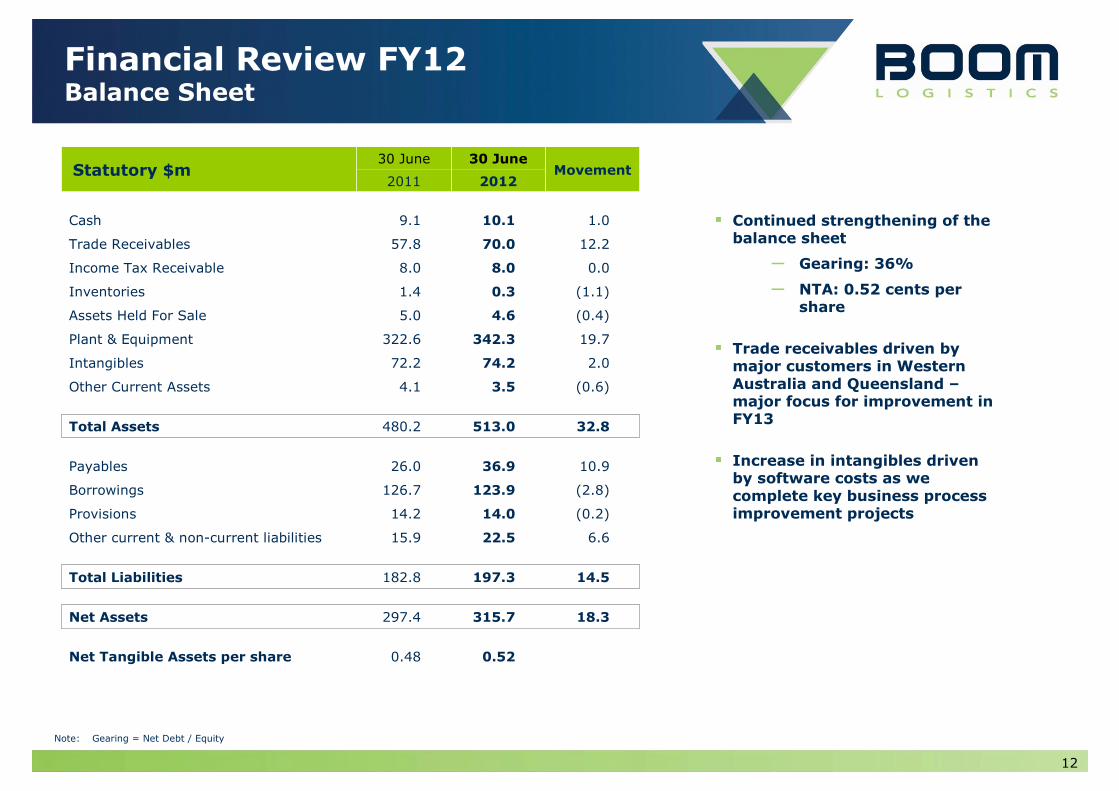
Financial Review FY12Balance Sheet
12
Statutory $m30 June 30 June
Movement2011 2012
Cash 9.1 10.1 1.0
Trade Receivables 57.8 70.0 12.2
Income Tax Receivable 8.0 8.0 0.0
Inventories 1.4 0.3 (1.1)
Assets Held For Sale 5.0 4.6 (0.4)
Plant & Equipment 322.6 342.3 19.7
Intangibles 72.2 74.2 2.0
Other Current Assets 4.1 3.5 (0.6)
Total Assets 480.2 513.0 32.8
Payables 26.0 36.9 10.9
Borrowings 126.7 123.9 (2.8)
Provisions 14.2 14.0 (0.2)
Other current & non-current liabilities 15.9 22.5 6.6
Total Liabilities 182.8 197.3 14.5
Net Assets 297.4 315.7 18.3
Net Tangible Assets per share 0.48 0.52
� Continued strengthening of the balance sheet
─ Gearing: 36%
─ NTA: 0.52 cents per share
� Trade receivables driven by major customers in Western Australia and Queensland –major focus for improvement in FY13
� Increase in intangibles driven by software costs as we complete key business process improvement projects
Note: Gearing = Net Debt / Equity

Financial Review FY12Cash Flow
13
Statutory $m FY11 FY12 Movement
Net receipts / (payments) 50.2 46.6 (3.6)
Net interest received / (paid) (12.2) (10.2) 2.0
Income tax received / ( paid) (3.9) 0.0 3.9
Net Cash provided from operating activities 34.1 36.4 2.3
Purchase of plant and equipment (33.0) (46.7) (13.7)
Payments for intangible assets - software development (0.6) (2.4) (1.8)
Proceeds from the sale of plant and equipment 5.8 15.3 9.5
Net Cash used in investing activities (27.8) (33.8) (6.0)
Net repayments of borrowings (7.2) (1.6) 5.6
Payment of dividends 0.0 0.0 0.0
Cash used in financing activities (7.2) (1.6) 5.6
Net increase / (decrease) in cash (0.9) 1.0 1.9
Closing cash 9.1 10.1 1.0
� Strong cash flows maintained from operating activities
� Capital investment to support customer demand
� Proceeds from asset sales significant as we continue to refresh our fleet
� $58.2m of capital invested in FY12, comprising:
─ $46.7m of purchases of plant & equipment
─ $11.5m funded through Letters of Credit
� $42.3m of the capital investment is for growth, with $15.9m representing sustaining capital expenditure

SustainabilitySafety, People, Communities, the Environment
14
Note: TRIFR = Total Recordable Injury Frequency Rate i.e. the number of recordable injuries per million hours worked in the previous 12 months. Recordable Injuries are Lost Time, Restricted Work and Medical Treatment injuries; minor first aid treatments are not included.
TRIFR Rolling 12-months
28.8
23.5
14.4
� TRIFR of 14.4 at 30 June 2012 (a 39% reduction from the previous year) as we continue our safety journey towards “zero harm”
� Our National Indigenous Employment Framework provides a basis for localised strategies for generating work opportunities and developing sustainable relationships with indigenous communities
� Investment in people
─ ICAM Investigator Training
─ “Leaders of Tomorrow” Supervisor Program
─ “Managing with Confidence” Supervisor Training
─ Strategic Account Management Training
─ Online induction tool
� Maintained our certification to ISO 9001 and AS4801

Business Outlook FY13
15
� Boom’s market fundamentals are strong
� Despite recent falls in commodity prices, Boom’s customers in the mining and resources sector remain committed to steady increases in output volumes to meet demand in export markets
� Boom’s sustainable forward earnings are not reliant on new project decisions by our customers. Such decisions do however present new tender opportunities for accelerated earnings growth
� Boom can be impacted by adverse factors that affect our customers such as industrial action, weather events and operational restructuring or site closures
� We will continue to execute our strategy to:
� Focus on customers who are leaders and low cost producers in their respective markets and therefore are well-positioned through commodity cycles
� Generate strong revenue streams from both on-going maintenance support and project-based activity
� Strengthen our customer value proposition to deliver industrial services based on equipment, people, industry knowledge, engineering expertise and best practice safety and quality systems
� Based on prevailing market conditions in the coming year we expect to:
� Manage a capital investment program of c. $60m to continue to strengthen the business
� Deliver a Trading EBIT result of between $47m - $50m
� Declare a final dividend in FY13
� Our FY13 result will be supported by the full-year impact of:
� The BHPB Olympic Dam maintenance contract
� Brisbane depot restructuring in July 2012 and redeployment of assets to core markets in NSW, Central QLD & WA
� Boom Sherrin’s restructured business and investment in travel towers
� Contract improvements to cover accommodation and housing cost escalations in QLD

FY12
Full Year Results
Presentation
Appendix
16

17
Trading Results by DivisionFY2011 & FY2012
Refer Explanatory Notes on the next page
Revenue
Crane Logistics 124.6 125.7 250.3 137.9 143.3 281.2 11% 14% 12%
Boom Sherrin 37.1 35.7 72.9 34.0 30.0 64.0 (8%) (16%) (12%)
Discontinued businesses
Melbourne tower cranes 6.5 6.8 13.3 3.5 0.0 3.5
James Group 2.6 0.9 3.5 0.0 0.0 0.0
Operating Revenue 170.8 169.1 340.0 175.5 173.2 348.7 3% 2% 3%
Interest Income 0.2 0.2 0.4 0.2 0.3 0.5 49% 38% (7%)
Total Revenue 171.0 169.3 340.4 175.7 173.4 349.2 3% 2% 3%
Trading EBIT
Crane Logistics 19.2 11.8 30.9 18.8 19.7 38.5 (2%) 67% 25%
Boom Sherrin 3.5 3.7 7.2 3.5 4.4 7.9 2% 17% 10%
Discontinued businesses
Melbourne tower cranes 0.7 0.4 1.1 0.2 0.0 0.2
James Group (1.0) (0.7) (1.7) 0.0 0.0 0.0 100% (100%) 100%
Central costs (7.4) (6.8) (14.3) (6.6) (4.5) (11.1) 11% 35% 22%
Total Trading EBIT 14.9 8.3 23.2 15.9 19.6 35.5 7% 135% 53%
Interest Expense (4.6) (4.7) (9.3) (4.3) (3.7) (8.0)
Borrowing Costs (3.2) (3.1) (6.3) (1.6) (1.6) (3.2)
Trading Profit before Tax 7.1 0.6 7.7 10.0 14.4 24.3
Tax (2.0) (0.3) (2.3) (3.1) (2.7) (5.8)
Trading Net Profit after Tax 5.1 0.3 5.4 6.9 11.6 18.5 36% 4,188% 246%
Impairments 0.0 (39.2) (39.2) 0.0 0.0 0.0
Trading Adjustments (2.3) (1.6) (3.9) (1.2) 0.0 (1.2)
Statutory Net Profit after Tax 2.8 (40.5) (37.7) 8.0 11.7 19.7 186% 129% 152%
2H12
pcp
FY12
pcp$m 1H11 2H11 FY11 1H12 2H12 FY12
1H12
pcp
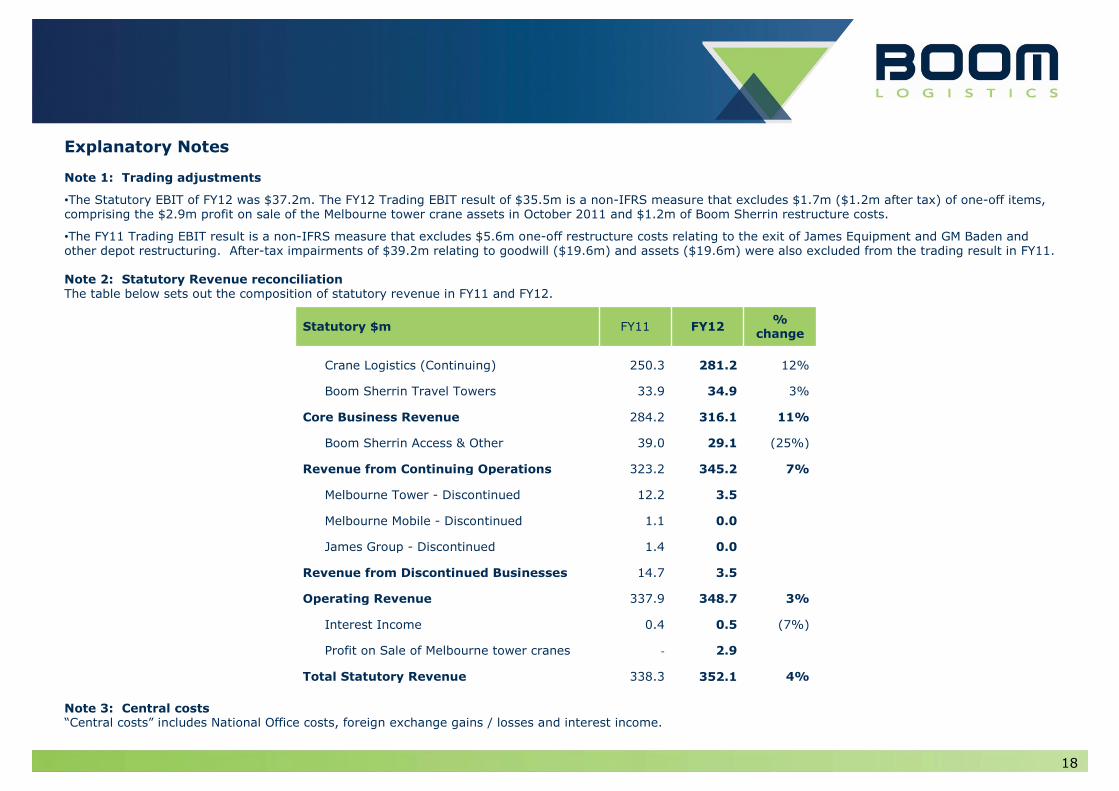
Explanatory Notes
Note 1: Trading adjustments
•The Statutory EBIT of FY12 was $37.2m. The FY12 Trading EBIT result of $35.5m is a non-IFRS measure that excludes $1.7m ($1.2m after tax) of one-off items, comprising the $2.9m profit on sale of the Melbourne tower crane assets in October 2011 and $1.2m of Boom Sherrin restructure costs.
•The FY11 Trading EBIT result is a non-IFRS measure that excludes $5.6m one-off restructure costs relating to the exit of James Equipment and GM Baden and other depot restructuring. After-tax impairments of $39.2m relating to goodwill ($19.6m) and assets ($19.6m) were also excluded from the trading result in FY11.
Note 2: Statutory Revenue reconciliationThe table below sets out the composition of statutory revenue in FY11 and FY12.
Note 3: Central costs“Central costs” includes National Office costs, foreign exchange gains / losses and interest income.
18
Statutory $m FY11 FY12%
change
Crane Logistics (Continuing) 250.3 281.2 12%
Boom Sherrin Travel Towers 33.9 34.9 3%
Core Business Revenue 284.2 316.1 11%
Boom Sherrin Access & Other 39.0 29.1 (25%)
Revenue from Continuing Operations 323.2 345.2 7%
Melbourne Tower - Discontinued 12.2 3.5
Melbourne Mobile - Discontinued 1.1 0.0
James Group - Discontinued 1.4 0.0
Revenue from Discontinued Businesses 14.7 3.5
Operating Revenue 337.9 348.7 3%
Interest Income 0.4 0.5 (7%)
Profit on Sale of Melbourne tower cranes - 2.9
Total Statutory Revenue 338.3 352.1 4%

Investor enquiries:
Brenden Mitchell
Managing Director and
Chief Executive Officer
03 9207 2500
Iona MacPherson
Chief Financial Officer and
Company Secretary
03 9207 2500
19

20
Disclaimer
This presentation contains certain forward-looking statements with respect to the financial condition, results of operations and business of Boom and certain plans and objectives of the management of Boom. Forward-looking statements can generally be identified by the use of words such as 'project', ‘believe’, 'foresee', 'plan’, 'expect', 'aim', 'potential’, ‘goal’, ‘target’, ‘intend', 'anticipate’, 'believe', 'estimate’, 'may', ‘could’, 'should', 'will’ or similar expressions. All such forward looking statements involve known and unknown risks, significant uncertainties, assumptions, contingencies and other factors, many of which are outside the control of Boom, which may cause the actual results or performance of Boom to be materially different from any future results or performance expressed or implied by such forward looking statements. Such forward-looking statements speak only as of the date of this announcement. Factors that could cause actual results or performance to differ materially include without limitation the following: risks and uncertainties associated with the Australian and global economic environment and capital market conditions, fluctuations in foreign currency exchange and interest rates, competition, Boom's relationships with, and the financial condition of, its suppliers and customers, or legislative changes, or regulatory changes or other changes in the laws which affect Boom's business. The foregoing list of important factors is not exhaustive. There can be no assurance that actual outcomes will not differ materially from these statements. Readers should not place undue reliance on forward looking statements. Except as required by law and ASX Listing Rules, Boom undertakes no obligation to update publicly or otherwise revise any forward looking statement as a result of new information, future events or other factors.
