fuzzy mean filter for immense impulse noise removal · fuzzy mean filter for immense impulse noise...
TRANSCRIPT
International Journal of Applied Engineering Research ISSN 0973-4562 Volume 12, Number 18 (2017) pp. 7642-7650
© Research India Publications. http://www.ripublication.com
7642
Fuzzy Mean Filter for Immense Impulse Noise Removal
Vijaya Kumar Sagenela 1 and C .Nagaraju 2
1Research Scholar, Department of Computer Science & Engineering,
Jawaharlal Nehru Technological University, Hyderabad, Telangana, India. 1Orcid Id: 0000-0002-2867-3093
2Associate Professor, Department of Computer Science & Engineering,
Y.S.R. Engineering college of Y.V. University, Proddutur, Andhra Pradesh, India.
Abstract
In this paper, fuzzy mean filter (FMIINR) is proposed for
impulse noise removing. The design of filter comprises of two
phases. One is detection of damaged pixels and second is its
reconstruction. For the detection, we have used fuzzy
triangular membership function and classic mean filter for
reconstruction. The proposed algorithm is capable to
reconstruct 90% damaged image. The results will be evaluated
with various parameters PSNR, SSIM, NAE, NCC and SCC
so that we can ensure about the quality of services and
FMIINR proves to be very robust at immense noise level.
Keywords: Image De-noising, Filters, Fuzzy sets, Triangular
membership.
INTRODUCTION
Digital images play an indispensable role in functions of every
day’s life like television, magnetic quality imaging, pc
tomography as well as in areas of research and science such as
geographical expertise techniques and astronomy [1].There
are some imperfections that exist during transmission. Images
get affected during data transmission and compression.
Therefore, de-noising is frequently a vital and before analysed
it is the first step to be taken. It is obligatory to follow an
efficient de-noising system to compensate for such
information corruption. Noise modelling in images is broadly
pretentious by using taking devices, knowledge transmission
media, image quantization and discrete sources of radiation.
In the early research, filters are mainly focused on the
randomness. Median filter and its varieties come under this
category. These filters are mainly focused on the full pixels
without considering them good or bad. As a result, since the
uncorrupted pixels are altered, they damage many image
details in the high noise level [9]. There are numbers of filters
available for impulse noise removal. Adaptive Mean filter
(AM) is used to overcome median filter limitation by
checking the correctness of median filter by varying its
window size. This filter does not perform well above 50%
noise level.
Boundary discriminative noise detection (BDND) filter is
slowest among all the filters. However, the BDND filter
restores the images with undue smoothing. Cloud Model filter
can be used in data mining and image processing area also. It
is mainly used to identify corrupted pixels and replace it with
the centre weighted mean value. The main advantage of this
filter is that it gives better performance than other switching
filters in image de-noising at a wide range of noise levels.
However, it restores 95% of the noisy image. This filter
works well only on high density whereas at lower level
density it changes the definition of the noisy image.
Fuzziness came into limelight with the advent of the fuzzy
theory. Switching filters and membership functions are of the
latest technology. In this scheme noise is identified first
before noise removal. Evacuated output shows that mean
filtering makes a great improvement in image de-noising as
compared to other mean filtering. These filters generate
number of detection errors and smudge the level of noise due
to uncertainties of noise level [3].
To improve the noise level, this paper presents triangular
membership function scheme with the help of the mean filter.
The experiment results show that proposed scheme based on
triangular membership function with mean filter has better
performance in image de-noising with a wide range of noise
levels. Even if the noise level is close to 97%, proposed
scheme can restore the images with good detail preservation
[4, 11].
PROPOSED METHOD
In this section we are going to give a detailed explanation of
our work. Initially we would like to discuss about the
contribution we have done in this paper described below.
We have to design an image de-noising algorithm using Fuzzy
triangular membership function, which would able to denoise
97% damaged image.
This proposed algorithm compromises of two phases:
A) Finding undamaged pixel
B) Algorithm for the reconstruction of noisy pixels.
International Journal of Applied Engineering Research ISSN 0973-4562 Volume 12, Number 18 (2017) pp. 7642-7650
© Research India Publications. http://www.ripublication.com
7643
A) Finding undamaged pixel:
As we are not focusing on a particular noise, unlike impulse
noise in which we entirely focus on highly dark and highly
bright pixel, we focused on image consistency for finding the
de-noise region of the image as the damaged area of image
contains high inconsistency corresponding to the surrounding
pixel. So with this approach we find the center location of
damaged region and apply the mean filter for its
reconstruction. The rest is given in the next section.
For every pixel at location (i, j) in the image, we take
(2n +1) × (2n + 1) neighbourhood region with at the
centre.
Set of intensities of pixel in this region are called
= {Mi + k, j + l | − n ≤ k, l ≤ n }…………. (1)
After that set of fuzzy is defined correspondence to every
triangular member function.
f (a:x,y,z)= max(min( , ), 0………. (2)
The key stages of our algorithm are as follows.
I. Define Parameters: The image de-noising can only be
performed using minimum number of undamaged pixels in a
matrix. We denoted this number as P. We are required to
apply multiple iterations so that the value of minimum
undamaged will get traced and at least, we obtain 90%
undamaged pixel in an image. The analysis is only done in a
matrix form and the size of a matrix is 3 X 3. For construction
of undamaged pixels as well as findings we have used mean
filter and Triangular Membership functions.
II. Computation of Mean of non-damaged pixels: In this
work, damaged pixels values are either 0 or 1 whereas non-
damage pixels values lie between 0 and 1. By taking mean of
this non-damage pixel, one can get the values of the damaged
pixels easily. In this way, all the values can be calculated
easily.
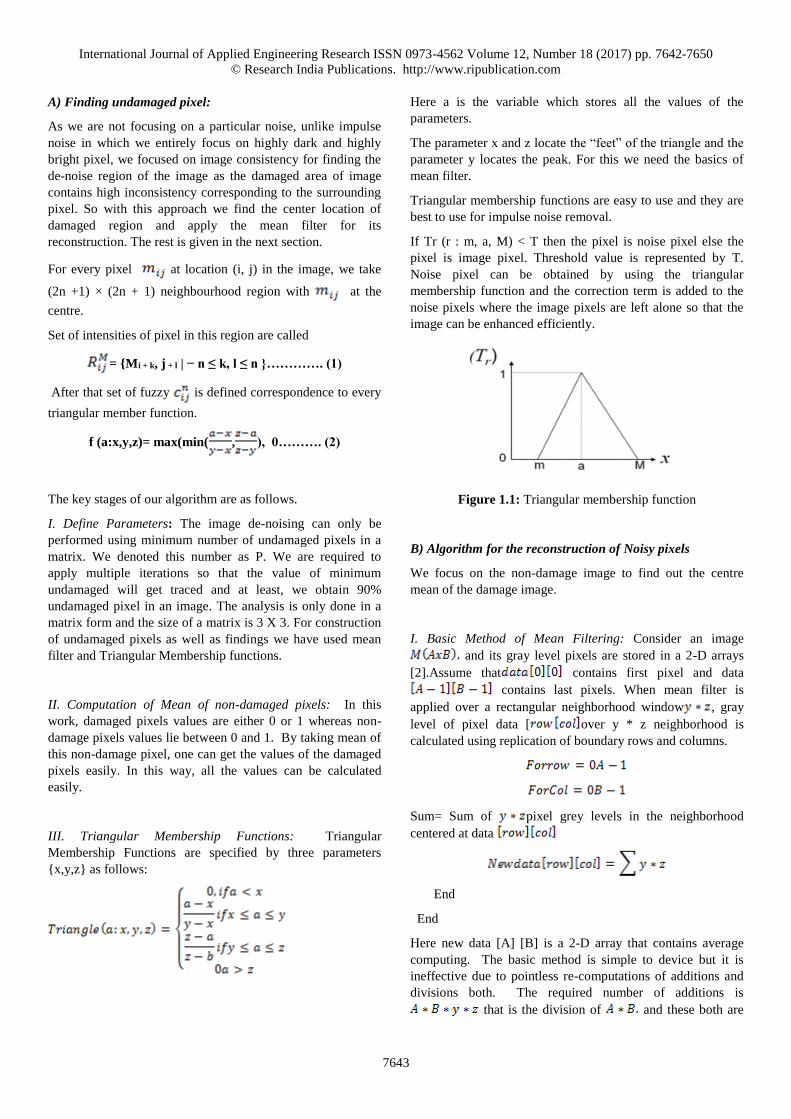
III. Triangular Membership Functions: Triangular
Membership Functions are specified by three parameters
{x,y,z} as follows:
Here a is the variable which stores all the values of the
parameters.
The parameter x and z locate the “feet” of the triangle and the
parameter y locates the peak. For this we need the basics of
mean filter.
Triangular membership functions are easy to use and they are
best to use for impulse noise removal.
If Tr (r : m, a, M) < T then the pixel is noise pixel else the
pixel is image pixel. Threshold value is represented by T.
Noise pixel can be obtained by using the triangular
membership function and the correction term is added to the
noise pixels where the image pixels are left alone so that the
image can be enhanced efficiently.
Figure 1.1: Triangular membership function
B) Algorithm for the reconstruction of Noisy pixels
We focus on the non-damage image to find out the centre
mean of the damage image.
I. Basic Method of Mean Filtering: Consider an image
and its gray level pixels are stored in a 2-D arrays
[2].Assume that contains first pixel and data
contains last pixels. When mean filter is
applied over a rectangular neighborhood window , gray
level of pixel data [ over y * z neighborhood is
calculated using replication of boundary rows and columns.
Sum= Sum of pixel grey levels in the neighborhood
centered at data
End
End
Here new data [A] [B] is a 2-D array that contains average
computing. The basic method is simple to device but it is
ineffective due to pointless re-computations of additions and
divisions both. The required number of additions is
that is the division of and these both are
International Journal of Applied Engineering Research ISSN 0973-4562 Volume 12, Number 18 (2017) pp. 7642-7650
© Research India Publications. http://www.ripublication.com
7644
directly proportional to the image size and increase
accordingly.
B.2 Main Rules to be followed in this work:
In this work, main concern is to reconstruct fully damaged
image using Fuzzy de-noising . Main rules to be followed are:
A) Rule 1: First of all, target the matrix which is having at
least 3 uncorrupted pixels starts from 3X3 matrix size and
increase according to the steps. If it encounters any matrix in
the entire image, it stops and reconstructs the central pixel of
the image using basic Mean Filtering technique. Therefore
uncorrupted pixel is decided by fuzzy triangular membership
function.
B) Rule 2: If Rule 1 doen’t encounter the matrix having at
least 2 i.e. THRESHOLD VALUE of uncorrupted pixel then
threshold of uncorrupted pixel is stepped down and one can
find the matrix (according to rule 1). At this point it steps
down the size of matrix as well. With the help of this
approach, the centre pixel we are constructing can get better
resemblance to its original value.
C) Rule 3: If Rule 2 gets failed we need to increase the size
of the matrix to the extent that we at least find a matrix having
maximum number of uncorrupted pixels and start
reconstruction from this point.
Algorithm for Detection and De-noising of pixels:
Procedure Denoise Noisy Pixels (Image I)
For all pixels Mi,jin I do
If Mij ≠ then
1. Then retain value of Mi j
2. Continue;
3. initialize row and Columns
For
For
i=rows← 1
j=cols←1
4. Generate empty matrix if
(Input image(i, j) ~= PIXEL_MIN)&&
(Input image(i, j) ~= PIXEL_MAX)
Continue;
end;
5. Assign a= high threshold
6. Initialize window size =3 and set N=1.
7. Add padding to both sides,
if (i, j) is lie within N of the image border,
if (i <= N) || (i >= rows-N) || (j <= N) || (j >= cols-N)
Image=Input image; after padding increment
idx_x = idx_x + N;
idx_y = idx_y + N;
else
Image =Input image;
End
End
8. Increment window size (2N+1)x(2N+1)
W_S = Image (idx_x–N : idx_x+N, idx_y–N : idx_y+N);
W_S = W_S(:);
and store resultant value in a linear array
9. Primary mean( x)=mean(W_S);
10. secondary mean ( S) = abs(W_S – x).^2;
11. n=mean(S);
12. if (n <= 10-3)
Out_image(i, j) = x;
empty matrix is equal to primary mean
break;
end
13. Compute the outth using Equation (2)
If outth >a
Out_image(i, j) = Image(idx_x, idx_y);
else
Out_image(i, j)= Sum(WS)
End if
End for
End for
International Journal of Applied Engineering Research ISSN 0973-4562 Volume 12, Number 18 (2017) pp. 7642-7650
© Research India Publications. http://www.ripublication.com
7645
RESULTS AND DISCUSSIONS
1. Configuration:
For the simulation propose recognized images named as
Baboon, Lena, Bridge and Pepper. These are 256*256 8-bit
grayscale images. However these images are corrupted with
salt and pepper noise. There are different filters which are
considered for comparison purpose as shown in the Table 1
These filters can remove high level the salt-and-pepper noise.
A Proposed scheme is also applied with the existing filters.
Our proposed scheme is able to restore images at the level of
90%.
2. Time complexity Performance:
Time complexity of the FMIINR is also less due to lower
computations and has greater efficiency. Therefore, FMIINR
has better accuracy and efficiency as compared to the existing
filters.
3. Restoration Performance: Our proposed edge detection
algorithm is based on Triangular membership function and is
simulated on MATLAB R2008b. Experiments are performed
on different levels of damaged pictures and simulation
outcome is on some of ordinary pictures are given in the
figure below. To analyze efficiency of more than an existing
work, Peak Signal-to-Noise Ratio (PSNR), PR, SSIM,
Normalize Cross Co-relation and Normalize Absolute error
are taken as performance measures. These parameters are
explained in the next section of this paper. Performance of an
algorithm is analyzed and evaluated on the basis of the
various parameters. First of all we will discuss them one by
one. In next section performance of the filters is analyzed in
terms of PSNR value.
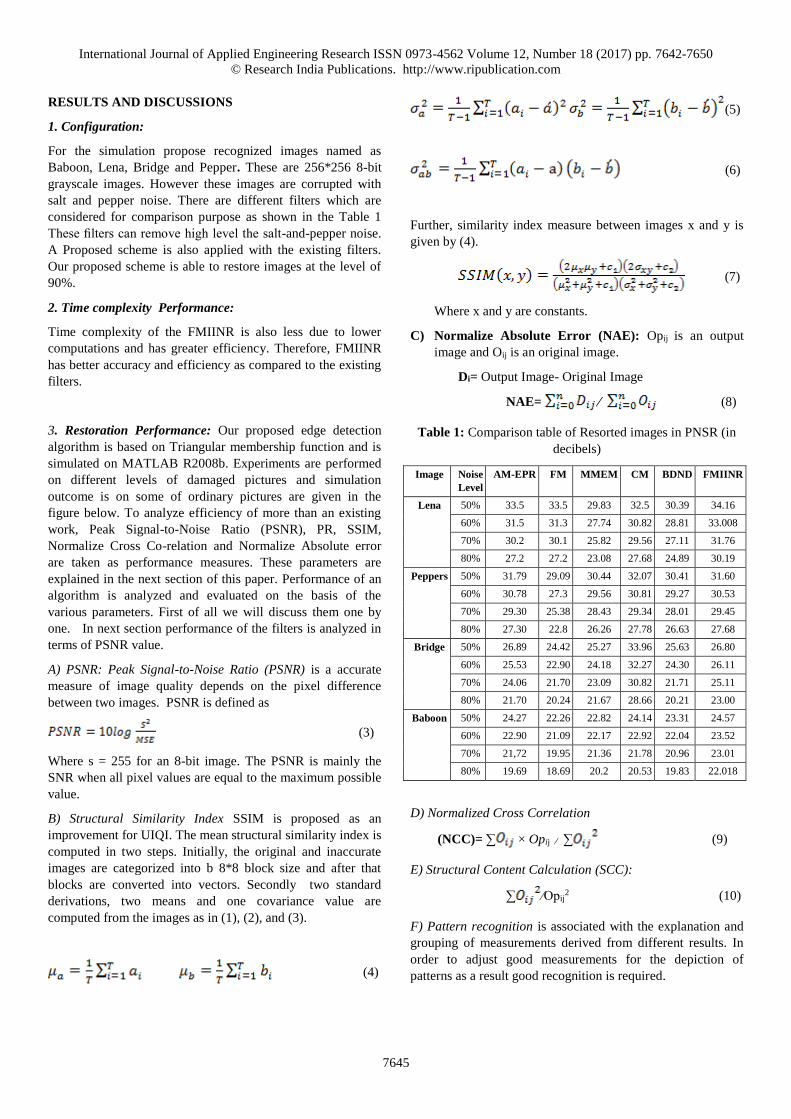
A) PSNR: Peak Signal-to-Noise Ratio (PSNR) is a accurate
measure of image quality depends on the pixel difference
between two images. PSNR is defined as
(3)
Where s = 255 for an 8-bit image. The PSNR is mainly the
SNR when all pixel values are equal to the maximum possible
value.
B) Structural Similarity Index SSIM is proposed as an
improvement for UIQI. The mean structural similarity index is
computed in two steps. Initially, the original and inaccurate
images are categorized into b 8*8 block size and after that
blocks are converted into vectors. Secondly two standard
derivations, two means and one covariance value are
computed from the images as in (1), (2), and (3).
(4)
(5)
(6)
Further, similarity index measure between images x and y is
given by (4).
(7)
Where x and y are constants.
C) Normalize Absolute Error (NAE): Opij is an output
image and Oij is an original image.
Di= Output Image- Original Image
NAE= ∕ (8)
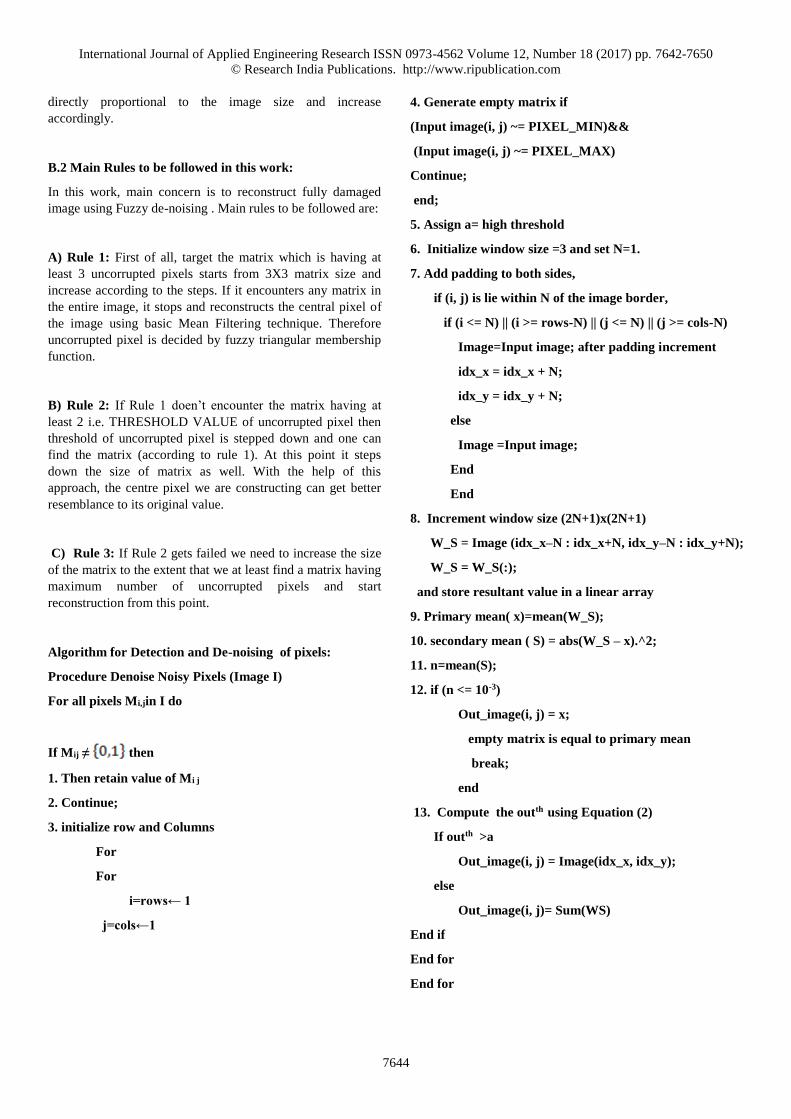
Table 1: Comparison table of Resorted images in PNSR (in
decibels)
Image Noise
Level
AM-EPR FM MMEM CM BDND FMIINR
Lena 50% 33.5 33.5 29.83 32.5 30.39 34.16
60% 31.5 31.3 27.74 30.82 28.81 33.008
70% 30.2 30.1 25.82 29.56 27.11 31.76
80% 27.2 27.2 23.08 27.68 24.89 30.19
Peppers 50% 31.79 29.09 30.44 32.07 30.41 31.60
60% 30.78 27.3 29.56 30.81 29.27 30.53
70% 29.30 25.38 28.43 29.34 28.01 29.45
80% 27.30 22.8 26.26 27.78 26.63 27.68
Bridge 50% 26.89 24.42 25.27 33.96 25.63 26.80
60% 25.53 22.90 24.18 32.27 24.30 26.11
70% 24.06 21.70 23.09 30.82 21.71 25.11
80% 21.70 20.24 21.67 28.66 20.21 23.00
Baboon 50% 24.27 22.26 22.82 24.14 23.31 24.57
60% 22.90 21.09 22.17 22.92 22.04 23.52
70% 21,72 19.95 21.36 21.78 20.96 23.01
80% 19.69 18.69 20.2 20.53 19.83 22.018
D) Normalized Cross Correlation
(NCC)= ∑ × Opij ∕ ∑ (9)
E) Structural Content Calculation (SCC):
∑ ∕Opij2 (10)
F) Pattern recognition is associated with the explanation and
grouping of measurements derived from different results. In
order to adjust good measurements for the depiction of
patterns as a result good recognition is required.

International Journal of Applied Engineering Research ISSN 0973-4562 Volume 12, Number 18 (2017) pp. 7642-7650
© Research India Publications. http://www.ripublication.com
7646
G) Time Complexity: It defines average time taken by the
proposed technique for the execution. For the comparison
purpose filters are compared on a personal computer equipped
with system configuration of 2 GB RAM and 3.2 GHz CPU.
It is proved that FM has less time complexity. So it is fastest
among all due to small window size. BDND filter is slowest
among all. CM Filter is the second fastest filter. FMIINR is
the third fastest filter. In time complexity FM and CM filters
are faster than proposed technique. Time is taken in seconds.
Table 2: Comparison table of the time complexities in seconds
Filters Noise Level in %
50 60 70 80
CM .686 .702 .764 .920
BDND 12.074 11.825 11.544 11.341
AM .250 .312 .452 .780
MMEM .312 .296 .328 .343
FM .187 .187 .172 .187
AM-EPR 288.195 288.195 326.743 368.140
FMIINR 1.5318 1.877795 2.647415 15.938259
Table 3: Comparison of various parameters
Images Noise Level in % PSNR SSIM NAE NCC SCC
Lena 50 33.271 0.90381 0.02669 1.0015 0.99819
60 31.6441 0.89376 0.02914 1.0011 0.9954
70 30.453 0.87927 0.0421 1.0009 0.9952
80 28.841 0.85232 0.037475 0.99988 0.9956
90 26.991 0.79721 0.99834 0.0485914 0.99521
97 22.761 0.68407 0.99255 0.07566 0.99585
baboon 50 23.271 0.69817 0.087021 1.0026 0.97954
60 22.8541 0.66514 0.93641 1.001 0.97992
70 22.553 0.62208 0.10154 0.9938 0.97933
80 21.041 0.56399 0.11285 0.99485 0.98289
90 19.991 0.45824 0.98809 0.98523 0.13385
97 17.612 0.31046 0.77432 0.99358 0.17011
Pepper 50 32.699 0.87394 0.030823 1.0012 0.995031
60 30.539 0.862080 0.033586 1.0007 0.9514
70 31.453 0.84858 0.036522 1.0002 0.99531
80 28.631 0.82291 0.04646 0.99934 0.9951
90 26.838 0.77295 0.99715 0.052018 0.9957
97 23.1660 0.66425 0.98975 0.80322 0.99794
Bridge 50 26.969 0.75737 0.076958 1.0029 0.98354
60 26.431 0.7293 1.0021 0.082884 0.98294
70 31.453 0.69561 1.0006 0.08996 0.98317
80 24.658 0.63942 0.10132 0.99784 0.98317
90 21.341 0.53303 0.99266 0.12482 0.98343
97 22.657 0.35898 0.97519 0.17062 0.99506

International Journal of Applied Engineering Research ISSN 0973-4562 Volume 12, Number 18 (2017) pp. 7642-7650
© Research India Publications. http://www.ripublication.com
7647
a) b) c) d)
e) f) g) h)
Figure 2.1: Depicts pepper images. A) Original image b) PSNR at 50% is 32.699 db c) PSNR at 60% is 30.5395 db d) PSNR at
70% is 31.453db e) PSNR at 80% is 28.6812 db f) PSNR at 90% is 26.8385 g) PSNR at 97% is 23.1660 h) PSNR at 97% is
20.1660.
a) b) c) d)
e) f) g) h)
Figure 2.2: Depicts Bridge images. A) Original image b) PSNR at 50% is 26.969 db c) PSNR at 60% is 26.4312 db d) PSNR at
70% is 31.453 db e) PSNR at 80% is 24.6812 db f) PSNR at 90% is 21.3413 g) PSNR at 97% is 22.6577 db. h) PSNR at 99% is
20.5677 db

International Journal of Applied Engineering Research ISSN 0973-4562 Volume 12, Number 18 (2017) pp. 7642-7650
© Research India Publications. http://www.ripublication.com
7648
a) b) c) d)
e) f) g) h)
Figure 2.3: depict images of House a) Original image b) PSNR at 50% is 33.271 db c) PSNR at 60% is 31.6441 db d) PSNR at
70% is 30.453 db e) PSNR at 80% is 28.841 db f) PSNR at 90% is 26.9911 g) PSNR at 97% is 22.761 db. g) PSNR at 99% is
18.681 db
a) b) c) d)
e) f) g) h)
Figure 2.4: depicts images of Baboon a) Original image b) PSNR at 50% is 23.271 db c) PSNR at 60% is 22.8541 db d) PSNR
at 70% is 22.853 db e) PSNR at 80% is 21.041 db f) PSNR at 90% is 19.9911 g) PSNR at 97% is 17.61 db. h) PSNR at 99% is
15.56%.
International Journal of Applied Engineering Research ISSN 0973-4562 Volume 12, Number 18 (2017) pp. 7642-7650
© Research India Publications. http://www.ripublication.com
7649
In Fig .2.1 Pepper image is considered in this figure. First of
all, original image is taken. PSNR value is calculated at a
different level of noise. It is 32.690 db at 50% and 23.1660
db at 97%. In Fig .2.2 Bridge image is considered in this
figure. First of all, original image is taken. PSNR value is
calculated at a different level of noise. It is 31.453 db at 70%
and 20.560 db at 90. In Fig In Fig 2.3 Lena image is
considered in this figure. First of all, original image is taken.
PSNR value is calculated at different level of noise. It is
31.644 db at 60% and 28.846 db at 80%. In Fig 2.4 Baboon
image is considered in this figure. First of all, original image
is taken. PSNR value is calculated at different level of noise.
It is 17.61 db at 97% and 15.56 db at 99%.
CONCLUSION
For de-noising of noisy images, few aspects are very
important. First is exact estimation of noisy pixels. Second the
reconstruction of damaged pixels should lie close to the
original value and last is lower computation, complexity and
greater efficiency along with this time complexity should be
minimum. So that real time deployment of the filter makes
possible. Handling all of these challenges, FMIINR excellent
performance is being validated with experimental results.
There are various filters which are not performing above 60%
because they lost the original content of the image above this
level whereas FMIINR can restore damaged pixel at 90%
also.
As already mentioned the de-noising of filter is done with the
triangular membership function and reconstruction is done by
the classic mean filter. The surprising performance is being
shown by the filter for 90% of damaged image. So we can say
FMIINR filter can deploy for real time applications also. It is
very useful for medical images. Further, it can be used for
video noising and de-noising of SAR images.
REFERENCES
[1] Zang, H. Zhong, and C. Dang, “Delay-dependent
decentralized H ∞ iltering for discrete-time nonlinear
interconnected systems with time-varying delay
based on the TS fuzzy model,” IEEE Trans. Fuzzy
Syst., ol. 20, no. 3, pp. 431–443, Jun. 2012
[2] S. G. Chang, B. Yu, and M. Vetterli, “Spatially
adaptive wavelet thresholding with context modeling
for image de-noising ,” IEEE Trans. Image
Processing, vol. 9, pp. 1522–1531, Sept. 2000.
[3] Dimitri Van De Ville, Mike Nachtegael, Dietrich
Van der Weken, Etienne E. Kerre, Wilfried
Philipsand Ignace Lemahieu “Noise Reduction by
Fuzzy Image Filtering”IEEE TRANSACTIONS ON
FUZZY SYSTEMS, VOL. 11, NO. 4, AUGUST 2003
[4] S. Schulte, B. Huysmans, A. Piˇzurica, E. E. Kerre,
and W. Philips, “A new fuzzy-based wavelet
shrinkage image de-noising technique,” Lecture
Notes Comput. Sci., vol. 4179, pp. 12–23, 2009
[5] S. Schulte, Valerie De Witte, and Etienne E. Kerre
“A Fuzzy Noise Reduction Method for Color
Images”, IEEE TRANSACTIONS ON IMAGE
PROCESSING, VOL. 16, NO.5, MAY 2007.
[6] S. Schulte, Valerie De Witte, and Etienne E. Kerre
“A Fuzzy Noise Reduction Method for Color
Images”, IEEE TRANSACTIONS ON IMAGE
PROCESSING, VOL. 16, NO.5, MAY 2007.
[7] C. Vertan and V. Buzuloiu, “Fuzzy nonlinear
filtering of color images,” in Fuzzy Techniques in
Image Processing, E. E. Kerre and M. Nachtegael,
Eds., 1st ed. Heidelberg, Germany: Physical Verlag,
2000, vol. 52, pp. 248–264.
[8] S. M. Guo, C. S. Lee, and C. Y. Hsu, “An intelligent
image agent based on soft-computing techniques for
color image processing,” Expert Syst Appl., vol. 28,
pp. 483–494, Apr. 2005
[9] Z. Wang and D. Zhang, “Progressive switching
median filter for the removal of impulse noise from
highly corrupted images,”IEEETrans. Circuits Syst.
II, Analog Digit. Signal Process., vol. 46, no. 1, pp.
78–80, Jan. 1999.
[10] T. Chen and H. Wu, “Adaptive impulse detection
usingcenterweightedmedianfilters,”IEEESignalProce
ss.Lett.,vol.8,no.1,pp. 1–3, Jan. 2001.
[11] H. L. Engand K. K. Ma “Noise adaptive soft
switching median filter”, IEEE Trams. Image
Processing., vol. 10. No.2, pp. 242-252.Feb, 2001.
[12] S. Zhang and M.A.Karim,“A new impulse detector
for switching medianfilters, “IEEE Signal Process.
Lett., vol.9, no.11, pp. 360–363, Nov. 2002.
[13] V. Crnojevic, V. Šenk, and. Trpovski, “Advanced
impulse detection based on pixel-wise MAD, “IEEE
Signal Process. Lett., vol.11,no.7, pp. 589–592, Jul.
2004.
[14] R. H. Chan, C.-W. Ho, and M. Nikolova, “Salt-and-
pepper noise removal by median-type noise detectors
and detail-preserving regularization, “IEEE Trans.
Image Process., vol.14, no.10, pp.1479–1485, Oct.
2005.
[15] Zhe Zhou, “Cognition and Removal of Impulse
Noise With Uncertainty”, IEEE Transactions On
Image Processing, Vol.21, No.7, July 2012
[16] S.Vijaya Kumar and C.Nagaraju,” Identifying and
Removal of Impulse Noise with Fuzzy Certainty
International Journal of Applied Engineering Research ISSN 0973-4562 Volume 12, Number 18 (2017) pp. 7642-7650
© Research India Publications. http://www.ripublication.com
7650
Degree”IEEE international Conference on
Communications and Electronics systmes ,2016
[17] S.Vijaya Kumar and C.Nagaraju,” Removal of High
Density Salt and Pepper Noise from the Image Using
CMA” Proceedings of Emerging Trends in
Electrical, Communications and Information
Technologies, ICECIT-2015.
[18] S.Vijaya Kumar and C.Nagaraju,” A Fast Adaptive
Fuzzy Un Symmetric Trimmed Mean Filter For
Removal Of Impulse Noise From Digital Images”
Proceedings of International Conference on
Computing and Communication System I3CS,2016.