futures trader pack - tradestation.tradingappstore.com · stock, futures, and options trading...
TRANSCRIPT


Futures Trader Pack (Version 8 – 02-11-19 – by Michael Burke)
Version Requirements: Sample Workspace requires TradeStation 9.5 Update 27 or later. Workspace and tools are also compatible with TradeStation 10.
Important Disclosures All support, education, and training services and materials on the TradeStation website are for informational purposes only, and presented in order to help customers learn more about, and how to use, the power of TradeStation’s software and services. All of the symbols used are for demonstration purposes and not recommendations. No type of trading or investment advice is being made, given, or in any manner provided by any TradeStation instructor or affiliate. Stock, futures, and options trading carries a high degree of risk and may not be suitable for some traders. This material may also discuss in detail how TradeStation is designed to help you develop, test and implement trading strategies. However, TradeStation does not provide or suggest trading strategies. We offer you unique tools to help you design your own strategies and look at how they could have performed in the past. While we believe this is very valuable information, we caution you that simulated past performance of a trading strategy is no guarantee of its future performance or success. We also do not recommend or solicit the purchase or sale of any particular securities or derivative products. Any symbols referenced are used only for the purposes of the demonstration, as an example – not a recommendation. Finally, this material may discuss automated electronic order placement and execution. Please note that even though TradeStation has been designed to automate your trading strategies and deliver timely order placement, routing and execution, these things, as well as access to the system itself, may at times be delayed or even fail due to market volatility, quote delays, system and software errors, Internet traffic, outages and other factors. Notice: Futures contract specification information is subject to change with little or no notice – be sure that you are fully aware of and understand the futures contract specification information for any instrument that you trade. Information provided by any EasyLanguage® tools and indicators may be out of date or inaccurate based on the available data or version date of the EasyLanguage code.
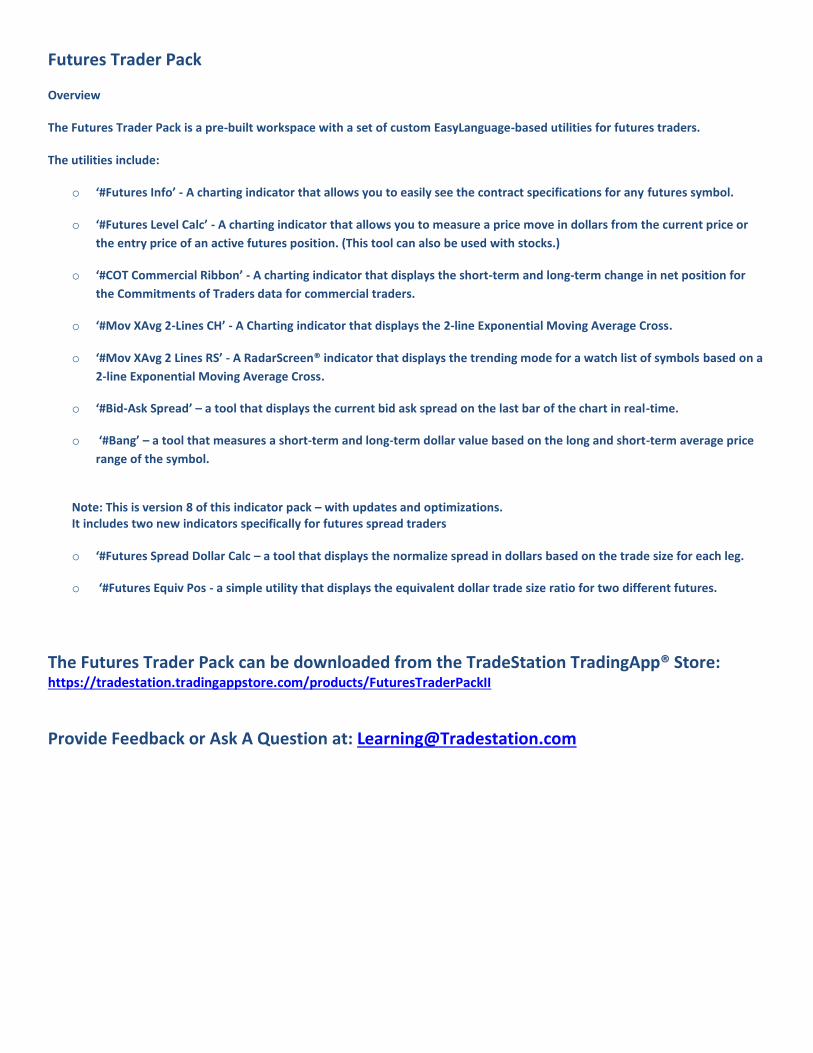
Futures Trader Pack
Overview The Futures Trader Pack is a pre-built workspace with a set of custom EasyLanguage-based utilities for futures traders. The utilities include:
o ‘#Futures Info’ - A charting indicator that allows you to easily see the contract specifications for any futures symbol.
o ‘#Futures Level Calc’ - A charting indicator that allows you to measure a price move in dollars from the current price or
the entry price of an active futures position. (This tool can also be used with stocks.)
o ‘#COT Commercial Ribbon’ - A charting indicator that displays the short-term and long-term change in net position for
the Commitments of Traders data for commercial traders.
o ‘#Mov XAvg 2-Lines CH’ - A Charting indicator that displays the 2-line Exponential Moving Average Cross.
o ‘#Mov XAvg 2 Lines RS’ - A RadarScreen® indicator that displays the trending mode for a watch list of symbols based on a
2-line Exponential Moving Average Cross.
o ‘#Bid-Ask Spread’ – a tool that displays the current bid ask spread on the last bar of the chart in real-time.
o ‘#Bang’ – a tool that measures a short-term and long-term dollar value based on the long and short-term average price
range of the symbol.
Note: This is version 8 of this indicator pack – with updates and optimizations. It includes two new indicators specifically for futures spread traders o ‘#Futures Spread Dollar Calc – a tool that displays the normalize spread in dollars based on the trade size for each leg.
o ‘#Futures Equiv Pos - a simple utility that displays the equivalent dollar trade size ratio for two different futures.
The Futures Trader Pack can be downloaded from the TradeStation TradingApp® Store: https://tradestation.tradingappstore.com/products/FuturesTraderPackII
Provide Feedback or Ask A Question at: [email protected]
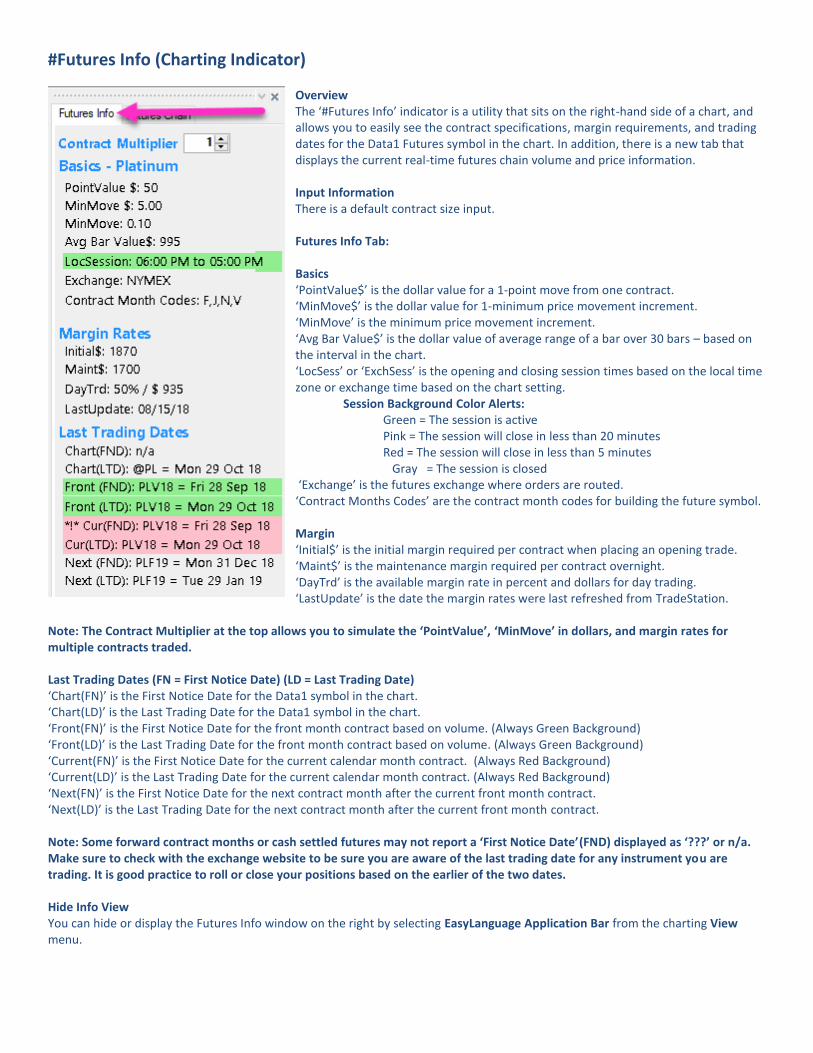
#Futures Info (Charting Indicator)
Overview The ‘#Futures Info’ indicator is a utility that sits on the right-hand side of a chart, and allows you to easily see the contract specifications, margin requirements, and trading dates for the Data1 Futures symbol in the chart. In addition, there is a new tab that displays the current real-time futures chain volume and price information. Input Information There is a default contract size input. Futures Info Tab: Basics ‘PointValue$’ is the dollar value for a 1-point move from one contract. ‘MinMove$’ is the dollar value for 1-minimum price movement increment. ‘MinMove’ is the minimum price movement increment. ‘Avg Bar Value$’ is the dollar value of average range of a bar over 30 bars – based on the interval in the chart. ‘LocSess’ or ‘ExchSess’ is the opening and closing session times based on the local time zone or exchange time based on the chart setting.
Session Background Color Alerts: Green = The session is active Pink = The session will close in less than 20 minutes Red = The session will close in less than 5 minutes
Gray = The session is closed ‘Exchange’ is the futures exchange where orders are routed. ‘Contract Months Codes’ are the contract month codes for building the future symbol. Margin ‘Initial$’ is the initial margin required per contract when placing an opening trade. ‘Maint$’ is the maintenance margin required per contract overnight. ‘DayTrd’ is the available margin rate in percent and dollars for day trading. ‘LastUpdate’ is the date the margin rates were last refreshed from TradeStation.
Note: The Contract Multiplier at the top allows you to simulate the ‘PointValue’, ‘MinMove’ in dollars, and margin rates for multiple contracts traded. Last Trading Dates (FN = First Notice Date) (LD = Last Trading Date) ‘Chart(FN)’ is the First Notice Date for the Data1 symbol in the chart. ‘Chart(LD)’ is the Last Trading Date for the Data1 symbol in the chart. ‘Front(FN)’ is the First Notice Date for the front month contract based on volume. (Always Green Background) ‘Front(LD)’ is the Last Trading Date for the front month contract based on volume. (Always Green Background) ‘Current(FN)’ is the First Notice Date for the current calendar month contract. (Always Red Background) ‘Current(LD)’ is the Last Trading Date for the current calendar month contract. (Always Red Background) ‘Next(FN)’ is the First Notice Date for the next contract month after the current front month contract. ‘Next(LD)’ is the Last Trading Date for the next contract month after the current front month contract. Note: Some forward contract months or cash settled futures may not report a ‘First Notice Date’(FND) displayed as ‘???’ or n/a. Make sure to check with the exchange website to be sure you are aware of the last trading date for any instrument you are trading. It is good practice to roll or close your positions based on the earlier of the two dates. Hide Info View You can hide or display the Futures Info window on the right by selecting EasyLanguage Application Bar from the charting View menu.
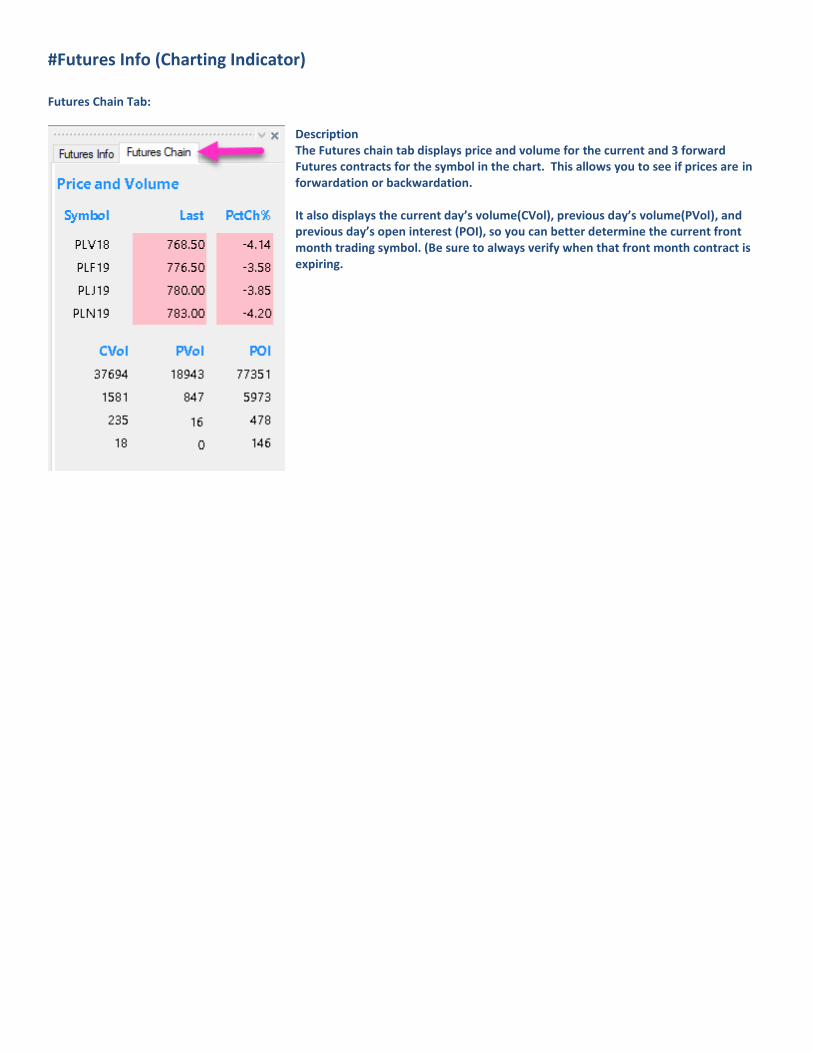
#Futures Info (Charting Indicator) Futures Chain Tab:
Description The Futures chain tab displays price and volume for the current and 3 forward Futures contracts for the symbol in the chart. This allows you to see if prices are in forwardation or backwardation. It also displays the current day’s volume(CVol), previous day’s volume(PVol), and previous day’s open interest (POI), so you can better determine the current front month trading symbol. (Be sure to always verify when that front month contract is expiring.
#Futures Levels Calc (Charting Indicator)
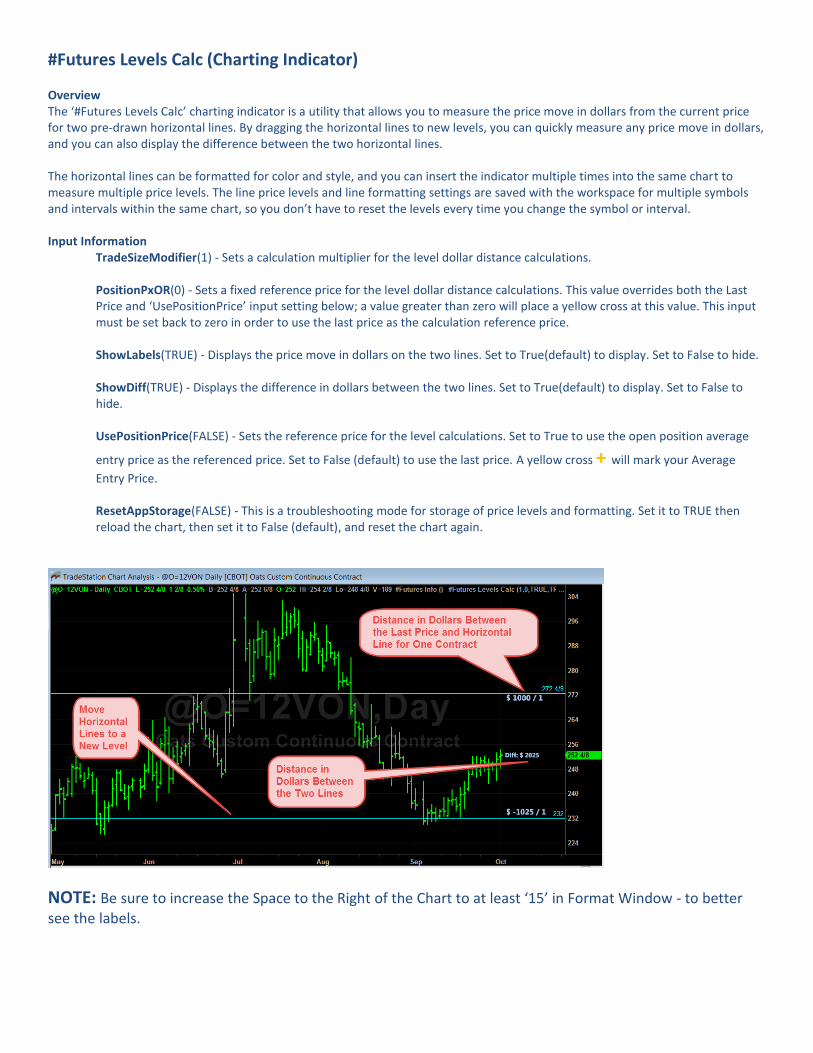
Overview The ‘#Futures Levels Calc’ charting indicator is a utility that allows you to measure the price move in dollars from the current price for two pre-drawn horizontal lines. By dragging the horizontal lines to new levels, you can quickly measure any price move in dollars, and you can also display the difference between the two horizontal lines. The horizontal lines can be formatted for color and style, and you can insert the indicator multiple times into the same chart to measure multiple price levels. The line price levels and line formatting settings are saved with the workspace for multiple symbols and intervals within the same chart, so you don’t have to reset the levels every time you change the symbol or interval. Input Information
TradeSizeModifier(1) - Sets a calculation multiplier for the level dollar distance calculations. PositionPxOR(0) - Sets a fixed reference price for the level dollar distance calculations. This value overrides both the Last Price and ‘UsePositionPrice’ input setting below; a value greater than zero will place a yellow cross at this value. This input must be set back to zero in order to use the last price as the calculation reference price. ShowLabels(TRUE) - Displays the price move in dollars on the two lines. Set to True(default) to display. Set to False to hide. ShowDiff(TRUE) - Displays the difference in dollars between the two lines. Set to True(default) to display. Set to False to hide. UsePositionPrice(FALSE) - Sets the reference price for the level calculations. Set to True to use the open position average
entry price as the referenced price. Set to False (default) to use the last price. A yellow cross + will mark your Average
Entry Price. ResetAppStorage(FALSE) - This is a troubleshooting mode for storage of price levels and formatting. Set it to TRUE then reload the chart, then set it to False (default), and reset the chart again.
NOTE: Be sure to increase the Space to the Right of the Chart to at least ‘15’ in Format Window - to better
see the labels.
#COT Comml Ribbon (Charting Indicator)
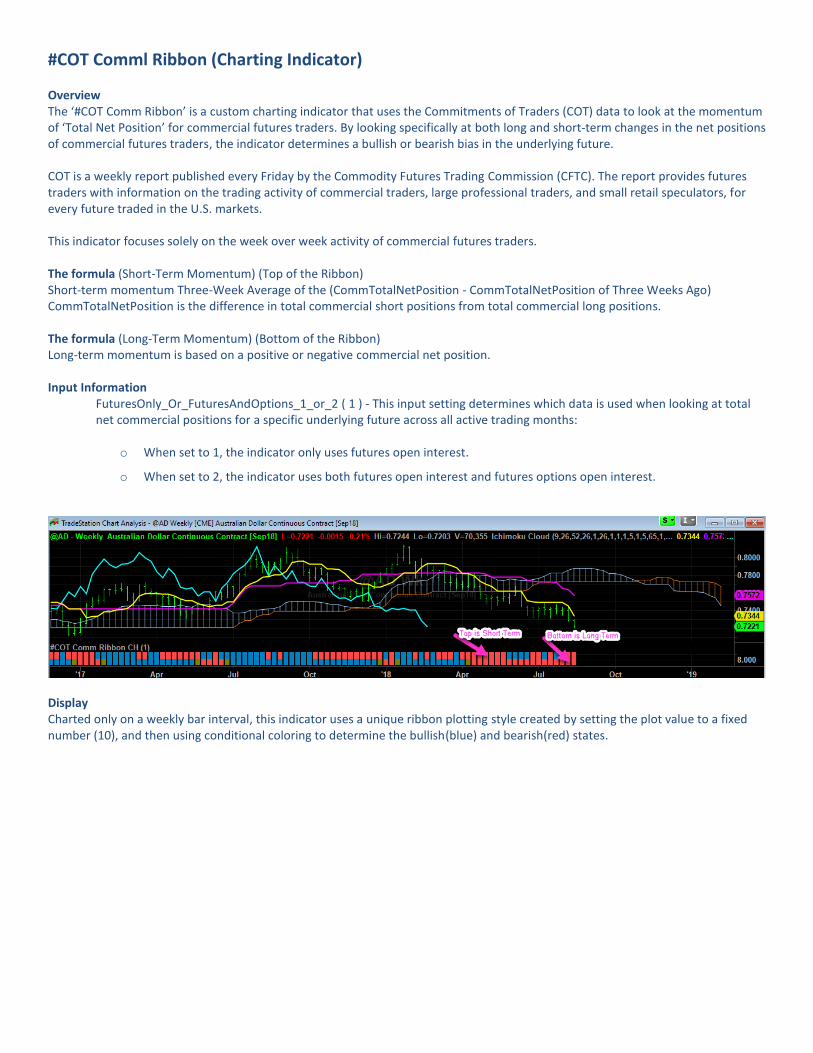
Overview The ‘#COT Comm Ribbon’ is a custom charting indicator that uses the Commitments of Traders (COT) data to look at the momentum of ‘Total Net Position’ for commercial futures traders. By looking specifically at both long and short-term changes in the net positions of commercial futures traders, the indicator determines a bullish or bearish bias in the underlying future. COT is a weekly report published every Friday by the Commodity Futures Trading Commission (CFTC). The report provides futures traders with information on the trading activity of commercial traders, large professional traders, and small retail speculators, for every future traded in the U.S. markets. This indicator focuses solely on the week over week activity of commercial futures traders. The formula (Short-Term Momentum) (Top of the Ribbon) Short-term momentum Three-Week Average of the (CommTotalNetPosition - CommTotalNetPosition of Three Weeks Ago) CommTotalNetPosition is the difference in total commercial short positions from total commercial long positions. The formula (Long-Term Momentum) (Bottom of the Ribbon) Long-term momentum is based on a positive or negative commercial net position. Input Information
FuturesOnly_Or_FuturesAndOptions_1_or_2 ( 1 ) - This input setting determines which data is used when looking at total net commercial positions for a specific underlying future across all active trading months:
o When set to 1, the indicator only uses futures open interest.
o When set to 2, the indicator uses both futures open interest and futures options open interest.
Display Charted only on a weekly bar interval, this indicator uses a unique ribbon plotting style created by setting the plot value to a fixed number (10), and then using conditional coloring to determine the bullish(blue) and bearish(red) states.

#Mov XAvg 2 Lines RS (RadarScreen Indicator)
Overview The ‘#Mov XAvg 2 Lines RS’ is a RadarScreen indicator that takes the standard two-line exponential moving average concept that you would normally use in a chart and turns it into a scanning opportunity in RadarScreen for a list of futures symbols at any bar interval. When the Fast Moving XAverage is above the Slow Moving XAverage, the trend bias is Bullish, and when the fast moving average is below the slow moving average, the trend bias is Bearish. When the Fast Moving Average crosses above the Slow Moving Average, there is a new bullish alert, and when the Fast Moving Average crosses below the Slow Moving Average, there is a new bearish alert. You can visualize the moving average concept by simply adding the standard ‘Mov XAvg 2 Line’ indicator into a chart.
The indicator has three columns:
• The ‘Signal’ column displays the market
mode, either bullish or bearish depending on the
fast and slow average orientation.
• The ‘Alert’ column displays a ‘New Bullish
Trade’ or ‘New Bearish Trade’ alert whenever the
fast and slow moving average cross.
• The ‘Bars Ago column displays the number
of bars since the last trade alert. Sorting on the
column allows you to find the most recent alerts
you may have missed.
Input Information: FastPrice(Close) - Value to be used in calculating the "fast" moving average. SlowPrice(Close) - Value to be used in calculating the "slow" moving average. FastLength(20) - Number of bars to include in calculating the "fast" average. SlowLength(50) - Number of bars to include in calculating the "slow" average. MA_Up_Color(Cyan) - Color to be used to plot bullish values. MA_Dn_Color(Red) - Color to be used to plot bearish values. BackgroundColorAlertCell(DarkBrown) - Color to be used to plot alerts.
#BidAsk Spread (RadarScreen Indicator)
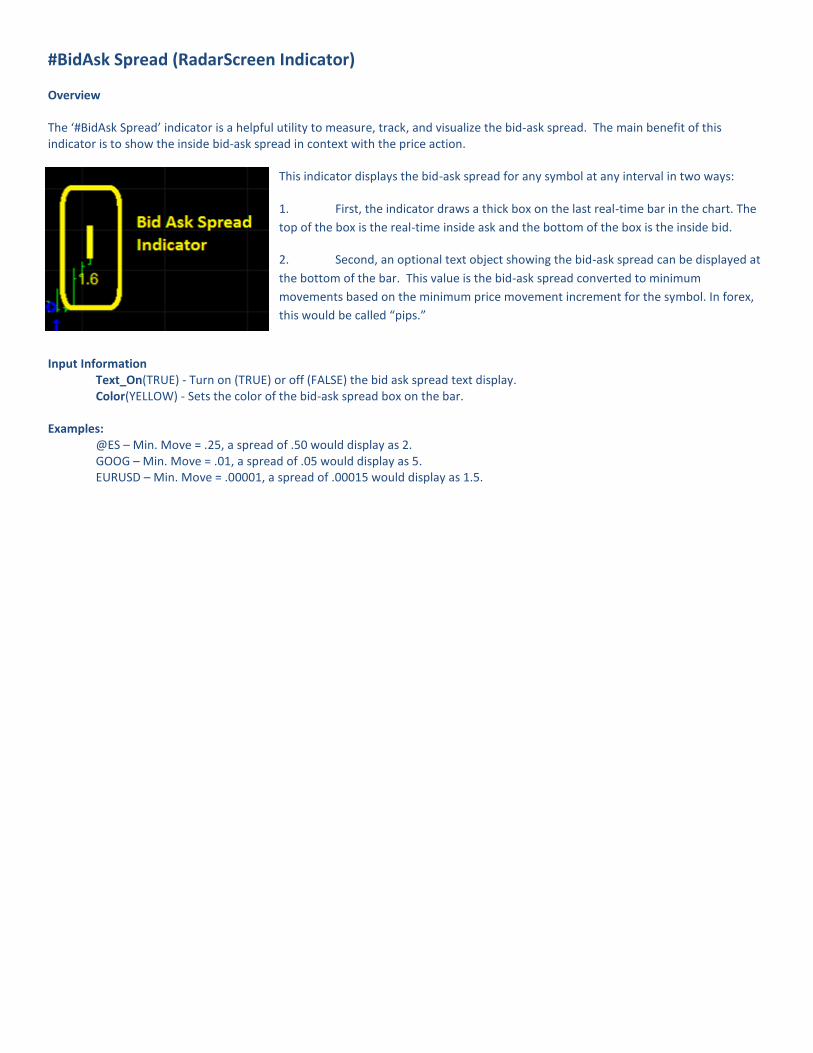
Overview The ‘#BidAsk Spread’ indicator is a helpful utility to measure, track, and visualize the bid-ask spread. The main benefit of this indicator is to show the inside bid-ask spread in context with the price action.
This indicator displays the bid-ask spread for any symbol at any interval in two ways: 1. First, the indicator draws a thick box on the last real-time bar in the chart. The
top of the box is the real-time inside ask and the bottom of the box is the inside bid.
2. Second, an optional text object showing the bid-ask spread can be displayed at
the bottom of the bar. This value is the bid-ask spread converted to minimum
movements based on the minimum price movement increment for the symbol. In forex,
this would be called “pips.”
Input Information Text_On(TRUE) - Turn on (TRUE) or off (FALSE) the bid ask spread text display.
Color(YELLOW) - Sets the color of the bid-ask spread box on the bar. Examples:
@ES – Min. Move = .25, a spread of .50 would display as 2. GOOG – Min. Move = .01, a spread of .05 would display as 5. EURUSD – Min. Move = .00001, a spread of .00015 would display as 1.5.

#Bang (RadarScreen Indicator)
Overview The ‘#Bang’ is a RadarScreen indicator that measures the short-term and long-term dollar value based on the long and short-term average price range of the symbol. Columns: There are two columns ‘3-BarRange’ looks at the most recent 3-bar price channel to help determine the potential dollar value of a similar price movement over the next few bars, based on the bar interval in the chart. ‘AvgBar$’ looks at a 30 bar Average True Range to help determine an average dollar value of a bar based on the bar interval in the chart.
#Futures Spread Dollar Calc (Charting Indicator)
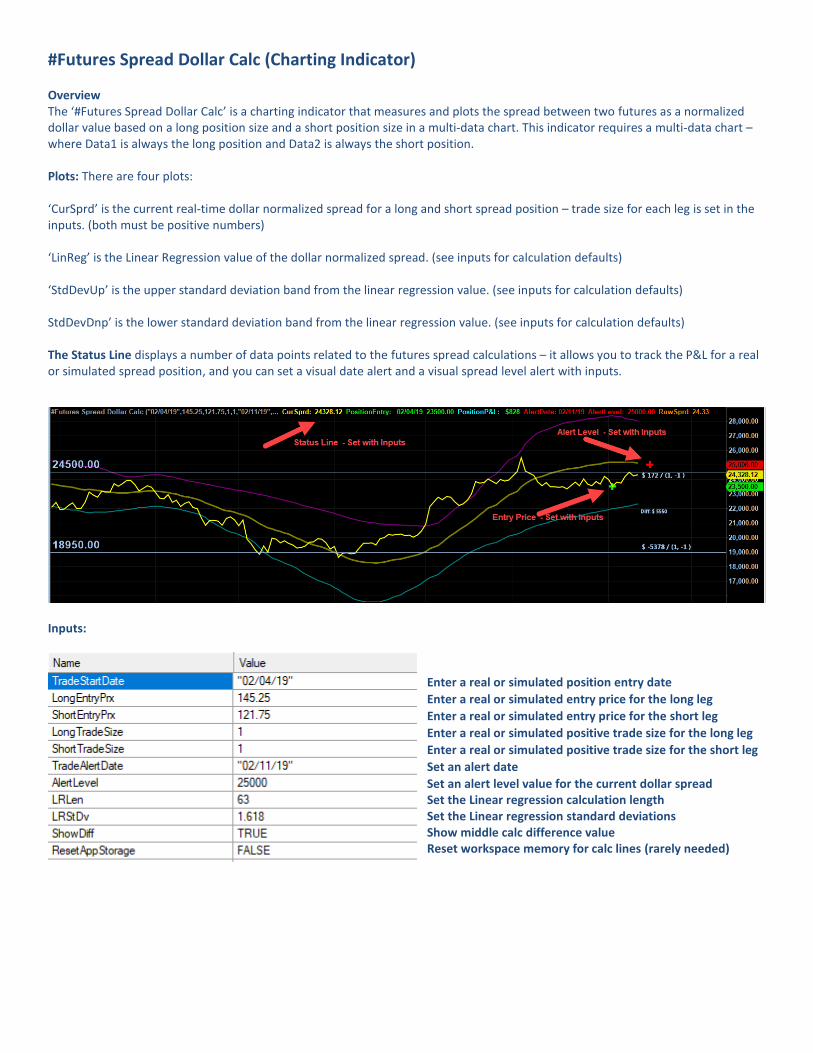
Overview The ‘#Futures Spread Dollar Calc’ is a charting indicator that measures and plots the spread between two futures as a normalized dollar value based on a long position size and a short position size in a multi-data chart. This indicator requires a multi-data chart – where Data1 is always the long position and Data2 is always the short position. Plots: There are four plots: ‘CurSprd’ is the current real-time dollar normalized spread for a long and short spread position – trade size for each leg is set in the inputs. (both must be positive numbers) ‘LinReg’ is the Linear Regression value of the dollar normalized spread. (see inputs for calculation defaults) ‘StdDevUp’ is the upper standard deviation band from the linear regression value. (see inputs for calculation defaults) StdDevDnp’ is the lower standard deviation band from the linear regression value. (see inputs for calculation defaults) The Status Line displays a number of data points related to the futures spread calculations – it allows you to track the P&L for a real or simulated spread position, and you can set a visual date alert and a visual spread level alert with inputs.
Inputs:
Enter a real or simulated position entry date
Enter a real or simulated entry price for the long leg
Enter a real or simulated entry price for the short leg
Enter a real or simulated positive trade size for the long leg
Enter a real or simulated positive trade size for the short leg
Set an alert date
Set an alert level value for the current dollar spread Set the Linear regression calculation length Set the Linear regression standard deviations Show middle calc difference value Reset workspace memory for calc lines (rarely needed)

#Futures Equiv Pos (Charting Indicator)
Overview The ‘#Futures Equiv Pos’ is a charting indicator that measures the approximate trade sizing for each leg of a spread where the spread is made up of two different futures, (e.g. US 30yr Bond & 10yr Treasury Notes). This indicator requires a multi-data chart – where Data1 is always the long position and Data2 is always the short position. The indicator will report which data stream needs to be adjusted and the adjustment amount, while the other data stream will trade the default base trade size – set with an input. Plots: There are no plots - only a status line display.
Inputs:
Base Trade Size – Sets the base trade size. Note: It is sometimes not practical to trade the exact ratio defined by this indicator – along with other factors - like different volatilities – and may cause a spread position to under to over perform what the trader is expecting.
Launching the Futures Trader Pack: First subscribe and download the Futures Trader Pack from the TradeStation TradingApp Store:
https://tradestation.tradingappstore.com/products/FuturesTraderPackII Once you have subscribed and downloaded the Futures Pack from the AppStore into your TradeStation platform, you can launch it from the TradingApp Store Update button in your app launcher. You may need to restart your computer after the download.
Handy Links:
Futures Knowledge Center https://www.tradestation.com/university/knowledge-center/futures/