futures definition futures (forward) contracts are agreements betweentwo agents where one agrees to...
TRANSCRIPT
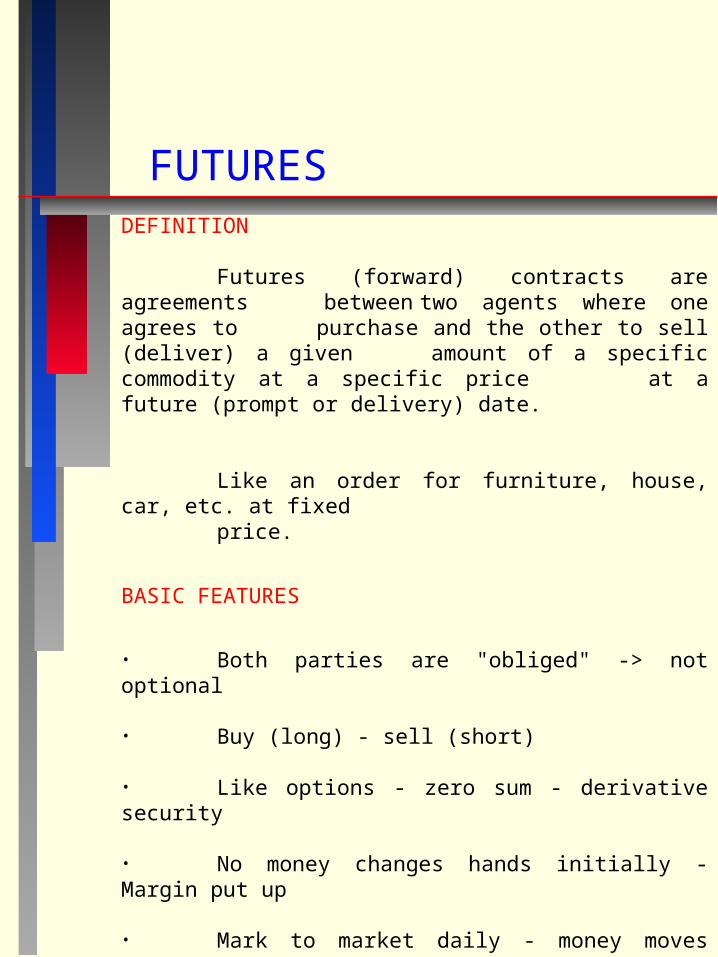
FUTURESDEFINITION
Futures (forward) contracts are agreements between two agents where one agrees to purchase and the other to sell (deliver) a given amount of a specific commodity at a specific price at a future (prompt or delivery) date.
Like an order for furniture, house, car, etc. at fixedprice.
BASIC FEATURES
• Both parties are "obliged" -> not optional
• Buy (long) - sell (short)
• Like options - zero sum - derivative security
• No money changes hands initially - Margin put up
• Mark to market daily - money moves betweenmargin accounts
• Delivery is seldom taken - only 2% (like options)
• 70% of traders lose money - some win big (Hillary).
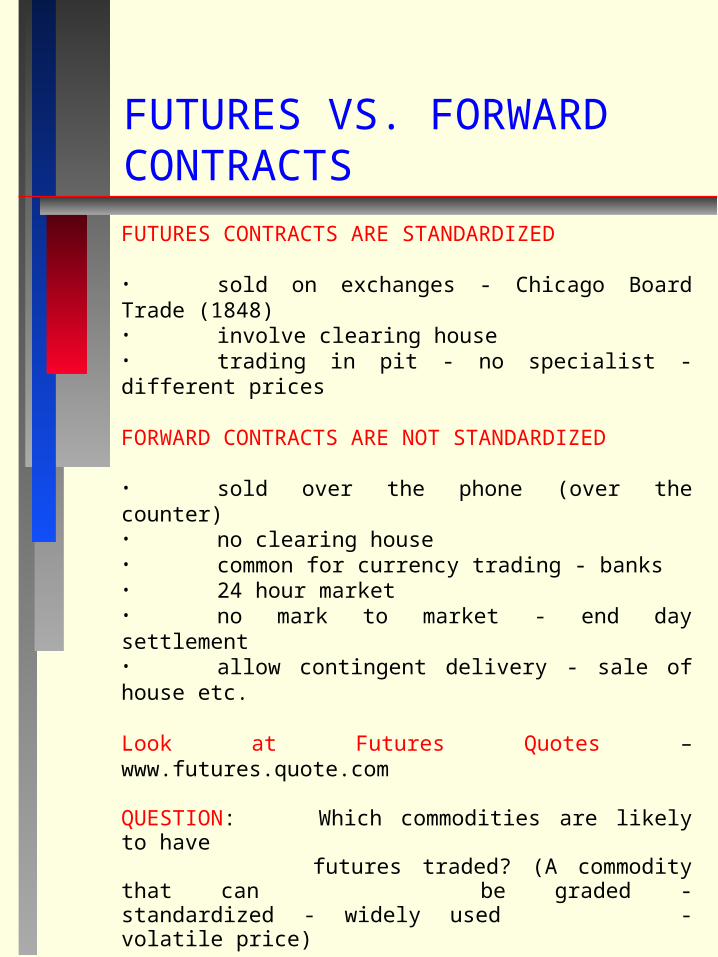
FUTURES VS. FORWARD CONTRACTS
FUTURES CONTRACTS ARE STANDARDIZED
• sold on exchanges - Chicago Board Trade (1848)• involve clearing house• trading in pit - no specialist - different prices
FORWARD CONTRACTS ARE NOT STANDARDIZED
• sold over the phone (over the counter)• no clearing house• common for currency trading - banks• 24 hour market• no mark to market - end day settlement• allow contingent delivery - sale of house etc.
Look at Futures Quotes – www.futures.quote.com
QUESTION: Which commodities are likely to havefutures traded? (A commodity that can be graded - standardized - widely used - volatile price)
HOW USED - HELPS BUSINESSES PLAN
• hedging - farmer - short hedge -grain processor - • long hedge• speculating - traders• virtual company - trade crude against gas to earn
change in refiner profit
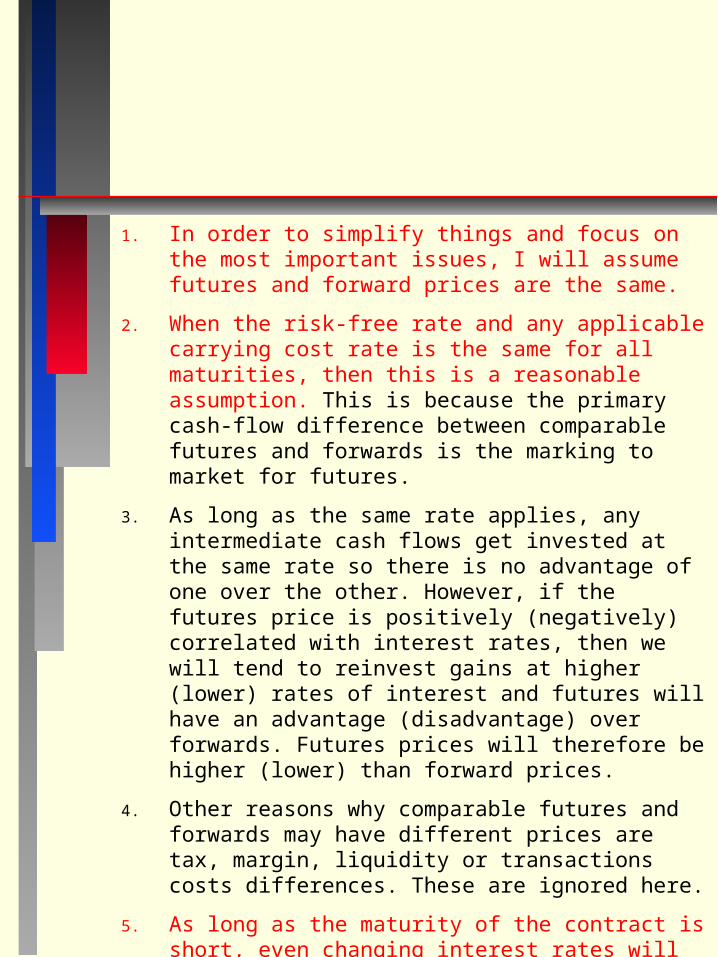
1. In order to simplify things and focus on the most important issues, I will assume futures and forward prices are the same.
2. When the risk-free rate and any applicable carrying cost rate is the same for all maturities, then this is a reasonable assumption. This is because the primary cash-flow difference between comparable futures and forwards is the marking to market for futures.
3. As long as the same rate applies, any intermediate cash flows get invested at the same rate so there is no advantage of one over the other. However, if the futures price is positively (negatively) correlated with interest rates, then we will tend to reinvest gains at higher (lower) rates of interest and futures will have an advantage (disadvantage) over forwards. Futures prices will therefore be higher (lower) than forward prices.
4. Other reasons why comparable futures and forwards may have different prices are tax, margin, liquidity or transactions costs differences. These are ignored here.
5. As long as the maturity of the contract is short, even changing interest rates will have little effect on futures versus forward prices.
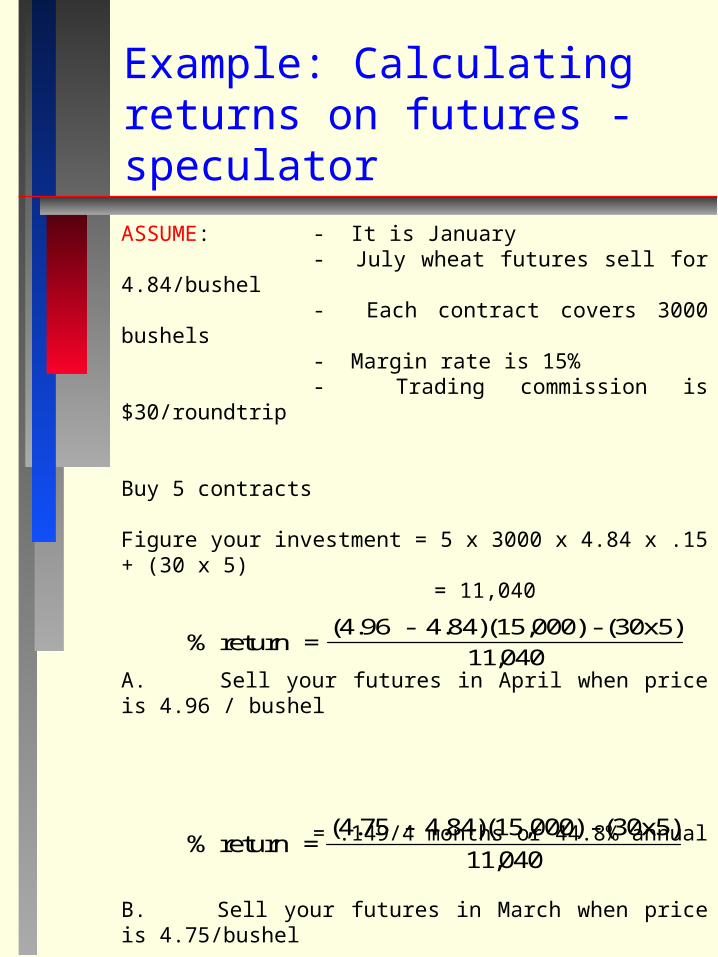
Example: Calculating returns on futures -speculator
ASSUME: - It is January- July wheat futures sell for 4.84/bushel- Each contract covers 3000 bushels- Margin rate is 15%- Trading commission is $30/roundtrip
Buy 5 contracts
Figure your investment = 5 x 3000 x 4.84 x .15 + (30 x 5) = 11,040
A. Sell your futures in April when price is 4.96 / bushel
= .149/4 months or 44.8% annual
B. Sell your futures in March when price is 4.75/bushel
= -.136/3 months or -54.3% annual
% return =(4.96 - 4.84)(15,000) - (30x5)
11 040,
% return =(4.75 - 4.84)(15,000) - (30x5)
11 040,
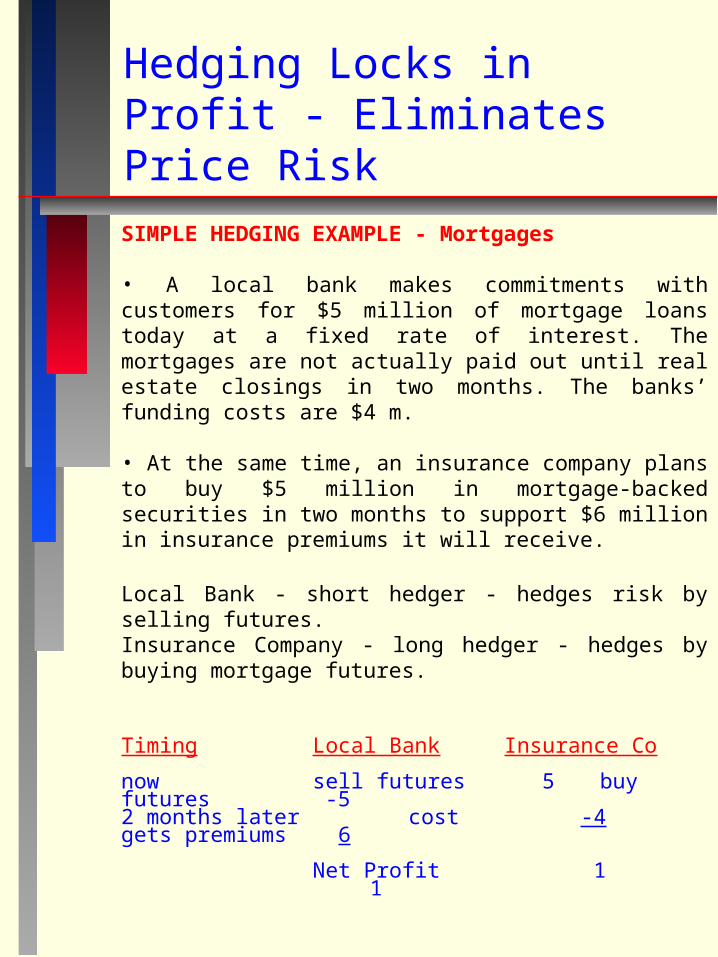
Hedging Locks in Profit - Eliminates Price Risk
SIMPLE HEDGING EXAMPLE - Mortgages
• A local bank makes commitments with customers for $5 million of mortgage loans today at a fixed rate of interest. The mortgages are not actually paid out until real estate closings in two months. The banks’ funding costs are $4 m.
• At the same time, an insurance company plans to buy $5 million in mortgage-backed securities in two months to support $6 million in insurance premiums it will receive.
Local Bank - short hedger - hedges risk by selling futures.Insurance Company - long hedger - hedges by buying mortgage futures.
Timing Local Bank Insurance Co
now sell futures 5 buy futures -52 months later cost -4 gets premiums 6
Net Profit 1 1
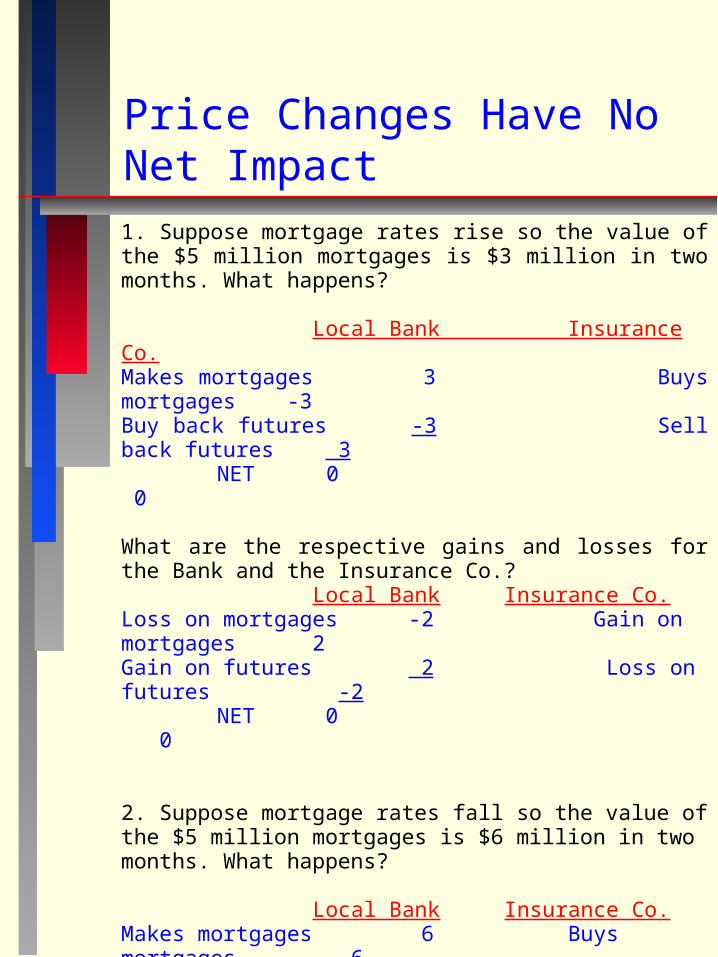
Price Changes Have No Net Impact1. Suppose mortgage rates rise so the value of the $5 million mortgages is $3 million in two months. What happens?
Local Bank Insurance Co.Makes mortgages 3 Buys mortgages -3Buy back futures -3 Sell back futures 3
NET 0 0
What are the respective gains and losses for the Bank and the Insurance Co.?
Local Bank Insurance Co.Loss on mortgages -2 Gain on mortgages 2Gain on futures 2 Loss on futures -2
NET 0 0
2. Suppose mortgage rates fall so the value of the $5 million mortgages is $6 million in two months. What happens?
Local Bank Insurance Co.Makes mortgages 6 Buys mortgages -6Buy back futures -6 Sell back futures 6
NET 0 0
What are the respective gains and losses for the Bank and the Insurance Co.?
Local Bank Insurance Co.Gain on mortgages 1 Loss on mortgages -1Loss on futures -1 Gain on futures 1
NET 0 0
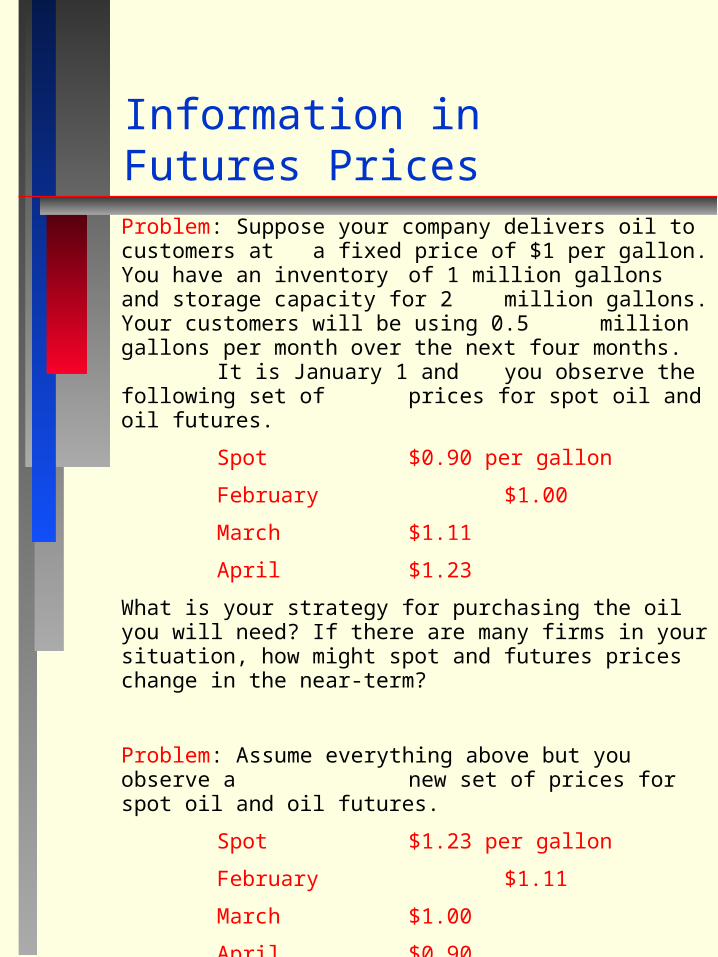
Information in Futures PricesProblem: Suppose your company delivers oil to customers at
a fixed price of $1 per gallon. You have an inventory of 1 million gallons and storage capacity for 2
million gallons. Your customers will be using 0.5 million gallons per month over the next four months. It is January 1 and you observe the following set of prices for spot oil and oil futures.
Spot $0.90 per gallon
February $1.00
March $1.11
April $1.23
What is your strategy for purchasing the oil you will need? If there are many firms in your situation, how might spot and futures prices change in the near-term?
Problem: Assume everything above but you observe a new set of prices for spot oil and oil futures.
Spot $1.23 per gallon
February $1.11
March $1.00
April $0.90
What is your strategy for purchasing the oil you will need? If there are many firms in your situation, how might spot and futures prices change in the near-term?
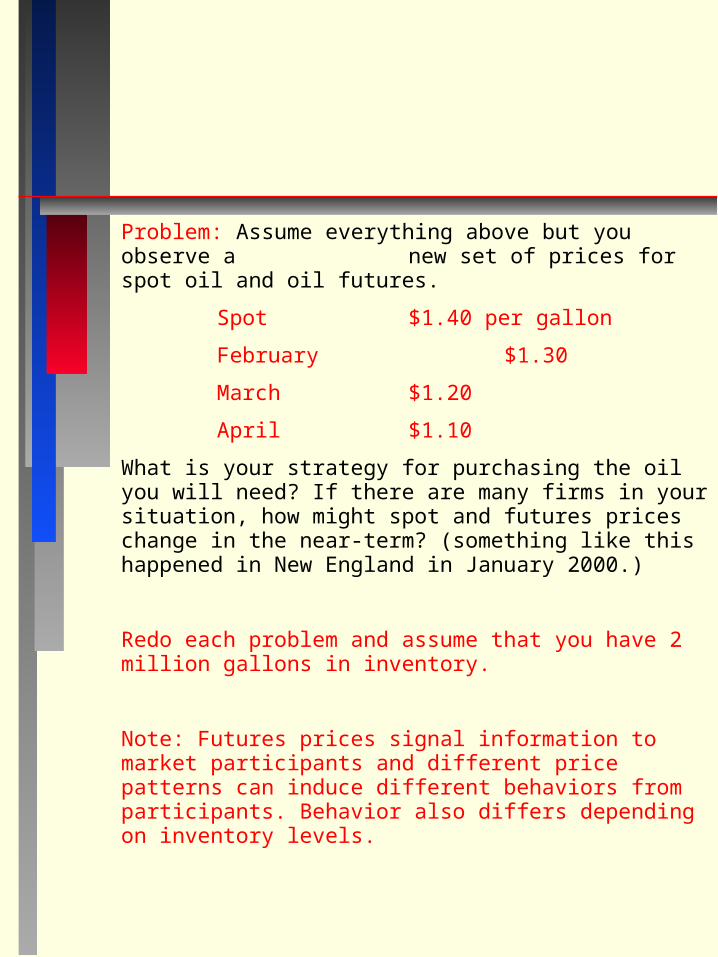
Problem: Assume everything above but you observe a new set of prices for spot oil and oil futures.
Spot $1.40 per gallon
February $1.30
March $1.20
April $1.10
What is your strategy for purchasing the oil you will need? If there are many firms in your situation, how might spot and futures prices change in the near-term? (something like this happened in New England in January 2000.)
Redo each problem and assume that you have 2 million gallons in inventory.
Note: Futures prices signal information to market participants and different price patterns can induce different behaviors from participants. Behavior also differs depending on inventory levels.
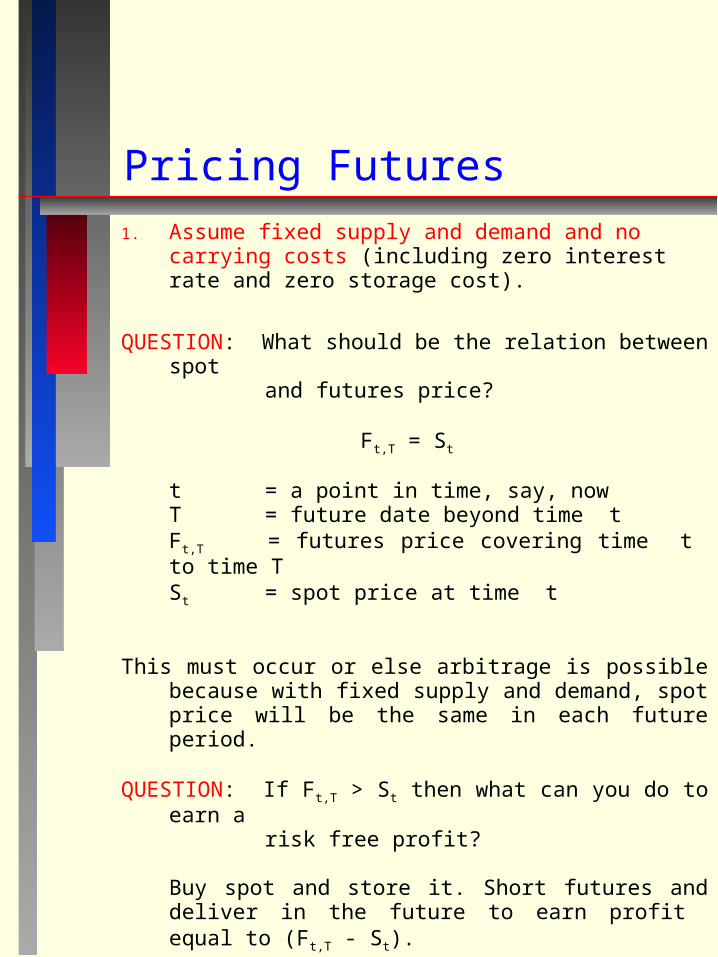
Pricing Futures1. Assume fixed supply and demand and no carrying costs
(including zero interest rate and zero storage cost).
QUESTION: What should be the relation between spot and futures price?
Ft,T = St
t = a point in time, say, nowT = future date beyond time tFt,T = futures price covering time t to time TSt = spot price at time t
This must occur or else arbitrage is possible because with fixed supply and demand, spot price will be the same in each future period.
QUESTION: If Ft,T > St then what can you do to earn arisk free profit?
Buy spot and store it. Short futures and deliver in the future to earn profit equal to (Ft,T - St).
QUESTION: If Ft,T < St then how can you profit at no risk?
Sell spot now, out of inventories or sell short and simultaneously buy a futures contract - take deliveryin the future at low price and cover the short.
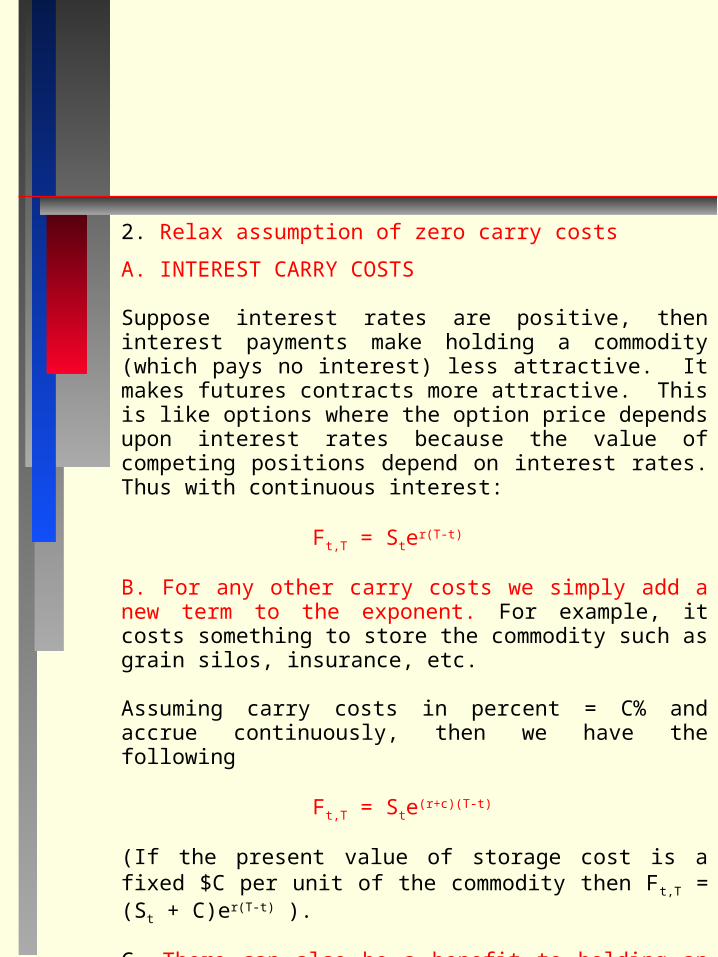
2. Relax assumption of zero carry costs
A. INTEREST CARRY COSTS
Suppose interest rates are positive, then interest payments make holding a commodity (which pays no interest) less attractive. It makes futures contracts more attractive. This is like options where the option price depends upon interest rates because the value of competing positions depend on interest rates. Thus with continuous interest:
Ft,T = Ster(T-t)
B. For any other carry costs we simply add a new term to the exponent. For example, it costs something to store the commodity such as grain silos, insurance, etc.
Assuming carry costs in percent = C% and accrue continuously, then we have the following
Ft,T = Ste(r+c)(T-t)
(If the present value of storage cost is a fixed $C per unit of the commodity then Ft,T = (St + C)er(T-t) ).
C. There can also be a benefit to holding an asset or commodity called a “convenience yield” (Y%) (e.g., dividend, coupon payment, stock-out costs avoided) so that
Ft,T = Ste(r+c-Y)(T-t)
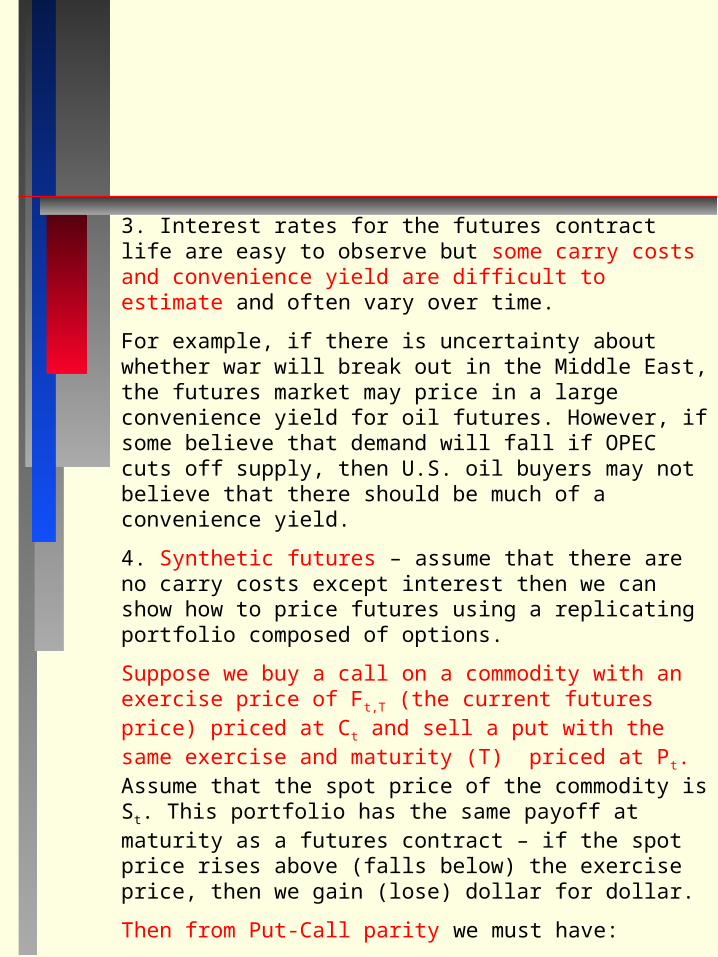
3. Interest rates for the futures contract life are easy to observe but some carry costs and convenience yield are difficult to estimate and often vary over time.
For example, if there is uncertainty about whether war will break out in the Middle East, the futures market may price in a large convenience yield for oil futures. However, if some believe that demand will fall if OPEC cuts off supply, then U.S. oil buyers may not believe that there should be much of a convenience yield.
4. Synthetic futures – assume that there are no carry costs except interest then we can show how to price futures using a replicating portfolio composed of options.
Suppose we buy a call on a commodity with an exercise price of Ft,T (the current futures price) priced at Ct and sell a put with the same exercise and maturity (T) priced at Pt. Assume that the spot price of the commodity is St. This portfolio has the same payoff at maturity as a futures contract – if the spot price rises above (falls below) the exercise price, then we gain (lose) dollar for dollar.
Then from Put-Call parity we must have:
Ct – Pt = St - Ft,Te-r(T-t)
We know that the the futures contract price is set such that there is no initial investment (ignoring the margin), therefore,
Ct – Pt = St - Ft,Te-r(T-t) = 0
=> Ft,T = Ster(T-t) which is the correct pricing formula.
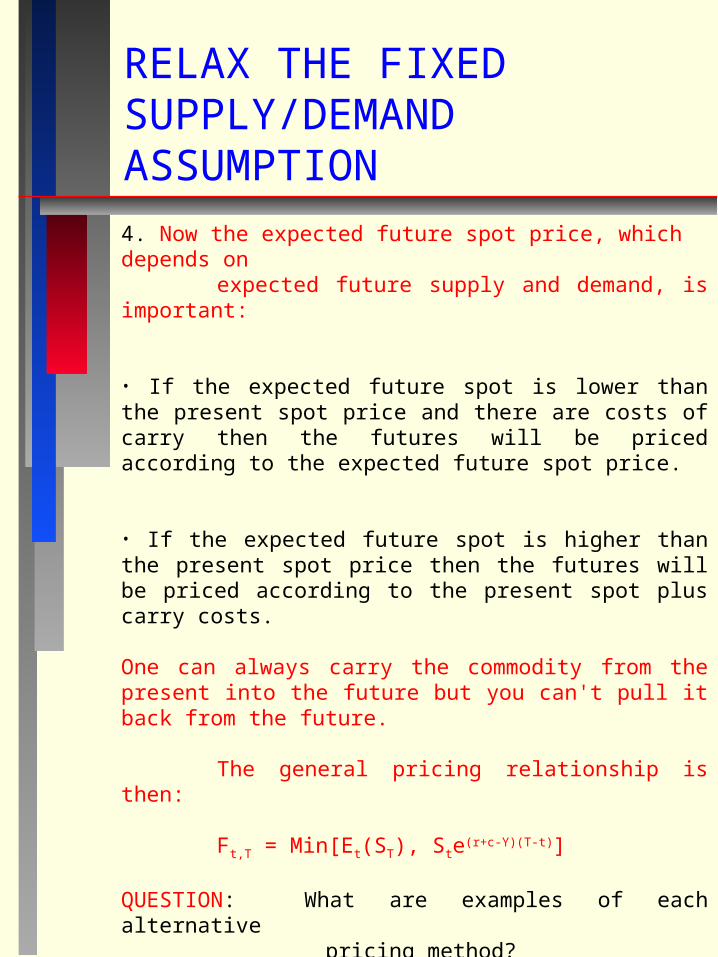
RELAX THE FIXED SUPPLY/DEMAND ASSUMPTION
4. Now the expected future spot price, which depends onexpected future supply and demand, is important:
• If the expected future spot is lower than the present spot price and there are costs of carry then the futures will be priced according to the expected future spot price.
• If the expected future spot is higher than the present spot price then the futures will be priced according to the present spot plus carry costs.
One can always carry the commodity from the present into the future but you can't pull it back from the future.
The general pricing relationship is then:
Ft,T = Min[Et(ST), Ste(r+c-Y)(T-t)]
QUESTION: What are examples of each alternative pricing method?
•Perishables - Strawberries, milk •Durables - Gold, Oil
Look at Quotes for seasonality, open int. – cmegroup.com or
future.quote.com
QUESTION: How should zero coupon T-bond futures be priced?
QUESTION: How should coupon T-bond futures be priced?
QUESTION: How should S&P 500 futures be priced?
NOTE: The futures price does not include the expected return of the S&P over the contract period. This is because, if you buy a contract you buy the systematic risk of the S&P and should be rewarded, that is:
Ft,T < Et(ST).
- the seller is selling the risk and the buyer buys it, so the buyer must be compensated by paying a low Ft,T now and expecting to receive a higher Et(ST) later.
The S&P 500 futures price is not set at Et(ST) because
Ste(r+c-Y)(T-t) < Et(ST)
ACCORDING TO THE FUTURES PRICING MECHANISM, WE GO WITH THE LOWER PRICE.
If the market expects an extra return in the S&P beyond its normal expected return required for its risk then both St and Ft,T will move up to discount the extra no-risk return and thus the relationship
Ft,T = Ste(r+c-Y)(T-t) still holds.
Another way to see that the futures price for risky assets such as the S&P 500 will be below the expected future spot price is to assume that the asset price grows at the asset’s expected return k, which exceeds the risk-free rate r. Assume there are no carry costs or dividends. A speculator who buys the futures contract on the asset and invests the present value of the futures price in the risk-free asset has the following cash flows
Time t: -Fe-r(T-t) put money in risk-free investment now which will be used to pay for the asset delivered on the futures contract.
Time T: ST pay future spot price on futures contract when futures mature at time T.
The expected net present value of this investment must be zero given that both investments are discounted at the appropriate rates
-Fe-r(T-t) + E[ST]e-k(T-t) = 0
Or
F = E[ST]e(r-k)(T-t)
Clearly, for any risky asset, k > r so that the futures price is always less than the expected future spot price E[ST]. Only if the asset is risk free will the futures price equal the expected future spot price.
Time Series Behavior of Futures PricesSamuelson (1965) showed that futures prices will fluctuate randomly over time and that the variance of futures prices may not be constant over time. He assumes that
St+1 = aSt + et , a < 1
This simple autoregressive model says that the spot price of the asset is expected to decline over time. Nevertheless, the variance of the expected spot price increases over time because the error terms can accumulate over time and leave the realized spot price far from its expected value.
Even though the spot price changes in a known way, the futures price (assumed to be the expected spot price at delivery) is not expected to change. It already reflects the expected spot changes over time defined by the model above.
At each point in time, we know what St is and with the model above we know what the expected future spot price is (say for 2 periods ahead we have a2E[St]). Past errors feed in to determine St but the past pattern of spot prices is irrelevant, only the present spot price is relevant. Futures price depends on it according to the model.
The variance of the futures price usually increases as a contract approaches maturity. This is because a futures contract for delivery far in the future will have a price very close to that determined from the model above. Even if we get a large positive (negative) error this period that makes St+1 much larger (smaller) than expected, it will likely be offset by opposite sign errors over the numerous future periods. Also, if “a” is small, then future spot price is likely to be small far in the future no matter what the error is in any near-term period.
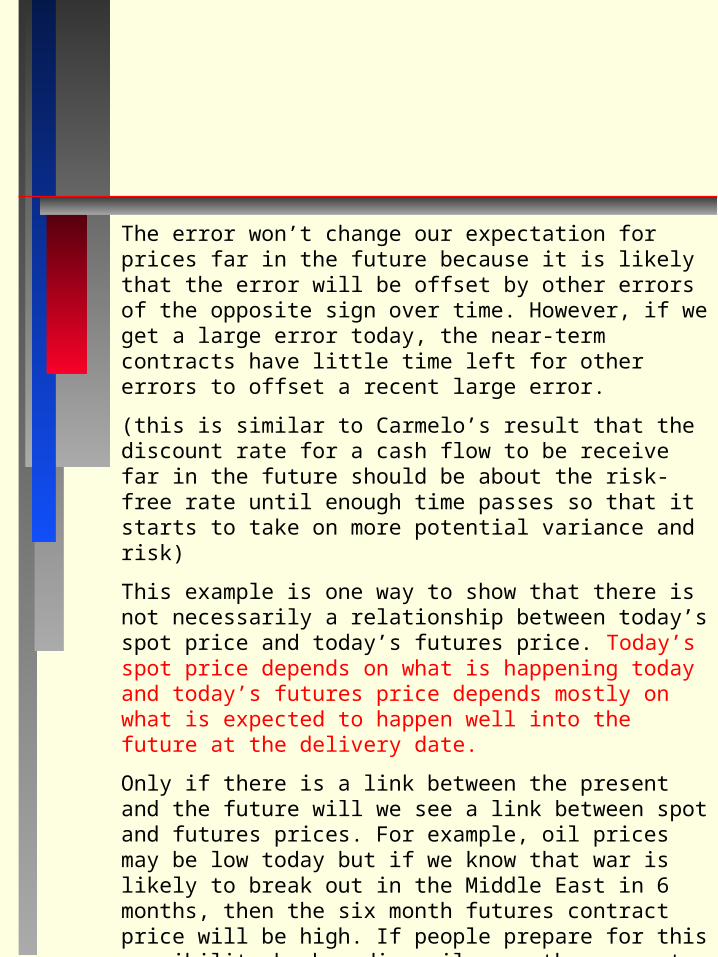
The error won’t change our expectation for prices far in the future because it is likely that the error will be offset by other errors of the opposite sign over time. However, if we get a large error today, the near-term contracts have little time left for other errors to offset a recent large error.
(this is similar to Carmelo’s result that the discount rate for a cash flow to be receive far in the future should be about the risk-free rate until enough time passes so that it starts to take on more potential variance and risk)
This example is one way to show that there is not necessarily a relationship between today’s spot price and today’s futures price. Today’s spot price depends on what is happening today and today’s futures price depends mostly on what is expected to happen well into the future at the delivery date.
Only if there is a link between the present and the future will we see a link between spot and futures prices. For example, oil prices may be low today but if we know that war is likely to break out in the Middle East in 6 months, then the six month futures contract price will be high. If people prepare for this possibility by hoarding oil now, the present spot price will also be high. If they don’t hoard, then spot prices may stay low.
See oil or gas prices for short and long contracts at cmegroup.com or futures.quote.com.
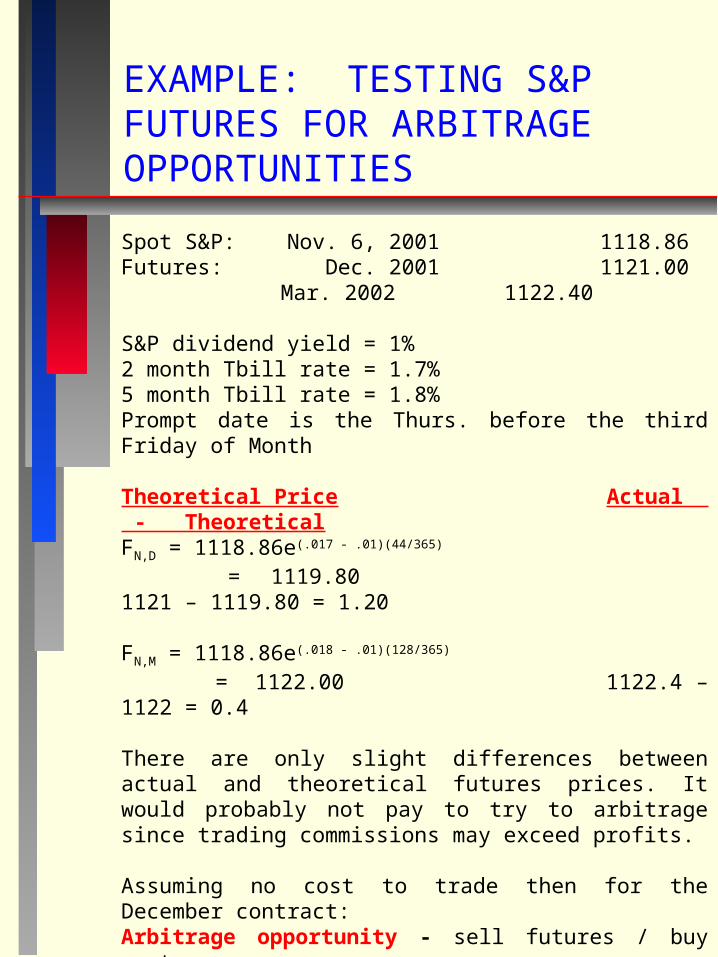
EXAMPLE: TESTING S&P FUTURES FOR ARBITRAGE OPPORTUNITIES
Spot S&P: Nov. 6, 2001 1118.86Futures: Dec. 2001 1121.00 Mar. 2002 1122.40
S&P dividend yield = 1%2 month Tbill rate = 1.7%5 month Tbill rate = 1.8%Prompt date is the Thurs. before the third Friday of Month
Theoretical Price Actual - TheoreticalFN,D = 1118.86e(.017 - .01)(44/365) = 1119.80 1121 – 1119.80 = 1.20
FN,M = 1118.86e(.018 - .01)(128/365) = 1122.00 1122.4 – 1122 = 0.4
There are only slight differences between actual and theoretical futures prices. It would probably not pay to try to arbitrage since trading commissions may exceed profits.
Assuming no cost to trade then for the December contract:Arbitrage opportunity - sell futures / buy spot
Sell futures now/ make delivery in Dec. 1121Buy spot now -1118.86Forgo interest on funds (1118.86[e.017(43/365) –1]) -2.24 Receive dividends (1118.86[e( .01)(44/365) –1]) 1.30Guaranteed profit no matter what S&P does 1.20
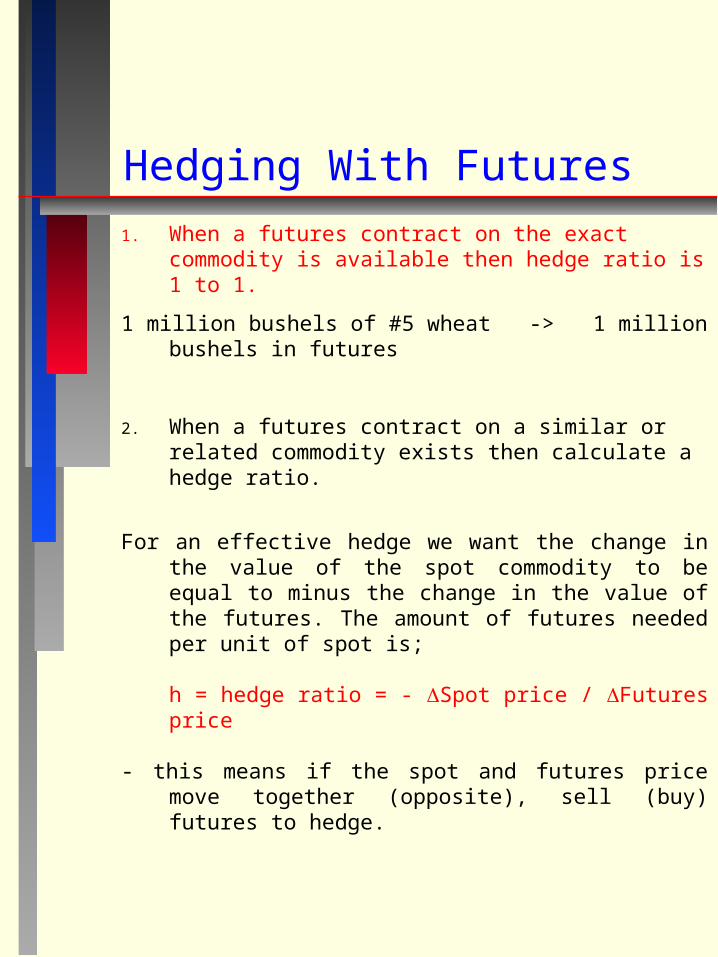
Hedging With Futures
1. When a futures contract on the exact commodity is available then hedge ratio is 1 to 1.
1 million bushels of #5 wheat -> 1 million bushels in futures
2. When a futures contract on a similar or related commodity exists then calculate a hedge ratio.
For an effective hedge we want the change in the value of the spot commodity to be equal to minus the change in the value of the futures. The amount of futures needed per unit of spot is;
h = hedge ratio = - Spot price / Futures price
- this means if the spot and futures price move together (opposite), sell (buy) futures to hedge.
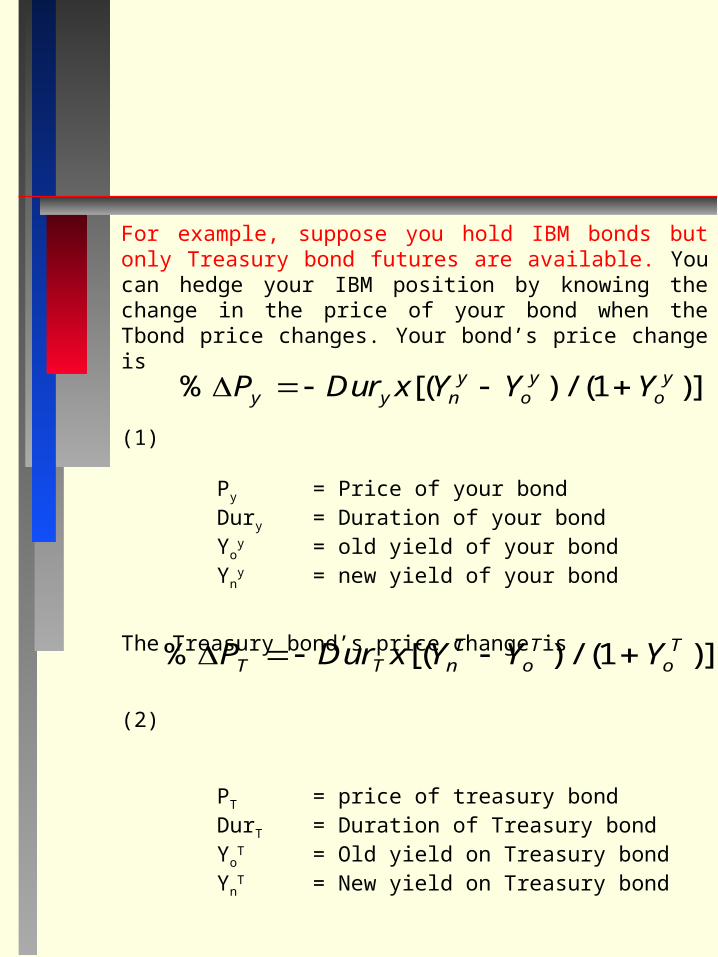
For example, suppose you hold IBM bonds but only Treasury bond futures are available. You can hedge your IBM position by knowing the change in the price of your bond when the Tbond price changes. Your bond’s price change is
(1)
Py = Price of your bondDury = Duration of your bondYo
y = old yield of your bondYn
y = new yield of your bond
The Treasury bond’s price change is
(2)
PT = price of treasury bondDurT = Duration of Treasury bondYo
T = Old yield on Treasury bondYn
T = New yield on Treasury bond
% [( ) / ( )]P Dur x Y Y Yy y ny
oy
oy 1
% [( ) / ( )]P Dur x Y Y YT T nT
oT
oT 1
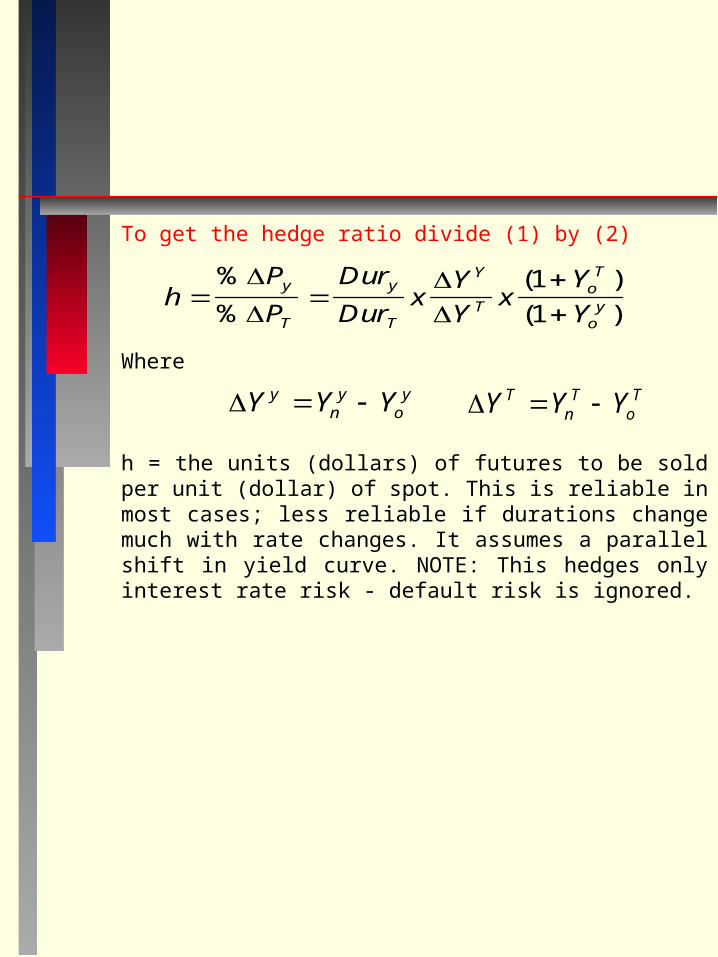
To get the hedge ratio divide (1) by (2)
Where
h = the units (dollars) of futures to be sold per unit (dollar) of spot. This is reliable in most cases; less reliable if durations change much with rate changes. It assumes a parallel shift in yield curve. NOTE: This hedges only interest rate risk - default risk is ignored.
hP
P
Dur
DurxY
Yx
Y
Yy
T
y
T
Y
ToT
oy
%
%
( )
( )
1
1
Y Y Yyny
oy Y Y YT
nT
oT
EXAMPLE:COMPLEX HEDGING - SOUTHEAST CORP
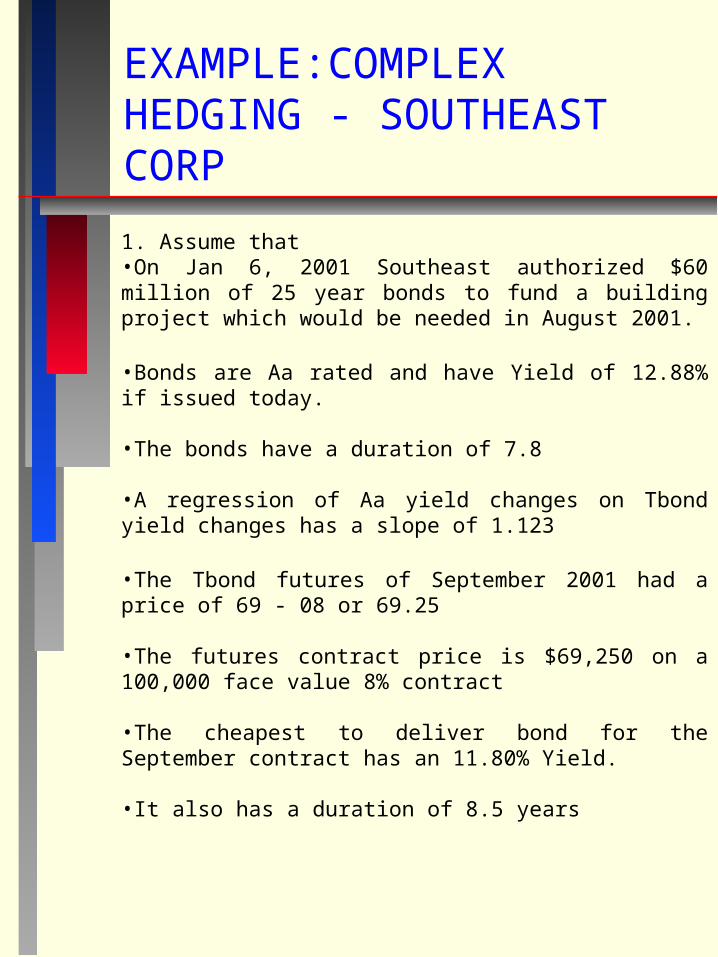
1. Assume that •On Jan 6, 2001 Southeast authorized $60 million of 25 year bonds to fund a building project which would be needed in August 2001.
•Bonds are Aa rated and have Yield of 12.88% if issued today.
•The bonds have a duration of 7.8
•A regression of Aa yield changes on Tbond yield changes has a slope of 1.123
•The Tbond futures of September 2001 had a price of 69 - 08 or 69.25
•The futures contract price is $69,250 on a 100,000 face value 8% contract
•The cheapest to deliver bond for the September contract has an 11.80% Yield.
•It also has a duration of 8.5 years
FINDING THE NUMBER OF FUTURES CONTRACTS NEEDED TO HEDGE
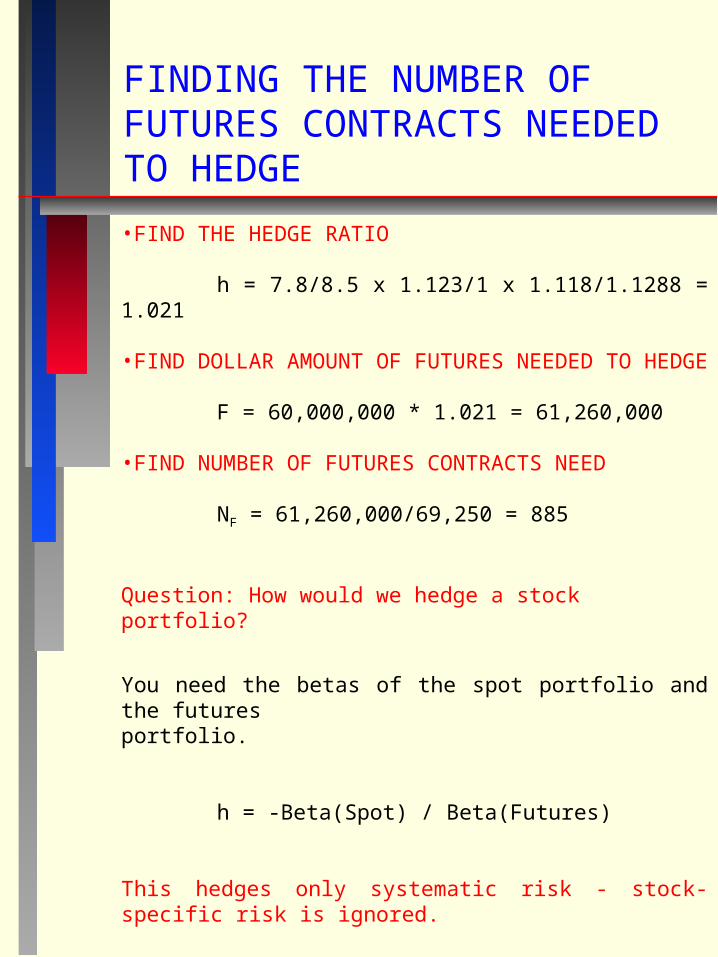
•FIND THE HEDGE RATIO
h = 7.8/8.5 x 1.123/1 x 1.118/1.1288 = 1.021
•FIND DOLLAR AMOUNT OF FUTURES NEEDED TO HEDGE
F = 60,000,000 * 1.021 = 61,260,000
•FIND NUMBER OF FUTURES CONTRACTS NEED
NF = 61,260,000/69,250 = 885
Question: How would we hedge a stock portfolio?
You need the betas of the spot portfolio and the futures portfolio.
h = -Beta(Spot) / Beta(Futures)
This hedges only systematic risk - stock-specific risk is ignored.
International Finance and Foreign Exchange Futures
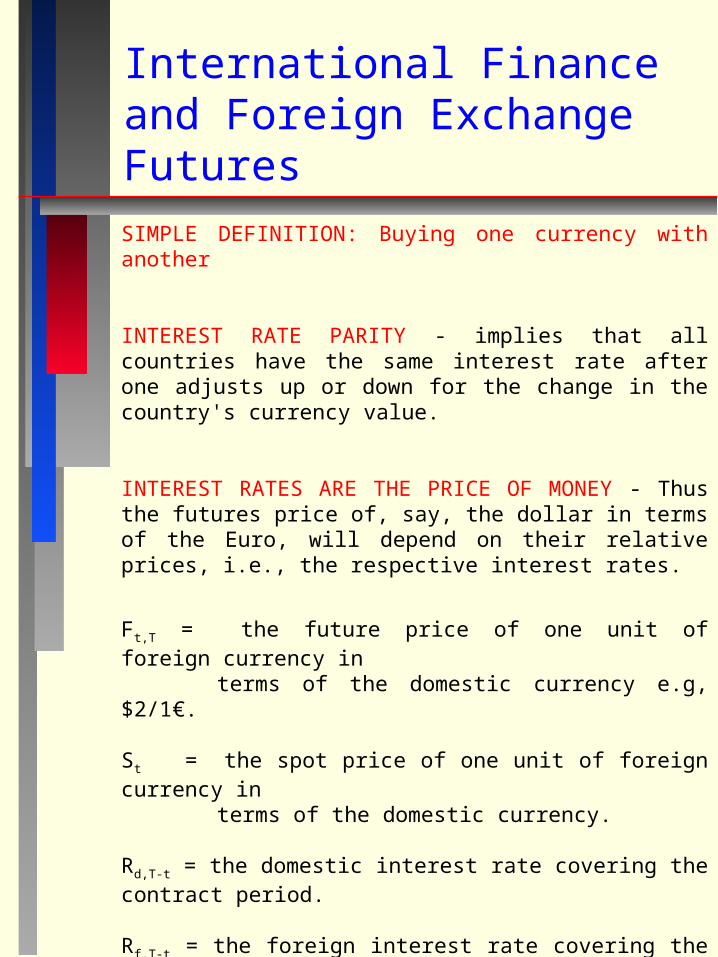
SIMPLE DEFINITION: Buying one currency with another
INTEREST RATE PARITY - implies that all countries have the same interest rate after one adjusts up or down for the change in the country's currency value.
INTEREST RATES ARE THE PRICE OF MONEY - Thus the futures price of, say, the dollar in terms of the Euro, will depend on their relative prices, i.e., the respective interest rates.
Ft,T = the future price of one unit of foreign currency in terms of the domestic currency e.g, $2/1€.
St = the spot price of one unit of foreign currency interms of the domestic currency.
Rd,T-t = the domestic interest rate covering the contract period.
Rf,T-t = the foreign interest rate covering the contract period.
Ft,T = Ste(Rd - Rf)(T-t)
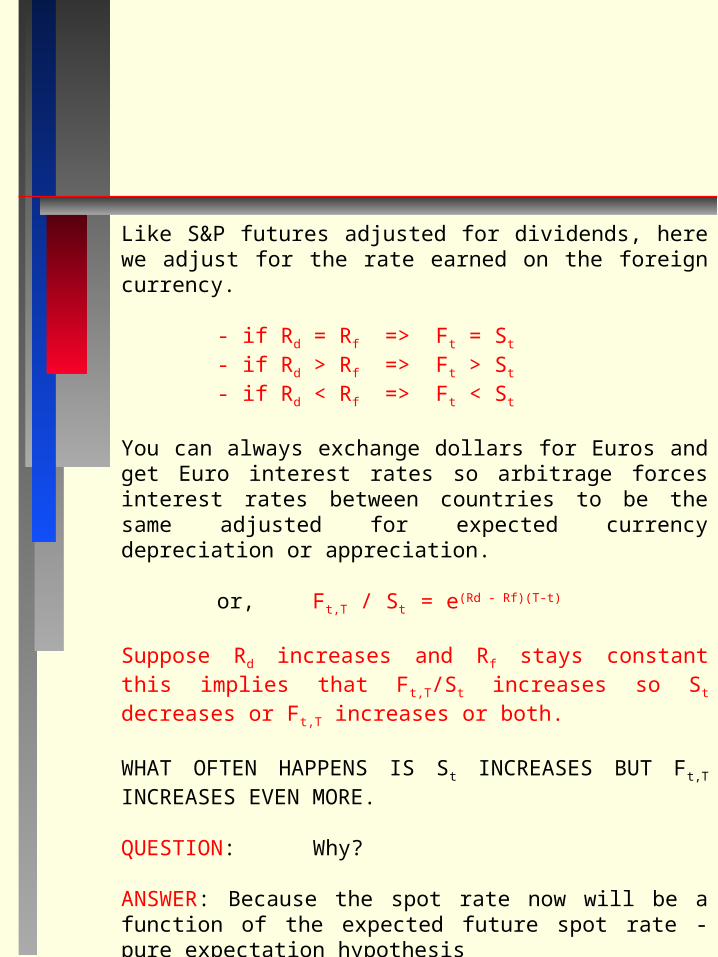
Like S&P futures adjusted for dividends, here we adjust for the rate earned on the foreign currency.
- if Rd = Rf => Ft = St
- if Rd > Rf => Ft > St
- if Rd < Rf => Ft < St
You can always exchange dollars for Euros and get Euro interest rates so arbitrage forces interest rates between countries to be the same adjusted for expected currency depreciation or appreciation.
or, Ft,T / St = e(Rd - Rf)(T-t)
Suppose Rd increases and Rf stays constant this implies that Ft,T/St increases so St decreases or Ft,T increases or both.
WHAT OFTEN HAPPENS IS St INCREASES BUT Ft,T INCREASES EVEN MORE.
QUESTION: Why?
ANSWER: Because the spot rate now will be a function of the expected future spot rate - pure expectation hypothesisinvestors hold currencies that they expect to appreciate which increases the demand for them now. Also, if a country increases its interest rate (through the central bank), investors might expect more increases and bid up currency futures.
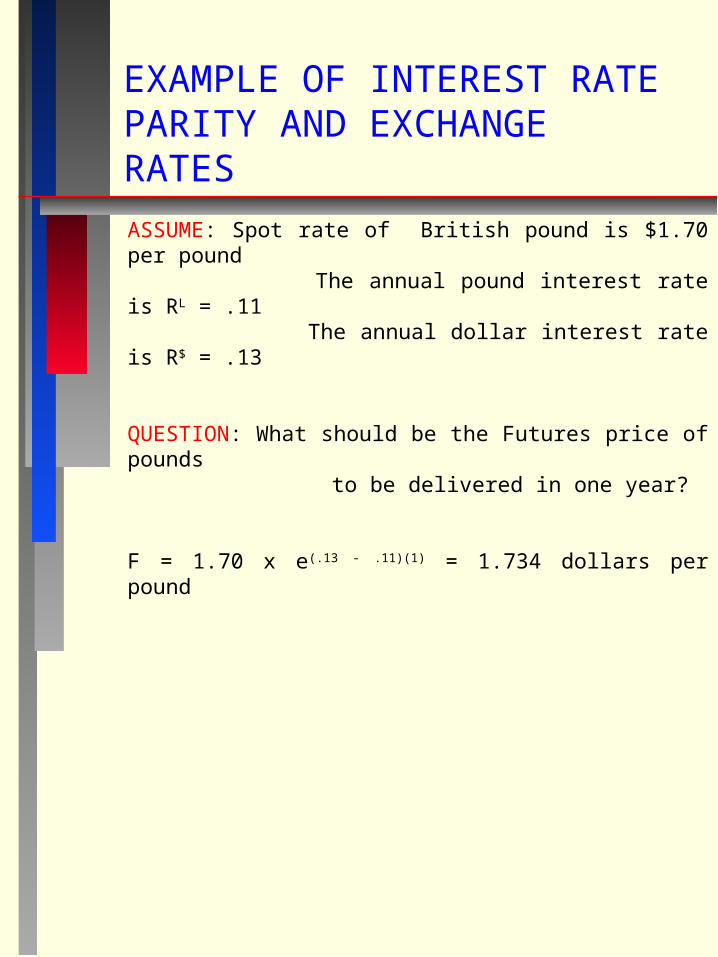
EXAMPLE OF INTEREST RATE PARITY AND EXCHANGE RATES
ASSUME: Spot rate of British pound is $1.70 per pound The annual pound interest rate is RL = .11 The annual dollar interest rate is R$ = .13
QUESTION: What should be the Futures price of pounds to be delivered in one year?
F = 1.70 x e(.13 - .11)(1) = 1.734 dollars per pound
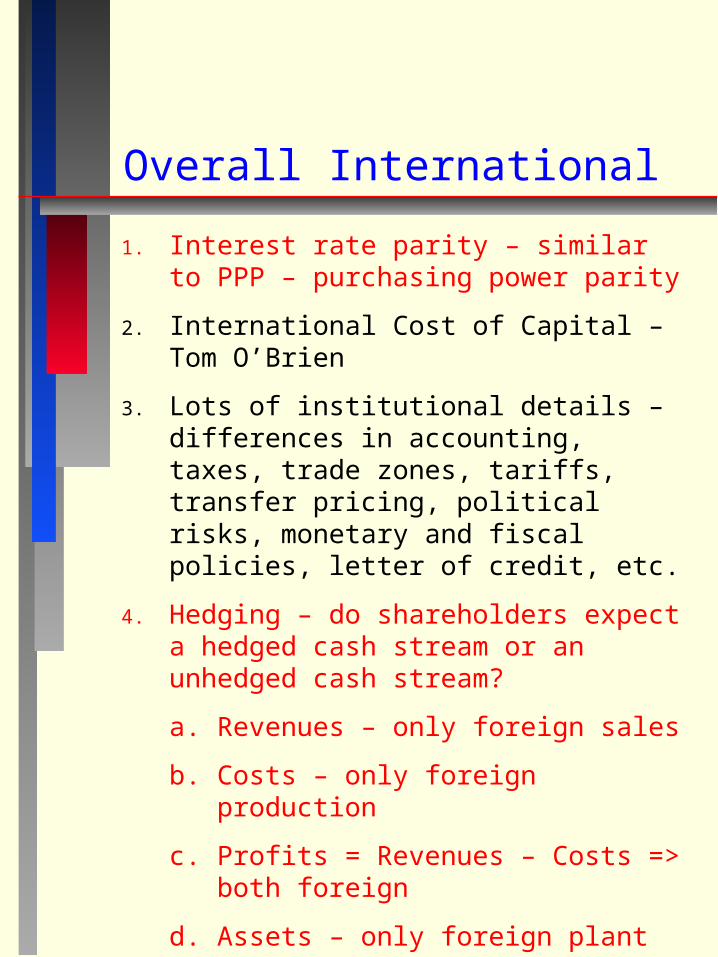
Overall International
1. Interest rate parity – similar to PPP – purchasing power parity
2. International Cost of Capital – Tom O’Brien
3. Lots of institutional details – differences in accounting, taxes, trade zones, tariffs, transfer pricing, political risks, monetary and fiscal policies, letter of credit, etc.
4. Hedging – do shareholders expect a hedged cash stream or an unhedged cash stream?
a. Revenues – only foreign sales
b. Costs – only foreign production
c. Profits = Revenues – Costs => both foreign
d. Assets – only foreign plant
e. Liabilities – only foreign financing
f. Equity = Assets – Liabilities => both foreign
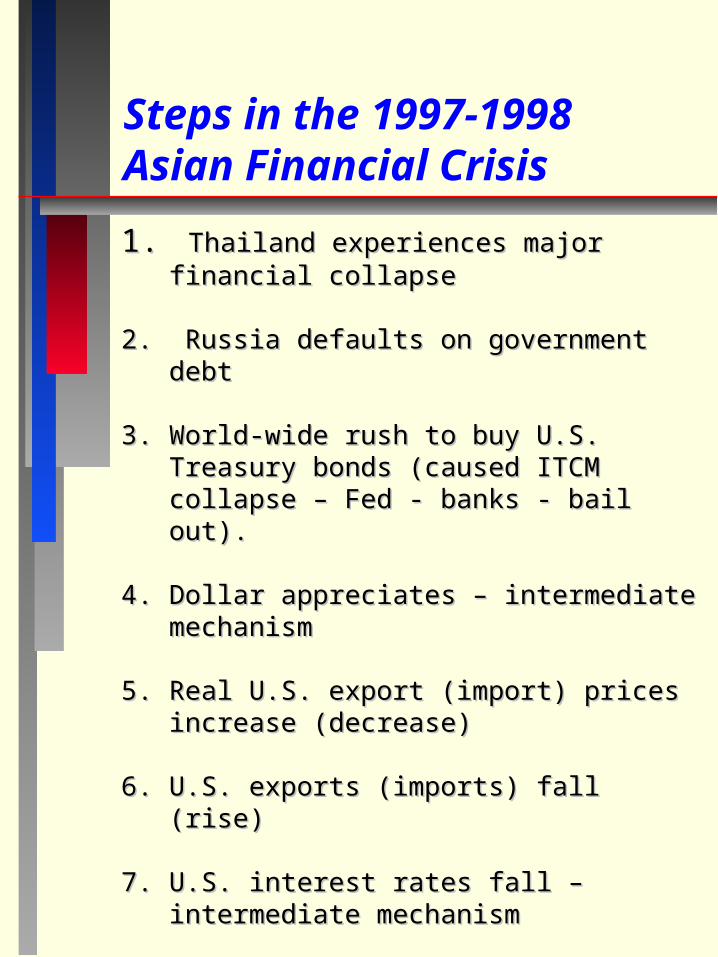
Steps in the 1997-1998Asian Financial Crisis
1.1. Thailand experiences major financial Thailand experiences major financial collapsecollapse
2. Russia defaults on government debt2. Russia defaults on government debt
3. World-wide rush to buy U.S. Treasury bonds 3. World-wide rush to buy U.S. Treasury bonds (caused ITCM collapse – Fed - banks - bail (caused ITCM collapse – Fed - banks - bail out).out).
4. Dollar appreciates – intermediate mechanism4. Dollar appreciates – intermediate mechanism
5. Real U.S. export (import) prices increase 5. Real U.S. export (import) prices increase (decrease)(decrease)
6. U.S. exports (imports) fall (rise)6. U.S. exports (imports) fall (rise)
7. U.S. interest rates fall – intermediate 7. U.S. interest rates fall – intermediate mechanismmechanism
8. U.S. consumption (savings) rises (falls), 8. U.S. consumption (savings) rises (falls), investment risesinvestment rises
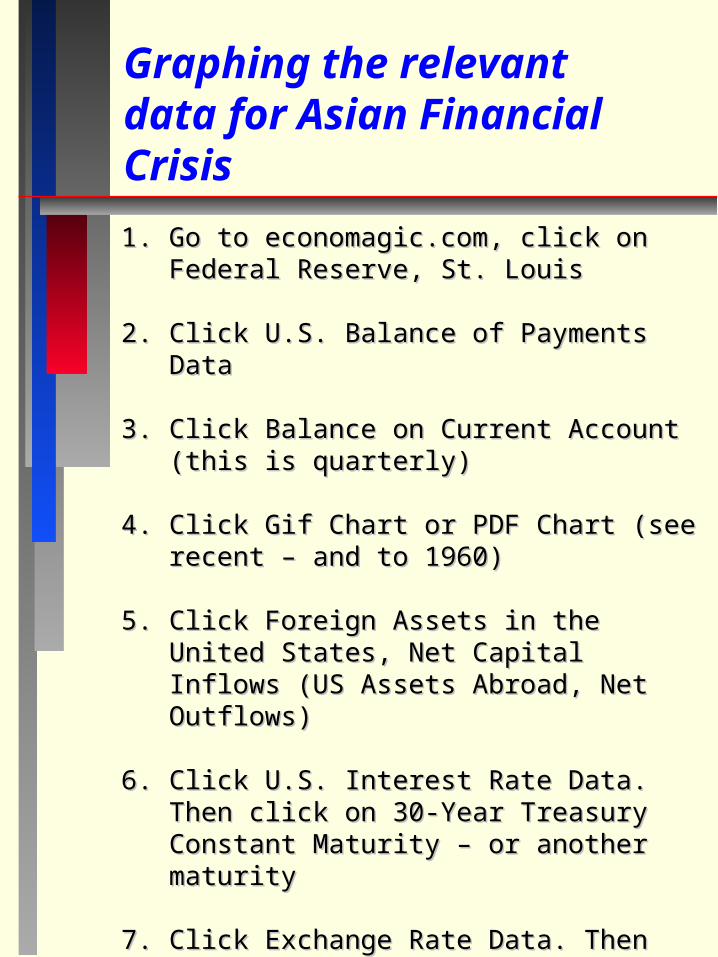
Graphing the relevant data for Asian Financial Crisis
1.1. Go to economagic.com, click on Federal Go to economagic.com, click on Federal Reserve, St. LouisReserve, St. Louis
2. Click U.S. Balance of Payments Data2. Click U.S. Balance of Payments Data
3. Click Balance on Current Account (this is 3. Click Balance on Current Account (this is quarterly)quarterly)
4. Click Gif Chart or PDF Chart (see recent – and 4. Click Gif Chart or PDF Chart (see recent – and to 1960)to 1960)
5. Click Foreign Assets in the United States, Net 5. Click Foreign Assets in the United States, Net Capital Inflows (US Assets Abroad, Net Capital Inflows (US Assets Abroad, Net Outflows)Outflows)
6. Click U.S. Interest Rate Data. Then click on 6. Click U.S. Interest Rate Data. Then click on 30-Year Treasury Constant Maturity – or 30-Year Treasury Constant Maturity – or another maturityanother maturity
7. Click Exchange Rate Data. Then click Trade-7. Click Exchange Rate Data. Then click Trade-Weighted Exchange Index: BroadWeighted Exchange Index: Broad
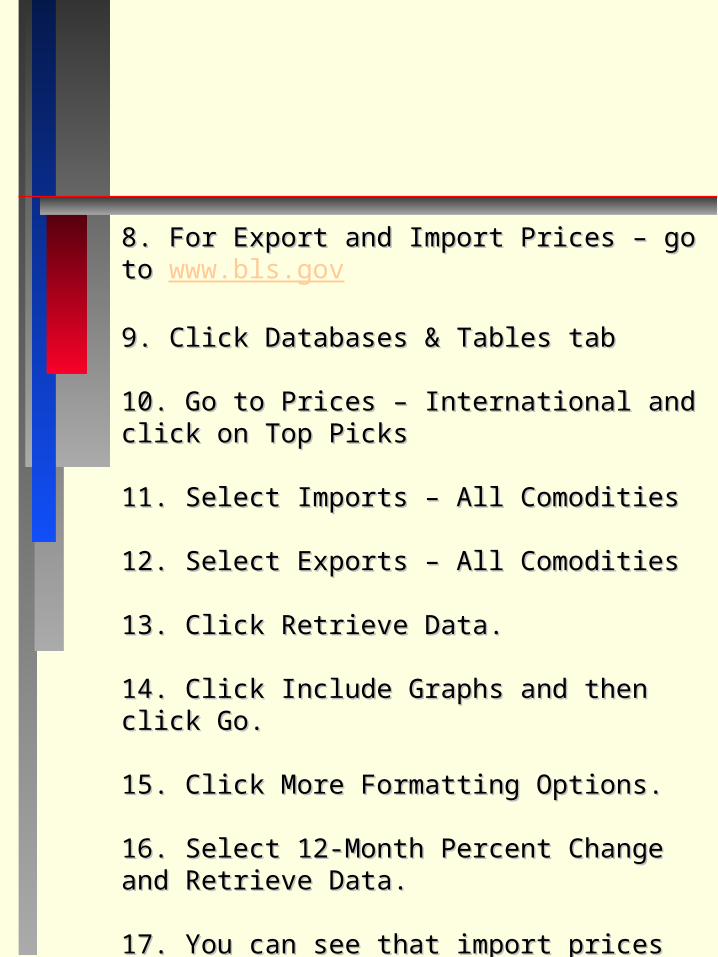
8. For Export and Import Prices – go to 8. For Export and Import Prices – go to www.bls.gov
9. Click Databases & Tables tab9. Click Databases & Tables tab
10. Go to Prices – International and click on Top 10. Go to Prices – International and click on Top PicksPicks
11. Select Imports – All Comodities11. Select Imports – All Comodities
12. Select Exports – All Comodities12. Select Exports – All Comodities
13. Click Retrieve Data.13. Click Retrieve Data.
14. Click Include Graphs and then click Go.14. Click Include Graphs and then click Go.
15. Click More Formatting Options.15. Click More Formatting Options.
16. Select 12-Month Percent Change and 16. Select 12-Month Percent Change and Retrieve Data.Retrieve Data.
17. You can see that import prices fell faster than 17. You can see that import prices fell faster than export prices around 1997-1998.export prices around 1997-1998.