future sea level rise sources a compilation of data/predicted sea level rise group 2, mission 2010
Post on 21-Dec-2015
214 views
TRANSCRIPT
Future Sea Level Rise Sources
A compilation of data/predicted sea level rise
Group 2, Mission 2010
Purpose
This is so that the rest of you can see the current data out there on sea level rise predictions
Source #1-#3 *Can
Climatic Research Unit (2000) Author: Sarah Raper In meters 1.8 to 2.1 Uncertainties:
Future greenhouse gases & aerosol emissions Greenhouse gas concentration in the atmosphere Effect of changed concentrations on the radiative forcing of the
atmosphere Effect of this force on temperature and snowfall Rate of heat transfer to the ocean Regional climate change over the glaciers, ice caps, and ice-
sheets Response of the glaciers, ice-caps, and ice-sheets to this climate
changes
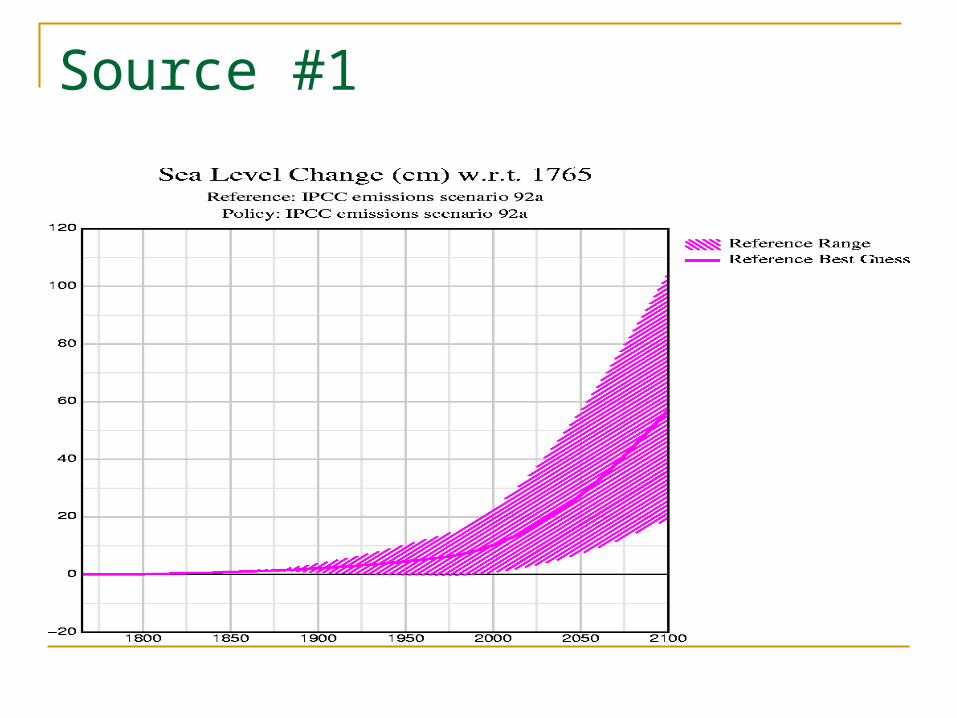
Source #1
Source #2
Supports 1st Source Graph source is Wikipedia In centimeters 1880-2000

Source #2
Source #3
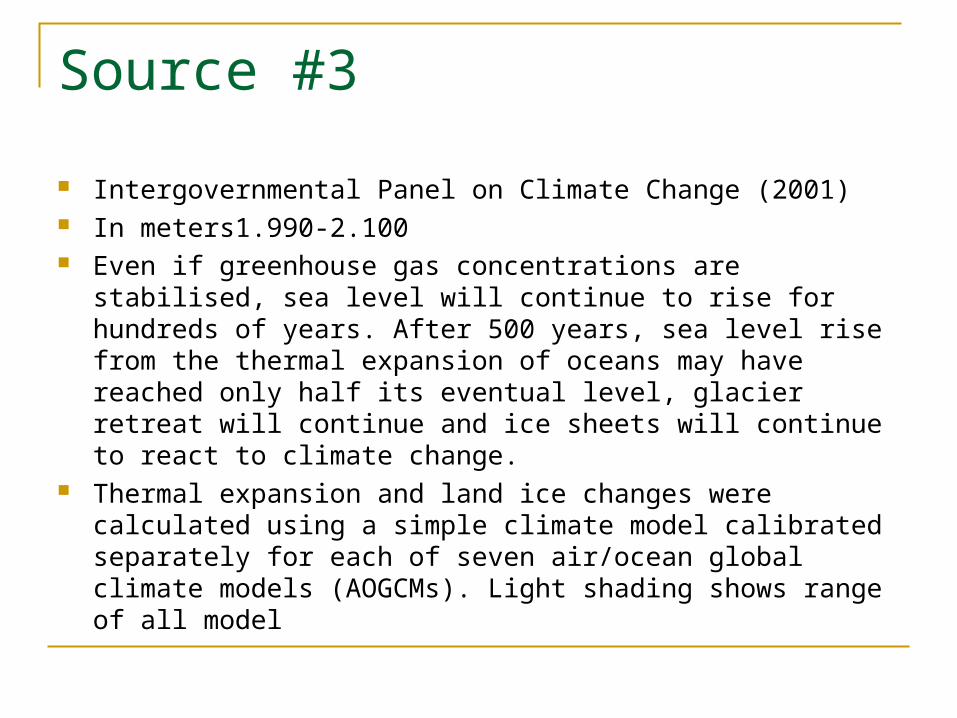
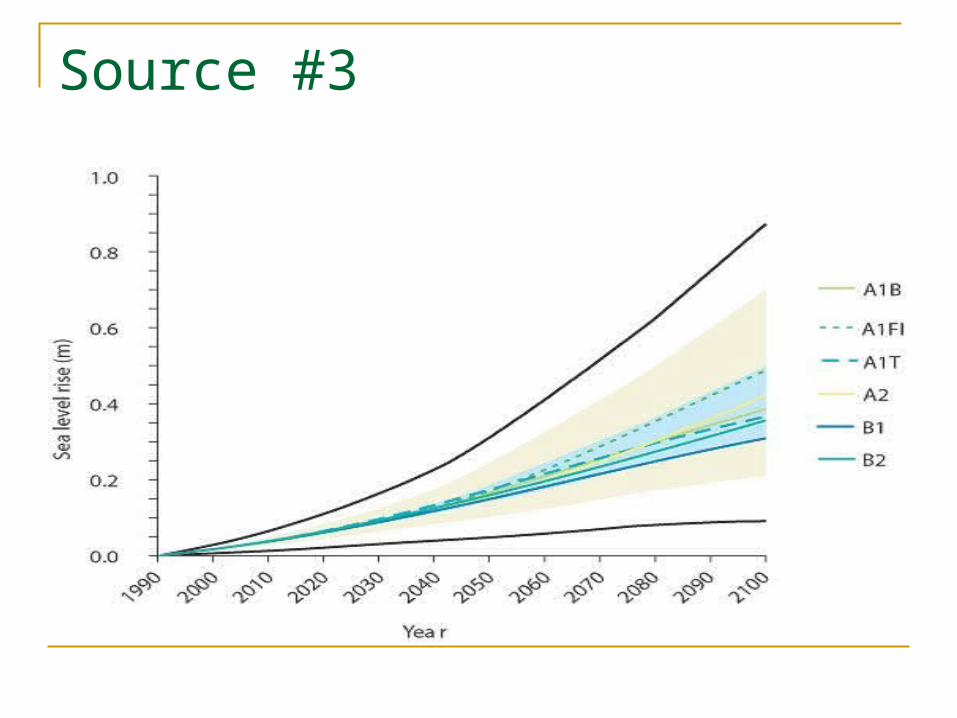
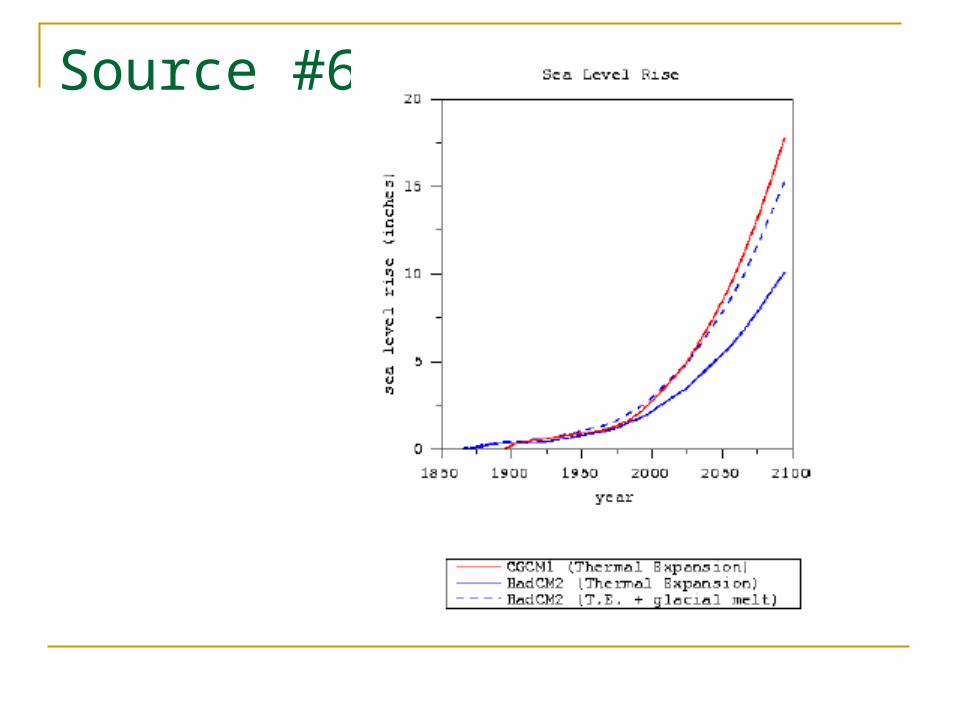
Intergovernmental Panel on Climate Change (2001) In meters1.990-2.100 Even if greenhouse gas concentrations are stabilised, sea level will
continue to rise for hundreds of years. After 500 years, sea level rise from the thermal expansion of oceans may have reached only half its eventual level, glacier retreat will continue and ice sheets will continue to react to climate change.
Thermal expansion and land ice changes were calculated using a simple climate model calibrated separately for each of seven air/ocean global climate models (AOGCMs). Light shading shows range of all model
Source #3
Source #4-#8 *YeSeul
1. Coast to Coast 2002 National Conference Main writer: Kevin Walsh, University of
Melbourne, School of Earth Sciences 2. Predicted sea level rise: .03 to .3 m by
2040; .09-.88m by 2010 3. Uncertainties: due to future greenhouse
gas concentrations. Used GIS
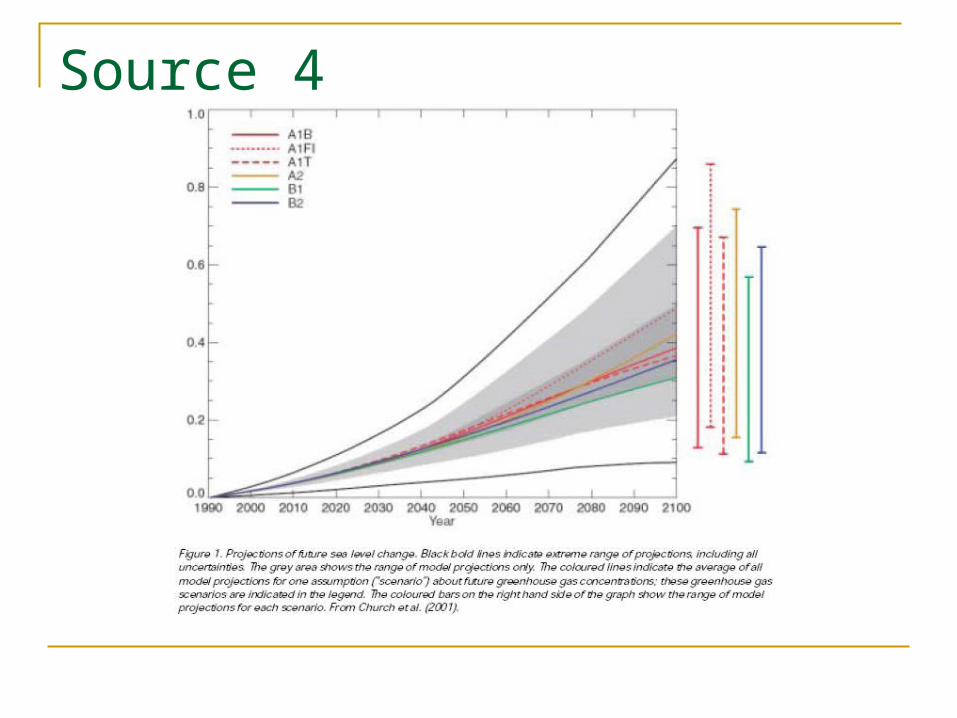
Source 4
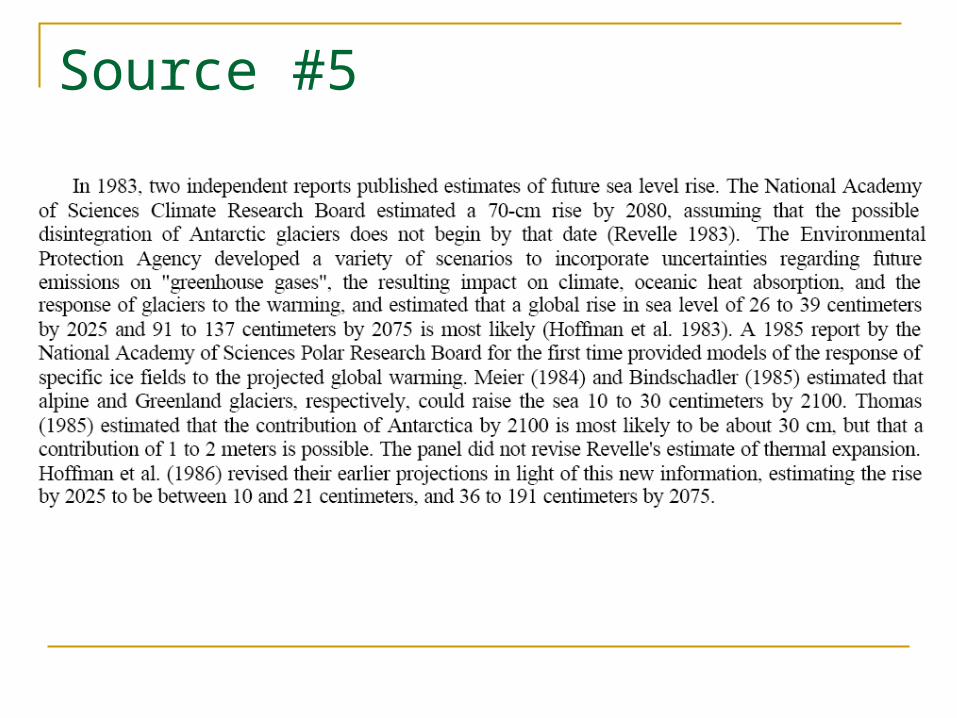
Source #5
EPA (Saving Louisiana’s Coastal Wetlands Report) http://yosemite.epa.gov/OAR/globalwarming.nsf/UniqueKeyLookup/SHSU5BURPP/$File/louisiana.pdf
.7 m rise by 2080 Incorporate Uncertainties: future emissions
on “greenhouse gases,” resulting impact on climate, oceanic heat absorption and response of glaciers to warming
Source #5
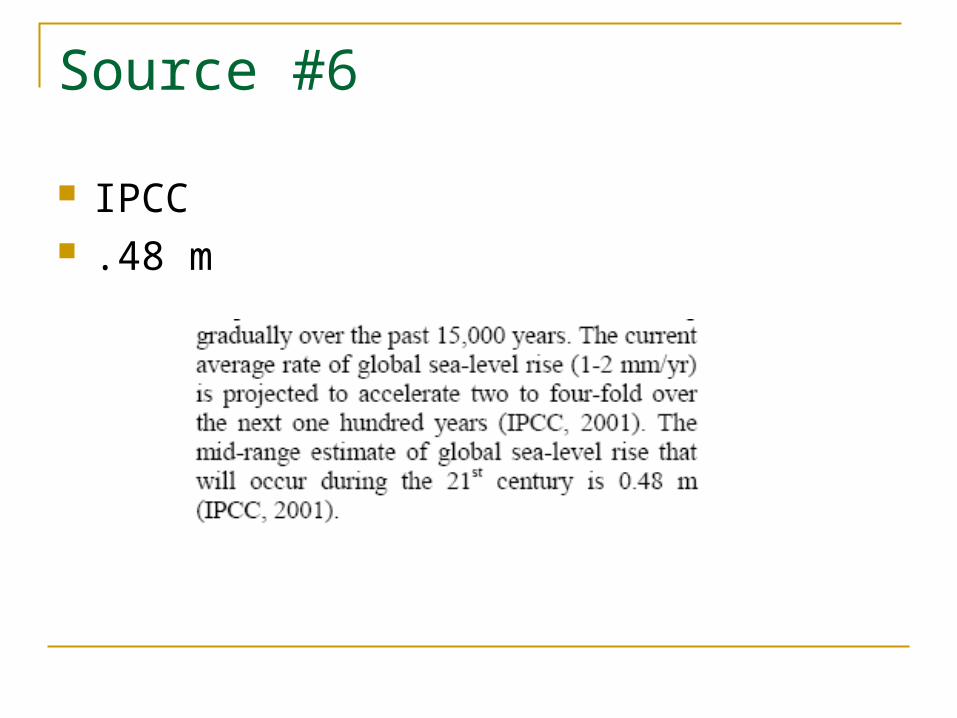
Source #6
IPCC .48 m
Source #6
Source #7
Hart, David A., Burkett, Virginia A., Ziloski, David A. Sea Level Rise and Subsidence: Implications of Flooding in New Orleans, Louisiana. United States Geological Survey.
.48m

Source #8
USGS
Source #9-#13 *Erika
CSCOR, Division of NOAA http://www.cop.noaa.gov/stressors/climatechange/current/sea_level_rise.html
Uncertainty: Process for determining projected sea level rise was not stated.
3. .040m – 1.029m by 2095
Source #10
1. Australian Academy of Science http://www.science.org.au/nova/
082/082key.htm Uncertainty: Greenhouse gas concentrations,
climate sensitivity, ocean heat exchange, and response of Greenland and Antarctic ice sheets to years of warmer temperatures
3. .09m - .88m, with a “best guess” of .50m
Source #11
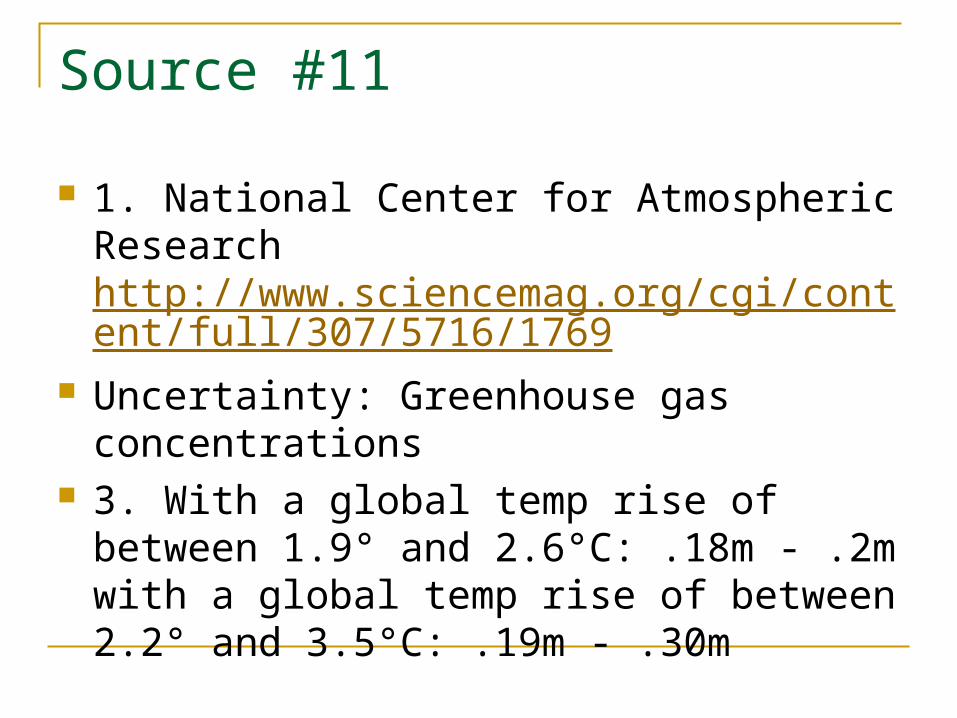
1. National Center for Atmospheric Research http://www.sciencemag.org/cgi/content/full/307/5716/1769
Uncertainty: Greenhouse gas concentrations 3. With a global temp rise of between 1.9°
and 2.6°C: .18m - .2m with a global temp rise of between 2.2° and 3.5°C: .19m - .30m
Source #13
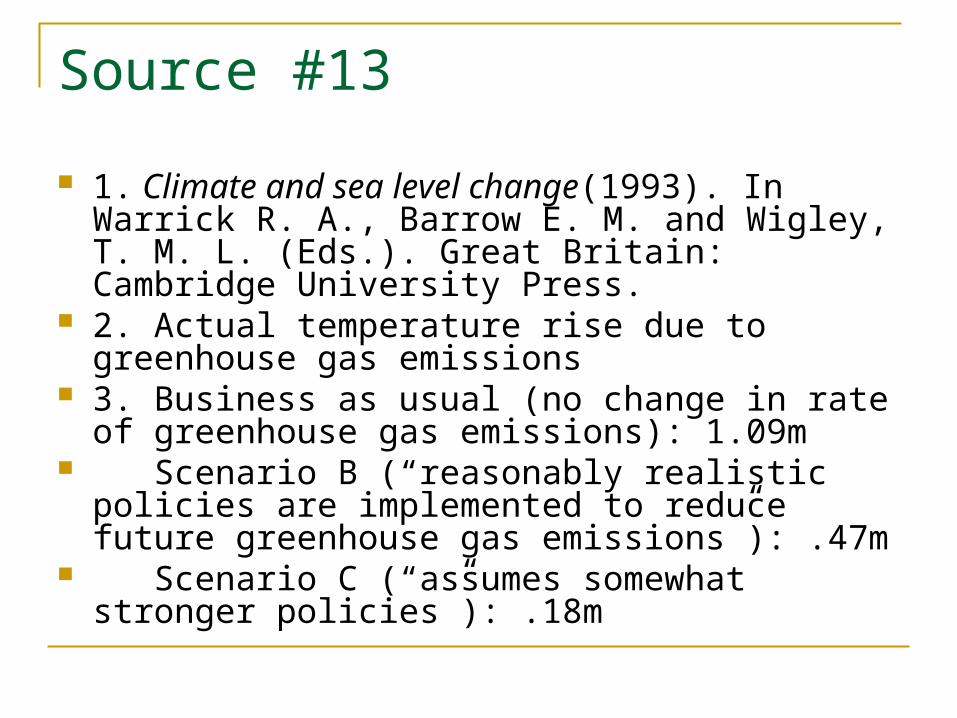
1. Climate and sea level change(1993). In Warrick R. A., Barrow E. M. and Wigley, T. M. L. (Eds.). Great Britain: Cambridge University Press.
2. Actual temperature rise due to greenhouse gas emissions
3. Business as usual (no change in rate of greenhouse gas emissions): 1.09m
Scenario B (“reasonably realistic policies are implemented to reduce future greenhouse gas emissions”): .47m
Scenario C (“assumes somewhat stronger policies”): .18m
Source #14-18 *Katie
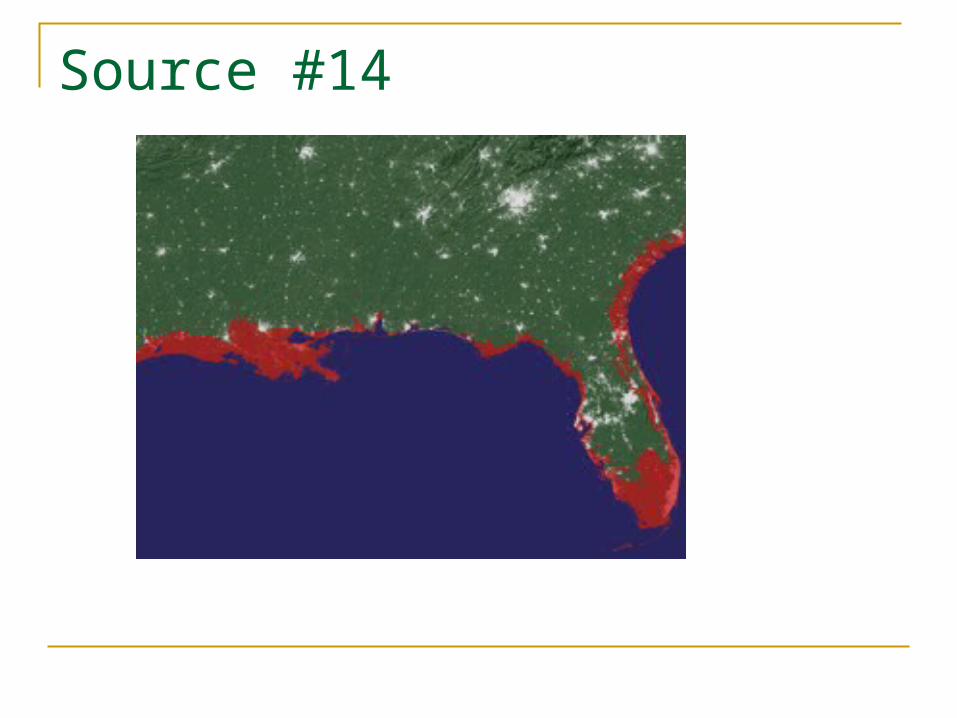
1. AGI (American Geological Institute)
2. Uncertain how much of the sea level rise data pertaining to 130,000 yearsago was due to Antarctic ice sheet melting
3. 6 meters or more over the next 140 years (due to melting of ice sheets)
Source #14
Source #15
1. CRU (Climatic Research Unit)
2. Lists factors contributing to uncertainty:
1. the assumed future greenhouse gas and aerosol emissions,
2. the resulting greenhouse gas concentrations in the atmosphere,which depends on the various sources and sinks of the various gases,
3. the effect of the changed concentrations on the radiativeforcing of the atmosphere,
4. the effect of this forcing on the climate, in particular ontemperature and snowfall,
5. the rate of heat penetration into the ocean, which will affectthe rate of thermal expansion of the ocean,
6. the regional climate change over the glaciers, ice caps andice-sheets (both temperature and snowfall),
7. the response of the glaciers, ice caps and ice-sheets to thisclimate change.
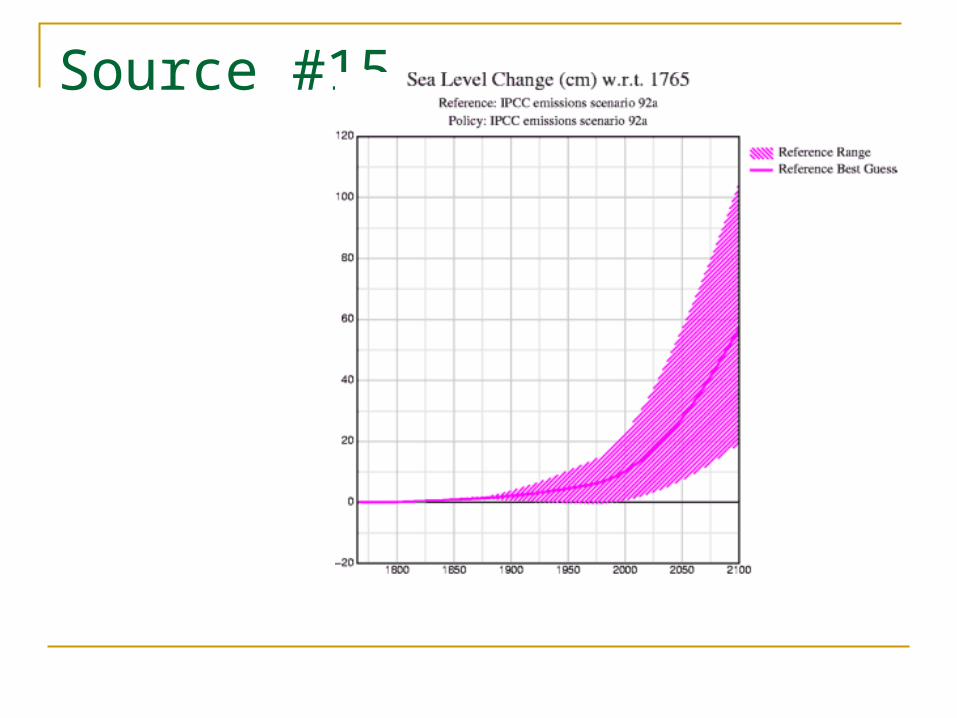
3. Based on looking at the chart, about 40 cm by 2100, using the "ReferenceBest Guess" line 4.
Source #15
Source #16
1. David Gates...some smart guy who wrote some book about this stuff,published by Sinauer Associates
2. Very uncertain, gives a broad general range of estimates
3. 33 cm by 2050, anywhere from 1.5 - 2.5 m by 2100
Source #17
1. Iowa State University
2. There is no evidence for any acceleration in the rate of sea level risefor the 20th century
3. Best estimate - .66 m by 2100 To see graphs: http://
www.iitap.iastate.edu/gcp/sealevel/sealevel_lecture.html
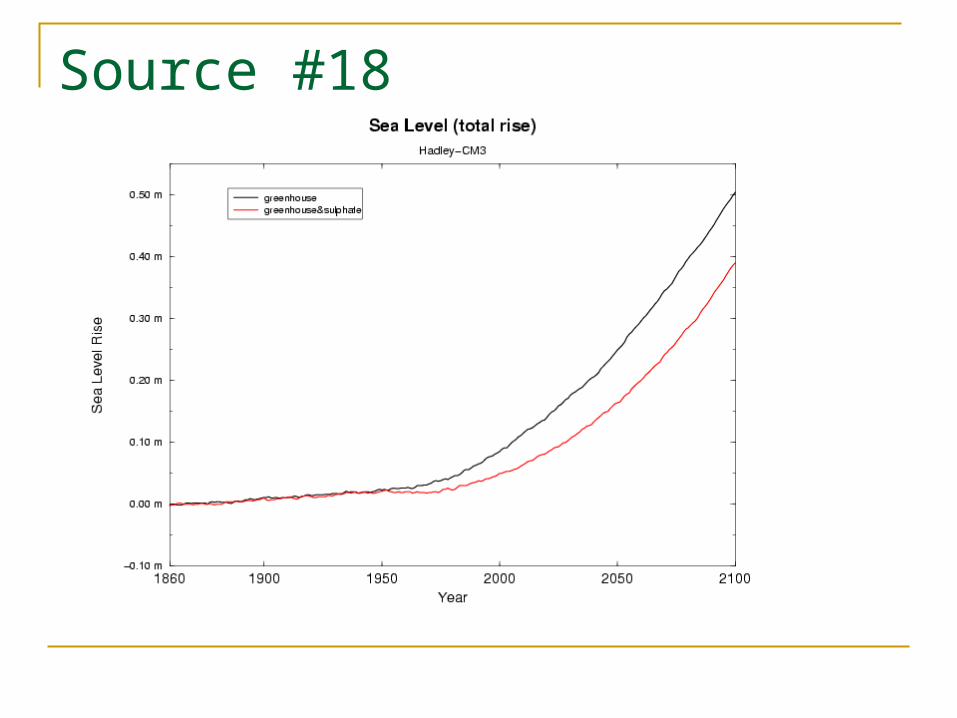
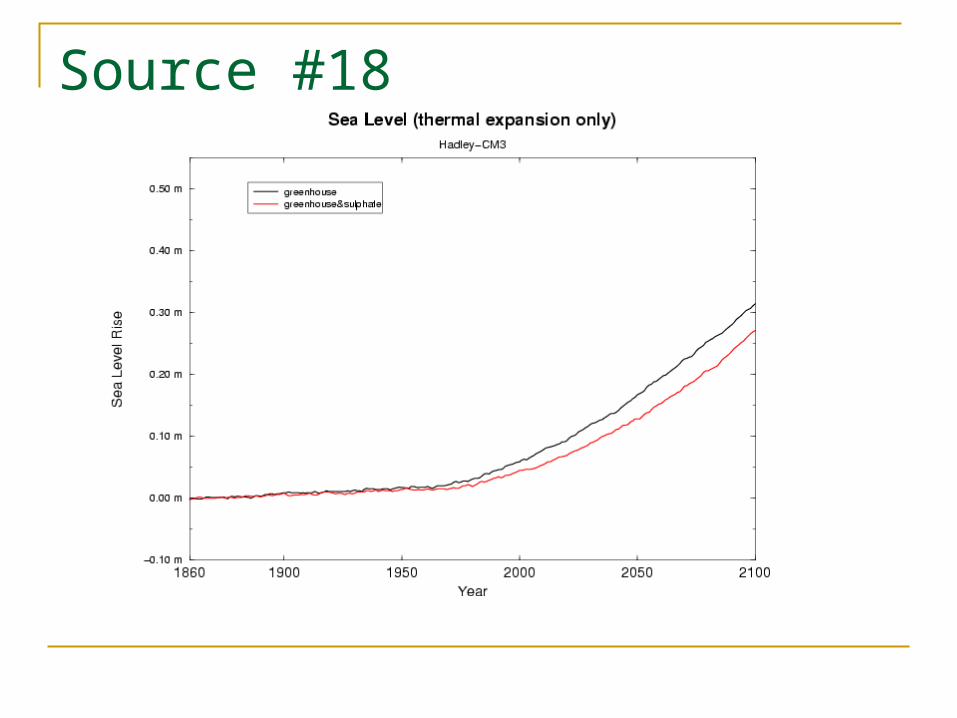
Source #18
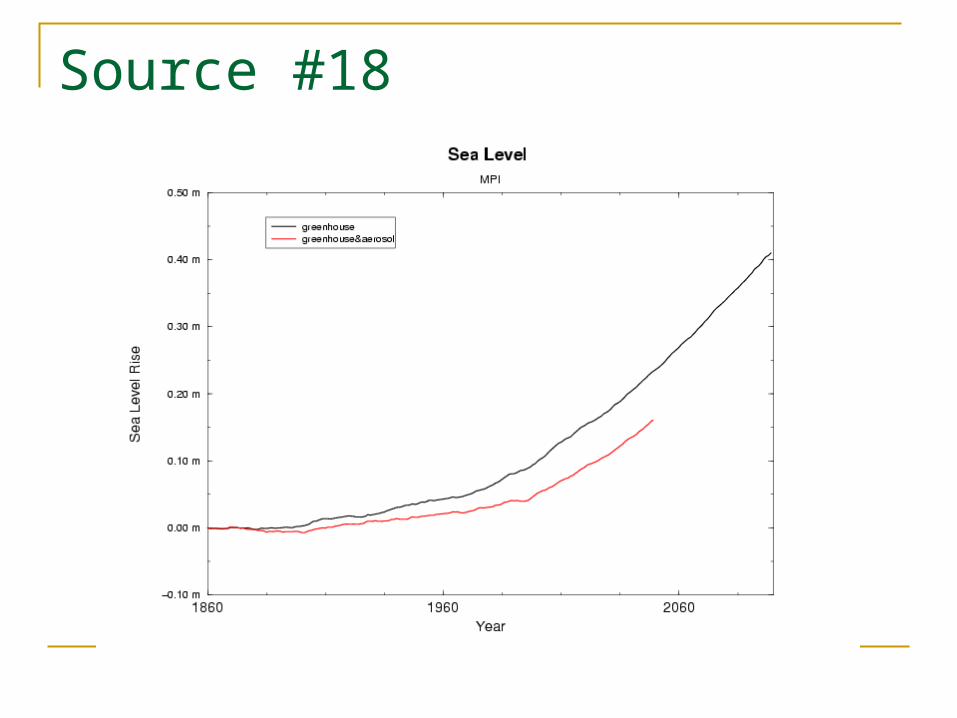
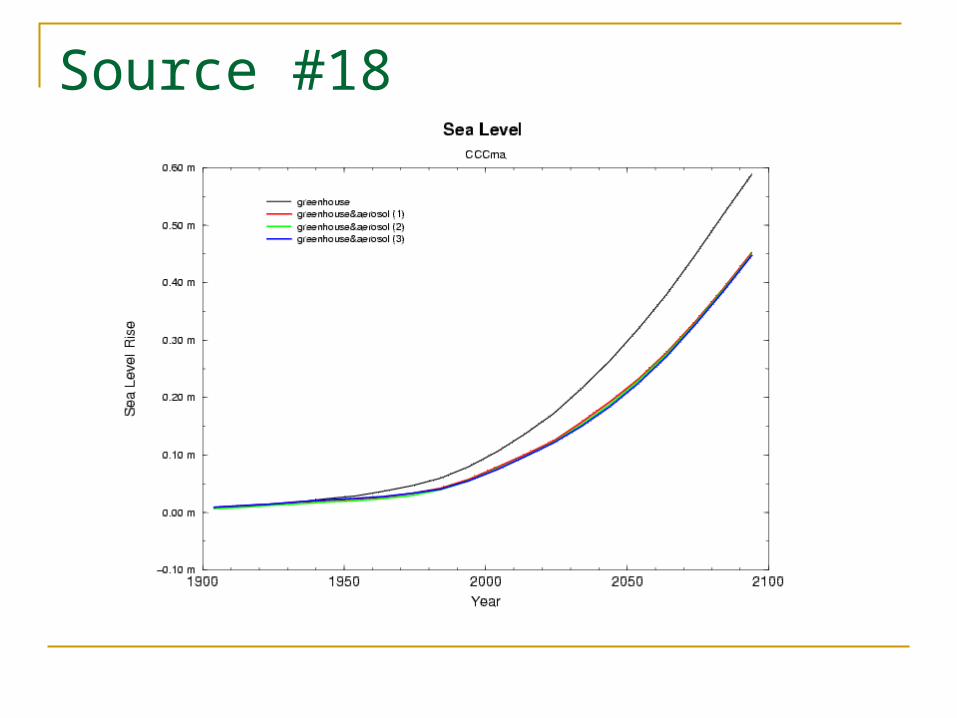
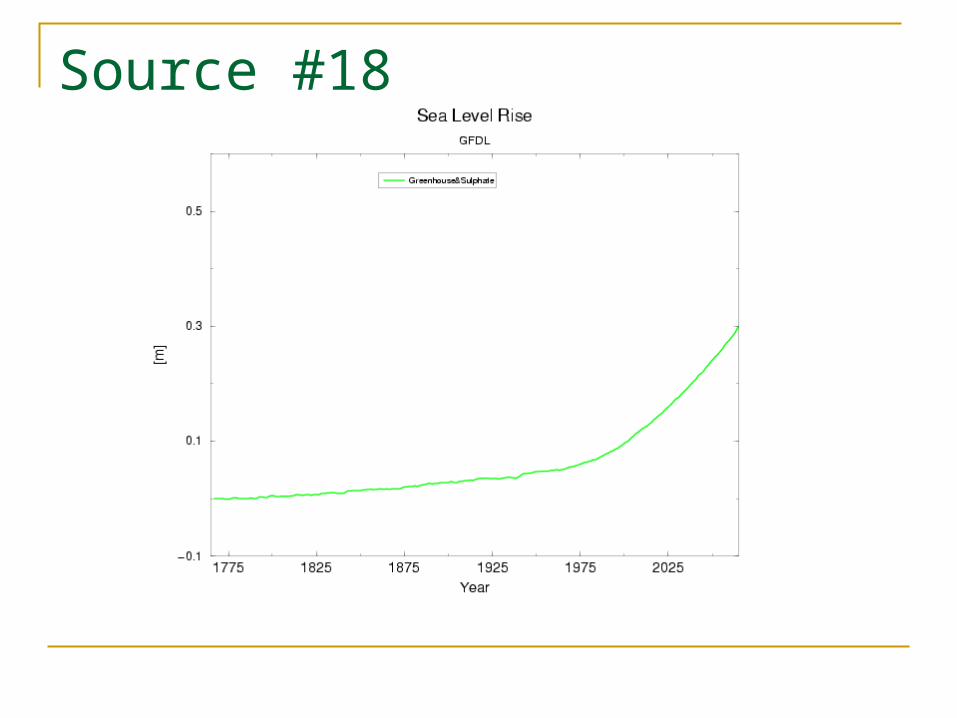
1. Modelle & Daten - World Data Center for Climate, Hamburg
2. Sea level rise varies depending on model
3. Various estimates based on different models
Source #18
Source #18
Source #18
Source #18
Source #18
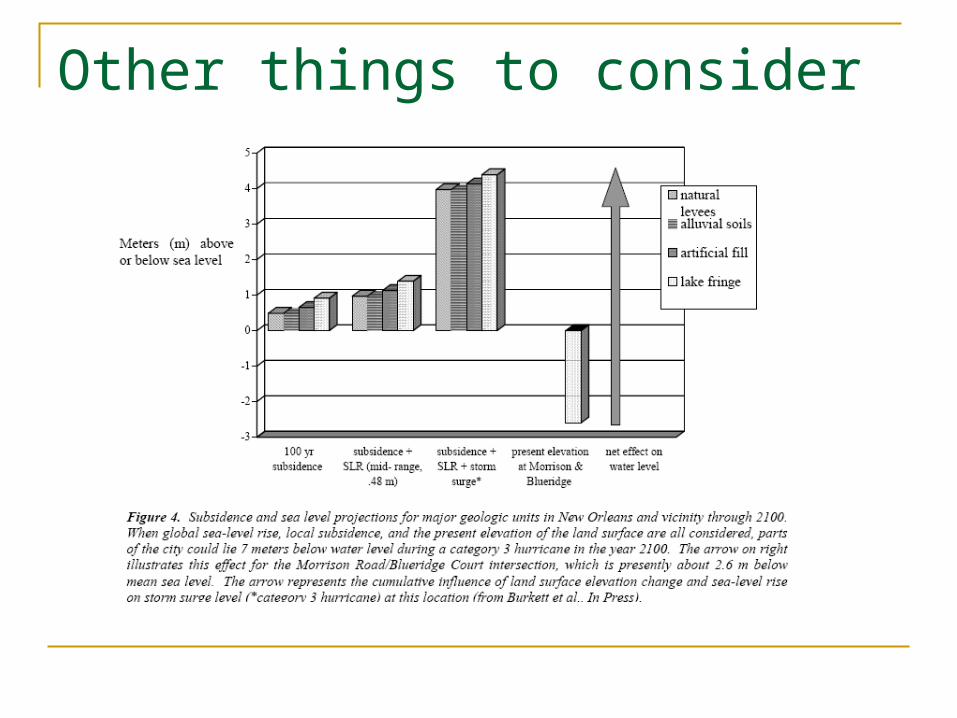
Other things to consider
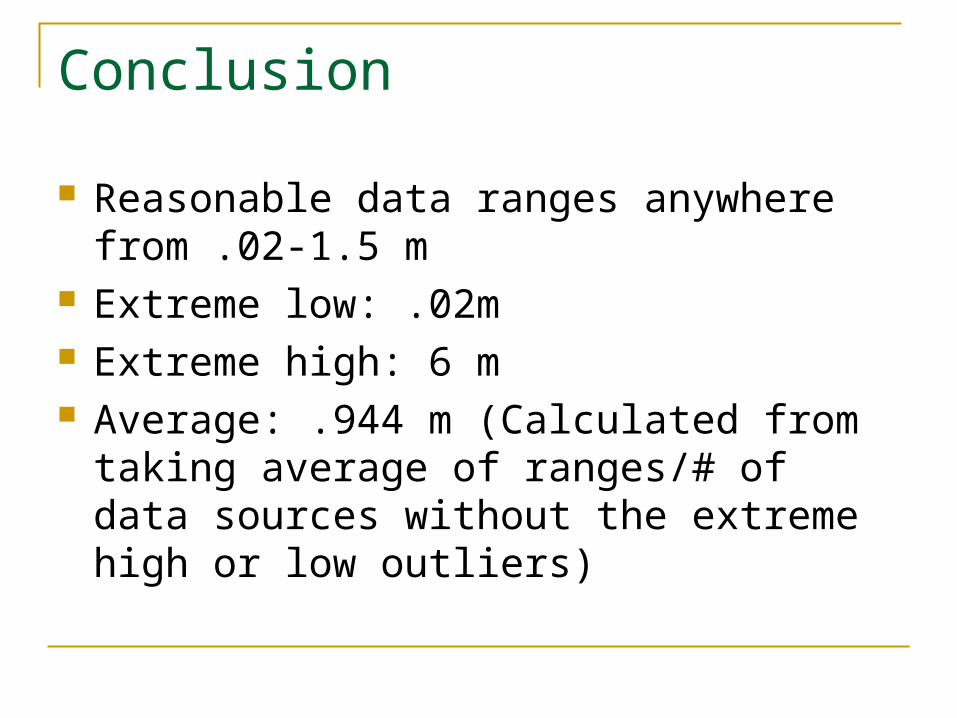
Conclusion
Reasonable data ranges anywhere from .02-1.5 m
Extreme low: .02m Extreme high: 6 m Average: .944 m (Calculated from taking
average of ranges/# of data sources without the extreme high or low outliers)
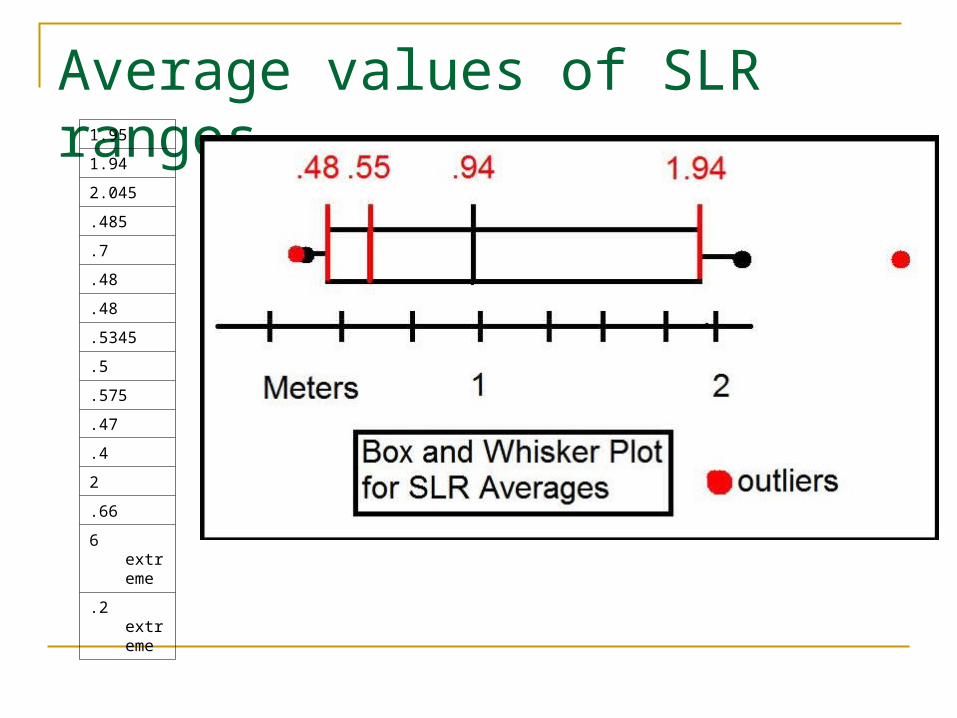
Average values of SLR ranges1.95
1.94
2.045
.485
.7
.48
.48
.5345
.5
.575
.47
.4
2
.66
6 extreme
.2 extreme