future opportunities for the upper hunter
TRANSCRIPT

Whither Upper Hunter?Alan Rai – Principal Economist

FUTURE OPPORTUNITIESAND THREATS• Focus on our competitive
advantages– Agriculture, tourism, equine, energy– Gas?
• Free-trade agreements (FTAs)– Significant opportunities for us – But also threat from foreign rivals
• Diversity in land use:– Conflicting and competing uses of land– Compare longer-run costs and benefits
of alternative uses of land

COMPETITIVE ADVANTAGESWHAT ARE THEY?
• Comparative advantages:– Energy (e.g. renewables)– ‘Agritourism’– Wine– Equine– Advanced manufacturing
• Where are our comparative disadvantages?– Unskilled, cheap labour
• Mass production• Standardised manufacturing
– Our high (labour) costs resemble Germans and Swiss• Yet they have a vibrant manufacturing sector. How?

ChAFTA AND OTHER FTAs
• Our skilled workforce employed in:– Health and Aged Care services– Advanced manufacturing (renewable energy,
medical equipment)
• Our arable land:– Agritourism, wine, equine
PLAY TO OUR STRENGTHS – BUT ALSO POSE THREATS
• FTAs also represent threats– ‘Low-value’ manufacturing
• We must focus on where we are most productive– Accelerates ‘servitisation’
of our industries

OUR DEMOGRAPHIC TRENDSENHANCE OUR ECONOMY’S ‘SERVITISATION’
0
10
20
30
40
50
0
10
20
30
40
50
1996 2006 2016 2026 1996 2006 2016 2026
Population share by age group
Sources: ABS Census of Population and Housing; NSW Dept of Planning and Investment
Hunter Balance Newcastle & Lake Macquarie
0-24
25-54
55-64
65+

ASIA’S DEMOGRAPHIC TRENDSFURTHER BOOST TO ‘SERVITISATION’
0
15
30
45
60
75
0
15
30
45
60
75
1950 1970 1990 2010 2030 1960 1980 2000 2020
Population share by age group
Source: United Nations World Population Prospects - 2012 Revision
China India
0-24
25-54
55-6465+

SOME COAL HARD FACTS
0
2
4
6
8
10
12
14
16
18
2012 2013 2014 2015 2016 2017 2018 2019 2020
Australian thermal coal exportsA$ billion
Sources: Department of Industry; HRF; Index Mundi
Falling export earnings despite surging tonnage

THERMAL COALCOOLING
• Coal industry: from investment to production– Latter 80% less labour intensive than former!– Lack of employment exacerbated by falling prices:
no incentive for new build
• Why are prices falling?– New supply coming online + lower demand
• (Global) oversupply will take time to reduce– Take-or-pay contracts is one barrier
• Why is demand falling?– Short- and longer-term trends– Longer-term: falling carbonised-energy intensity

LONGER-TERM ENERGY TRENDS

(1) Economic development + (2) climate concerns
ENERGY DEMAND TRENDS
0
0.1
0.2
0.3
0.4
0.5
0.6
0
0.1
0.2
0.3
0.4
0.5
0.6
1870 1890 1910 1930 1950 1970 1990 2010 2030
Energy intensity*
* Amount of oil (in tonnes) used to produce one unit of outputSource: BP
Europe
U.S.
China
NOT SO INTENSE

ELECTRICITY: WATT ABOUT IT?
• Renewable electricity generation– New generation is unprofitable (for now) due to low
demand– But longer-term ‘currents’ support renewables investment
• Longer-term currents– We all agree our manufacturing needs to be ‘advanced’– We all think more may be needed to limit global warming
• To keep the rise in global temperatures below 2-2.5 degrees
• An opportunity to invest in these trends– We have the resources in our own backyard to do this!

INVESTMENT‘SHOCKINGLY’ LOW
0
2,000
4,000
6,000
8,000
10,000
12,000
14,000
16,000
Hunter Rest of NSW Hunter Rest of NSW Hunter Rest of NSW
Installed capacity (MW)
* Coal and gas-poweredSource: NSW Trade & Investment
Renewables
Fossilfuels*
Existing Approved Planning stage

RENEWABLESA POWERFUL SURGE
0
5
10
15
20
25
30
35
0
5
10
15
20
25
30
35
1990 1994 1998 2002 2006 2010 2014 2018 2022 2026 2030 2034
Renewables’ share of electricity generation (%)
Source: BP
Europe U.S.
China

LAND USE IN THE HUNTER BALANCEAs at July 2013
Agriculture(54%)
Conservation(2%)
Urban(14%)
Mining(31%)
Sources: Australian Bureau of Statistics; HRF
HRF’s business & consumer surveys: a unique Regional asset
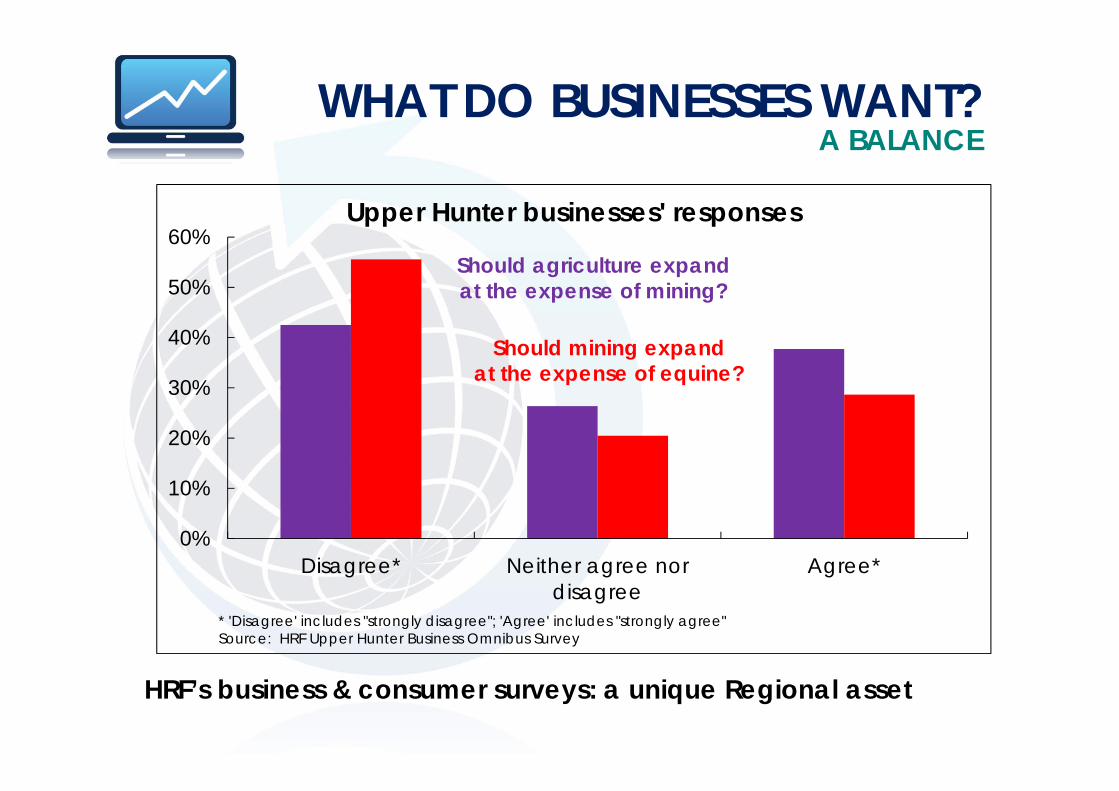
WHAT DO BUSINESSES WANT?A BALANCE
0%
10%
20%
30%
40%
50%
60%
Disagree* Neither agree nordisagree
Agree*
Upper Hunter businesses' responses
* 'Disagree' includes "strongly disagree"; 'Agree' includes "strongly agree"Source: HRF Upper Hunter Business Omnibus Survey
Should agriculture expandat the expense of mining?
Should mining expandat the expense of equine?

LAND USE CLAIMS
• Conflicting, diverse land use claims– Mining, equine, wine, agritourism– How to compare & contrast these?
• Cost-benefit analysis over the life cycle– For each (genuine) proposed use of land– Cumulative impacts; include costs of remediation– Balance short-term benefits over longer-term costs– (Opportunity) cost of forgone alternatives
• Not easy to do….but is vitally important!
A BALANCE MUST BE STRUCK

• One-on-one, interviews of 54 Hunter manufacturers• 600+ senior researcher hours• 12 advisory group stakeholders

CARPE DIEM!NEEDS STRATEGIC THINKING
• HRF’s Manufacturing Our Future project– Example of HRF’s regional research capabilities– Q: what differentiates improving from declining
manufacturers?
• What is the recipe for success?– formal strategic business plans– hooked into global supply chains and networks– focused on design and other high-value segments of
the supply chain– are innovative (e.g. technology adoption; a focus on
‘servitisation’ and customisation)
• ‘Ingredients’ are not unique to manufacturers
Delivering insights that move the Hunter forward
Thank you