future and mobility – a glimpse of future transports · case study: energy consumption for road...
TRANSCRIPT

FUTURE AND MOBILITY – A GLIMPSE OF FUTURE TRANSPORTS VOLKSWAGEN AG | KONZERNFORSCHUNG ANTRIEBE | DR. MARTIN LOHRMANN KSLA WORKSHOP │ STOCKHOLM │ 26. AUGUST 2016

2 Group Research | Energy Carriers | K-GERAB/E | Dr. Martin Lohrmann
VOLKSWAGEN GROUP RESEARCH THE BRANDS – OUR CUSTOMERS

3 Group Research | Energy Carriers | K-GERAB/E | Dr. Martin Lohrmann
HEADQUARTER Wolfsburg VTT
Technical Representative Tokyo
VRC Volkswagen Research Lab China
Shanghai
VOLKSWAGEN VARTA Microbattery/Ellwangen
CARNET Barcelona
BALLARD COOPERATION Vancouver, Kanada
ERL ELECTRONIC RESEARCH LAB
Belmont, California
VOLKSWAGEN GROUP RESEARCH RESEARCH AND DEVELOPMENT LOCATIONS

4 Group Research | Energy Carriers | K-GERAB/E | Dr. Martin Lohrmann
VALUE CREATION IN THE AUTOMOTIVE INDUSTRY IS UNDERGOING CHANGE
E-mobility
Downsizing
Plug-In-Hybrid
Digitalization
CO2-emissions
Connected Car
Car-Sharing
Battery technology
Hydrogen
Sustainability Urbanization
Major cities
Climate change
Peak Oil Lithium-ion Autonomous Driving

5 Group Research | Energy Carriers | K-GERAB/E | Dr. Martin Lohrmann
CHALLENGES CO2-REGULATION
Greenhouse-Gas II
2020 125 g CO2/km
Draft: emissions from passenger cars (Phase IV)
2020 5 l/100km
premise 2025 87 g CO2/km
premise 2025 4 l/100km
CO2-emissions from new passenger cars
2020 95 g CO2/km
premise 2025 ≤ 78 CO2/km
Europe USA China

6 Group Research | Energy Carriers | K-GERAB/E | Dr. Martin Lohrmann
2010 2050
Fuel
con
sum
ptio
n [l/
100k
m]
FUEL TRENDS FOR TRANSPORT
politics mileage efficiency
busin
ess e
nviro
nmen
t
2010 2050
-70%
Tota
l EU
tran
spor
t CO
2 em
issio
ns [t
]
2010 2050
Tota
l tra
nspo
rt m
ileag
e [k
m]
fuel
tren
ds
(1) Electrification of transport
(2) CO2-reduced fuels for transport

7 Group Research | Energy Carriers | K-GERAB/E | Dr. Martin Lohrmann
CASE STUDY: ENERGY CONSUMPTION FOR ROAD TRAFFIC IN THE EU* FUEL TRENDS FOR PRIVATE AND COMMERCIAL TRANSPORT
fossil fuels CO2-reduced fuels electric mobility
2010 2050
Ener
gy c
onsu
mpt
ion
road
traf
fic E
U
[Mto
e]
2030
100
200
300 Political target*: reduction of GHG-emissions of transport by 70%
The use of fossil fuels for road traffic needs to be reduced to one third until 2050.
* 2011 EU WHITE PAPER: Roadmap to a Single European Transport Area – Towards a competitive and resource efficient transport system
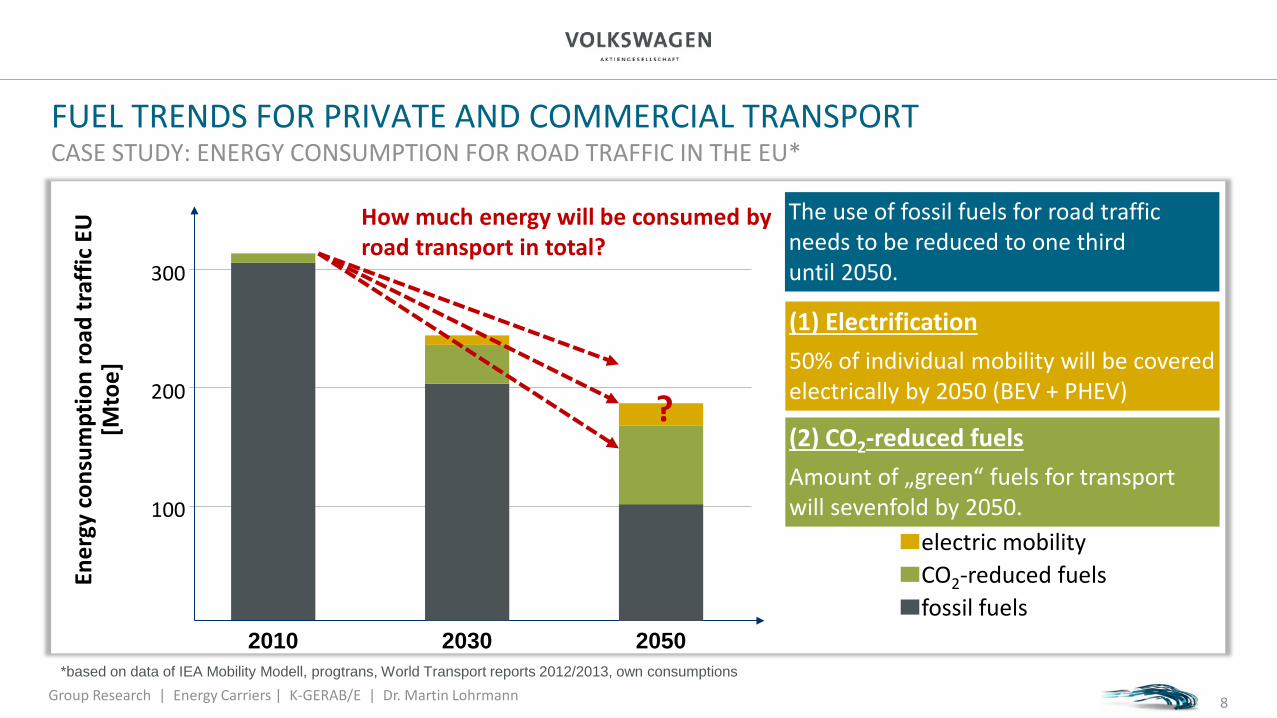
8 Group Research | Energy Carriers | K-GERAB/E | Dr. Martin Lohrmann
fossil fuels CO2-reduced fuels electric mobility
(1) Electrification 50% of individual mobility will be covered electrically by 2050 (BEV + PHEV)
How much energy will be consumed by road transport in total?
2010 2050
Ener
gy c
onsu
mpt
ion
road
traf
fic E
U
[Mto
e]
2030
100
200
300
? (2) CO2-reduced fuels Amount of „green“ fuels for transport will sevenfold by 2050.
The use of fossil fuels for road traffic needs to be reduced to one third until 2050.
CASE STUDY: ENERGY CONSUMPTION FOR ROAD TRAFFIC IN THE EU*
FUEL TRENDS FOR PRIVATE AND COMMERCIAL TRANSPORT
*based on data of IEA Mobility Modell, progtrans, World Transport reports 2012/2013, own consumptions

9 Group Research | Energy Carriers | K-GERAB/E | Dr. Martin Lohrmann
CASE STUDY: ENERGY CONSUMPTION FOR ROAD TRAFFIC IN THE EU* FUEL TRENDS FOR PRIVATE AND COMMERCIAL TRANSPORT
fossil fuels CO2-reduced fuels electric mobility
(1) Electrification 50% of individual mobility will be covered electrically by 2050 (BEV + PHEV)
2010 2050
Ener
gy c
onsu
mpt
ion
road
traf
fic E
U
[Mto
e]
2030
100
200
300
(2) CO2-reduced fuels Amount of „green“ fuels for transport will sevenfold by 2050.
The use of fossil fuels for road traffic needs to be reduced to one third until 2050.
*based on data of IEA Mobility Modell, progtrans, World Transport reports 2012/2013, own consumptions

10 Group Research | Energy Carriers | K-GERAB/E | Dr. Martin Lohrmann
E-GOLF TODAY
Technical Data
Maximum speed: 140 km/h
Electric motor: 85 kW
Torque: 270 Nm
Consumption, NEFZ: 12.7 kWh/100 km
Electrical range (NEFZ): 190 km
Energy content battery 24.2 kWh

11 Group Research | Energy Carriers | K-GERAB/E | Dr. Martin Lohrmann
LITHIUM-ION BATTERY: ROADMAP FOR HIGH-ENERGY BATTERIES
Conventional lithium-ion technology
All-electric range in km **
2010 2020
* Energy density per cell ** Based on a battery with a cell volume of approx. 100 litres
100
200
300
400
500
600
2030
700
190 km 260 Wh/L*
300 km 380 Wh/L*
11 Powertrain research
Timescale research level

12 Group Research | Energy Carriers | K-GERAB/E | Dr. Martin Lohrmann
BEYOND LITHIUM-ION BATTERY: SOLID STATE BATTERY Solid-state battery
New battery technologies
Conventional lithium-ion technology
All-electric range in km **
2010 2020
* Energy density per cell ** Based on a battery with a cell volume of approx. 100 litres
100
200
300
400
500
600
2030
700
190 km 260 Wh/L*
300 km 380 Wh/L*
380 km 510 Wh/L*
500 km 650 Wh/L* 700 km
1000 Wh/L*
12 Powertrain research
Timescale research level

13 Group Research | Energy Carriers | K-GERAB/E | Dr. Martin Lohrmann
Access charging station Standardized authentication and billing
Charging interface Worldwide standardization of the charging plug
Charging capacity HV-batteries with high energy content require higher charging capacities.
Regenerative energy Further expansion of CO2-neutral mobility
Charging infrastructure Extensive provision of charging stations
Charging comfort Automatic charging via induction
Operation Economic efficiency of operation of charging stations
CHALLENGES OF CHARGING

14 Group Research | Energy Carriers | K-GERAB/E | Dr. Martin Lohrmann
ASSUMPTION: 5 % OR 30 % BEV IN 2030 HIGHWAY INFRASTRUCTURE FOR BEVS*
Influence of vehicle range
Example: highway trip
BEV (2030)
Gasoline / Diesel
Refueling at service area necessary Route without refueling
Number of refueling operations is increasing Individual demand adaption
charging time ~15 minutes for 80% state-of-charge Stressing of the battery
Fast-charging stations (200kW)
− −
current parking placeper service area
DC charging stations
5 % BEV: 14
70
30 % BEV: 103
+
Connecting power from the grid for service areas of 2.5 MW for 5 % BEV and 20 MW for 30 % BEV in 2030 is required!
* assuming 500km NEFZ-range in 2030

15 Group Research | Energy Carriers | K-GERAB/E | Dr. Martin Lohrmann
FUEL CELL
Volkswagen NMS HyMotion
Audi A7 Sportback h-tron quattro

16 Group Research | Energy Carriers | K-GERAB/E | Dr. Martin Lohrmann
HYMOTION4 – TWO VEHICLE CONCEPTS WITH ONE FUEL-CELL SYSTEM FOURTH GENERATION OF FUEL CELL VEHICLES IN VOLKSWAGEN GROUP RESEARCH
HyMotion 4 Performance: 80 kW
E-machine: 100 kW vmax: 160 km/h 0-100 km/h: 12 sec Range: 420 km Battery: 1.1 kWh
E-machine: 2 x 85 kW vmax : 180 km/h 0-100 km/h: 8 sec Range: > 500 km Battery: 9.5 kWh
Audi A7 Sportback h-tron quattro Volkswagen NMS HyMotion

17 Group Research | Energy Carriers | K-GERAB/E | Dr. Martin Lohrmann
HYDROGEN TECHNOLOGY ROADMAP (INTERNATIONAL ENERGY AGENCY – IEA)
“Based on the scenario results […], the market for passenger FCEVs could be fully sustainable 15 years after introduction of the first 10 000 FCEVs.“ Requirements • Fuel/energy tax exemption • No car and registration taxes • Rapid market penetration supported by
subsidies for customer, OEM and infrastructure
[U
SD/k
m]
Source: IEA 2015, Technology Roadmap, Hydrogen and Fuel Cells

18 Group Research | Energy Carriers | K-GERAB/E | Dr. Martin Lohrmann
0%
20%
40%
60%
80%
100%M
cK IC
E
McK
EV
McK
FC
V
IPC
C 2
100
Frau
nhof
er M
ediu
m
Frau
nhof
er 4
50pp
m
Frau
nhof
er 4
00pp
m
IEA
2DS
NR
C e
ffici
ency
onl
y
NR
C P
EV
inte
nsiv
e
NR
C F
CV
inte
nsiv
e
NR
C C
NG
inte
nsiv
e
WE
C F
reew
ay
WE
C T
ollw
ay
Existing scenarios
Shar
e of
veh
icle
s or
trac
tion
Batteries
Hydrogen
Fuels
MOBILITY SCENARIOS 2050
Source: McKinsey & Company (2010), Palzer & Henning (2014), IPCC (2014), Schade et. Al. (2010), IEA (2012), NRC (2013), WEC (2011)
Fuels including hybridisation
PHEV: 50% Battery, 50% Fuel
0%
20%
40%
60%
80%
100%
Mean

19 Group Research | Energy Carriers | K-GERAB/E | Dr. Martin Lohrmann
Diesel Hybrid Truck
ENERGY CARRIER TRENDS IN CARGO AND PASSENGER TRANSPORTATION
Catenary Truck
CNG City Bus Battery / Fuel Cell City Bus

20 Group Research | Energy Carriers | K-GERAB/E | Dr. Martin Lohrmann
fossil fuels CO2-reduced fuels electric mobility
(1) Electrification 50% of individual mobility will be covered electrically by 2050 (BEV + PHEV)
2010 2050
Ener
gy c
onsu
mpt
ion
road
traf
fic E
U
[Mto
e]
2030
100
200
300
(2) CO2-reduced fuels Amount of „green“ fuels for transport will sevenfold by 2050.
The use of fossil fuels for road traffic needs to be reduced to one third until 2050.
*based on data of IEA Mobility Modell, progtrans, World Transport reports 2012/2013, own consumptions
CASE STUDY: ENERGY CONSUMPTION FOR ROAD TRAFFIC IN THE EU* FUEL TRENDS FOR PRIVATE AND COMMERCIAL TRANSPORT

21 Group Research | Energy Carriers | K-GERAB/E | Dr. Martin Lohrmann 21
CO2-REDUCED FUELS
CO2
Photosynthesis Decomposition of biomass
Conversion to fuel
Combustion

22 Group Research | Energy Carriers | K-GERAB/E | Dr. Martin Lohrmann
CO2-REDUCED FUELS
Biomass
Biomass-to-Liquid
Ethanol Biomethane
Hydrotreated vegetable oil (HVO)
CO2 / Light Green Electricity Algae
based fuels
Power-to- Liquid
Power- to-Gas

23 Group Research | Energy Carriers | K-GERAB/E | Dr. Martin Lohrmann
CLASSIFICATION OF BIOFUELS AND THEIR COMPETITION
Type Example No competition with
• Conversion/use of sugar, starch and oil
• Conversion of cellulose
• Conversion of cellulose from residues via algae/bacteria/yeast
• „Green” electricity as basis • Modified photosynthesis with algae
or bacteria
• Ethanol from sugar beets, wheat • HVO** from rape seed
• Biomethane from grass silage • Diesel from wood
• Ethanol from straw • Biomethane from straw • Diesel from residual wood
• Power-to-Fuel / E-Gas • Ethanol
Evo
lutio
n pa
thw
ay o
f bio
fuel
s
food land use* biomass
* Agricultural land ** HVO Hydrotreated Vegetable Oil
24 Group Research | Energy Carriers | K-GERAB/E | Dr. Martin Lohrmann
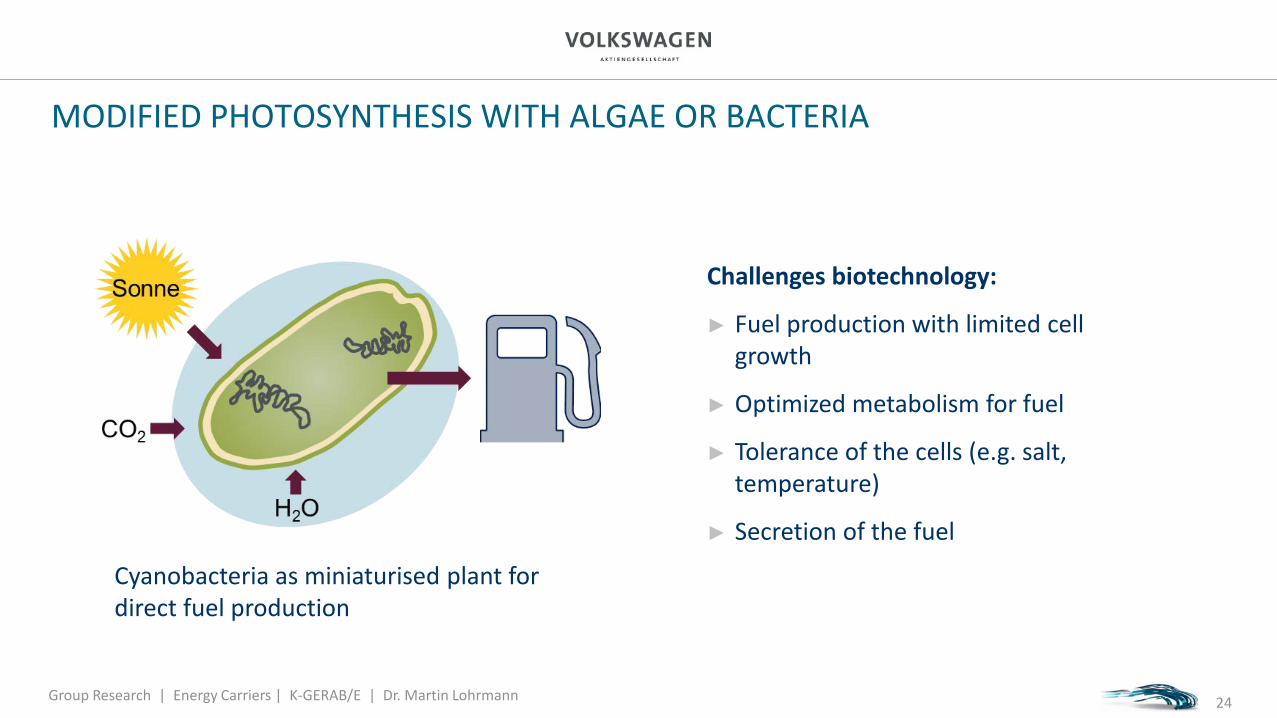
MODIFIED PHOTOSYNTHESIS WITH ALGAE OR BACTERIA
Challenges biotechnology:
► Fuel production with limited cell growth
► Optimized metabolism for fuel
► Tolerance of the cells (e.g. salt, temperature)
► Secretion of the fuel
Cyanobacteria as miniaturised plant for direct fuel production
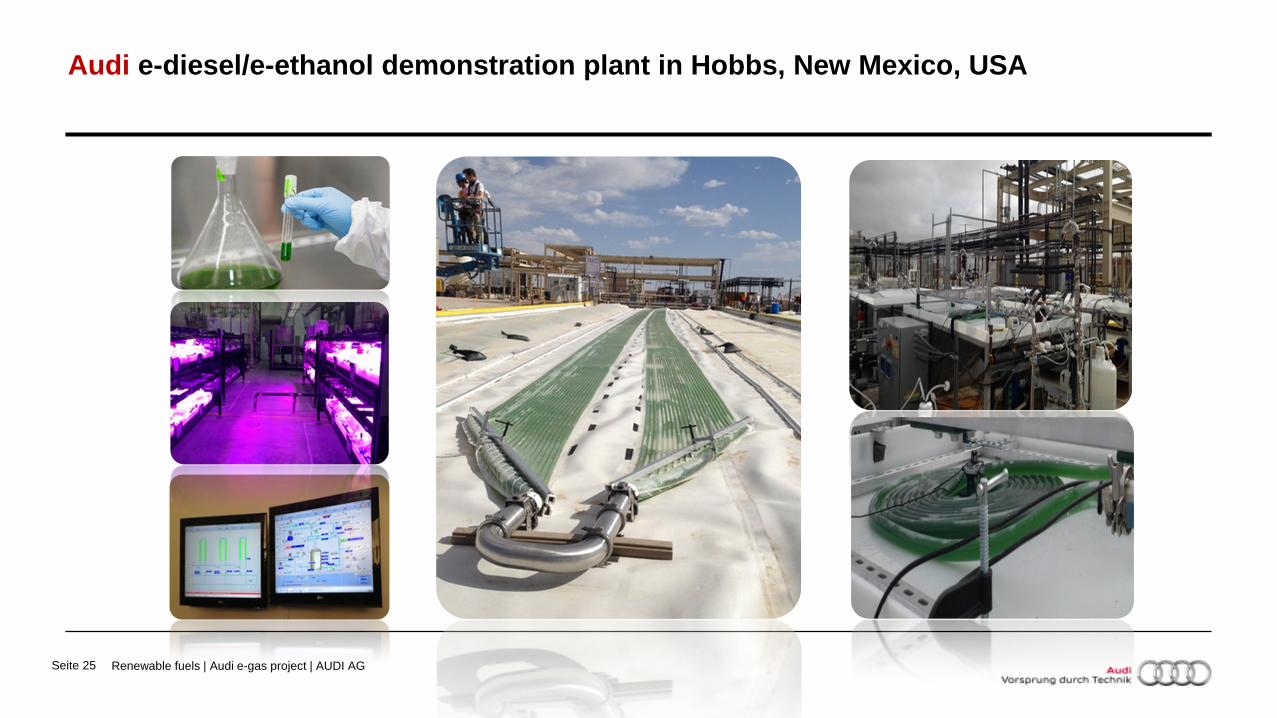
25 Renewable fuels | Audi e-gas project | AUDI AG Seite
Audi e-diesel/e-ethanol demonstration plant in Hobbs, New Mexico, USA

26 Group Research | Energy Carriers | K-GERAB/E | Dr. Martin Lohrmann
Fischer-Tropsch synthesis
CxHy H2
Diesel filling station
Grid “Green” electricity Charging station
Electricity Electricity
Methanation
H2
Methane storage / Natural gas network
Natural gas filling station
CH4
CO2 Direct feeding
The question of future vehicle concepts can only be answered in context with future energy solutions of the energy sector.
Power plant
H2
Power plant
CH4
Electricity
Electrolysis
H2 storage H2 filling station
H2
H2 Electricity
OPTIONS FOR STORING AND USING „GREEN“ ELECTRICITY

27 Renewable fuels | Audi e-gas project | AUDI AG Seite
Power-to-Gas: Audi e-gas plant | Werlte (Germany) Q
uelle
: EW
E N
etz

28 Renewable fuels | Audi e-gas project | AUDI AG Seite
Electrolysis & Methanisation Unit
29 Renewable fuels | Audi e-gas project | AUDI AG Seite
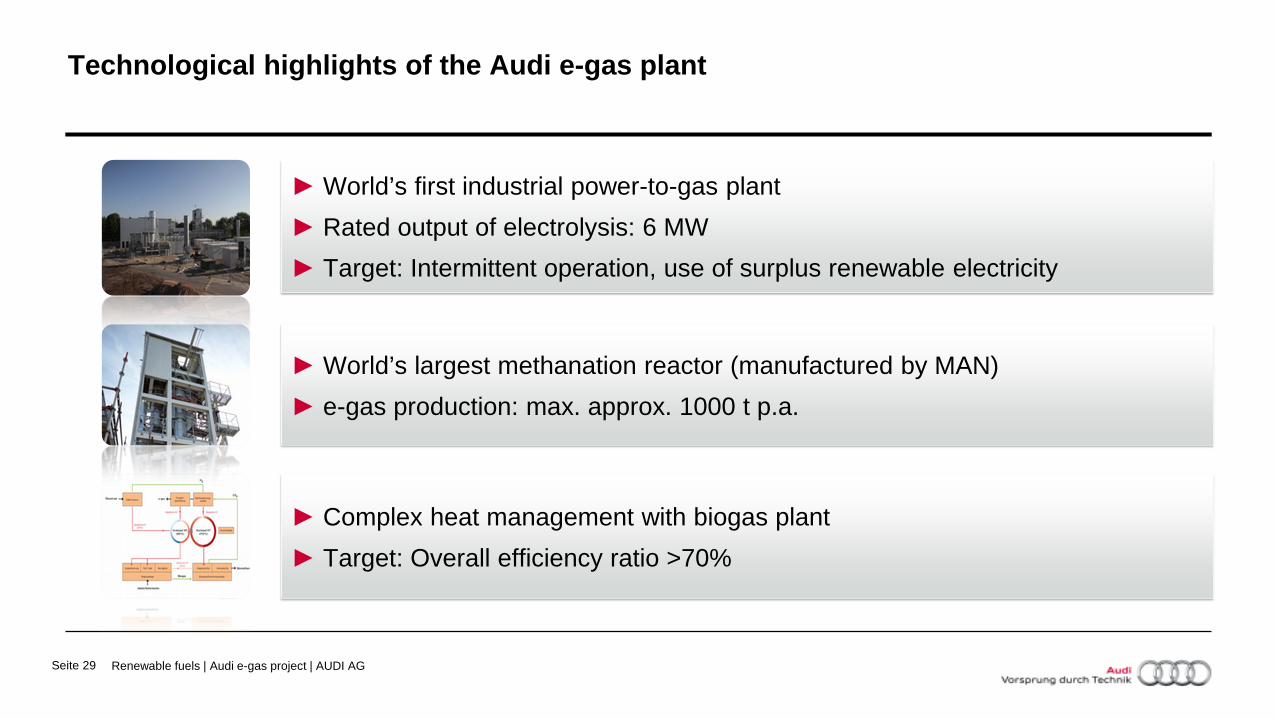
Technological highlights of the Audi e-gas plant
► Complex heat management with biogas plant ► Target: Overall efficiency ratio >70%
► World’s largest methanation reactor (manufactured by MAN) ► e-gas production: max. approx. 1000 t p.a.
► World’s first industrial power-to-gas plant ► Rated output of electrolysis: 6 MW ► Target: Intermittent operation, use of surplus renewable electricity

30 Group Research | Energy Carriers | K-GERAB/E | Dr. Martin Lohrmann
POSSIBLE EVOLUTION OF SUSTAINABLE ENERGY FOR THE AUTOMOTIVE SECTOR
REEV
FCEV
BEV
ICE
Hybrid
Ene
rgy
(100
%)
Conventional fuels
Biofuels
Short distance mobility
Electricity
Long distance mobility
2010 2040 2020 2030

31 Group Research | Energy Carriers | K-GERAB/E | Dr. Martin Lohrmann
THANK YOU FOR YOUR ATTENTION!