further investigation of capillary electrophoresis for pharmaceutical analysis
TRANSCRIPT

DCU
Dubl in City University Ol lscoi l Chatha i r Bha i l e Atha Cl iath
FURTHER INVESTIGATION OF
CAPILLARY ELECTROPHORESIS FOR
PHARMACEUTICAL ANALYSIS
Thesis submitted for the Degree of Doctor of Philosophy
Under the supervision of Dr. Fiona Regan
Dublin City University

1 hereby c e w that this ma€e~M, which I mtw submit for wewnent on @
progmme of study leading to the award dfPhD is mWy my own work and bebs not
b m n tdcm b r n the work of othem save and to the extat ti& such wmk has been citgd and ahmkdged wit& the text ofmy w d .
S i p d . y&zd, 0 ddh&A~ -. C - D No.: 53 f3 587 3
Dat, rq/@s/w F

T would like to thank my supervisor Dr. Fiona Regan for giving me the
opportunity to do this P W , for oRm required guidance and very much appreciated
help during last 4 years.
Thank you to my husband, Evan, for all his constant support, patience,
discussions and other important contributions to this thesis.
Thank you to my parents for their moral support and worries and for letting
me to do chemistry 10 years age. Thank you to my sister for believing in me at all
times.
Thank you to Keith, Katia, Frank, Michael, GiIl and Blmaid for relevant
scimtific (and t~an-scientific) discussions during our time at DCU.
Thank you to all technical staff of School of Chemical Science in DCU.

TABLE OF CONTENTS
Title page
Declaration
Acknowledgements
Table of contents
Abbreviations
Thesis abstract
Appendix
Chapter l
INTRODUCTION
1.1 TRENDS IN MODERN PHARMACEUTICAL ANALYSIS
1.1,l Separation techniques
1.1.2 Non-separation techniques
1.1.3 Combination techniques
1.1.4 High-throughput analysis
1 .l. 5 Purity analysis
1.1.6 Quantitative analysis
1.1.7 Miniaturisation
1.1.8 Nanotechnology
1.2 HPLC IN PHARMACEUTICAL ANALYSIS
1.2.1 Separation in HPLC
1.2.2 Detection in HPLC
1.2.3 Method validation
1.2.4 HPLC for the separation of chiral pharmaceuticals
1.3 PRINCIPLES OF CAPILLARY ELECTROPHORESIS
1.3.1 Introduction
1.3.2 Components of a CE system
i
ii
iii
iv
xii
xiv
A

1.3.3 Electrophoretic migration
1.3.4 Electroosmotic flow
1.3.5 Analytical parameters
1.4 VERSATILITY OF CE
1.4.1 Capillary zone electrophoresis
1.4.2 Micellar Electrokinetic Chromatography
1.4.2.1 Micelles
1.4.2.2 Mechanism of separation
1.4.2.3 Surfactants
1 -4.3 Chiral separation
1.4.3.1 Chiral selectors
1.4.3.1.2 Cyclodextrins
1.4.3.3 Cyclodextrin derivatives
1.4.3.4 Mechanism of separation
1.4.3.5 CD-modified MEKC
1.4.4 Microemulsion electrokinetic chromatography
1.4.4.1 Microemulsions
1.4.4.2 Mechanism of separation
1.5 IMPROVING SENSITIVITY IN CE
1 -5.1 CE detection
1.5.2 On-line capillary pre-concentration methods
1.6 THE ADVANTAGES OF CE IN THE ANALYSIS OF
PHARMACEUTICALS
1.6.1 Determination of pharmaceutical content
1.6.2 Determination of drug-related impurities
1.6.3 Chiral separations
1.6.4 Bioanalysis of pharmaceuticals
1.6.5 Physicochemical measurements
1.7 CONCLUSIONS AND THESIS OUTLINE
1.8 REFERENCES

Chapter 2 63
RAPID SIMULTANEOUS DETERMINATION OF ALKYLXANTHINES BY
CZE
2.1 INTRODUCTION
2.1.1 Alkylxanthines
2.1.2 Alkylxanthines in treatment of asthma
2.1.3 Determination of alkylxanthines in real samples
2.1.3.1 Chromatographic methods
2.1.3.2 Capillary electrophoresis
2.1.3.3 Spectroscopic methods
2.1.4 Observations
2.1.5 Aim of this study
2.2 EXPERIMENTAL
2.2.1 Instrumentation
2.2.2 Reagents
2.2.3 Standards
2.2.4 Sample preparation
2.2.4.1 Chocolate
2.2.4.2 Pharmaceutical tablets
2.2.5 Procedure
2.3 RESULTS AND DISCUSSION
2.3.1 Buffer study
2.3.1.1 Buffer selection
2.3.1.2 Buffer pH
2.3.1.3 Buffer concentration
2.3.1.4 Ohm's law plot
2.3.1.5 Optimizing the separation
2.3.2 Study of capillary conditions
2.3.2.1 Capillary length

2.3.2.2 Temperature effect
2.3.2.3 Injection type
2.3.3 Other parameters of separation
2.3.3.1 Rinsing between runs
2.3.3.2 Calibration
2.3.3.3 Precision of the method
2.3.3.4 LOQs and LODs
2.3.4 Application to real samples
2.3.4.1. Chocolate
2.3.4.2 Pharmaceuticals
2.4 CONCLUSIONS
2.5 REFERENCES
Chapter 3 114
DETERMINATION OF ASSOSIATION CONSTANTS OF INCLUSION
COMPLEXES OF STEROID HORMONES AND CYCLODEXTRINS
3.1 INTRODUCTION
3.1.1 Estrogens
3.1.2 Determination of estrogens
3.1.2.1 Biological assay
3.1.2.2 HPLC
3.1.2.3 Gas chromatography
3.1.2.4 Capillary electrophoresis
3.1.3 The role of cyclodextrins in the analysis of estrogens
3.1.4 Theory of CE separation with cyclodextrin
3.1.5 Aim of this work
3.2 EXPERIMENTAL
3.2.1 Equipment
vii

3.2.2 Reagents
3.2.3 Standards
3.2.4 Separation conditions
3.3 RESULTS AND DISCUSSION
3.3.1 Initial conditions
3.3.2 a-CD
3.3.3 y-CD
3.3.4 P-CD
3.3.5 2HP-y-CD and 2HP-P-CD
3.3.6 The effect of SDS
3.4 CONCLUSIONS
3.5 REFERENCES
Chapter 4 154
DETERMINATION OF MONTELUKAST SODIUM AND SIGNIFICANT
IMPURITIES
4.1 INTRODUCTION
4.1.1 Montelukast
4.1.2 Montelukast in treatment of asthma
4.1.3 Determination of Montelukast
4.1.4 Aim of this work
4.2 EXPERIMENTAL
4.2.1 HPLC instrumentation
4.2.2 CE instrumentation
4.2.3 Reagents
4.2.4 Standards
4.2.5 Procedure
4.3 RESULTS AND DISCUSSION
. . . Vl l l

4.3.1 HPLC
4.3.2. CZE separation
4.3.3 MEKC
4.3.4 CD-MEKC
4.3.4.1 The type of cyclodextrin
4.3.4.2 Identification of montelukast
4.3.4.3 Concentration of cyclodextrins
4.3.4.4 The effect of organic solvent
4.3.4.5 Concnetration of SDS
4.3.4.6 Purity of montelukast peak
4.3.4.7 Validation of the method
4.3.4.8 Temporal study of the degradation of montelukast
4.3.5 Comparison of HPLC and CE methods
4.4 CONCLUSIONS
4.5 REFERENCES
Chapter 5 190
SIMULTANEOUS SEPARATION OF ANTHRACYCLINES AND TAXANES
BY CAPILLARY ELECTROPHOERSIS
5.1 INTRODUCTION
5.1.1 Anthracyclines
5.1.2 Taxanes
5.1.3 Combination therapy of anthracyclines and taxanes
5.1.4 Methods for identification of anthracyclines and taxanes
5.1.4.1 Sample preparation
5.1.4.2 Chromatographic methods
5.1.4.3 Capillary electrophoresis
5.1.5 Observations

5.1.6 Aim of this work
5.2 EXPERIMENTAL
5.2.1 CE instrumentation
5.2.2 Reagents
5.2.3 Standards
5.2.4 Plasma sample preparation
5.2.4.1 Direct plasma injection
5.2.4.2 Plasma pretreatment
5.2.5 Procedure
5.3 RESULTS AND DISCUSSION
5.3.1 Separation of anthracyclines and taxanes by CZE
5.3.2 Separation of anthracyclines and taxanes by MEKC
5.3.2.1 The effect of SDS on the separation of analytes
5.3.2.2 Effect of sample matrix
5.3.2.3 Effect of the pH
5.3.3 Separation of anthracyclines and taxanes by MEEKC
5.3.3.1 Effect of separation voltage
5.3.3.2 Effect of oils on the analyte's separation
5.3.3.3 Effect of organic solvent on the analyte's separation
5.3.3.4 Effect of SDS concentration on the analyte's separation
5.3.3.5 Effect of co-surfactant on analyte's separation
5.3.3.6 The effect of temperature on the analyte's separation
5.3.3.7 The optimum composition of microemulsion
5.3.4 Separation of anthracyclines and taxanes by high-speed MEEKC
5.3.4.1 Effect of organic solvent on the analyte's separation
5.3.4.2 Optimisation of the separation
5.3.4.3 Choice of the internal standard
5.3.4.4 Application of the method to different anthracyclines
and taxanes
5.3.4.5 Method precision
5.3.4.6 Sensitivity of the method

5.3.5 Application to plasma samples
5.3.5.1 Direct plasma injection
5.3.5.2 Separation OF pretreated ptasma
5.4 CONCLUSIONS
5.5 RErnRENCES
Chapter 6
CONCLUSIONS AND FUTURE WORK
6.1 PROGRESSION OF THE RESEARCH 256
6.1.1 CE in the analysis of alkylxanthines 256
6. I .2 Analysis of the association complexes of steroids and
Cyclodextrins 256
6.1.3 Determination of montelukast sodiun~ and related compounds 257
6.1.4 CE for the si~nultaneous determination of anthracyclines and
taxanes 258
6.2 CONCLUSIONS 259

ABBREVIATIONS
ADME - Absorption, Distribution, Metabolism and Elimination,
APCI - Atomic Pressure Chemical Ionization,
BGE - Background Electrolyte,
CAPS - Cyclohexylamino- 1 -propane sulfonic acid,
CD - Cyclodextrin,
CE - Capillary Electrophoresis,
CEC - Capillary Electrochromatography,
CGE - Capillary Gel Electrophoresis,
CLND- Chemiluminescent Nitrogen Detection,
CMC - Critical Micelle Concentration,
CTAB - Cetyltrimethylammonium bromide,
c-SWNT - carboxylic Single-Walled Carbon Nanotubes,
CZE - Capillary Zone Electrophoresis,
DAU - Daunorubicin,
DI - Direct Injection,
DOX - Doxorubicin,
DS - Degree of Substitution,
DTAB - Dodecyltrimethylarnmonium bromide,
EA - Ethyl Acetate,
ECL - Eelectrochemiluminescence,
EDC - Endocrine Disrupting Compounds,
ELSD - Evaporative Light-Scattering Detection,
EPI - Epirubicin,
ESI - Electrospray Ionisation
EOF - Electroosmotic Flow,
EP - European Pharmacopoeia,
FIA - Flow Injection Analysis,
FT - Fourier Transform,
GC - Gas Chromatography,
HEPES - N-2-Hydroxyethylpiperazine-N'-2-ethanesulfonic acid,
xii

HP - hydroxypropyl,
HPLC - High Performance Liquid Chromatography,
IDA - Idarubicin,
IF - Isoelectric Focusing,
IS - Internal Standard,
ITP - Isotachophoresis,
IR - Infrared,
LIF - Laser Induced Fluorescence,
LLE - Liquid-liquid extraction,
LOD - Limit of Detection,
LOQ - Limit of Quantitation,
MALDI - Matrix-Assisted Laser Desorption/Ionisation,
MEEKC - Microemulsion Electrokinetic Chromatography,
MEKC - Micellar Electrokinetic Capillary Chromatography,
MES - 2-(N-Morpho1ino)-ethanesulfonic acid,
MK - Montelukast sodium
MS - Mass Spectrometry,
NIR - Near-Infrared,
NMR - Nuclear Magnetic Resonance,
pcSFC - packed column Supercritical Fluid Chromatography,
PIPES - Piperazine-N,N'-bis(ethanesu1fonic acid),
RSD - Relative Standard Deviation,
RTP - Room Temperature Phosphorescence,
SBE - sulfobutylether
SDS - Sodium Dodecyl Sulphate,
SFC - Supercritical Fluid Chromatography,
SPE - Solid Phase Extraction,
TLC - Thin-Layer Chromatography,
Tris - Tris-(hydroxymethyl)aminomethane,
USP - United States Pharmacopoeia,
UV - Ultraviolet.
. . . Xll l

Thesis abstract
The literature review reveals current analytical methodologies used for
pharmaceutical analysis, their advantages and disadvantages. In this context the
potential of capillary electrophoresis (CE) is established through a study of the
current literature. Capillary electrophoresis method is developed and optimised for
alkylxanthines. The achieved separation for these analytes stands out for its high
efficiency and especially short analysis time. This work also verifies the potential of
CE in the analysis of significant impurities in montelukast sodium - an active
ingredient for treatment of bronchial asthma. The obtained method surpasses a
chromatographic method currently employed in the pharmaceutical industry in terms
of efficiency and time of analysis.
Along with the method development this work shows the capability of CE as
a fundamental research tool. The determination of the association constants of steroid
hormones with cyclodextrins is successfully achieved from the electrophoretic
mobilities. A range of different types of natural and derivatised cyclodextrins is
investigated. This straightforward approach marks the first time CE has been used for
the assessment of steroid/cyclodextrin interaction. For the first time the versatility of
CE is demonstrated in the separation of different types of anticancer drugs -
anthracyclines and taxanes. The high hydrophobicity of the drugs requires detailed
investigation of suitable buffer composition with additives of miscellaneous
component and organic phase. The use of these drugs in combination therapy sparked
the interest in this application and this study shows the potential of CE for such a
challenge. To demonstrate the potential an attempt is made to apply the developed
electrophoretic methods to the analysis of plasma samples.
xiv

CHAPTER 1
INTRODUCTION

chromatography, ultrathin layers and ultrafine particle coating has brought TLC to
higher resolution and speed of analysis. It has found application in the separation
of impurities [9] and degradation products of drugs [lo] and in the analysis of
herbal extracts [ l 11.
Whilst being an established tool in the analysis of biopolymers, the
potential of capillary electrophoresis has not yet been fully realised in
pharmaceutical analysis. CE, as a method for drug testing, was introduced for the
first time in European Pharmacopoeia (EP)-Supplement only in 2001 [12]. While
there is an increasing number of the capillary electrophoretic methods being
developed for various drugs and being published in the literature, the number of
drug-related method in pharmacopoeias is limited [ 131. Different separation
options available in CE cover all possible application areas, such as the separation
of polar, non polar compounds, charged or neutral, structurally related and optical
isomers.
1.1.2 Non-separation techniques
The non-separation methods [14] employed in pharmaceutical analysis
include spectroscopic methods, such as nuclear magnetic resonance (NMR), MS,
infrared (IR) and near-infrared (NIR) spectroscopy, ultra violet spectroscopy,
fluorimetry and Raman spectroscopy. Titrations, electroanalytical methods, flow-
injection analysis (FIA), microbiological methods and irnrnunoassays are also
used in the analysis of pharmaceuticals. As the focus of this work is on the
separation techniques, these methods will not be expanded further.
1.1.3 Combination techniques
The increasing complexity of pharmaceutical research has led to the
development and application of multidimensional separation methods and
hyphenated techniques. The combination of analytical techniques is especially
powerful as it utilises the advantages of each technique in order to determine
identity and purity. Figure 1.1 shows the examples of hyphenated techniques. The
coupling of GC and MS in the 1960s was the first successful attempt of the new

era of analysis [15]. Using MS or NMR as the detection method potentially
affords a higher throughput due to the ability of these techniques to selectively
and simultaneously detect multiple components. With the development of soft
ionisation methods, such as electrospray ionisation (EST) and matrix-assisted laser
desorptiodionisation (MALDI), the success of MS has spread to the fields of
biomedical and biological research [16]. Currently, the combination of MS with
different chromatographic methods offers some of the most powerful techniques
for pharmaceutical analysis [17]. HPLC-MS has proven to be one of the most
valuable techniques and has been applied to the analysis and identification of
impurities and degradation products in pharmaceuticals [18], the analysis of chral
impurities [19], the study of drug metabolism [20], high-throughput analysis of
drugs and metabolites [21].
HPLC-DAD
CE-DAD
HPLC-Fluorescence
CE-Fluorescence
GC-MS
HPLC-MS*
CE-MS*
HPLC-NMR
CE-NMR
HPLC-NMR-MS
HPIC-ICP-SFMS
CE-ICP-SFMS
GC-ECDIICP-MS
HPLCIHPLC-MSIMS
-MS with different ionisation techniques, such as ESI and TSP.
Abbreviations: DAD - diode array detector, HPIC - high-performance ion chromatography, ICP - inductively coupled plasma, SFMS - sector field mass spectrometry,-TSP - thermospray, ECD - electron capture detector.
Figure 1.1. Examples of combination analytical techniques.

1.1.4 High-throughput analysis
The principal aim of the pharmaceutical sector of accelerating drug
discovery and ultimately reducing the cost associated with bringing a new
medicine to the market determined the expansion of the area of high-throughput
analysis [22]. In order to identify the most suitable drug candidates, it has been
recognised that investigation of absorption, distribution, metabolism and
elimination (ADME) should be initiated at an early stage of the discovery process
[23]. This allows unsuitable compounds to be eliminated and thus reduces the
development cost. Due to the large number of unsuitable compounds that are now
routinely identified from screening compound collections and gene family
compound libraries, the industry has recognised the need for high-throughput
ADME assays [23]. High-throughput techniques have been employed in the
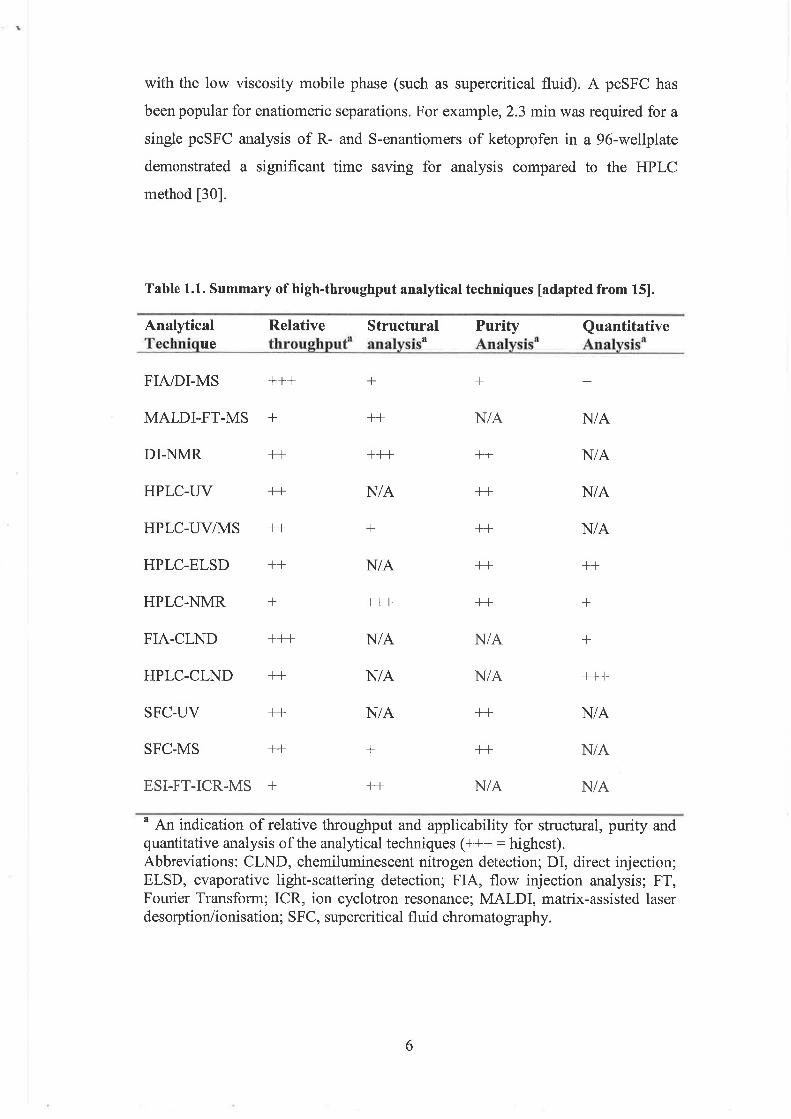
determination of structure, purity and quantitative measurements [24]. Table 1.1
surnmarises the techniques involved in high-throughput pharmaceutical analysis.
The majority of current protocols for high-throughput analysis are based on 96
microtiter well plate technology where a large number of samples can be
processed in parallel. For example, only 5 min is required to analyse the entire 96-
well sample plate (3.1 sec per sample analysis) by FIA-MS. Assay formats such
as 1536 well plate are becoming more acceptable in ultrahigh-throughput analysis
[261
1.1.5 Purity analysis
HPLC is a universal method for high-throughput purity analysis. The
increase in throughput is due to the reduction of cycle times and the development
of generic analytical methods [24]. The advances in HPLC technology have been
in response to the demand of today's pharmaceutical industry for high-speed
analysis [27]. Small quantities of impurities and degradation products present in
the bulk drug require very sensitive and specific detection; thus, MS detection is
often employed in combination with HPLC separation [18, 281. HPLC-MS is also
very powerful for high-throughput purity analysis [28]. A gradient packet column
supercritical fluid chromatography (pcSFC) has shown 10 times faster analysis
than HPLC [29]. This can be achieved in SFC due to the high flow rates available
with the low viscosity mobile phase (such as supercritical fluid). A pcSFC has
been popular for enatiomeric separations. For example, 2.3 min was required for a
single pcSFC analysis of R- and S-enantiomers of ketoprofen in a 96-wellplate
demonstrated a significant time saving for analysis compared to the HPLC
method [3 01.
Table 1.1. Summary of high-throughput analytical techniques [adapted from 151.
Analytical Relative Structural Purity Quantitative Technique throughpaf analysisa Analysisa Analysisn
MALDI-FT-MS + ++ N/ A N/A
DI-NMR ++ +++ ++ N/A
HPLC-UV ++ N/A ++ N/ A
HPLC-ELSD ++ NIA ++ +-t
HPLC-NMR + +++ ++ +
FIA-CLND +++ N/ A N/A +
HPLC-CLND ++ NI A N/A +t+
SFC-UV ++ N/A ++ N/ A
SFC-MS ++ + ++ NIA
ESI-FT-ICR-MS + +t NIA N/ A
a An indication of relative throughput and applicability for structural, purity and quantitative analysis of the analytical techniques (+++ = highest). Abbreviations: CLND, chemiluminescent nitrogen detection; DI, direct injection; ELSD, evaporative light-scattering detection; FIA, flow injection analysis; FT, Fourier Transform; ICR, ion cyclotron resonance; MALDI, matrix-assisted laser desorption/ionisation; SFC, supercritical fluid chromatography.

1.1.6 Quantitative analysis
Quantitative analysis in the pharmaceutical industry can be accomplished
in a high-throughput mode. Evaporative light scattering detection (ELSD) in
combination with HPLC separation is an attractive quantitation tool [24], because
detection depends on the mass of analyte, rather than its absorbance or ionisation
efficiency [3 11. However, the detection of volatile and low-melting compounds is
not possible with ELSD as the detection is performed after the evaporation of the
solvent [15]. Accurate quantification at high-throughput scale can be provided by
chemiluminescent nitrogen detection (CLND) with FIA or HPLC analysis [24].
CLND response is related to the number of nitrogen atoms in the sample. FIA-
CLND provides good linearity but its use is restricted when nitrogen-containing
impurities and solvents are present [15].
1.1.7 Miniaturisation
The need for high-throughput analysis and point-of-care testing has
determined the interest in miniaturisation of analytical processes [32]. The
requirements for minimal space used, portability, ease of manipulation,
inexpensive manufacturing cost, minimal sample and reagent consumption have
determined the attractive features of miniaturised analytical system. The
possibility of high-throughput performance of microscale devices has resulted in
the development of high-density arrays of microreactions wells for
pharmaceutical analysis [33]. The microplates with large number of smaller wells
(fiom 192 to 20000) have been reported at miniaturised level [33]. An example of
a 1536-microwell plate is shown in Figure 1.2.

Figure 1.2.1536-microwell plate [adapted from 331.
The performance of analysis on a microchip platform has shown potential
in pharmaceutical analysis [33]. The microchip consists of microchannels and
microchambers thdt are responsible for intra-chip transfer of fluid or
electrophoretic separations and function as posts and dams for separation and
isolation [15]. A typical size of the microchip is 1.5 cm x 1.5 cm and a few
millimetres in thickness. The timesaving benefits of microchip technology in
pha-maceutical analysis can be demonstrated by the example of the determination
of lincomycin in urine by microchip capillary electrophoresis with
electrochemiluminescence (ECL) detection, which was performed within 40 sec
[341.
1.1.8 Nanotechnology
Nanotechnology has found its application in phamaceutical analysis.
Nanobiosensors have employed enzymes, antibodies, receptors and molecular
imprints in order to recognise analytes [15]. Individual chemical species can be
detected using nanoprobes and nanobiosensors [35]. Nanotubes are en~ployed for
the extraction of pharmaceuticals prior to analysis. For example, carboxylated

single-walled carbon nanotubes (cSWNT) can be a good alternative to the solid
phase extraction (SPE) of non-steroidal anti-inflammatory drugs [36]. Bio-
nanotubes utilise the selectivity of an antibody to a single enantiomer and thus can
be used in chiral analysis [37]. Various nanotechnologies have been applied in a
lab-on-a-chip format [38]. At ths scale of analysis it is possible to introduce
attoliters of sample and achieve zeptomole detection limits [39]. Nanobiosensors,
nanosamplers, cell orienters, nanoanalysers, nanoarrays and nanofluidics are
being recognised as biological tools of the k r e [15].
Faster analysis, higher throughput and minituarised technology are the
focuses of modern pharmaceuticals analysis. Only time and experience will tell
whether the new technologies and advances have delivered their promises of
potential benefits [15].

1.2 HPLC IN PHARMACEUTICAL ANALYSIS
It is difficult to underestimate the importance of HPLC for pharmaceutical
analysis. It is used in the determination of analgesic, antibiotic, anti-viral,
antihypertensive, anti-depressant, gastro-intestinal and other drugs, the
classification of which is summarised in Figure 1.3 [40]. In order to explain the
predominant position of HPLC it is necessary to reveal features determining its
suitability and attractiveness to the pharmaceutical analysis. The separation
mechanism in chromatography is based upon the distribution of analytes between
two phases, a stationary and a mobile phase [41]. About 75 % of current HPLC
analyses are performed in reversed-phase mode [14], where the retention is based
on distribution between a nonpolar stationary phase and a polar mobile phase.
Figure 1.3. Classification (based on analytical abstracts) of drugs analysed by HPLC during 1995-2001 [adapted from 401.

HPLC offers high resolution, good reproducibility, high sensitivity and
low limits of detection. The drawbacks of the technique include the relatively
long time of analysis, low efficiencies of separation, the generation of excessive
amounts of solvents used as mobile phase, large volumes of sample required for
analysis and the substantial cost of the equipment. The demand for high quality
separation and high sample throughput in the laboratory has determined the
development of ways to increase the speed and efficiency of analysis without
damaging the resolution. Such advantages of HPLC technology include the use of
monolithic columns, small particle columns, high pressure and high temperature
[27]. Varying stationary phase, the composition of mobile phase, gradient elution,
temperature and the choice of the detector allows the separation to be achieved.
1.2.1 Separation in HPLC
The majority of the methods in pharmaceutical analysis employ reversed
phase HPLC with silica-based bonded Cs and C18 alkyl stationary phases [27].
Generally, mobile phase is supplied onto the column with a flow rate of 1 mL
min-'. With these conditions, the separation of pharmaceuticals can result in an
analysis time of several minutes, such as the determination of the active substance
indomethacin and its two impurities which lasted just under 7.5 min [42]. In the
case of complicated mixtures, gradient elution is required. This however adds to
the complexity of the analysis and also requires a significant amount of time. For
example, the analysis of 19 antiretroviral agents on a Ctb column with gradient of
the phosphate buffer and acetonitrile resulted in 50 min of analysis time [43].
1.2.2 Detection in HPLC
The choice of suitable detection for HPLC separations is of great
importance in order to ensure that all components are detected. While using UV
detection, the multiple wavelength detector or a photodiode-array detector allow
the detection of all components. Although the UV detector is widely employed in
pharmaceutical analysis [40], it does not allow limit of detection (LOD) values as

low as some other more sensitive detection techniques. For example, the HPLC-
UV determination of anti-inflammatory pharmaceuticals (naproxen, ketoprofen,
ibuprofen, diclofenac, piroxicam, nimesulide and paracetamol) was characterised
by LODs from 36 to 8300 ng m ~ - ' [44]. When employing ESI-MS with the same
separation, the LODs were in a range of 7 - 200 ng m ~ - ' . Fluorescence,
refractive-index and electrochemical detectors are employed for specific
applications [40].
1.2.3 Method validation
HPLC methods are usually highly robust. Thus, precision in the HPLC
method for the determination of antiretroviral agents was less than 1% [43]. In the
method for the determination of anti-inflammatory pharmaceuticals [44] it was
reported to be less than 1.5%. HPLC offers less separation efficiency than other
separation techniques such as CE, GC or SFC [14]. The separated peaks are
generally characterised by several thousand theoretical plates. For example, in the
HPLC method the efficiency of indomethacin was 7655 theoretical plates, while
the efficiencies of the two impurities were even lower [42]. The low efficiency of
HPLC performance restricts the amount of compounds that can be separated in a
single run. Typically, it is difficult to separate more than 20 compounds in HPLC
and gradient elution is usually required [45].
1.2.4 HPLC for the separation of chiral pharmaceuticals
One of the main challenges of pharmaceutical analysis is the enantiomeric
separation and quantification of drugs [I]. The resolving power of HPLC has been
employed in the determination of the enantiomeric purity of therapeutic drugs,
which are used as pure enantiomers, and the analysis of racemic mixtures in
biological samples. The employment of chral stationary phases in HPLC columns
is one important approach to this problem. Thus, stereoisomers of the non-
steroidal anti-inflammatory drug 4-dihydroflobufen lactone were successfully
separated on a hydroxypropyl-P-cyclodextrin stationary phase [46]. Additionally,
the chiral modifier can be added to the mobile phase. HPLC separation of
doxazosin enantiomers was reported using carboxymethyl-P-cyclodextrin as an

additive in mobile phase [47]. Chiral analysis of pharmaceuticals is the area
explored extremely in CE, this wi11 be discussed Iater.
Acknowledging the achievements of the HPLC in the current
pharmaceutical analysis and recegnising its limitations, i.e. time of analysis and
sepamtian cficiency, it is important for alternative methods of analysis to be
given an opportunity to utilise their unique advantages in this area. This thesis
explores the potential of capillary dectrophoxesis in the analysis of
p harmaceuticnls.

1.3 PRINCIPLES OF CAPILLARY ELECTROPHORESIS
1.3.1 Introduction
Capillary electrophoresis is a powerful analytical technique which
combines the separation mechanism of electrophoresis and the instrumental
concept of chromatography. The outstanding analytical strength of CE is in its
vast resolving power, high speed of analysis and high efficiency of separations.
Capillary electrophoretic methods have been developed for the separation of
compounds ranging from small molecules [48, 491 to macromolecules 150, 511.
The analysis of pharmaceuticals using CE [52-541 has become increasingly
popular in recent years.
The powerful mechanism of the technique is based on the principal that
charged particles will migrate towards the opposite pole and separate from each
other according to their physical characteristics. The differences in the separation
mechanisms of CE and those of chromatography makes CE a potential alternative
or complementary analytical technique to high performance liquid
chromatography. Other attractive features of CE are minimal sample and reagents
consumption, a fully automated process of separation and availability of different
modes of operation to tackle a wide variety of separation problems.
In order to introduce capillary electrophoresis, the basic principles and
instrumentation of the technique along with possibilities of analysis in different
modes are revealed. Its application in the analysis of pharmaceuticals is explored.

1.3.2 Components of a CE system
The basic configuration of the CE system is presented in Figure 1.4. The
narrow-bore fused silica capillary is the component of the system where the actual
separation of analytes takes place. The internal diameter of the capillary of 10 -
100 pm provides efficient heat dissipation, which allows separation to be
performed at high field strength. The ends of the capillary are placed in two buffer
reservoirs along with two electrodes, which make electrical contact between the
high voltage power supply and the capillary. After filling the capillary with buffer,
a small amount of sample is introduced at one capillary end by an electrokinetic or
hydrodynamic technique. Separations are performed in an electric field by
applying high voltages of between 5 and 30 kV along the capillary, typically
followed by the detection on-column with a sensor placed at the outlet end [55] .
-
voltage supply
Figure 1.4. Basic configuration of the CE system.

1.3.3 Electrophoretic migration
The difference in the velocities of analytes in an electric field is the reason
for their separation in capillary electrophoresis. The velocity of the solute ion can
be described by Equation 1.1 [5 51:
v = p , E Equation 1.1
where v = ion velocity, p, = electrophoretic mobility, and E = applied electric
field.
Mobility is related to physical parameters by the following equation:
Equation 1.2
where q = ion charge, q = solution viscosity, r = ion radius.
This equation shows that small, highly charged species have high
mobilities; at the same time large, minimally charged species have low mobilities.
The electrophoretic mobilities can be found in tables as physical constants, which
determine when the analyte is fully charged and infinite dilution is assumed.
Mobilities that are determined experimentally - effective mobilities - are different
and depend on pH and the composition of the buffer.

1.3.4 Electroosmotic flow
Electroosmotic flow (EOF) is a central point of CE separation. The walls
of a fused silica capillary contain silanol groups, which are ionised above pH 4
[55] . The deprotonated capillary walls have a net negative charge and when in
contact with aqueous solution, an excess of counterions is immobilised in the
Stern layer next to the charged surface. At the same time, a mobile excess of
counterions forms the diffuse layer (Gouy layer) [56] . These two layers represent
an electric double layer as shown in Figure 1.5. The border line between Stern
layer and Gouy layer is called the shear plane. The electric potential at the shear
plane is defined to be zeta potential [57].
Electric douiblr latter
Figure 1.5. Schematic representation of the electrical double layer [adapted from 581.

When an electric field is applied, the positive ions at the capillary wall
migrate towards the cathode. This motion of the excess of counterions of the
electric double layer results in a b ~ d k flow within the capillary - electroosmotic
flow (Figure 1.6). This bulk flow has a flat profile formed by the uniform
distribution of the migrating solute ions along the capillary and in conventional
systems moves towards the cathode [59]. EOF causes movement of all particles in
the capillary: neutral species and ions are all drawn to the cathode regardless of
charge. This phenomenon makes possible the resolution of charged and neutral
species.
Figure 1.6. Representation of EOF in normal polarity with the detection at the cathode.

The magnitude of the EOF is related to the zeta potential and can be
defined in terms of velocity or mobility [55]:
then
Equation 1.3
Equation 1.4
where VEOF = ~ E O F E, VEOF = EOF velocity, ~ E O F = EOF mobility, 5 = zeta
potential, E = dielectric constant.
While EOF is usually beneficial, it is still essential to control it to realise
the full potential of the technique. In order to decrease EOF, several
methodologies can be employed, such as decreasing the pH of the run buffer
and/or the applied voltage, increasing the ionic strength of the buffer and/or
viscosity and modification of the run buffer with additives [55] .
1.3.5 Analytical parameters
CE analytical parameters can be described in terms similar to those of
column chromatography [55]. The solute mobility can be calculated using
migration time and other experimental parameters:
Equation 1.5
where pa = pe + ~ E O F , V = applied voltage, t = migration time, 1 = effective
capillary length (to the detector), L = total capillary length.
The basis of separation in CE is the difference in solute mobility. This
difference is essential to resolve zones from each other and depends on the length
of the zones. Dispersive processes that occur in the capillary determine zone
length. Dispersion of discrete zones in CE results from differences in solute
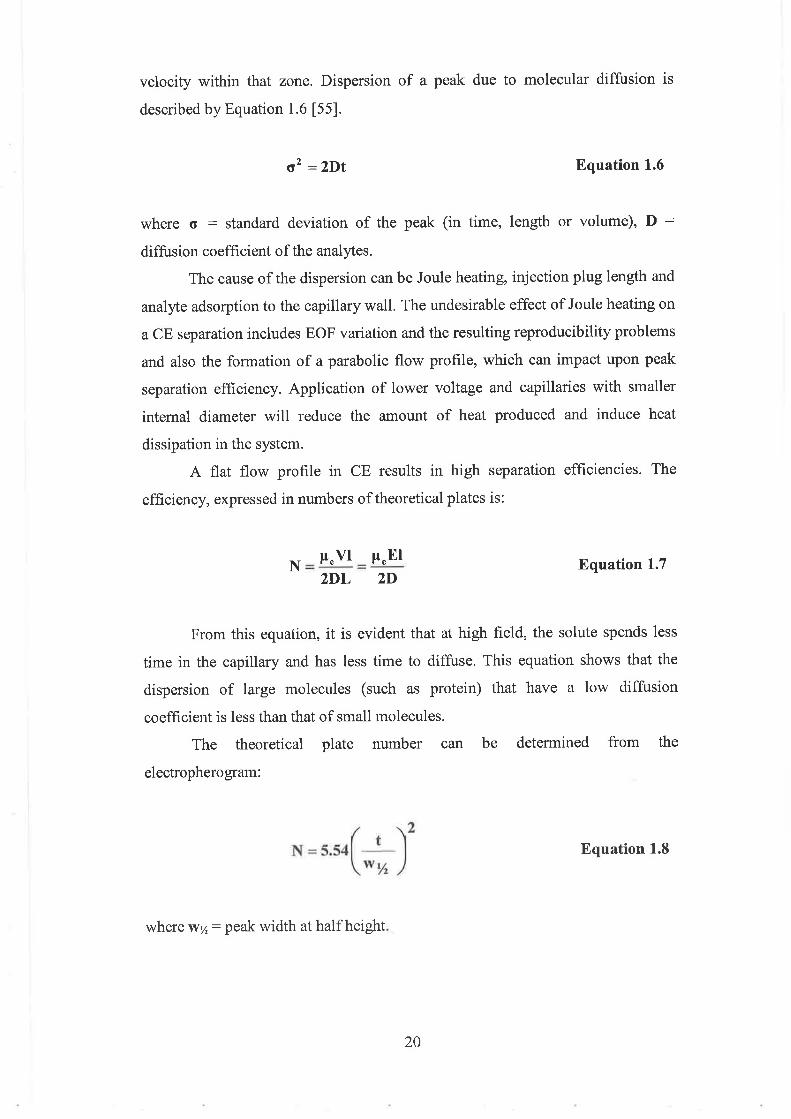
velocity within that zone. Dispersion of a peak due to molecular diffusion is
described by Equation 1.6 [55] .
a2 = 2Dt Equation 1.6
where a = standard deviation of the peak (in time, length or volume), D =
diffusion coefficient of the analytes.
The cause of the dispersion can be Joule heating, injection plug length and
analyte adsorption to the capillary wall. The undesirable effect of Joule heating on
a CE separation includes EOF variation and the resulting reproducibility problems
and also the formation of a parabolic flow profile, which can impact upon peak
separation efficiency. Application of lower voltage and capillaries with smaller
internal diameter will reduce the amount of heat produced and induce heat
dissipation in the system.
A flat flow profile in CE results in high separation efficiencies. The
efficiency, expressed in numbers of theoretical plates is:
Equation 1.7
From this equation, it is evident that at high field, the solute spends less
time in the capillary and has less time to diffuse. This equation shows that the
dispersion of large molecules (such as protein) that have a low diffusion
coefficient is less than that of small molecules.
The theoretical plate number can be determined from the
electropherogram:
Equation 1.8
where w5 = peak width at half height.

Resolution of analytes is the main goal of a separation method. Peak size
and shape may affect the resolution 1603. Resolution is determined from
electropherogm as:
where w = baseline peak width (in time).
The effect of EOF on resolution can be described as
Equation 1.9
Equation 1.10
where Ap = pz- pi and fL =(PI+ pl) 12 .
Resolution is shown to be better with longer capillaries and higher voItage
applied, But generation of JouIe heating and long times of analysis should be
taken into account [60]. High EOF provides better resolution of peaks migrating
in the opposite direction to EEOF [61].

1.4 VERSATILITY OF CE
One of the advantages of CE is that it is a very flexible technique; it can be
adjusted for the separation of a variety of compounds due to its numerous modes
of operation. Different modes of CE separations can be performed using a
standard CE instrument.
The distinct capillary electroseparation methods include capillary zone
electrophoresis (CZE), capillary gel electrophoresis (CGE), micellar electrokinetic
chromatography (MEKC), capillary electrochromatography (CEC), capillary
isoelectric focusing (IF), capillary isotachophoresis (ITP) [62]. Some of these and
other method development options that are of particular interest for this work are
explored below.
1.4.1 Capillary zone electrophoresis
Capillary zone electrophoresis is the simplest mode of CE mainly because
the capillary is only filled with a buffer. Separation occurs because analytes
migrate in discrete zones at different velocities due to the difference in their mass-
to-charge ratio. Separation of small and large molecules is performed, including
the smallest molecules with slight mass-to-charge ratio differences. Cationic and
anionic analytes can be separated in CZE. Separation of neutral analytes from
each other is not allowed, they all comigrate with the EOF.
A wide range of buffers can be employed in CE. The most common are
shown in the Table 1.2 [ 5 5 ] . The role of the buffer is to provide precise control of
pH. This is important due to the sensitivity of mobility and electroosmosis to
changes in pH [63]. The buffer also gives ionic strength, which is essential for
electrical continuity. The run buffer should meet several criteria, such as good
buffering capacity at chosen pH, low absorbance at the wavelength of detection,
low mobility (implying large, minimally-charged ions) to minimize current
generation [55] .

Table 1.2. Commonly used buffers [55].
Buffer P K ~
Phosphate 2.12 (1)
Acetate
2-(N-Morpho1ino)-ethanesulfonic acid (MES)
Piperazine-N,N'-bis(ethanesu1fonic acid(P1PES))
Phosphate 7.21 (2)
N-2-Hydroxyethylpiperazine-N'-2-ethanesulfonic acid (HEPES) 7.55
Tris-(hydroxyrnethy1)aminomethane (Tris)
Borate
Cyclohexylamino- 1 -propane sulfonic acid (CAPS) 10.4
Phosphate 12.32 (3)
The pH value of the run buffer controls the degree of ionisation of the
silica and this is why it influences the magnitude of EOF in CE. The net negative
charge on the capillary wall increases at h g h pH. The EOF generated by alkaline
pH values will therefore be greater than that at lower pH values, resulting in a
faster separation. In normal polarity, cations will possess the highest velocity due
to electrophoretic attraction to the cathode and the same direction as the EOF. The
velocity of anions is lower than that of EOF as their electric attraction in the
opposite direction to the EOF [64].
The pH range where buffer shows maximum capacity depends on its pKa
value [65]. Generally the working range of a buffer is limited to *1 pH of its pKa
[55]. Operation outside of that range must be accompanied by frequent buffer
replacement to avoid pH changes [66]. Table 1.2 contains pKa values of some
buffers typically used in CE. Phosphate and some other buffers are polybasic and
thus they possess a greater working range. It should be noticed that there has been
a strong preference in CE to use buffers with pH either below 3 or above 8 [66].
EOF is very low below pH 3 and a change of electroosmotic flow with pH is
minimal above pH 8. Between these pH values electroosmotic flow changes

extensively with pH and the design of n stable reproducible system using uncoated
capillaries is very problematic.
The typical buffer concentration mges from 10 mM to 100 mM [63].
Separation is faster when dilute buffer is employed, but the sample loading
capacity is reduced. An increase in the concentration, and therefore ionic strength,
of the run buRer, leads to compression of the double layer. In this situation, the
zeta potential decreases and therefore the EOF decreases also [55], resulting in
Ionger analysis time due to increased migration times.
The advantage of zwitterionic buffers (CAPS, MES, Tris) is low
conductivity and thus, law curtent generation upon application of high voltage
and reduced Joule heating that allows use of buffers with higher concentration.

1.4.2 Micellar Electrokinetic Chromatography
Micellar electrokinetic chromatography presents a hybrid of
electrophoresis and chromatography. Terabe [67] introduced this approach in
1984 and now it is the most widely used mode of CE technique. The main
advantage of MEKC is that it can be used to separate neutral solutes and charged
solutes in a single run. The separation is achieved by the addition of surfactants to
the buffer system.
Surfactants are surface-active agents; they contain groups of opposite
polarity that have solubilising tendencies in an aqueous solution [57]. In an
aqueous solution at a concentration above the critical micelle concentration
(CMC) [68], surfactant molecules spontaneously organise into aggregates called
micelles. This form of molecular organisation occurs due to hydrophobic and
electrostatic effects and leads to lowering of the free energy of the system. The
hydrophobic tails of the surfactant are oriented towards the centre and the polar
heads are oriented towards the buffer [69].
1.4.2.2 Mechanism of separation
In the CZE, neutral compounds simply move with EOF. When anionic or
cationic surfactant is added to the run buffer, another separation mechanism
comes into play. This is shown in Figure 1.7. Hydrophobic analytes solubilise in
the hydrophobic part of the micelle. This encapsulation - de-capsulation process
is very rapid and in the time of separation, may be viewed as an instantaneous
molecular equilibrium [66]. The greater the time that analyte is incorporated with
micelle, the longer the migration time will be. The time that molecules of analyte
spend with micelles depends on the strength of their interaction with the micelle:
the interaction is stronger in case of more hydrophobic compounds. Anionic
surfactants migrate toward the anode (the opposite direction to the EOF).
Generally EOF is faster than the migration velocity of the micelles (at neutral or

basic pH) and thus the movement of all the particles in the capillary is toward the
cathode [55] .
Figure 1.7. Mechanism of separation in MEKC.
By modifying the nature of the micelles, the possibilities of capillary
separation can be widened [70]. Increasing the partition of hydrophobic
compounds in the aqueous phase [71] helps the separation. The use of
cyclodextrins frequently leads to success but at the same time adds some
complexity, especially in interpretation. Organic solvents in a buffer affect the
stability of micelle-analyte agglomerates [72]. Some publications have reported
separation with polymeric pseudostationary phases [73].
1.4.2.3 Surfactants
The most common anionic surfactant used in MEKC is sodium dodecyl
sulphate (SDS); its chemical structure is shown in Figure 1.8. It is very water-
soluble and has a high degree of lipid-solubilising power. SDS does not absorb in
the low UV range of spectrum [74] and gives a stable baseline. The CMC of SDS
in water is 8.2 mM, but this magnitude is different in a buffer solution. SDS forms

molecular aggregations from 63 molecules [75]. The aggregate surface has a net
negative charge. When the analyte is negatively charged and the concentration of
anionic surfactant is high, the solubilisation of analyte may be difficult due to the
possibility of charge repulsion from the negatively charged rnicelles [67].
Figure 1.8. Chemical structure of SDS.
Dodecyltrimethylarnmonium bromide (DTAB) and
cetyltrimethylammonium bromide (CTAB) represent the cationic surfactants used
in MEKC. Their CMC are 14 mM and 1.3 mM, respectively [55]. When a cationic
surfactant is added to the buffer, the migration time of analyte will be short due to
micelle-analyte attraction to the cathode by both electrophoresis and EOF. High
concentration of cationic surfactant might neutralise the negative charge on the
capillary wall. Increasing surfactant concentration leads to the appearance of a
bilayer of charge, which gives the capillary wall a positive charge. This might
reverse the direction of EOF [55] . In this situation, detection must be allowed at
the anodic end of the capillary. Reversal of charge takes place at the concentration
of surfactant well below the CMC [62]. The use of surfactants molecules with
long alkyl chains gives a narrow elution window [76].
The separation of alkylxantines was reported using SDS surfactant [77,
781. CTAB was employed in the separation of pesticides [79].

1.4.3 Chiral separation in CE
Chiral separation is an active area of research in gas chromatography,
liquid chromatography and CE. It is important for organic chemistry, medical
research, environmental control, and drug and food industries. Often
pharmacological activity of enantiomers can be different because many biological
target sites are stereoselective.
1.4.3.1 Chiral selectors
In CE the role of chiral selectors can be played by cyclodextrins [80, 811,
derivatized cyclodextrins [8 1, 821, optically active micelles [83], macrocyclic
antibiotics [84], ligand exchangers [85], glycosaminoglycans [86], peptides [87]
and crown ethers [88]. They are usually added straight to the run buffer [80-821 or
in some cases they can be bound to the capillary wall [89] or included into gel
POI.
1.4.3.2 Cyclodextrins
Cyclodextrins are the most widely used chiral selectors in CE. These
compounds are composed of D-glucose units connected to a ring by 1,4-linkages
(Figure 1.9). The cavity diameter depends on the number of glucose units: 6, 7
and 8 glucopyranose units are referred to as a-, P-, y-CD, respectively. The shape
of CD's molecule represents a hollow truncated cone (Figure 1.9) with wide and
narrow hydrophilic ends delineated by O(2)H and O(3)H secondary and O(6)H
primary hydroxyl groups [9 1, 921. Table 1.3 contains some physical properties of
CDs. The interior of the CD is relatively hydrophobic due to the orientation of the
carbon atoms toward the inside space of the cyclodextrin ring while the external
surface is hydrophilic due to the sugar's hydroxyl groups which are directed
outside of the ring [93]. a-CD is used to separate single-ring aromatic solutes with
few side chains [94, 9.51. One - to two-ring aromatic compounds are best
separated with P-CD [96, 971, whereas y-CD performs separation of larger
molecules [98].

Figure 1.9. Toroid structure of cyclodextrin (P-CD) [99].
Glucose is optically active, that is why the surface of this "ring of
hexoses" has the same property and chiral recognition is performed. Hydrophobic
groups of aromatic compounds or cycloalkanes can enter the cone and make an
inclusion or host-guest complex. The interplay of atomic (Van der Waals),
thermodynamic (hydrogen bonding) and solvent (hydrophobic) forces results in
the establishment of stable inclusions of analytes and cyclodextrins [99]. It is
possible for the solute to sit on the opening of the CD [62]. On the other hand,
privileged interaction with one of the enantiomers is facilated by the surface
optical selectivity of the cyclodextrin. After such chiral interaction the mobility of
that enantiomer has changed and the separation of enantiomers is performed.

Table 1.3. Some characteristics of CDs [loo].
Parameter Type of CD
a-CD p-CD y-CD
M (glmole) 972 1135 1297
Diameter of cavity ( a ) 4.7 - 6.0 8.0 10.0
Volume of cavity (a3) 176 346 5 10
Solubility (d l00 ml, 25°C) 14.50 1.84 23.20
pKa assigned to O(2)H 12.33 12.20 12.08
and O(3)H [107, 1081
1.4.3.3 Cyclodextrin derivatives
Due to the relatively low solubility of P-CD and inability of native CDs to
separate all enatiomers, CDs have been functionalised with additional moieties.
The most widely employed substitute groups are hydroxypropyl, succinyl, acetyl,
sulfobutyl and sulphate. Any modification at the cyclodextrin ring influences the
steric fit [93] and, therefore, the affinity of an analyte to the CD. Differences in
the steric fit lead to differences in interaction times of analytes with CD. This in
turn leads to different mobilities of enantiomers or isomers, and thus to separation.
Charged CDs have been used in CE separations of natural analytes [103]. The
sulphoalkyl ether derivatives of P-CD have been used in CE as they exhibit
increased solubility in water [104, 1051.
The aggregate substitution of additional moieties per glucopyranose unit is
called a degree of substitution (DS). For example, a DS of 5 means a distribution
of an average of five substitute groups on the CD molecule. Nuclear magnetic
resonance is employed to determine the degree of substitution [99]. Molar
substitution shows the average number of moles of substitute per mole of
glucopyranose.

1.4.3.4 Mechanism of separation
The mechanism of chiral separation is based on differences in the stability
of the complexes between the analyte and CD. The model of Wren and Rowe was
developed for chiral separation with CDs [106-1081. Separation will not take
place if the solutes spend either too little or too much time attached to the CD. In
this case, the type of CD or concentration must be changed. The addition of an
organic solvent can be useful if solutes are bounded too strongly. Figure 1.10
illustrates the mechanism of separation when CZE is modified with CDs. Neutral
solutes can be separated with charged CDs and neutral CDs can be used for the
separation of charged analytes. Application of high concentration of charged CDs
for the resolution of the same charged solutes may result in charged repulsion of
the analytes from the CD, altering the nature of the inclusion. When using a
charged CD such as sulfobutylether-P-CD (SBE-P-CD), the anionic CD migrates
against the EOF in a similar way to the SDS micelle [62]. In this situation, the CD
can represent a slowly moving "phase" in electrokinetic chromatography.
However, micelles are much more effective for this purpose.
-
EOE
#
\ t - - @+ - 0 a Cyclodextrkn Andyte
Figure 1.10. Mechanism of separation with cyclodextrin.

Due to the differences in the nature of analyte - micelle and analyte -
cyclodextrin interaction, the combination of micelles and cyclodextrins is
particularly powerful [62]. The mechanism of CD-MEKC separation is illustrated
in Figure 1.11. For the separation to occur the analytes must be sufficiently
distributed between the CD-modified micellar phase and the aqueous solution. If
the analyte interacts only with micelle or totally included into the CD cones, no
separation will be performed [109]. The following separation is based on
differences in a solute's partition coefficient between the micelle and the CD.
However, nonpolar compounds can demand the addition of high concentrations of
surfactants and organic modifiers to control analytes solubility and help resolution
of structurally similar molecules. The addition of an organic solvent solubilises
the hydrophobic analytes in the aqueous buffer, lowering the interaction of
analytes with the micelle and CDs [67]. High concentration of surfactant can
result in extensive current generation and time of analysis can increase [110].
Figure 1.11. Mechanism of CD-MEKC separation.

1.4.4 Microemulsion electrokinetic chromatography
1.4.4.1 Microemulsions
Microemulsions are solutions of nanometre-sized droplets dispersed
throughout another, immiscible, liquid [ I l l ] . The characteristics of
microemulsions include optical transparency, thermodynamic stability and hgh
solubilisation power [ 1 121. Oil-in-water microemulsions are usually employed in
microemulsion electrokinetic chromatography. Since it was first introduced in
1991 for the analysis of fluorescent aromatic compounds [I131 it has found
application in the separations of water soluble and insoluble vitamins [112, 1 14-
1 161, water insoluble steroids [117], water insoluble pesticides [I181 and a range
of pharmaceuticals [114, 1 19- 1231. While MEEKC has been principally known to
have a great separation capability for highly hydrophobic compounds [113, 124,
1251, it also was demonstrated to be a reliable separation tool for hydrophilic
analytes [126, 1271.
Figure 1.12 represents a schematic diagram of an oil-in-water
microemulsion. The oil droplet (heptane or octane) acts as the core phase and is
suspended in an aqueous buffer. Surfactant molecules, such as SDS, are added in
the concentration greater than their CMC to facilitate droplet formation by
lowering the surface tension [ I l l ] . A co-surfactant such as small alcohol
molecules (butanol) is added in order to create oil-water bridges and lower surface
tension, further stabilising the microemulsion system.
The oil-in-water microemulsions are not stable in all proportions of the
ingredients and should be kept within a certain narrow range [128]. A typical
composition of microemulsion used in CE consists of 0.8% core phase, 3.3%
surfactant, 6.6% co-surfactant and 89.3% aqueous buffer [129].

Figure 1.12. Schematic representation of oil-in-water mieroemulsion [adapted from
691.
1.4-4.2 Mechanism of separation
MEBKC allows sepration in a similar %hion t~ MEEC but pmvide.s
supdor sepmtion e f f k y to MEKC, due to i~pmved mass transfer between
the mimemuhion droplet and q m u s phase [130& the reinson being that th
structure of the microeraulsian is less rigid tbm that of a PnZeelk [I26]., A
schematic represeatarion of the separation mwhdm in MEEXC is shown in
Figw 1.13 where analysis is performed using high pH md anionic suf~mt.
IFhe separation o c c u due to chrgmatographic p d t i o a g df a d y e s between
h microemuZslon droplets an13 aqueous, buffer phase in addition to their
mobilities deterrxlngd by m q s to c h g e ratio. The mdyte migates at a velwi~y
Mwwa two extremes, I.e. the ekut~ossmotic velocity ad the velocity of
microemuLdon [I 191, Highly hydrophobic solutes wU have long migration times
as they strongly incorporate into the ndc~~emul~ion dmpltts. Cationic positively
charged d y t a c,m be sqirakd though pa-titioniag md ion-Mng processas.
Negatively charged sohtes, we charge repellad from the ,anionic hoplets but can
still be ,sep#r~fed w the bais of their electrophwmtic moMitkv.

-- - -- EOF
# Droplet
Figure 1.13. Mechanism of MEEKC separation [adapted from 691.
A vast number of published methods have ernployed high pH buffers [117,
125, 129, 13 1-1331 in order to generate high EOF velocities. The application of
high voltage across the capillasy results in the migration of negatively charged oil
droplets and associated analytes towards the anode due to the influence of
electrophoresis. Enhanced electroosmotic flow created at high pH sweeps oil
droplets and all components to the detector at the cathode end. MEEKC at low pH
has also been investigated in the literature [115, 121, 134-1371. At low pH there is
no EOF, therefore the polarity of the separation must be reversed in order to
attract the oil droplets towards the detector. In this case the most retained analytes
elute first [121, 1311. Suppression of EOF minimises the repulsion of acidic
analytes from negatively charged droplets, which could occur at high pH where
both solutes and oil droplets are negatively charged.
The addition of organic modifiers to the microem~ilsion separation buffer
has been proven to be useful when water insoluble solutes strongly incorporated
into the oil droplets [138]. The organic solvent reduces the degree of partitioning
of the analytes into the core phase. It also reduces the electrical current generated
in the system, which can red~ice the effect of Joule heating. The concentration in
which methanol, acetonitrile, ethanol or other solvents can be added, is restricted
by a certain amount [I 111. Greater concentrations may lead to lower peak
efficiencies due to the disruption of the rnicelle structure.

1.5 IMPROVING SENSITIVITY IN CE
Capillary electrophoresis stands out from other separation techniques for
its several very beneficial features. High-voltage separation in a narrow capillary
requires only minimal amount of sample for the injection. It uses small volumes
of aqueous-based buffer, has numerous features for adjusting a buffer system for
any particular separation and is relatively inexpensive. The obtained separations
are highly efficient and very well resolved. Yet the lack of sensitivity does not
allow the employment of capillary electrophoresis in areas where low limits of
detection are essential. The small inner diameter of the capillary, small volumes of
injection and the widely used UV-Vis detector result in poor concentration
sensitivity. Work is ongoing in the area of improving sensitivity in CE. The main
directions of improving sensitivity lead to the improved CE detection and on-line
capillary pre-concentration methods [13 91.
1.5.1 CE detection
The detection techniques combined with CE separation, their detection
limits and major concerns are surnmarised in Table 1.4 [59].
The vast majority of commercially available CE instruments use UV-Vis
detection due to its simplicity in instrumentation and flexibility in the detection of
wide range of compounds. This type of detection is usually performed on the
capillary. Therefore, the attempts that have been made to enhance the sensitivity
vary in the way they enlarge the light path: bubble cells [140, 1411, Z-shape cells
[142, 1431 or multi-reflection detection cells [144, 1451. CE with UV detection
will always be useful in the method development approach.

Table 1.4. Methods of detection [59].
.
Method Concentration Advantagesldisadvantages
detection limit
(rn01ar)~
UV-Vis absorbtion 1 0-5 - 1 o - ~ -Universal -Diode array offers spectral information
Fluorescence 1 o - ~ - 1 o - ~ -Sensitive -Usually requires sample derivatisation
Laser-induced 1 0-l4 - 1 0-l6 -Extremely sensitive fluorescence -Usually requires sample
derivatisation -Expensive
Amperometry 10-10 - lo-" -Sensitive -Selective but useful only for electroactive analysis -Requires special electronics and capillary modification
Conductivity 1 o - ~ - 1 o - ~ -Universal -Requires special electronics and capillary modification
Mass spectrometry - 1 o - ~ -Sensitive and offers structural information -Interface between CE and MS complicated
Indirect UV, 10- 100 times less -Universal fluorescence, than direct method -Lower sensitivity than direct amperometry methods
a - for 10 nL injection volume

Fluorescence, especially laser induced fluorescence (LIF), is a very
sensitive detector. When LIF is employed with CE separation, its limit of
detection can reach attomole to zeptomole levels and even detect a single
molecule [146, 1471. Most drugs do not possess native fluorescence and, thus,
derivatisation is often required. The fluorescence derivatising agent, 5-
iodoacetamidofluorescein, was applied to the determination of anthihypertensive
drug captopril[148]. The reported LOD was 0.5 ng m ~ - ' . The analysis of baclofen
in plasma was performed using derivatisation agent naphthalene-2,3-
dicarboxaldehyde [149]. Cao et al. [150] reported determination of amino
compounds with 6-oxy-(N-succinimidyl acetate)-9-(2'-methoxycarbonyl)
fluorescein. The application of LIF is limited due to the high cost of laser and
limited wavelengths.
Mass spectrometry is a very usehl detection technique because it offers
structural information about the analytes as well as quantitative analysis. Coupled
with CE it is very powerhl as it combines high resolving power and structural
information in one system. The principal advantage of CE-MS is that analytes are
identified both by their differential separation and their molecular masses and/or
fragmentation patterns [15 11. Electrospray ionisation, atomic pressure chemical
ionisation (APCI) and matrix-assisted laser desorption/ionisation are among other
ionisation techniques in MS. It is very challenging to interface CE to ESI-MS due
to unsuitability of some run buffers with the ionisation process. CE-MS methods
are characterised by quite low limits of detection. Thus, LODs for the
determination of 4-alkyl 2,5 dimethoxy-amphetamine derivatives fi-om urine
samples were in the range 3.98 to 4.64 ng m ~ - ' [ I 521. Different applications of
CE-ESI-MS have been recently reviewed by W.F. Smyth [153].

1.5.2 On-line capillary pre-concentration methods
Sample stacking is widely used to enhance the sensitivity in CE [117]. In
order to obtain stacking effect the conductivity of the sample should be
significantly lower than that of the running buffer. For example, the sample is
dissolved in the run buffer with the same composition but at much lower
concentration. An electric field in the sample zone, generated upon application of
high voltage, will be significantly greater and cause the ions to migrate faster.
Reaching the boundary of the run buffer, where the electric field is lower, the ions
migrate more slowly. When all the ions reached the run buffer zone the sample is
concentrated in a smaller zone. Other mechanisms include pH and viscosity
changes to obtain different velocities [13 91.
A very specific focusing effect of sweeping involves accumulation of
analyte by pseudo-stationary phase that enters the sample zone. The stronger the
interaction between analyte and the pseudo-stationary phase the better pre-
concentration result. Hsieh and Lin [I541 obtained 1500-fold improvement in
detection sensitivity of the CE method for the determination of trans-resveratrol in
red wine in comparison with normal-MEKC mode.
Isotachophoresis employs two buffers with different mobilities: a leading
- with faster mobility and terminating - with lower mobility. When the electric
field is applied and equilibrium is reached, all ions travel according to their
mobility and at the same velocity [155]. Either cations or anions can be analysed.
Concentration of each zone is determined by the concentration of the leading
electrolyte. More concentrated zones than leading zones get sharper, less
concentrated zones get broader. When using ITP concentrations improvement can
reach 1000-fold [139]. ITP can be performed in a single capillary [156, 1571 or
double-capillary [158, 1591 mode. The advantage of using double-capillary mode
is the possibility of direct injection of the biological samples. In the
isotachophoretic method for the determination of fenoprofen in human serum
[158], the mixture of hydrochloric acid, 6-aminocaproic acid and
polyvinylpyrrolidone was employed as the leading electrolyte, while the

terminating electrolyte was 4-morphoIineethanesul fonic acid. The achieved LOD
a f the method was 0.02 mM.
On-line coupling of micro solid phase extraction cartridges in the inlet
area of the capillary have been reported 61601. Employing a UV detector, the
detection limit for the model compound enkephalin was as low as 5 ng r n ~ - ' . The
high affinity and the high selectivity of the antigen-antibody interactions allow the
specific extraction and the concentration of the analytes of interest in one step
[161]. Other techniques utilise a small bed of packing material (G or Clg
particles) or hydrophobic membranes directly at the inIet of the CE capillary
[ I 623.

1.6 THE ADVANTAGES OF CE IN THE ANALYSIS OF
PHARMACEUTICALS
The outstanding selectivity and high speed of analysis of CE makes it
competitive to the HPLC technique, which currently dominates in the analysis of
pharmaceuticals. Advantages include reduced cost of analysis, reduction in
solvent consumption and disposal, the possibility of rapid method development,
generic separation conditions for a wide range of analytes and the possibility of
coupling to a variety of detector types. Nevertheless, industry, licensing
authorities, and the international pharmacopoeias, e.g. the European
Pharmacopoeia, do not make use of CE [13]. Exceptions include the analysis of
amino acids, peptides, and protein compounds as well as products of recombinant
DNA technology and products [163]. The United States Pharmacopoeia (USP 28)
[I641 makes use of CD-modified CE for the analysis of enantiomeric purity of
ropivacain.
The main reasons for the reluctance to use CE are lack of sensitivity and
poor precision of the methods. Low sensitivity is usually a factor in the case
where UV-Vis detection is employed. As was discussed in section 1.5, this is due
to the small amount of sample injected into the capillary and due to the short
detection pathway of the light. The inferior analytical perfonnance has been
overcome by the introduction of the internal standard, by the capillary wall
conditioning procedure and by other methods overviewed by Mayer et al. [165].
Now reproducibility below 1% relative standard deviation (RSD) can be obtained
for migration time (ratios) and peak area (ratios) [52]. Therefore CE should be
given more opportunities in analysis where it can perform at a high level.

1.6.1 Determination of pharmaceutical content
An additional advantage of CE in the analysis of the main component of
the pharmaceuticals is that the sample pretreatment step can be reduced as the CE
capillary can be washed with NaOH between injections and neutral interfering
components do not migrate [53]. CE methods require only 10-20 mL of buffer for
the day of analysis, while the HPLC method consumes litres of mobile phases
containing expensive and harmful organic compounds. The price of uncoated
fused silica capillaries is small compared to the cost of HPLC columns. However,
HPLC is still undoubtedly advantageous for a preparative option.
A variety of developed capillary electrophoresis methods have been
applied for testing of pharmaceutical formulations including tablets [166- 1681,
infusion solutions [169], syrups [I701 and eardrops [17 11. Numerous CE methods
have been developed for main component assay of pharmaceuticals [172, 1731
and were validated with comparable results to HPLC. CE has also been employed
in the stability studies of pharmaceuticals [174, 1751.
A cyclodextrin modified CZE method has been reported for analysis of
raglitazar and its counterion arginine in active pharmaceutical ingredients and
low-dose tablets [176]. The method can be used for active ingredient assay and
identification of ragaglitazar and arginine, chiral purity of ragaglitazar and purity
of ragaglitazar. The precision of the method for peak area (%RSD) of ragaglitazar
was found to be 0.63% and 3.5% for arginine, while % recovery was 101- 106%
for ragaglitazar and 101 -125% for arginine. The determination of folic acid in
tablets by the MEEKC method has been proposed [177]. The method was
characterised by precision of less than 1.2% RSD and recovery of 99.8*1.8% at
three concentration levels.
CE methods have been employed for high throughput analysis due to their
low cost and easy of performance. The analysis of dissolution test samples of
combination formulation of acetaminophenol, phenylephedrine and
chloropheniramine has potential for high throughput as it is performed in just 4
min using simple phosphate buffer of pH 6.2 [178].

1.6.2 Determination of drug-related impurities
An important role of CE in pharmaceutical industry could be the
determination of drug-related impurities. The structural impurities of a drug
possess similar properties to that of the main component and therefore are hard to
resolve. The main advantage of CE over chromatographic methods in this case is
high separation efficiencies. The extreme peak sharpness can overcome poor
selectivity and results in acceptable resolution. A detection limit of 0.1 % arealarea
is widely accepted as a minimum requirement for a related impurities
determination method [53]. This can be achieved by CE methods [179, 1801. Toro
and colleagues [I791 developed a CE method to quantify the impurity profile of a
new substance of pharmacological interest LAS 35917. The method allowed the
detection and quantitation of impurities above 0.04% and 0.08% level.
Chloromethylated, monomethylated and hydroxylated impurities coeluted when
analysed by HPLC.
A HPLC method for the determination of impurities in tripeptide
glutathione [13] is employed in Japanese pharmacopoeia. This method failed to
evaluate the impurities without degradation of the sample during analysis. A CE
method in European pharmacopoeia is capable of separating the impurities and
limiting them to 0.1% without degradation [180]. In addition the degradation can
easily be observed by CE method.
The impurity profile of polypeptide bacitracin is currently being analysed
by an isocratic HPLC method in EP 5.0 [163]. Due to the broadened peaks this
method is not able to separate all components of bacitracin [13]. A MEKC method
was reported [I8 11 which is characterised by improved selectivity and efficiency.
The HPLC and MEKC methods are compared in Figure 1.14. These advantages of
CE over HPLC method are also true for tobramycin and other aminoglycosides
[182]. The related impurities and ranitidine were analysed in bulk drug and
pharmaceutical formulations by CE assay [183]. The ionic strength and pH of the
buffer affected selectivity the most. The detection limits for impurities were
between 0.03% and 0.24%. The CE method was able to resolve several additional
peaks, which were not resolved by TLC or HPLC.

Figure 1.14. A comparison of HPLC (A) and MEKC (B) methods for the analysis of
bacitracin [adapted from 131. Peak 7 - bacitracin.

CE is not always superior to HPLC. There are numerous examples of
where CE methods do not outperform methods reported by other techniques [184-
1861. It is important to be able to employ the best quality separations offered by
CE. If a method superior in all other ways has already been performed by other
analytical techniques, it is not recommended to try to achieve the same results by
CE.
1.6.3 Chiral separations
Chiral purity is an important aspect of pharmaceutical safety. Chiral
compounds can be synthesised as racemates or single enantiomers. A final
product should contain less than 0.1 % of undesired enantiomers [14]. To quantify
these amounts can be a challenge for the sensitivity and selectivity of any
technique. As was discussed in section 1.4.3 capillary electrophoresis can choose
from a large range of chiral selectors to achieve the required aim. Certain issues
may arise if randomly substituted CD derivatives are employed [187]. Most
international pharmacopoeias use optical rotation or chiral HPLC methods for the
determination of enantiomeric purity of drugs. Since HPLC sometimes cannot
offer the required selectivity and because of the similar molecular weights,
structural isomers are not specifically detected using HPLC-MS. Capillary
electrophoresis, on the other hand, offers high separation efficiency and can be
applied as an adjunct to HPLC. Therefore, a set of highly selective CE methods is
used orthogonally in the specificity assessment of HPLC methods [188].
A generic approach to chiral separations by CE has recently emerged in
publications by pharmaceutical companies [189, 1901. Knowing the structure or
even fbnctional groups of the compound, initial separation conditions can be
selected and then variation of the potential components of the buffer can be run in
a sequence. Other parameters of separation can be fiuther optimised. The
development of the same method with HPLC can be quite a time-consuming
process because stationary and mobile phases combinations have to be
investigated. The total cost of the capillary and the cyclodextrin is still much
lower than the cost of a chiral HPLC column with specialised stationary phases.

Sanger-van de Griend et ul. [I911 reported a method for the enantiomeric
separations of adrenaline in high-concentrated local anaesthetic injection solution.
No sample preparation was required for this simple and robust chiral CE method
to detect racemisation amount of adrenaline in the concentration of 0.1 pg m ~ - '
(0.002-0.003% of the local anaesthetic). An a-CD was employed in a new chiral
CE separation of galantamine hydrobromide enantiomers [192]. A limit of
detection of 0.04% (wlw) was achieved and the method was successfully included
in a new drug application by Janssen Pharmaceuticals. The method was fully
validated according to International Conference on Harmonisation guidelines and
was successfully transferred to laboratories in Europe, US, Japan and China [53].
A CE method for determining ephedrine enantiomers [I931 could replace the
current optical rotation method in the European Pharmacopoeia as it provides
required LOD (0.1 %) for (+) ephedrine and linearity in a range 0.1 % to 1 %.
1.6.4 Bioanalysis of pharmaceuticals
The determination of pharmaceuticals in biological fluids is essential for
therapeutic drug monitoring, forensic and clinical toxicology and pharmacological
research. The issues of sample clean up and preconcentration of sample arise due
to the complexity of biological matrices and small quantities of analytes.
Biological samples consist of many components, such as macromolecules of
proteins, lipids, carbohydrates and small molecules of different nature, which may
prohibit the performance of the capillary or can interact with analytes. The
pharmaceutical contents have been investigated in the variety of matrixes. For
example, anthracycline antibiotics were analysed in human plasma [ 1941,
dexamethazone in tears [I 951, amphetamine and related compounds in urine [196,
1971.
Direct sample injection is possible with biological samples if the analytes
do not coelute with the matrix components. The main problem with the direct
injection of plasma or serum is the high concentration of proteins [198], which
can absorb to the capillary walls or bind to analytes. The high concentration of
salts present in urine causes high conductivity of the sample and less efficient

separations [162]. A direct sample injection was employed for the determination
of six organic acids in cerebrospinal fluid [199]. In this work, adverse effects of
proteins, which frequently compromise the CE performance, could be effectively
minimised by the triple layer coating in combination with rinses of 0.1 M
hydrochloric acid. %RSDs for migration times and peak areas were <2% and
<7%, respectively. Direct sample injection is also possible when the sample is
diluted with the background electrolyte, but it often compromises the sensitivity.
Protein removal by ultrafiltration [200] or precipitation [201] is often
employed prior to CE analysis of biological samples. Microdialysis sampling was
coupled on-line to micellar electrokinetic chromatography to monitor extracellular
dopamine concentration in the brains of rats [202]. The detection limit for
dopamine was as low as 2 nM when sampling by dialysis. Tagliaro et al. [203]
reported the analysis of theophylline in serum using simple methanol precipitation
of proteins. The method was characterised by good linearity range of 2-120 pg
m ~ . ' and sufficient LOD (2 pg m ~ - ' ) , while the efficiency was 20 times higher
than the HPLC method.
Liquid-liquid extraction (LLE) or solid phase extraction are attractive
sample pretreatment methods as selective and simultaneous concentration of
analyte usually takes place [161], but the methods are time consuming. Various
approaches have been made in on-line sample pretreatment methods for CE [204],
which significantly minimise time and effort.
A unique advantage of CE is the possibility to apply electrophoretic
preconcentration. Charged analytes can be concentrated by ITP or by sample
stacking [205]. A combination of SPE and ITP method with conductivity detector
for the analysis of diuretics and P-blockers in serum and in urine [206] resulted in
low LODs 32-46 ng m ~ ' . Sweeping preconcentration of a CE method for the
traces amount of anthracyclines provided an excellent detection limit of mol
L-' even with the UV detection [194]. Improvement of the sensitivity of CE is
also possible in the detection step by coupling CE with LIF [148-1501,
electrochemical detection [207] and mass spectrometry [153]. A Z-type detection

cell with UV detection was also employed for lower concentration limits of
methotrexate in plasma and urine [92].
The development of high speed technology in CE, which allow separations
on the millisecond time scale, have opened new areas of application such as real
time chemical monitoring and detection of short-lived species (protein conformers
or non-covalent complexes), rapid multi-dimensional separations and high-
throughput assays for clinical laboratories [208]. An automated system was
developed for a competitive immunoassay for insulin [209]. The separation of
bound and free-labelled insulin was performed in 7 sec. The throughput was
significantly improved and the system allowed continuous monitoring of the
sample stream as shown in Figure 1.15.
Fig. 1.15. Series of electropherograms obtained in the on-line system for a competitive immunoassay of insulin [adapted from 2081.

1.6.5 Physicochemical measurements
The success of CE has not only been in the separation and determination
areas, but also in the measurement of physicochemical properties. CE has been
used in the study of various equilibrium constants, such as acid-base, complex-
forming, ion association and inclusion. The knowledge of the separation
mechanism and model parameters including the respective equilibrium constants
enables the behavior of analytes during the separation to be predicted and the
separation to be optimized [2 101. Equilibrium constants are estimated from the
changes in migration behavior while changing the composition of background
electrolyte.
The determination of pKa values by CZE is based on the observation of
the effective mobility of an ionisable compound in a series of electrolyte solutions
of constant ionic strength at different pH [211]. The effective mobility is plotted
as a function of pH within a suitable model for the number of ionisable groups.
The main benefit of employing CE in this procedure is that it can handle impure
samples (unlike potentiometric titration or UV-Vis spectroscopy). In addition,
purity of electrolyte is not essential and little adjustment of the methods is
required for high throughput applications; only mobilities are used in calculation
and the concentration is not required (unlike titration) [211]. The pKa values of
several pharmaceuticals have been calculated [212, 2 131 and successfully
compared to literature values 12141. By adding organic solvents to the electrolyte,
the dissociation constants of water-insoluble and sparingly soluble compounds
can be determined [212]. Only a small amount of material is needed for CE
analysis and this can be very useful for screening novel pharmaceutical
compounds when only restricted amounts of sample are available [215]. This is
also advantageous when analysing small quantities of radiopharmaceuticals [2 161
or unstable compounds [2 1 71.
Another example of the estimation of the stability constant by CE is the
determination of constants of inclusion complexes with cyclodextrins. In the
pharmaceutical field the different interaction of optical isomers with cyclodextrins
is the main way of performing their separation [218-2201. The degree of
interaction of compounds with cyclodextrin affects its electrophoretic behavior.

Assumption of 1 : 1 stoichiometric interaction in combination with several
mathematical models [I061 leads to relatively simple calculations of the stability
constant. Knowing this constant it is possible to calculate the optimum
concentration of chiral selector [I 06-1 081. Inclusion complexes of some
pharmaceuticals have been investigated in literature [22 1-2231.
The possibility to employ buffers at extreme pH (<2 and 12) has been used
in CE to measure the partitioning coefficient logPo, of acids and bases in their
uncharged state [224]. Such an opportunity may not arise in the HPLC method
where the stability of the stationary phase has to be taken into account. The
partitioning of compounds into MEKC micelles [225] and MEEKC oil droplets
[226] has been related to their solubility measurements. The octanol-water
partitioning coefficient is determined from a calibration graph of known logPo, of
a neutral marker against migration time. The logPo, of analyte can then be
calculated by its own migration time through the graph. Longer migration times of
compounds correspond to higher logPo, values. The octanol-water partitioning
coefficient has been successfully measured for pharmaceuticals [120,227].

1.7 CONCLUSIONS AND THESIS OUTLINE
The fundamental aim of this thesis was to further investigate the
advantages of capillary electrophoresis in the analysis of several pharmaceuticals
and, thus, making a contribution to the establishment of CE among other
analytical methods.
The basic principles behind the superior resolving power of the capillary
electrophoresis were outlined in the Literature review. Different ways of
optimising separation in CE were demonstrated. Revealing the advantages of the
technique while acknowledging its drawbacks, the wide application of the CE and
comparison to other analytical techniques in the analysis of pharmaceuticals was
explored.
In conclusion to this literature review it should be mentioned that the real
value of CE is not in those areas where significant additional work is required to
overcome the drawbacks, but in those where it can make the analysis easier, faster
and more straightforward.

1.8 REFERENCES
1. S. Gorog, Trends Anal. Chem. 26 (2007) 12.
2. N. Ma, B.-K. Zhang, H.-D. Li, B.-M. Chen, P. Xu, F. Wang, R.-H. Zhu, S. Feng, D.-X,
Xiang, Y.-G. Zhu, Clin. Chim. Acta 380 (2007) 100.
3. M. Nobilis, M. Pour, P. Senel, J. Pavlik, J. KuneS, M. VoprSalovB, L. KolBEovB, M.
Holeapek, J. Chromatogr. B (2007) In Press.
4. L. Dal Bo, P. Mazzucchelli, A. Marzo, J. Chromatogr. A 854 (1999) 3.
5. C. Bharathi, C.S. Prasad, D. V. Bharathi, R. Shankar, V. J. Rao, R. Dandala, A. Naidu,
J. Pharm. Biomed. Anal. 43 (2007) 733.
6. C. Pan, F. Liu, Q. Ji, W. Wang, D. Drinkwater, R. Vivilecchia, J. Pharm. Biomed.
Anal. 40 (2006) 58 1.
7. C. Carnarasu, C. Madichie, R. Williams, Trends Anal. Chem. 25 (2006) 768.
8. M.-J. Rocheleau, M. Titley, J. Bolduc, J. Chromatogr. B 805 (2004) 77.
9. P. HorvBth, G. Balogh, J. Brlik, A. Csehi, F. Dravecz, Zs. Halmos, A. Lauk6, M.
RCnyei, K. Varga, S. Gorog, J. Pharm. Biomed. Anal. 15 (1997) 1343.
10. S.K. Motwani, R.K. Khar, F.J. Ahrnad, S. Chopra, K. Kohli, S. Talegaonkar, Anal.
Chim. Acta 582 (2007) 75.
11. S. Chopra, F.J. Ahrnad, R.K. Khar, S.K. Motwani, S. Mahdi, Z. Iqbal, S.
Talegaonkar, Anal. Chim. Acta 577 (2006) 46.
12. European Pharmacopoeia-Supplement, 200 1.
13. U. Holzgrabe, D. Brinz, S. Kopec, C. Weber, Y. Bitar, Electrophoresis 27 (2006)
2283.
14. S. Ahuja and S. Scypinsky (Eds.), Handbook of Modern Pharmaceutical Analysis,
Academic Press, 200 1.
15. H.-L. Koh, W.-P. Yau, P.-S. Ong, A. Hegde, Drug Discovery Today 8 (2003) 889.
16. R. Bakhtiar and R. W. Nelson, Biochem. Pharmacol. 59 (2000) 89 1.
17. N. Mano and J. Goto, Anal. Sci. 19 (2003) 3.
18. G.M. Reddy, B. V. Bhaskar, P. P. Reddy, P. Sudhakar, J. M. Babu, K. Vyas, P. R.
Reddy, K. Mukkanti, J. Pharrn. Biomed. Anal. 43 (2007) 1262.

19. B. Suchanova, L. Sispera, V. Wsol, Anal. Chim. Acta 573 (2006) 273.
20. V.A.P. Jabor, E.B. Coelho, N.A.G. dos Santos, P.S. Bonato, V.L. Lanchote, J.
Chromatog. B 822 (2005) 27.
21. R.N. Xu, L.Fan, M.J. Rieser, T.A. El-Shourbagy, J. Pharm. Biomed. Anal. (2007) In
Press.
22. S.R. Fletcher, Colloids Surf., A 288 (2006) 21.
23. D.B. Kassel, Curr. Opin. Chem. Biol. 8 (2004) 339.
24. I. Hughes and D. Hunter, Curr. Opin. Chem. Biol. 5 (2001) 243.
25. K.L. Morand, T.M. Burt, B.T. Regg, T.L. Chester, Anal. Chem. 73 (2001) 247.
26. T.K. Garyantes, Drug Discovery Today 7 (2002) 489.
27. B.A. Oslen, B.C. Castle, D.P. Myers, Trends Anal. Chem. 25 (2006) 796.
28. C.K. Lim and G. Lord, Biol. Pharm. Bull. 25 (2002) 547.
29. M.C. Ventura, W.P. Farrell, C.M. Aurigemma, M. Greig, Anal. Chem. 71 (1999)
2410.
30. S.H. Hoke, J.D. Pinkston, R.E. Bailey, S.L. Tanguay, T.H. Eichhold, Anal. Chem. 72
(2000) 4235.
3 1. B.H. Hsu, E. Orton, S.Y. Tang, R.A. Carlton, J. Chromatogr. B 725 (1999) 103.
32. J.P. Devlin (Ed.), High throughput screening. New York: Marcel Dekker, 1997.
33. L.J. Kricka, Clin. Chem. 44 (2002) 2008.
34. X. Zhao, T. You, H. Qiu, J. Yan, X. Yang, E. Wang, J. Chromatogr. B 810 (2004)
137.
35. K.K. Jain, Drug Discovery Today 10 (2005) 1435.
36. B. Suarez, B.M. Simonet, S. Chrdenas, M. Valcarcel, J. Chromatogr. A (2007) In
Press.
37. C.R. Martin and P. Kohli, Nat. Rev. h g . Discov. 2 (2003) 29.
38. K.K. Jain, Nanobiotechnology: technologies, markets and companies, Base1 7 Jain
Pharma Biotech Publications, 2005.
39. G. Guetens, K. van Cauwenberghe, G. De Boeck, R. Maes, U. R. Tjaden, J. van der
Greef, M. Highley, A. T. van Oosterom, E. A. de Bruijn, J. Chromatogr. B 739 (2000)
139.
40. R. Nageswara Rao and V. Nagaraju, J. Pharm. Biomed. Anal. 33 (2003) 335.

41. L.R. Snyder and J.J. Kirkland, Introduction to Modem Liquid Chromatography, 2nd
Ed., John Wiley and Sons, New York, 1979.
42. L. Novakova, L. Matysova, L. Havlikovaa, P. Solicha, J. Pharm. Biomed. Anal. 37
(2005) 899.
43. H. Rebiere, B. Mazel, C. Civade, P.A. Bonnet, J. Chromat. B (2006) In Press.
44. A. Panusa, G. Multari, G. Incamato, L. Gagliardi, J. Pharrn. Biomed. Anal. 43 (2007)
1221.
45. J.W. Dolan, L.R. Snyder, N.M. Djordjevicb, D.W. Hillc, T.J. Waeghed, J.
Chromatogr. A 857 (1999) 1.
46. V. Ws61, A.F. Fell, E. KvasniEkova, I.M. Hais, J. Chromatogr. B 689 (1997) 205.
47. P.K. Owens, A.F. Fell, M.W. Coleman, J.C. Berridge, Chirality 9 (1997) 184.
48. K. D. Altria and D. Elder, J. Chromatogr. A 1023 (2004) 1.
49. K. D. Altria, A. Marsh, C. Siinger-van de Griend, Electrophoresis 27 (2006) 2263.
50. F. Benavente, E. Gimenez, A.C. Olivieri, J. Barbosa, V. Sanz-Nebot, Electrophoresis
27 (2006) 4008.
51. A. Kavalirova, M. Pospisilova, R. Hamoudova, Ceska Slov. Farm. 53 (2004) 328.
52. H. Nishi, Electrophoresis 20 (1999) 3237.
53. K.D. Altria, M.A. Kelly, B.J. Clark, Trends Anal. Chem. 17 (1998) 214.
54. P.T.T. Ha, J. Hoogmartens, A.V. Schepdael, J. Pharm. Biomed. Anal. 41 (2001) 1.
55. D. Heiger, High performance capillary electrophoresis, Agilent technologies, 2000.
56. R.J. Hunter, Zeta Potential in Colloid Science, Academic Press, London, 198 1.
57. D.W.A. Sharp, Dictionary of Chemistry, 2nd Ed., Penguin Books Ltd., 1990.
58. A. Pallandre, B. de Lambert, R. Attia, A.M. Jonas, J.-L. Viovy, Electrophoresis 27
(2006) 584.
59. A. Ewing, R.A.Wallingford, T.M. Olefirowicz, Anal. Chem. 61 (1989) 292A.
60. R. Kuhn, Capillary Electrophoresis: Principles and Practice, Springer Verlag Telos,
1993.
61. S.F.Y. Li, Capillary electrophoresis. Principles, practice and applications. Elsevier
Science, 1993.
62. R. Weinberg, Practical capillary electrophoresis, 2"* Ed., Academic press, 2000.

63. K.D. Altria, Capillary Electrophoresis Guidebook-Principles, Operations and
Applications, Human Press, Totowa, 1995.
64. J. Brady, J. Russell, J. Holum, Chemistry, Matter and its Changes, 3rd Ed., Wiley and
Sons Inc., 2000.
65. A.D. Tran, S. Park, P.J. Lisi, O.T. Huynh, R.R. Ryall, P.A. Lane, J. Chromatogr. B
542 (1991) 459.
66. V.C. Trenerry and R.J. Wells, Progress in HPLC-HPCE, Brill Academic Publishers,
1997.
67. S. Terabe, Micellar Electrokinetic Chromatography, Beckman, 1992.
68. D. Attwood and A.T. Florevce, Surfactant systems, Chapman and Hall, 1983.
69. K. Altria, uww.ceandcec.com
70. Z. Deyl, I. MikSik, F. Tagliaro, Forensic Sci. Intern. 92 (1998) 89.
71. A.T. Balchunas and M.J. Sepaniak, Anal. Chem. 59 (1987) 1466.
72. N. Tanaka, K. Nakagawa, H. Iwasaki, K. Hosoya, K. Kimata, T. Araki, D. Patterson,
J. Chromatogr. A 781 (1997) 139.
73. C.P. Palmer and H.M. McNair, J. Microcolumn Separ. 4 (1992) 509.
74. J. J. Berzas, J. Roderiguez, G. Castaneda, M. J. Pinilla, Chromatographia 49 (1 999) 65.
75. M. Gratzel and J.K. Thomas, in: E. L. Wehry (Ed.), Modern Fluorescence
Spectroscopy, Plenum Press, 1976.
76. D. Crosby and Z. El Rassi, J. Liq. Chromatogr. 16 (1993) 21 61.
77. M. Blanco and I. Valverde, J. Chromatogr. A 950 (2002) 293.
78. W.-S. Huang, S.-J. Lin, H.L. Wu, S.-H. Chen, J. Chromatogr. B 795 (2003) 329.
79. Y. Pico, R. Rodriguez, J. Manes, Trends Anal. Chem. 22 (2003) 134.
80. J.J.B. Nevado, C.G. Cabanillas, M.J.V. Llerena, V.R. Robledo, J. Chromatogr. A
1072 (2005) 249.
8 1. Y. Shi, C. Huo, H. Yao, R. Gao, Y. Zhao, B. Xu, J. Chromatogr. A 1072 (2005) 279.
82. A.-C. Servais, M. Fillet, P. Chiap, W. DewC, P. Hubert, J. Crommen, J. Chromatogr.
A 1068 (2005) 143.
83. Y. Shimazaki and T. Manabe, Biochim. Biophys. Acta 1749 (2005) 95.
84. P.T. T. Ha, A.V. Schepdael, E. Roets, J. Hoogmartens, J. Pharrn. Biomed. Anal. 34
(2004) 86 1.

85. Z. Chen, K. Uchiyarna, T. Hobo, Anal. Chim. Acta 523 (2004) 1.
86. M.E. Bohlin, E. Kogutowska, L.G. Blomberg, N.H.H. Heegaard, J. Chromatogr. A
1059 (2004) 2 15.
87. Y. Tanaka and S. Terabe, J. Biochem. Biophys. Methods 48 (2001) 102.
88. S.I. Cho, J. Shim, M.-S. Kim, Y.-K. Kim, D.S. Chung, J. Chromatogr. A 1055 (2004)
241.
89. T. Bo, S.K. Wiedmer, M.L. Riekkola, Electrophoresis 25 (2004) 1784.
90. T. de Boer, R. Bijma, K. Ensing, J. Pharm. Biomed. Anal. 19 (1999) 529.
91. A.R. Khan, P. Forgo, K.J. Stine, V. T. D7Souza, Chem. Rev. 98 (1998) 1977.
92. C. J. Easton and S. F. Lincoln, Modified Cyclodextrins, Imperial College Press,
London, 1999.
93. T. Schmitt, Progress in HPLC-HPCE 5 (1 997) 3 83.
94. W. Qin, H. Wei, S.F. Li, Analyst. 127 (2002) 490.
95. M.T. Chiang, S.Y. Chang, C.W. Whang, Electrophoresis 22 (2001) 123.
96. Z. Quan, Y. Song, A. Saulsberry, Y. Sheng, Y.M. Liu, Chromatogr. Sci. 43 (2005)
121.
97. L. Fan, Y. Cheng, H. Chen, L. Liu, X. Chen, Z. Hu, Electrophoresis 25 (2004) 3163.
98. B. Zhang, I.S. Krull, A. Cohen, D.L. Smisek, A. Kloss, B. Wang, A.J. Bourque, J.
Chromatogr. A 1034 (2004) 213.
99. http://~~~~w.cy~l~dex.~om/natural cyclodextrins.htm
100. Luminescence Applications in Biological, Chemical, and Hydrological Sciences,
ACS Symposium Series 383.
101. R. I. Gelb, L. M. Schwartz, J. J. Bradshaw, D. A. Laufer, Bioorg. Chem. 9 (1980)
299.
102. R. I. Gelb, L. M. Schwartz, D. A. Laufer, Bioorg. Chem. 11 (1982) 274.
103. Y. Deng, J. Zhou, M.D. Perkins, S.M. Lunte, Anal. Cornmun. 34 (1997) 129.
104. R.J. Tait, D.J. Skanchy, D.P. Thompson, N.C. Chetwyn, D.A. Ralewski, V.J. Stella,
J.F. Stobaugh, J. Pharm. Biomed. Anal. 10 (1992) 615.
105. R.J. Tait, D.P. Thompson, V.J. Stella, J.F. Stobaugh, Anal. Chem. 66 (1994) 4013.
106. S.A. Wren and R.C. Rowe, J. Chromatogr. 603 (1992) 235.
107. S.A. Wren and R.C. Rowe, J. Chromatogr. 609 (1992) 363.

108. S.A. Wren and R.C. Rowe, J. Chromatogr. 635 (1 993) 113.
109. S. Terabe, Y. Miyashita, Y. Ishishama, 0. Shibata, J. Chromatogr. A 636 (1993) 47.
110. K. Heinig and C. Vogt, Electrophoresis 20 (1999) 33 11.
11 1. A. Marsh, B. Clark, M. Broderick, J. Power, S.Donegan, K. Altria, Electrophoresis
25 (2004) 3970.
112. R.L. Boso, M.S. Bellini, I. Miksik, Z. Deyl, J. Chromatogr. A 709 (1995) 11.
113. H. Watarai, Chem. Lett. 3 (1991) 391.
114. K.D. Altria, J. Chromatogr. A 844 (1999) 371.
115. S. Pedersen-Bjergaard, 0. Naess, S. Moestue, K.E. Rasmussen, J. Chromatogr. A
876 (2000) 201.
116. J.M. Sanchez and V. Salvado, J. Chromatogr. A 950 (2002) 241.
117. L. Vomastova, I. Miksik, Z. Deyl, J. Chromatogr. B 681 (1996) 107.
118. L.G.Song,Q.Y.Ou,W.L.YuW,G.Z.Li, J.Chromatogr.A699(1995)371.
1 19. M.F. Miola, M.J. Snowed, K.D. Altria, J. Pharm. Biomed. Anal. 18 (1998) 785.
120. K.D. Altria, J. Chromatogr. A 892 (2000) 17 1.
121. P.-E. Mahuzier, K.D. Altria, B.J. Clark, J. Chromatogr. A 924 (2001) 465.
122. K.D. Altria, Chromatographia 49 (1999) 457.
123. K.D. Altria, J. Capil. Electrophor. Microchip Tech. 7 (2002) 11.
124. K.D. Altria, M.F. Broderick, S. Donegan, J. Power, Electrophoresis 25 (2004) 645.
125. P.-E. Mahuzier, B.J. Clark, S.M. Bryant, K.D. Altria, Electrophoresis 22 (2001)
3819.
126. C. Gabel-Jensen, S.H. Hansen, S. Pedersen-Bjergaard, Electrophoresis 22 (2001)
1330.
127. H.-Y. Huang, Y.-C, Lai, C.-W. Chiu, J.-M. Yeh, J. Chromatogr. A 993 (2003) 153.
128. S.H. Hansen, Electrophoresis 24 (2003) 3900.
129. S. Pedersen-Bjergaard, C. Gabel-Jensen, S.H. Hanse, J. Chromatogr. A 897 (2000)
375.
130. S. Hansen, C. Gabel-Jensen, D.T. Mohamed El-Sherbiny, S. Pedersen-Bjergaard,
Trends Anal. Chem. 20 (2001) 614.
131. K.D. Altria, B.J. Clark, P.-E. Mahuzier, Chromatographia 52 (2000) 758.

132. Y. Lo, T. Bo, M. Li, S. Gong, K. Li, H. Lui, J. Liq. Chromatogr. Rel. Technol. 26
(2003) 1719.
133. G.Li,X.Chen,M.Liu,Z.Hu,Analyst 123 (1998) 1501.
134. B. Forgaty, E. Dempsey, F. Regan, J. Chromatogr. A 1014 (2003) 129.
135. S. Pedersen-Bjergaard, Chromatographia 52 (2000) 593.
136. R. Pompiono, R. Gotti, B. Luppi, V. Cavrini, Electrophoresis 24 (2003) 1658.
137. H.-Y. Huang, C.-L. Chuang, C.-W. Chiu, M.-C. Chung, Electrophoresis 26 (2005)
867.
138. S. Gong, T. Bo, L. Huang, K.A. Li, H. Liu, Electrophoresis 25 (2004) 1058.
139. B.M. Simonet, A. Rios, M. Valcarcel, Trends Anal. Chem. 22 (2003) 605.
140. J.M. Herrero-Martinez, P.J. Schoenmakers, W.T. Kok, J. Chromatogr. A 1053 (2004)
227.
141. Y.W. Lin, C.C. Huang, H.T. Chang, Anal. Biochem. 376 (2003) 379.
142. A.K. Lalloo, S.C. Chattaraj, I. Kanfer, J. Chromatogr. B 704 (1997 333.
143. S.E. Moring, R.T. Reel, R.E. J. van Soest, Anal. Chem. 65 (1993) 3454.
144. N. Oztekin and F.B. Erim, J. Pharm. Biomed. Anal. 37 (2005) 1121.
145. J. Koyama, I. Morita, H, Fujiyoshi, N. Kobayashi, Chem. Pharm. Bull. (Tokyo) 53
(2005) 573.
146. Y.H. Chu, L.Z. Avila, J. Gao, G.M. Whitesides, Acc. Chem. Res. 28 (1995) 461.
147. Y.H. Lee, R.G. Maus, B.W. Smith, J.D. Winefordner, Anal. Chem. 66 (1 994) 4142.
148. T. Perez-Ruiz, C. Martinez-Lozano, R. Galera, Electrophoresis 27 (2006) 23 10.
149. G. Kavran-Belin, S. Rudaz, J.L. Veuthey, J. Sep. Sci. 28 (2005) 2187.
150. L. Cao, H. Wang, H. Zhang, Electrophoresis 26 (2005) 1954.
15 1. C.W. Klarnpfl, Electrophoresis 27 (2006) 3.
152. M. Nieddu, G. Boatto, G. Dessi, J. Chromatogr. B (2007) In Press.
153. W. F. Smyth, Electrophoresis 26 (2005) 1334.
154. M.C. Hsieh and C.H. Lin, Electrophoresis 25 (2004) 677.
155. P. Bocek and P. Gebauer, Electrophoresis 5 (1984) 338.
156. J. Sadecka, M. Cakrt, A. Hercegova, J. Polonsky, I. Skacani, J. Pharrn. Biomed.
Anal. 25 (2001) 881.
157. J. Sadecka and M. Cakrt, J. Chromatogr. A 1084 (2005) 152.

158. J. Sadecka, A. Hercegova, J. Polonsky, J. Chromatogr. B 729 (1999) 11.
159. A. Hercegova, J. Sadecka, J. Polonsky, Electrophoresis 21 (2000) 2842.
160. F.W. Tempels, J. Teeuwsen, I.K. Kyriakou, G. Theodoridis, W.J. Underberg, G.W.
Somsen, G.J. de Jong, J. Chromatogr. A 1053 (2004)263.
16 1. N. Delaunay-Bertoncini and M.C. Hennion, J. Pharm. Biomed. Anal. 34 (2004) 7 17.
162. C.M. Boone, J.C.M. Waterval, H. Lingeman, K. Ensing, W.J.M. Underberg, J.
Pharm. Biomed. Anal. 20 (1 999) 83 1.
163. European Pharmacopoeia, 5 ' 9 d . , European Department for the quality of
Medicines, Strasbourg, France 2004.
164. The Unites States Pharmacopoeia USP 28, The United States Pharmacopoeia
Convention, Rockville, MD, USA 2005.
165. B.X. Mayer, M. Miiller, K.D. Altria, LC-GC Eur. 14 (200 1) 19.
166. A. Kavalirova, M. Pospisilova, R. Hamoudova, Ceska Slov. Farm. 53 (2004) 328.
167. A. Sitton, M.G. Schmid, G. Gubitz, H.Y. Aboul-Enein, J. Biochem. Biophys.
Methods 6 1 (2004) 1 19.
168. M. Jaworska, Z. Szulinska, M. Wilk, J. Chromatogr. A 993 (2003) 165.
169. P. Kiessling, G.K. Scriba, F. Suss, G. Werner, H. Knoth, M. Hartmann, J. Pharm.
Biomed. Anal. 36 (2004) 535.
170. M.R. Gomez, L. Sombra, R.A. Olsina, L.D. Martinez, M.F. Silva, 11 Farmaco. 60
(2005) 85.
171. M.T. Ackermans, F.M. Everaerts, J.L. Beckers, J. Chromatogr. 606 (1992) 229.
172. M. S. Aurora-Prado, M. Steppe, M.F.M. Tavares, E.R.M. Kedor-Hackmann, M.I.R.M.
Santoro, J. Pharm. Biomed. Anal. 37 (2005) 273.
173. I. Velikinac, 0 . Cudina, I. Jankovicb, D. Agbaba, S. Vladimirov, I1 Farmaco 59
(2004) 419.
174. M. Wallman and B.W. Wenclawiak, J. Chromatogr. A 724 (1996) 3 17.
175. B. Nickerson, J. Pharm. Biomed. Anal. 15 (1997) 965.
176. B. Jamali, S. Lehmann, J. Pharm. Biomed. Anal. 34 (2004) 463.
177. M.S. Aurora-Prado, C.A. Silva, M.F.M. Tavares, K.D. Altria, J. Chromatogr. A 105 1
(2004) 291.

178. M.S. Aurora-Prado, E.R.M. Kedor-Hackmann, M.-I.R. Santoro, T.J.A. Pinto, J.
Pharm. Biomed. Anal. 34 (2004) 441.
179. I. Toro, J.F. Dulsat, J.L. Fabregas, J. Claramunt, J. Chromatogr. A 1043 (2004) 303.
180. N. Novatchev, U. Holzgrabe, Chromatographia 57 (2003) 345.
181. J.-W. Kang, G. De Reymaekers, A. Van Schepdael, E. Roets, J. Hoogmartens,
Electrophoresis 22 (200 1) 1356.
182. F. Wienen and U. Holzgrabe, Electrophoresis 24 (2003) 2948.
183. M.A. Kelly, K.D. Altria, C. Grace, B.J. Clark, J. Chromatogr. A 798 (1998) 297.
184. R.R. Chadwick, J.C. Hsieh, K.S. Resham, R.B. Nelson, J. Chromatogr. A 671 (1994)
403.
185. A. Loregian, R. Gatti, G. Palu, E.F. De Palo, J. Chromatogr. B 25 (2001) 289.
186. H.K. Hansen, S.H. Hansen, M. Kraunsoe, G.M. Petersen, Eur. J. Phann. Sci. 9 (1999)
41.
187. K.D. Altria, R.C. Harden, M. Hart, J. Hevizi, J. Chromatogr. 641 (1993) 147.
188. M.I. Jimidar, M. De Smet, R. Sneyers, W. Van Ael, W. Janssens, D. Redlich, P.
Cockaerts, J. Capill. Electrophor. Microchip. Technol. 8 (2003) 45.
189. A. Vassort, D.A. Barrett, P.N. Shaw, P.D. Ferguson, Electrophoresis 26 (2005) 17 12.
190. M.I. Jimidar, W. Van Ael, P. Van Nyen, M. Peeters, Electrophoresis 25 (2004) 2772.
191. C. E. Siinger-van de Griend, A.G. Ek, M.E. Widahl-Nasman, E.K.M. Andersson, J.
Pharm. Biomed. Anal. 41 (2006) 77.
192. M. Jimidar, W. Van Ael, M. De Smet, P. Cockaerts, LC-GC Ew. 16 (2002) 230.
193. J.H. McB Miller and U. Rose, Pharmeuropa 13 (2001) 3.
194. A. Gavenda, J. Sevcik, J. Psotovh, P. Bednhr, P. Bart&, P. Adamovsky, V.
Sirninek, Electrophoresis 22 (2001) 2782.
195. V. Baeyens, E.Varesio, J.L. Veuthy, R. Gumy, J. Chromatogr. B 692 (1997) 2939.
196. A. Ramseier, J. Caslavsca, W. Thormann, Electrophoresis 19 (1998) 12956.
197. A. Ramseier, F. von Heeren, W. Thormann, Electrophoresis 19 (1998) 2967.
198. D.K. Lloyd, J. Chromatogr. A 735 (1996) 29.
199. R. Ramautar, G.W. Somsen, G.J. de Jong, Anal. Bioanal. Chem. 387 (2007) 293.
200. R.D. McDowell, J. Chromatogr. 492 (1989) 3.

201. F.J. Lara, A.M. Garcia-Campana, F. Ales-Barrero, J.M. Bosque-Sendra, L.E.
Garcia-Ayuso, Anal. Chem. 22 (2006) 7665.
202. M. Shou, C.R. Ferrario, K.N. Schultz, T.E. Robinson, R.T. Kennedy, Anal. Chem.
78 (2006) 6717.
203. F. Tagliaro, R. Dorizzi, S. Ghielmi, C. Poiesi, S.Moretto, S. Azchetti, M. Marigo,
Fresenius J. Anal. Chem. 343 (1992) 168.
204. L. Saavedra, C. Barbas, J. Biochem. Biophys. Methods 70 (2007) 289.
205. Z.K. Shihabi, Electrophoresis 19 (1998) 3008.
206. J. Sadecka and J. Polonsky, J. Chromatogr. A 735 (1 996) 403.
207. Q. Hu, L. Zhang, T. Zhou, Y. Fang, Anal. Chim. Acta 416 (2000) 15.
208. R.T. Kennedy, Anal. Chim. Acta 400 (1999) 163.
209. L. Tao, C.A. Aspinwall, R.T. Kennedy, Electrophoresis 18 (1 997) 2 184.
2 10. P. Janos, J. Chromatogr. A 1037 (2004) 15.
21 1. S.K. Poole, S. Patel, K. Dehring, H. Woekman, C. F. Poole, J. Chromatogr. A 1037
(2004) 445.
212. S. Bellini, M. Uhrova, Z. Deyl, J. Chromatogr. A 772 (1997) 91.
213. Z.J. Jia, T. Ramstad, M. Zhong, Electrophoresis 22 (2001) 11 12.
2 14. K. Takacs-Novak, K. J. Box, A. Avdeef, Int. J. Phann. 15 1 (1 997) 235.
215. M. Matoga, E. Laborde-Kummer, M.H. Langlois, P. Dallet, J. Chromatogr. A 984
(2003) 253.
216. R. Jankowsky, M. Friebe, B. Noll, B. Johannsen, J. Chromatogr. A 833 (1999) 83.
217. E. h s k o v , A. Linusson, S. Folestad, J. Phann. Biomed. Anal. 33 (2003) 379.
218. M.-L. Riekkola, S.W. Wiedmer, I.E. Valk6, H. Sirkn, J. Chromatogr. A 792 (1997)
13.
219. S. Fanali, J. Chromatogr. A 792 (1997) 227.
220. G. Giibitz, M.G. Schmidt, J. Chromatogr. A 792 (1 997) 179.
221. P. Baumy, P. Morin, M. Dreux, M.C. Viaud, S. Boye, G. Guillaumet, J. Chromatogr.
A 707 (1 995) 3 1 1.
222. Y.-H. Lee, T.-I. Lin, Electrophoresis 17 (1996) 333.
223. N. Li, J. Duan, H. Chen, G. Chen, Talanta 59 (2003) 493.

224. P.E. Mahuzier, M.S.A. Prado, B.J. Clark, E.R. Kedor-Hackmann, LC-GC Eur. 16
(2003) 22.
225. N. Chen, Y. Zhang, S. Terabe, T. Nakagawa, J. Chromatogr. A 678 (1994) 327.
226. B.J. Herbert and J.G. Dorsey, Anal. Chem. 67 (1995) 744.
227. Y. Ishihama, Y. Oda, N. Asakawa, Anal. Chem. 68 (1996) 1028.

- CHAPTER 2
RAPID SIMULTANEOUS DETERMINATION OF
ALKYLXANTHINES BY CZE

2.1 INTRODUCTION
The demand for fast, minimal cost and sample preparation analysis comes
from a busy environment of modem industries. Nevertheless, the acceptable
parameters of analysis, such as peak resolution, efficiency, applicable LODs and
reproducibility of the analysis should be met in the method development process.
A simple and fast capillary electrophoretic method for the simultaneous
determination of alkylxanthines and its application for the analysis of real samples
are reported in this chapter.
2.1.1 Alkylxanthines
The family of compounds alkylxanthines includes caffeine, theophylline
and theobromine. The parent compound of all alkylxanthines is xanthine (2:6 -
dihydroxypurine); found in potatoes, coffee beans, etc., it is a very weak base [I].
The chemical structures and pKa values of some compounds are presented in
Figure 2.1 and Table 2.1.
R1 R3 R7
Theophylline -CH3 -CH3 -H
Theobrornine -H -CH3 -CH3
Caffeine -CH3 -CH3 -CH3
Enprofylline -H -CH2CH2CH3 -H
Dyphylline -CH3 -CH3 -CH2CHOHCH20H
Figure 2.1. Chemical structures of some alkylxanthines.

Table 2.1. pKa values of some alkylxanthines [2,3].
Theophylline 8.8
Theobromine
Caffeine
Enprofylline
Dyphylline
The family of compounds alkylxanthines occur naturally in plants (tea
leaves, coffee beans, kola nuts). Their chemical structures arise from replacement
of the protons at position 1, 3 and 7 in xanthine with various substituents (Figure
2.1). The substitutions lead to a similar chemical structure and slightly different
pharmacological activity that has determined their use in pharmaceuticals [3].
Alkylxanthines are very well known in pharmaceutical science due to the
following properties [4]: antiasthmatic, analgesic adjuvants, antitussives,
bronchodilators, cardiac stimulants, cognition enhancers, diuretics, lipolytic
agents, cancer chemotherapy adjuvants, treatment of cerebral ischemia, treatment
of Parkinson's disease, renal failure. The frequency of human consumption of this
type of pharmacologically active compound speaks for itself. Xanthines are
present in all kinds of tea, coffee, carbonated beverages, chocolate and chocolate
products and chewing gum [5]. Adding all these factors together, the necessity for
quality control of pharmaceuticals and alkylxanthine contents of food becomes
very important.

2.1.2 Alkylxanthines in treatment of asthma
Over 3% of all people in most countries are affected by asthma [6]. It is
increasing in severity, prevalence and mortality despite a big improvement in the
treatment of asthma. Asthma is commonly attributed to exposure to environmental
agents: house dust mite, animal dander, pollen and certain chemicals. During
asthma attack the bronchi and bronchioles become partially or completely
blocked, which results in breathing difficulties. The epithelial layer of cells in
asthmatic subjects is often inflamed and damaged. Foreign particles penetrate lung
lining more easily. Antibodies recognise the foreign particles and signal to mast
cells, which release more signalling chemicals. Histamine is one of the signaling
chemicals that cause the airway's smooth muscle to contract, narrowing the
diameter of the airway. This signalling cascade sparks results even in further
inflammation and damage.
Alkylxanthines belong to the bronchodilator category of antiasthmatic
drugs. Theophylline is the one most widely employed in clinical medicine (at least
in the USA [7]). It can be used as well as theophylline-ethylenediamine, also
known as aminophylline. Theophylline "works" as an adenosine receptor (AzB)
antagonist. It "blocks" adenosine receptors on the mast cells, and that prevents
following asthma syndromes. But this hypothesis is in doubt because it was
shown [8-101, that enprophylline, having very similar structure to theophylline, is
five times more potent a bronchodilator as theophylline but does not inhibit
adenosine receptors. Several authors have shown that caffeine has properties of
weak bronchodilator [l 1 , 121. In addition to its potent bronchodilator action
theophylline also inhibits the release of mediators from mast cells [13].
A certain level of theophylline must be maintained in the blood stream at
all times for effectiveness [12]. The dosage should be individualised; the initial
dose should be light, rising slowly until the therapeutic plasma level is reached
(20 mg m ~ - ' is significant). There are some interactions with other drugs and
physiological states that may lead to enhanced clearance low concentration of
theophylline in serum, and, therefore, less efficiency [14]. Side effects of
theophylline include nausea, vomiting, stomach cramps, diarrhoea, increase in
heart rate, shakiness, restlessness, headaches, and occasionally an increase in
urination may take place [15].

2.1.3 Determination of alkylxanthines in real samples
Due to various pharmacological and toxicological effects of alkylxanthine
it is important to control them in pharmaceuticals, food and beverages. For
example, the physiological effects produced by many non-alcoholic drinks like
tea, coffee and cola depend mainly on their natural xanthine content.
A vast amount of articles in the literature has been dedicated to methods of
determination of the alkylxanthines in various samples such as bodily fluids [16-
251, pharmaceutical formulations [3, 24-30], non-alcoholic beverages and food
[14, 27, 3 1-43]. It is essential for an analytical method to be reliable, simple and
fast to determine the alkylxanthines from different sources in order to find a more
precise relationship between the amounts of consumed alkylxanthines and their
physiological effects [44]. The most common analytical techniques employed in
the analysis of alkylxanthines are chromatography, capillary electrophoresis and
spectroscopy.
2.1.3.1 Chromatographic methods
In general, chromatographic methods for the separation of alkylxanthines
require a clean-up step prior to the analysis itself and at least 20 min for the last
compound to elute. The separation time is less in the case of the analysis of a
single compound [45]. A UV detector is widely employed for quantification of
analytes at 214, 230, 270-275 or 280 nm [16] and with it the limit of detection is
often around 50 ng m ~ ' .
Holland et al. [46] developed a reversed-phased HPLC method for the
simultaneous determination of caffeine and paraxanthine in human serum. Serum
proteins were precipitated with perchloric acid. A simple composition of mobile
phase involved phosphate buffer at pH 4.9 mixed with methanol (85:15, vlv).
Even at a high flow rate of 1.75 mL min-' the elution time of the last compound
caffeine was 18 min. A UV detector was employed in this method and the limit of
quantitation (LOQ) of the method was reported to be 50 ng m ~ - ' for each drug.
Very similar time (19 min) was required to separate 13 methylxanthines in the
work of Georga et al. [19]. However, this involved a linear gradient elution of
acetate buffer and methanol. Another example of the HPLC separation of caffeine
and 11 metabolites with gradient elution was reported by Schneider et al. [47]. In
this case a gradient elution consisted of three different mobile phases and resulted
in over 25 min of analysis time.
It is possible to achieve shorter elution time if only one component is
analysed and the separation is performed on a short column. Such as in work of
Horie et al. [45] caffeine was determined in less than 3 min using 75 mm x 3 mm
i.d. column. The temperature of this separation was raised to 40°C, which also
shortened the time of analysis. Since caffeine was the only compound in the
system, multiple samples could be injected within a 2 min interval. The
determination of artificial sweeteners, preservatives and caffeine, theophylline and
theobromine on anion-exchanged column was also performed at 40°C [27]. An
isocratic elution with aqueous NaH2P04 (pH 8.2) solution containing 4% (vlv)
acetonitrile resulted in 45 min separation. The time of this analysis was very long,
however this method had advantage of having quite low LODs (4 and 30 ng m ~ - ' )
as wavelength-switching UV detection was employed which provided the
optimum sensitivity for each anlyte.
A study by Aranda and Morlock [48] demonstrated a high-performance
thin-layer chromatography in combination with electrospray ionisation mass
spectrometry (HPTLCIESI-MS) method for the quantification of caffeine in
pharmaceutical and energy drink samples. The quantification by MS was
performed in the positive ion single ion monitoring mode. The resulting LOD was
5.8 ng m ~ - ' , which was a factor of 13 lower than with HPTLC-UV. Meyer et al.
[33] achieved even lower limits of detection for caffeine and theobromine (2.5 ng
m ~ - ' ) , theophylline (1 ng m ~ ' ) using amperometric detection in combination
with HPLC separation.

2.1.3.2 Capillary electrophoresis
While capillary electrophoresis has been reported to show successful
separation of this group of compounds [2, 3, 16, 20, 21, 24, 28, 38, 41, 49-52],
lengthy capillary rinse times and pre-rinses make total analysis time long. Table
2.2 represents the comparison of the analysis time of different CE methods, Due
to the fact that most alkylxanthines are weak acids (Figure 2.1, Table 2.1), the
alkali pH of several buffers (such as borate [3, 411, phosphate [24, 281, glycine
[21, 381 or a mixture of them [201) is employed for the CE separation. Some
methods use the MEKC mode of separation [2, 3, 22, 521, thereby increasing the
necessity for lengthy rinses between the separations and irreversible modification
of the capillary takes place. MEKC is often necessary in order to determine the
neutral compounds in this group [2, 3, 211. A UV detector is widely employed in
CE methods for alkylxanthines, but sensitivity is 10-100 times lower than HPLC
[35, 361. CE offers a distinct advantage in terms of time required for analysis; it
can be as short as 2 min [24, 381. Some biological samples and beverages can be
injected directly onto the capillary without the need for the sample pretreatment
step [23, 241. Sombrab et al. [53] concluded that investigated CE and HPLC
methods for the analysis of caffeine in seed powder and commercial tablets were
equal in terms of sensitivity and precision. Furthermore, the analysis time of the
CE method was up to two times shorter than that of HPLC and solvent
consumption was more than 100-fold less.

Table 2.2. Comparison of analysis time of different CE methods.
Analytes Method Time of Rinsing Total time of
run (rnin) between analysis (rnin)
runs (min)
Caffeine, MEKC [24] 2 not reported - theobromine,
paraxanthine,
theophylline
Caffeine, MEKC [J] 4
theophylline,
dyphylline
Theophylline, MEKC [22] 30
its metabolites
Caffeine, CZE [38] 2
aspartame,
asp-phe,
benzoic acid,
phenylalanine
Theophylline, CZE [2 81 9
ephedrine,
phenobarbital
Theophylline, MEKC [2] 8
enprofylline
theobromine,
caffeine,
theophylline-
7-acetic acid,
dyphylline,
proxyphylline,
pentoxiQlline
3-6 33-36
two volumes -

A very rapid CZE-UV determination of caffeine was reported in the
presence of aspartame and benzoic acid in carbonated beverages in just 2 min.
The preconditioning of the capillary involved two volumes of run buffer [38].
Blanco and Valverde [2] have demonstrated the behavior of 8 alkylxanthines
under CZE and MEKC conditions. CZE did not allow separation of the neutral
xanthines, but that was achieved by MEKC with 20 mM tetraborate at pH 8.5 with
120 mM SDS. The last xanthine migrated after 8 min. Employment of surfactant
in the background electrolyte required quite intensive conditioning of the capillary
before the analysis (6 min with BGE, 0.1 N NaOH and water). MEKC for the
determination of fewer compounds can be quite short. Thus, Huang et al. [3]
simultaneously determined theophylline and dyphylline in 4 min. However, the
rinsing between runs with 0.1 N NaOH, deionised water and run buffer added
another 8 min to the times of analysis.
Lai and Dabek-Zlotorzynska [54] described a capillary
electrochromatography separation of caffeine, theophylline, theobromine and four
related drugs on a normal phase column with PDA detection. Excellent resolution
of all drugs was achieved using ternary mobile phase composition of
isopropanol/hexane/l mM Tris (52:40:8, pH 8). However, it resulted in long (30
min) time of analysis. The method was characterised by the detection limits at low
pg m ~ - ' level.
Microchip CE separation of alkylxanthines was reported in several papers
[55-571. Thus, Zang et al. [57] used poly(dimethy1siloxane) (PDMS) CE
microchip for the separation of caffeine and theophylline with electrochemical
detection. Microscale separation offered extremely short analysis times of 40 sec,
while simple composition of a buffer was employed (5.0 mM borate at pH 9.2
containing 10% (vlv) methanol). However, the device had to be flushed for 15
min with the run buffer prior the injection. The detection limits were 4 pM for
caffeine and theophylline.

2.1.3.3 Spectroscopic methods
Spectrophotometric determination was reported to allow accurate and
reproducible results to be obtained from sample analysis using a relatively simple
and inexpensive procedure when compared to a chromatographic technique [58].
L6pez-Martinez et al. [58] described a method of simultaneous determination of
caffeine and theobromine in coffee and tea samples using partial least squares.
Sample preparation was required to eliminate strongly interfering components.
The electronic absorption spectrum was recorded from 200 nrn to 450 nrn of
samples with Britton-Robinson buffer (pH 12) and diluted with water. The
method did not show statistically significant difference with an HPLC standard
technique.
A UV spectrophotometric method [30] was successfully used to determine
caffeine and other active ingredients in tablets. The linearity range for caffeine
was in a very narrow interval of 0.012-0.028 mg m ~ ' . This method was also
compared to LC procedure and both methods showed excellent precision and
accuracy.
Bouhsain et al. [41] developed a flow injection Fourier Transform infrared
determination of caffeine in coffee. A fully automated procedure involved on-line
extraction of caffeine with chlorophorm, measuring absorption as a function of
time at 1659 cm-', with a baseline established between 1900 and 830 cm-'. The
limit of detection was relatively high at 9 mg m ~ - ' .
The paper substrate room temperature phosphorescence (RTP) of
theobromine, caffeine and theophylline was investigated in a work of Chuan et al.
[3 11. The method was based on fast speed quantitative filter paper as substrate and
KI-NaAc as heavy atom perturber. Various factors affecting their RTP are
discussed. The method allowed very low limits of detection, e.g. 1.14 ng per spot
for theobromine, 0.78 ng per spot for caffeine and 1.8 ng per spot for
theophylline.

2.1.4 Observations
Different analytical techniques for the analysis of alkylxanthines have
been examined. Each of them demonstrated advantages and disadvantages. Thus,
both chromatographic and spectroscopic methods require a sample pretreatment
step, while some of the CE samples can be injected directly. They can achieve
very low limits of detection; and this is advantageous when the concentration of
target compounds is low. A disadvantage of the chromatographic technique is a
long time of analysis, up to 20 min, while CE methods can take just 2 min [24,
381, and sometimes methods are complicated with the necessity for gradient
elution and employment of several mobile phases [19]. Chromatographic methods
require expensive equipment compared to CE. The problem with spectroscopic
methods is that methylxanthines give high spectral overlap [58] when determined
simultaneously and that is why this technique is poorly developed. All the
methods are characterised by high reproducibility.
According to all the reasons listed above capillary electrophoresis methods
have great potential in the separation of alkylxanthines and, in the opinion of the
author, there is more potential for further improvement.

2.1.5 Aim of this study
The aim of this study was to develop a method of rapid simultaneous
determination of alkyIxanthines using capillary zone electrophoresis. To select the
optimum conditions the following factors were investigated: buffer composition,
the effect of pH, buffer concentration, voltage of separation, length of the
capillary, temperature of the separation and hydrodynamic and eIectrokinetic
types of injection. The application of the proposed method in the quality control
sf theobrornine in chocolate samples and theophylline in commercial tablets was
studied.

2.2 EXPERIMENTAL
2.2.1 Instrumentation
All separations were performed using an Agilent Technolodies 3 D ~ ~
system (Agilent Technologies). Data acquisition and signal processing were
performed using Agilent Technolodies 3 D ~ ~ ChemStation (rev. A.09.03, Agilent
Technologies). The fused silica capillaries (Composite Metal Services ltd., The
Chase, Hallow, Worcs. WR2 6LD, UK) were 63.3 cm in length (55.3 cm to the
detector) with an internal diameter 50 pm, unless otherwise stated.
2.2.2 Reagents
All analyte compounds investigated in the separations had purity 99% and
were used without further purification. Caffeine, theophylline, dyphylline (7-[2,3-
Dihydroxypropyll-theophyllin), enprofylline (3-propylxanthine), theobromine
(3,7-dimethylxanthne), sodium phosphate (monobasic and dibasic), HEPES (N-
[2-Hydroxyethyllpiperazine-N'-[2-ethanesulfonic acid]), CAPS
(cyclohexylamino-1 -propane sulfonic acid), Tris ([hydroxyrnethyl]aminomethane
hydrochloride and Trizma base), HCl, NaOH were purchased from Sigma-
Aldrich, Dublin, Ireland. Methanol (HPLC grade) was from Lab-Scan, Dublin
Ireland. Boric acid was obtained from Riedel-de Haen, Seelze, Germany. Buffers
were prepared using distilled water and adjusted using 1 M and 0.1 M NaOH and
0.1 M HCL. Tris buffer was adjusted using Tris acid or Tris base.
2.2.3 Standards
Stock solutions of 10 mM caffeine, theophylline, dyphylline, 2 mM stock
of theobromine and 1 mM stock of enprofylline were prepared in distilled water.

2.2.4 Sample preparation
2.2.4.1 Chocolate
The sample preparation technique was taken directly from the literature
[59] and was not further optimised in this work.
Samples of chocolate were placed into a mortar and pestle. Liquid
nitrogen was poured over the chocolate to freeze it, allowing it to be ground into a
fine powder. One gram of this chocolate powder was measured using an analytical
balance, and 5 ml of chloroform was added in a conical flask. This sample was
placed in a sonicator for 50 min until the solution became a suspension of very
small particles. A syringe and a 0.22 pm filter were used to remove any large or
precipitated particles. 2.5 ml of the filtered extracted solution was transferred into
another vial. The chloroform was evaporated by placing the vial into a warm
water bath and blowing an air stream over it. 10 ml of ethanol was added to the
vial following the evaporation, and a gentle swirling action was applied to
dissolve the crystals of the compounds in the ethanol. The dissolved ethanol
solution was placed into an HPCE vial using a micropipette, while taking care to
avoid transferring any of the cocoa butter (insoluble in ethanol) into the vial. The
vial was placed into the auto sampler for analysis.
2.2.4.2 Pharmaceutical tablets
Each of 10 commercial tablets containing 300 mg of theophylline was
weighed and finely powdered. Three samples of 0.01 g of the tablet powder were
placed in 100 ml volumetric flasks, filled with water and then sonicated until
dissolved (40 min). The solutions were filtered through a 0.22 pm filter and
transferred to the vials that were placed into the autosampler for CE analysis.

2.2.5 Procedure
A11 buffers were sonicated for 15 min and filtered through a 0.2 pm filter
before use. Test mixtures of analytes were diluted in the separation buffer.
Xanthines were detected at 200 nm, where all exhibited maximum absorption.
Separations were carried out at 3 0 kV elecbophoreti c voltage and a temperature of
23*C, unless otherwise stated. Injections were hydrodynamic at 50 mbar for 4 sec,
unless otherwise stated. Conditioning of the CE capillary between m s was
performed with 0.1 M NaOH for 2 min, water for 5 min and run buffer for 5 min,
unless otherwise stated. All separations were repeated at least three times.

2.3 RESULTS AND DISCUSSION
2.3.1 Buffer study
2.3.1.1 Buffer selection
For the purpose of this study caffeine and theophylline were employed as
test analytes. In order to perform a separation in CE the mobility of analytes
should be different. To ensure the separation of caffeine and theophylline at least
one of the compounds should possess its own mobility. Since pKa value of
caffeine (14) is much higher than pKa of theophylline (8.8) the pH of the
separation buffer should at least provide the ionization of theophylline. At the pH
near 8.8 theophylline is partially negatively charged (due to 50% dissociation at
R7) and moves along the capillary with its own velocity, while caffeine is neutral
and migrates with EOF, according to the CZE theory. Four buffers meeting the
conditions above were studied (Table 2.3).
Table 2.3. Working pH range of several buffers [60].
Buffer Useful pH range
Borate 8.14- 10.14
Phosphate 6.20 - 8.20
HEPES 6.55 - 8.55
Tris 7.30 - 9.30
The separation of caffeine and theophylline with all buffers is shown in
Figure 2.2. Separation with borate and Tris buffers was found to give the shortest
migration times for analytes of the choice at given pH, that is why they were
chosen for further investigation.

1 ' " ' 1 " " ' 1 " " I
1 2 3 4 migration time, min
Figure 2.2. Separations of caffeine and theophylline with different buffers. Separation conditions: A - 10 mM borate pH 8.5, B - 10 mM phosphate pH 8, C - 10 mM HEPES pH 8.5, D - 10 mM Tris pH 8.5; separation voltage 30 kV, capillary 63.3 cm (55.3 cm - effective length), 50 pm i.d.; 230C; hydrodynamic injection 4 seconds; UV detection 200 nm. Peak identification: l=caffeine, 2=theophylline. Concentration of analytes 0.5 mM.

2.3.1.2 Buffer pH.
The pH study was carried out to investigate the mechanism of the
separation of target analytes and find out the optimum pH. Figure 2.3 and Figure
2.4 show the effect of the pH of borate buffer and Tris on the effective mobility of
analytes. The effective mobility of caffeine was zero as it was neutral within
investigated pH range and migrated with EOF at all times. At the pH below 8, it
was not possible to separate the two components as the mobility of theophylline
was very close to that of EOF. At pH 8 separation occurred with the resolution 1.3
as theophylline is partially negatively charged and its mobility was different from
EOF. Since it migrated towards the anode its mobility was negative and it exited
the capillary after neutral caffeine. With further increases in pH, theophylline was
fully charged and the difference of the mobility of two analytes became more
significant, so as the migration times.
Figure 2.3. Effect of borate buffer pH on the effective mobility of analytes. Buffers concentrations 10 mM, other separation conditions as in Figure 2.2. + - caffeine, -+ - theophylline.

Figure 2.4. Effect of Tris pH on the effective mobility of analytes. Buffers concentrations 10 mM, other separation conditions as in Figure 2.2. + - caffeine, -I- - theophylline.
Taking into account resolution and migration time, the optimum pH for the
separation of caffeine and theophylline was found to be pH 8.5 for borate buffer
and pH 9.25 for Tris.

2.3.1.3 Buffer concentration
The increase in buffer concentration from 10 mM to 100 mM led to
similar effects in the case of borate buffer and Tris. The effect of the buffer
concentration on the mobility of EOF and effective mobility of theophylline is
shown in Figure 2.5 and Figure 2.6. The migration time of both analytes increased
with the increase in concentration of buffer. A decrease in the magnitude of EOF
with increasing buffer concentration was correlated to a decrease in the zeta
potential due to the compression of double layer at the capillary wall [60]. The
effective mobility of theophylline was not significantly affected by the
concentration of both buffers. Enhancing the concentration of a buffer might
provoke excessive Joule heating, which can have undesirable effects on resolution
and analyte stability. In this case resolution of caffeine and theophylline was
greater than 10 at all concentrations. All separation factors were considered,
therefore the buffer concentration 10 mM was chosen as the optimum for borate
and Tris buffers.
Concne tmtion, mM I Figure 2.5. Effect of the concentration of borate buffer on the mobility of EOF (caeine) and effective mobility of theophylline. Buffers pH 8.5, other separation conditions as in Figure 2.2. - EOF (caffeine), - - theophylline.

Figure 2.6. Effect of the concentration of Tris buffer on the mobility of EOF (caffeine) and effective mobility of theophylline. B e e r s pH 8.5, other separation conditions as in Figure 2.2. + - EOF (caffeine), +- - theophylline.

2.3.1.4 Ohm's law plot
An Ohm's law plot of current (rnA) versus voltage (kV) was plotted.
Figure 2.7 shows current generated in CE system, depending on applied voltage
which is usually used to indicate excessive heat generation [61]. As can be seen,
the increase in current was proportional (~~=0.9996) to the voltage applied, so
there was no temperature increase observed within the whole voltage interval
using 10 mM borate pH 8.5 and 10 mM Tris pH 9.25. The separation at higher
voltage is more desirable as it provides a shorter migration time and sharpness of
peaks and resolution [61]. Thus, 30 kV was found to be the optimum for both
buffers.
Figure 2.7. Ohm's law plot representing current generated as a function of applied voltage. - 10 mM borate pH 8.5, y = 0.331~ + 0.1244, R' = 0.9997. * - 10 mM Tris pH 9.25, y = 0.2247~ + 0.1814, R' = 0.9996. Other seprtmaion conditions as in Figure 2.2.

2.3.1.5 Optirnising the separation
Comparison of the parameters (Table 2.4) of the optimal separations with
borate and Tris buffers shows that both buffers have a very good resolution of the
two peaks, given similar times of analysis. The difference is in the efficiency of
peaks: with borate, the efficiency is much higher and it is preferential for
quantitative analyses.
Table 2.4. Comparison of separation data for caffeine and theophylline. n = 3
Analyte t I~I %RSD N
(Inin) ( t 3
10 mM Borate caffeine 2.39 0.06 150275*14425 10.3
pH 8.5 theophylline 2.66 0.02 164287*7445
10 mM Tris caffeine 2.12 0.75 90766k13879 12.5
pH 9.25 theophylline 2.66 0.99 34390h4856

2.3.2 Study of capillary conditions
This study was carried out with caffeine, theophylline and dyphylline as
target analytes. Dyphylline is a derivative of theophylline with -
CH2CHOHCH20H radical at N7 (Figure 2.1). Its pKa is 1 1.6 [3], therefore at the
conditions of the CZE method under investigation it migrated with EOF, as was
the case with caffeine. Even a high pH, near 12 (CAPS buffer) does not
deprotonate dyphylline and it cannot be separated from caffeine this way.
The unique reaction of borate ions with vicinal diols (such as dyphylline)
is known [62, 631. The complexation with borate ions in the background
electrolyte (BGE) generates charge on the dyphylline molecules and that is how it
emerged after EOF although it possessed no ionisable chemical group [2]. Thus,
borate buffer was chosen for separation of the three compounds.
Tables 2.5 and 2.6 show the parameters of the separation while optimising
the pH and concentration of borate buffer.
Table 2.5. Parameters of separation for optimising pH of borate buffer, concentration 20 mM. n =3
Buffer R 0 N
PH caffeine dyphylline theophylline
* R - resolution of caffeine and dyphylline peaks. The resolution of dyphylline and theophylline was greater than 10 in all experiments.

Table 2.6. Parameters of separation for optimising concentration of borate buffer, pH9.n=3
Buffer R * N N N
concentration caffeine dyphylline theophylline
10 mM 1.2 85565 58164 148528
* R - resolution of caffeine and dyphylline peaks. The resolution of dyphylline and theophylline was greater than 10 in all experiments.
The highest efficiency of analytes and acceptable resolution of caffeine
and dyphylline was achieved at pH 9 and concentration 20 mM. It has to be noted
that resolution of dyphylline and theophylline was greater than 10 at all times and
thus was not under investigation. Further increase in concentration of borate
resulted in similar efficiency of peaks and resolution 3.3, which is not required for
separation of two analytes. The separation of caffeine, theophylline and
dyphylline with 20 mM borate at pH 9 is shown in Figure 2.8.

Figure 2.8. Electropherogram of separation of three compounds with 20 rnM borate pH 9. Peak identification: l=caffeine (EOF), 2=dyphylline, 3=theophylline. Concentration of each compound 0.5 mM. Other separation conditions as in Figure 2.2.
2.3.2.1 Capillary length
The full length of the capillary is that from the injection end to the exit
end. The effective length is from the point of injection to the point of detection.
As UV detection was used in this experiment, effective length was 55.3 cm, while
total length of the capillary was 63.3 cm. In the case of detection outside of the
capillary (mass spectrometry), both lengths are equivalent. The migration time
and mobility depend on the effective length, whereas the electric field is
determined by total length [60].

At the capillary length mentioned above, the last component (theophylline)
migrated at 3.3 min. When the capillary was shortened by 7 cm, the migration
time of theophylline shortened to 2.7 min. The decrease in migration time was
accompanied by a decrease in resolution of caffeine and dyphylline, but the small
increase in pH up to 9.1 (was 9.0) achieved acceptable resolution. Comparison of
the separation at different capillary lengths is shown on Figure 2.9.
Figure 2.9. Capillary length effect. A - 63.3 cm (55.3 cm), B - 56.3 cm (48.3 cm). Separation conditions: 20 mM borate pH 9.1. Peak identification: l=caffeine (EOF), 2=dyphylline, 3=theophylline. Concentration of each compound 0.5 mM. Other separation conditions as in Figure 2.2.
Since the total length of the capillary was changed, the electric field has
also changed. The linearity of the Ohm's law plot was tested again. The increase
in current with voltage was proportional (~~=0.9967) across the whole interval.
The maximum voltage of 30 kV was chosen to achieve the faster separation.

2.3.2.2 Temperature effect
A series of experiments were accomplished in order to investigate the
influence of varying temperature on the separation of caffeine, theophylline and
dyphylline.
The Agilent CE system is supplied with a thermostat, which allows the
temperature of the cassette to be maintained at the 4-60°C. The separation of
caffeine, theophylline and dyphylline was performed at 25, 35, and 45, 55°C.
From Figure 2.10 it is clear that an increase in the temperature strongly affected
the migration parameters of the separation.
Migration h e , mifi
Figure 2.10. Temperature effect. Separation conditions: 20 mM borate pH 9.1. A - 25OC, B - 35OC, C - 45OC, D - 55OC; separation voltage 30 kV; capillary 56.3 cm (48.3 cm - effective length), 50 pm id.; hydrodynamic injection 4 seconds; UV detection 200 nm. Peak identification: l=caffeine (EOF), 2=dyphylline, 3=theophylline. Concentration of each compound 0.5 mM.

Thus, the increase in temperature of the cassette provoked a decrease in
resolution of caffeine and dyphylline accompanied by peak broadening. As
mentioned above, the resolution of these two compounds is based on
complexation of dyphylline with borate ions; as expected, with the temperature
increase this complex becomes weaker and, thus, the resolution disimproves.
Tailing off of the peaks occurred due to the increase of the diffusion due to overall
elevated column temperatures, or radial gradients in temperature causing changes
in the pH, mobility, distortion of the flat zone profile, and convection [64].
Increased temperature of the separation resulted in significantly shorter
migration time of analytes. Further experiments showed that by increasing the pH
of 20 mM borate buffer to 9.4 (previously 9.1) at 55OC, the resolution of caffeine
and dyphylline peaks approached 1.5.
Figure 2.1 1 shows that the current, generated in the capillary at 55OC was
nearly twice as great as that generated at 25OC, but the increase in current with
voltage remained proportional (~~=0.9994) , therefore the maximum applied
voltage 30 kV still could be used for faster separation.
Figure 2.11. Ohm's law plot representing current generated as a function of different applied voltage. Separation conditions: 20 mM borate pH 9.4, capillary length 56.3 cm (48.3 cm to the detector), temperature 55OC.

2.3.2.3 Injection type
CE requires only minute volumes of sample to be loaded into the capillary
to maintain high efficiency [60]. Typically the plug length of the sample should be
1-2% of the whole capillary length. Hydrodynamic and electrokinetic injections
were investigated in this study. Hydrodynamic injection was performed by
applying pressure of 50 mbar for 1,2, 3,4, 5, and 6, 10 sec. The parameters of the
obtained separations are represented in the Table 2.7.
Table 2.7. Parameters of optimisation of time of hydrodynamic injection (50 mbar). n = 3
- Injection R * N N N
time, sec caffeine dyph ylline theophylline
* R - resolution of caffeine and dyphylline peaks. The resolution of dyphylline and theophylline was greater than 10 in all experiments.

Electrokinetic injection was accomplished by applying the voltage when
the injection end of the capillary was in the sample vial. The results of applying 3,
5, 8, 10, 15 kV for 5 sec are shown in the Table 2.8.
Table 2.8. Parameters of the optimisation of voltage of electrokinetic injection (5 sec). n = 3
Voltage, R * N N N kV caffeine dyphylline theophylline
* R - resolution of caffeine and dyphylline peaks. The resolution of dyphylline and theophylline was greater than 10 in all experiments.
Form Table 2.7 and 2.8 it can be seen that the increased amount of sample
loaded onto the capillary resulted in a decrease in resolution of caffeine and
dyphylline and efficiency of all peaks. In case of analysis where the sensitivity of
the method is of high importance, the hydrodynamic injection over a longer period
of time or electrokinetic injection by a higher voltage is favourable. In this study
higher resolution of caffeine and dyphylline and high efficiency of all peaks was
taking into the account. The optimum parameters of hydrodynamic injection were
1 sec at 50 mbar and electrokinetic injection - 3 kV for 5 sec. In this case
hydrodynamic injection is somewhat more preferable.
2.3.3 Other parameters of separation
Caffeine, theophylline, dyphylline, theobromine and enprofylline were
involved at this stage of the study. Theobromine has the same molecular formula
as theophylline, but the difference in structure is that one of the -CH3 radicals is at
N7 and proton is at N1 (Figure 2.1), pKa 10. Enprofylline is a derivative of
theophylline with -CH2CH2CH3 at N3 and two protons at N1 and N7 (Figure 2. I),
pKa 8.4. At pH 9.3 theobromine was partially negatively charged, which was
sufficient for its mobility to be different from all other compounds in the sample
and elute the capillary after caffeine and dyphylline.
The difference in pKa of enprofylline and theophylline is 0.4 (Table 2.1)
and, therefore, pH 9.4 was not sufficient for their separation even though they
were both fully deprotonated. As expected, the long alkyl radical at N3 atom of
enprofylline partially compensates the negative charge that appears due to
deprotonation of the molecule and that is how enprofylline migrated faster than
theophylline in the capillary. A baseline separation of enprofylline and
theophylline was achieved with a slight increase in pH of the run buffer or by
increased temperature of the separation. The electropherograms of the obtained
separations are presented in Figure 2.12. The increase in the temperature was
preferential due to the shorter analysis time while the baseline resolution of
caffeine - dyphylline and enprophylline - theophylline was achieved (>I .5 ) .

Figure 2.12. Electropherograms of the alkylxanthine separation at different temperature and pH of the run buffer. Separation conditions: 20 mM borate, A - 2S°C, pH 9.4, B - 55OC, pH 9.4, C - 25OC, pH 9.6, D - 55OC, pH 9.6; separation voltage 30 kV, capillary 56.3 cm (48.3 cm - effective length), 50 pm id., hydrodynamic injection 1 second, W detection 200 nm. Peak identification: l=caffeine, 2=dyphylline, 3=theobromine, 4=enprophylline, 5=theophylline. Concentration of each compound 0.05 mM.

2.3.3.1 Rinsing between runs
Many studies have shown lengthy rinse steps in CZE (Table 2.2). This
adds to the overall analysis time and is often not reported, thereby providing an
ambiguous or false impression of the actual analysis time. A series of experiments
were performed in order to investigate the influence of capillary rinsing between
runs on the separation. As stated in section 2.2.5, all experiments before this were
accomplished with 2 min 0.1 N NaOH, 5 min water, and 5 min buffer rinse.
Rinsing time was reduced with all possible combinations of rinses and finally it
was found that rinsing could be excluded altogether. Resolution, efficiency and
migration time were not affected by this significantly. Some of the results are
presented in Table 2.9.
Further experiments were accomplished without rinsing between runs. It
allowed a single analysis to be performed in 2 min. And this is the shortest
reported time for separation of caffeine, theophylline, dyphylline, enprophylline
and theobromine by CZE to the author's knowledge. For 100 injections the
migration time demonstrated that buffer depletion had began to occur >1.5%
%RSD.
Table 2.9. Integration data for optimising rinsing conditions between runs (n=S). 1 - caffeine, 2=dyphylline, 3=theobromine, 4=enprophylline, 5=theophylline.
a - Conditions 1 - 1,5 min 0,l N NaOH+1,5 min water+3 rnin buff; Conditions 2 - 1,5 min 0,l N NaOH+1,5 min water+2 min buff; Conditions 3 - 1,5 min 0,l N NaOH+1,5 min water+l rnin buff; Conditions 4 - 1 min 0,l N NaOH+l min water+3 rnin buff; Conditions 5 - No rinse, injection only; b - R2-3 > 5 and R3-4 > 17 in all cases.

2.3.3.2 Calibration
The calibration graphs were established with the peak-area as ordinate
versus the concentration in m M as axis. From the slopes of the curves the method
showed greater sensitivity towards theophylline determination and least far
dyphylline. The linear regression equations were obtained as follows: for caffeine
assay: y = 17 .958~ + 0.1 636, n=5, ~ ~ 4 . 9 9 9 7 ; for theophylline assay: y = 23.508~
+ 1.1693, n=S, IX2=0.999 1; for dyphylline assay; y = 17.609~ + 1.1 147, n=S,
~ ~ = 0 . 9 9 8 5 ; for theobromine assay: y = 20.402~ + 0.0001, n=5, ~'=0.9991; for
enprophylline: y = 20.091~ + 0.0216, n=5, ~'=0.9995. The data indicates good
linearity of the method over the studied range 0.01 mM - 8 mM for caffeine and
dyphylline, 0.01 mM - 10 mM for theophylline, 0.01 mM - 1 mM for
theobromine and 0.00 1 - 0.8 mM for enprow fine.

2.3.3.3 Precision of the method
In order to measure the precision of the developed method the repeatability
of the migration time, peak area and concentration for each analyte were
determined. Relative standard deviations of the migration time and peak area of
analytes are shown in Table 2.10. Here it can be noted that acceptable %RSD
values were achieved. Table 2.1 1 represents data on repeatability of the method.
Here three concentrations are sown (each measured in triplicate) and %RSD for
all measurements are below 5%. Results show that in general at higher analyte
concentration in each case %RSD values improved with the exception of
enprofylline.
Table 2.10. Repeatability parameters of the migration time and peak areas. n = 5
Analyte t" %RSD Peak area %RSD
Caffeine 1.28 0.10 3.4 1.67
Dyphylline 1.32 0.06 3.5 1.42
Theobromine
Enprofylline 1.81 0.22 1 .O 3.54
Theophylline 1.85 0.1 1 4.9 2.06

Table 2.11. Data on repeatability of the method. n = 3
Concentration Concentration RSD (%) 95% Confidence
known (mM) found (mM) interval
Caffeine
Theophylline
0.5 0.520 h 0.016 3.05 0.502 - 0.538
1 1.045 * 0.017 1.67 1.025 - 1.065
5 5.090 h 0.056 1.10 5.028 - 5.154
Dyphylline
0.5 0.524 * 0.017 3.26 0.504 - 0.543
1 1.048 h 0.03 1 2.98 1.012 - 1.083
5 5.236 * 0.098 1.86 5.126 - 5.347
Theobromine
0.1 0.103 * 0.006 4.76 0.097 - 0.108
0.5 0.514 * 0.021 4.15 0.490 - 0.539
1 1.021 h 0.006 0.55 1.015 - 1.028
Enprofylline
0.1 0.107 * 0.007 2.70 0.103 - 0.109
0.5 0.509 * 0.006 1.13 0.503 - 0.516
0.8 0.793 h 0.017 2.20 0.773 - 0.813

2.3.3.4 LOQs and LODs
For this study the limits of detection were calculated on the basis of the
baseline noise, where LOD is defined as the concentration of sample that
generates a peak of height 3 times the level of the baseline noise. Limits of
quantitation were defined as the concentration of sample that generates a peak of
height 10 times the level of the baseline noise. The LODs and LOQs are listed in
the Table 2.12. Detection for the study varied between 1.8 mg L-' and 2.5 mg c'. This range is ideally suited for determination of the samples under investigation,
as will be discussed later.
Table 2.12. Limits of detection and quantitation.
Compound LOD, LOD, LOQ,
M mg L-' mg L-'
Caffeine l*10-~ 1.9 3.8
Theophylline l*10-~ 1.8 5.4
D yphylline l*10-~ 2.5 10
Theobromine l*10-~ 1.8 5.4
Enprofylline l*10-~ 1.9 5.7

2.3.4 Application to real samples
The applications of the proposed method in the quality control of
theobromine in chocolate samples and theophylline in tablets were studied.
2.3.4.1. Chocolate
Methylxanthine has previously been determined in different types of food
and beverages, including coffee, tea, carbonated beverages, some chocolate
products, caffeinated water, and chewing gum [5]. The majority of research has
focused on the analysis of methylxanthines in coffee, tea and cola beverages [65].
Different variations of HPLC [17, 32, 33, 37, 661 and CE [24, 37, 38, 40, 411
methods were commonly used to determine these aqueous-based beverages and
the sample preparation required was minimal. Paper substrate room temperature
phosphorescence was reported in the analysis of chocolate, tea and coffee [31].
Noticeably less data exists on the contents of methylxanthines in chocolate food
and beverages [65]. Caffeine and theobromine contents have been reported for
some chocolate products including commercial hot chocolate [67], bakery
products [68], chocolate milk 1691, cocoa powder [70] and chocolate cereal [71].
To the author's knowledge there is no information about the CE method being
employed in the analysis of methylxanthines in chocolate. And thus this work is
the first determination of theobromine in chocolate by CZE.
Due to the global consumption of chocolate and the potential
physiological effects of theobromine, both health professionals and consumers
desire to know the theobromine contents of food. Levels of theobromine in
chocolate products vary and depend on the type of chocolate. For instance, there
are higher quantities of theobromine in plain chocolate and in higher quality
chocolate; while milk chocolate and lower quality chocolate contains lower levels
of theobromine [72].
Sample pretreatment is the most difficult issue in the analysis of any type of
food. Since the extraction of theobromine from the chocolate was not the goal of this
work, the sample preparation technique was taken directly from [59] and was not
optimised. Eight different chocolates from 3 brands and one type of cocoa powder
were analysed.
As expected, theobromine was determined in all samples of milk, dark
chocolate and cocoa powder, but not in the samples of white chocolate. Figure
2.13 shows electropherograms of the white chocolate "Milkybar", milk chocolate
"Bubbly" and dark chocolate "Bournville". It is noticeable from the
electropherogram that the concentration of theobromine in dark chocolate was
higher than in milk chocolate (as expected from % cocoa in the sample).
The time of a single analysis was less than 2 min. There are three peaks on
the electropherogram. The first peak on each electropherogram corresponded to
caffeine (spiked) and other components of the sample that migrated with EOF.
Since the sample was dissolved in ethanol, the negative peak on the
electropherograrns was the ethanol peak. The theobromine peak did not interfere
with any of them. The calibration of theobromine in ethanol was performed for
this analysis. The bracketing standards method was employed in order to reliably
quanitate theobromine in chocolate samples. During one day of analysis
theobromine standards (n=5) were injected before and after the injections of the
chocolate samples to ensure that the obtained concentration of standards was in
agreement with the calibration curve. The concentrations of theobromine in all the
samples are represented in a Table 2.13. The bar chart in Figure 2.14 represents a
comparison between the amount of theobromine and cocoa solids in the chocolate
bars.

Figure 2.13. Electropherograms of chocolate samples. A - Millqbar, B - Bubbly, C - Bournville. Peak identification: l=EOF, 2=ethanol, 3=theobromine. Separation conditions as in Figure 2.12 (B).

Table 2.13. Concnetrationof theobrominein the analysed samples.
Name of chocolate Type of chocoIate Theobromine content,
mg f4-I
Cadbury "Bubbly" milk 0.78k0.08
Cadbury LY3~umvi11e" dark 1.46zk0.08
Nestle "Milkybar" white Not detected
Nestle "Aero All Bubble" milk 0.82N.05
Nestle "Aero All Bubble" milk and mint 0.44rlf0.07
Cadbury "Buttons'" milk 0.58k0.02
Cadbury "Buttons" white Not detected
Tmy 's "Orange" milk
Cadbury "Cocoa" cocoa powder 3.91zt0.34

Figure 2.14: The comparison of determined concentration of theobromine and cocoa solids in analysed samples. - theobromine concentration, mg g-l , - cocoa solids minimum, % a - no data, b - information taken from the wrapping.
The highest concentration of theobromine in cocoa powder corresponded
to 100% of cocoa solids. A theobromine concentration of 1.46 mg g-l in dark
chocolate "Bournville" approached very close to 39% of cocoa solids. All samples
of milk chocolate with 20-25% of cocoa solids had some variations in the
theobromine concentration. Nestle chocolate "Aero All Bubble" (mint) contained
noticeably less theobromine. This is due to the nature of this chocolate, which
consists of mint part and milk chocolate outer coating. There is no data on cocoa
solids contained on the product, but it is clear that it is only the chocolate part that
contains it.

Table 2.14 represents statistical analysis of the data obtained. Relative
standard deviations for peak area were less than 596, while the %RSD of the
extraction was over 5%, and especidly high in the case of Nestle "Aero All
Bubble"(rnint) (%RSD 15.02). The reason for this is the heterogeneous nature of
the sample. As previously stated, the extraction method was not aptimised since it
was not the objective of this work.
Table 2.14. Relative standard deviations of CE analysis and extraction. n = 3
Sample %RSD (area) %RSD (extraction)
Nestle
"Aero All Bubble"
Nestle 4.35
"Aero All Bubble" mint 0
3 '46

2.3.4.2 Pharmaceuticals
A tablet sample containing theophylline was analysed using the optimised
method. The labeled amount of theophylline was 300 mg. An electropherogram of
the theopek sample is shown in Figure 2.15. A single analysis was completed in
less than 2 min. Theophylline was the only peak in this separation. Analytical
results for content uniformity of theophylline tablet obtained fi-om a commercial
source are shown in Table 2.15. Analytical values fell within labeled amount of
94.0- 106.0% for theophylline required by the USP 25 1731.
Migation time: min
Figure 2.15. Electropherogram of commercial sample. Peak identification: l=theophylline. Separation conditions as in Figure 2.12 (B).

Table 2.15. Analytical results for content uniformity of theophyIline tablet obtained from a commercial source
Tabletn Amount foundb (mg) Claimed content (%)
1 292.6 k 5.2 98
10 283.6 h 9.6
Mean (%I
S.D. 2.9
a Labeled amount of theophylline in each tabIet was 300 mg.
Mean rt S.D. (n=3$

2.4 CONCLUSIONS
A rapid CZE method was developed for the determination of
alkylxanthnes in pharmaceuticals and food samples. The main advantage of this
method is a very short (2 min) full time of a single analysis. It is the shortest
reported time of a complete analysis of above mentioned components by CZE to
the author's knowledge. While 40 sec was reported [57] for analysis of caffeine
and theophylline with CE microchip, the devise has to be rinsed for 15 min with
the running electrolyte prior to the injection. The same method can be used as for
the separation of single compounds as for the mixture of them. The peculiarities
of the method are as follows: caffeine cannot be determined if other neutral
components are present that migrate with EOF (then MEKC must be employed).
If dyphylline is analysed, samples must be dissolved in the borate buffer with
concentration and pH close to the run buffer (20 mM borate pH 9.4). It is
advisable to rinse the capillary with 1 M HCl, 1 N NaOH, MeOH, distilled water
and run buffer once a day (before the analysis). If lower LODs are required, the
injection volume may be increased.
This method is a good alternative technique to HPLC and could be useful
for quality control in pharmaceutical and food industries. The proposed method
has been successfblly applied for the essay of theobromine in chocolate samples
and theophylline in commercial tablets.

2.5 REFERENCES
1. Dictionary of organic compounds, Oxford University Press, 4th Ed., 1976.
2. M. Blanco and I. Valverde, J. Chromatogr. A 950 (2002) 293.
3. W.-S. Huang, S.-J. Lin, H.L. Wu, S.-H. Chen, J. Chromatogr. B 795 (2003)
329.
4. J. W. Daly, J. Autonomic Nervous System 81 (2000) 44.
5. G.J. Hoch, Food Processing 59 (1998) 27.
6. http://~~~.webhealthcentre.com/centers/asthma.asp
7. S.H. Snyder, Trends in Neurosciences 4 (1981) 242.
8. A.S. Robeva, R.L. Woodard, X. Jin, Z. Gao, S. Battacharya, H.E. Taylor, D.L.
Rosin, J. Linden, Drug. Dev. Res. 39 (1996) 243.
9. J. Linden, T. Thai,H. Figler, X. Jin, A.S. Robeva, Mol. Pharmacol. 56 (1999)
705.
10. E. Lunell, N. Svedmyr, K.E. Andersson, C.J.A. Persson, Eur. J. Clin.
Pharrnac. 22 (1982) 395.
11. L.E. Brackett, M.T. Shamin, J.W. Daly, Biom. Pharmac. 39 (1990) 1897.
12. M. Williams and M.F. Jarvis, Pharmocol., Biochem. Behav. 29 (1988) 433.
13. A. Sydbom and B.B. Fredholm, Acta. Physiol. Scand. 114 (1982) 243.
14. http:llwww.allerm.edoc.cod 1996 ~cl~ives/pdf/jul 961 1 .pdf
15. htt~://www.asthmaandaller~~center.com/a -- page-34.asp
16. E. Schreiber-Deturmeny and B. Bruguerolle, J. Chromatogr. B 677 (1996)
305.
17. M.S. Bispo, M.C. Veloso, H.L. Pinheiro, R.F. De Oliveira, J.O. Reis, J.B. De
Andrade, J. Chromatogr. Sci. 40 (2002) 45.
18. I. Pkrez-Martnez, S. Sagrado, M.J. Medina-Hernhndez, Anal. Chim. Acta 304
(1995) 195.
19. K.A. Georga, V.F. Samanidou, I.N. Papadoyannis, J. Chromatogr. B 759
(2001) 209.
20. I. M. Johansson, M.-B. Gron-Rydberg, B. Schmekel, J. Chromatogr. A 652
(1993) 487.
21. T. Hyotylainen, H. Sirkn, M.-L. Riekkola, J. Chromatogr. A 735 (1996) 439.
22.Z.-Y. Zhang, M.J. Fasco, L. S. Kaminsky, J. Chromatogr. B 665 (1 995) 201.
23. D.K. Lloyd, J. Chromatogr. A 735 (1996) 29.

24. Y. Zhao and C.E. Lunte, J. Chromatogr. B 688 (1997) 265.
25. R.V.S. Nirogi, V.N. Kandikere, M. Shukla, K. Mudigonda, D.R. Ajjala,
J. Chromatogr. B (2006) In Press.
26. M. Kartal, J. Phar. Biomed. Anal. 26 (2001) 857.
27. Q-C. Chen and J. Wang, J. Chromatogr. A 937 (2001) 57.
28. A. Haque, X. Xu, J.T. Stewart, J. Phar. Biomed Anal. 21 (1999) 1063.
29. M. Laasonen, T. Harmia-Pulkkinen, C. Simard, M. Rasanen, H. Vuorela,
Anal. Chem. 75 (2003) 754.
30. C.F. Ferreyra and C.S. Ortiz, J. Phar. Biomed. Anal. 29 (2002) 81 1.
31. D. Chuan, W. Yan-Li, S. Shao-Min, Spectrochim. Acta, Part A 59 (2003)
1469.
32. G.T.F. Galasko, K.I. Furman, E. Alberts, Food Chem. Toxicol. 27 (1989) 49.
33. A. Meyer, T. Ngiruwonsanga, G. Henze, Anal. Bioanal. Chem. 356 (1996)
284.
34. Y.-R. Ku, K.-C. Wen, L.-K. Ho, Y.-S. Chang, J. Phar. Biomed. Anal. 20
(1999) 351.
35. M. Bonoli, M. Pelillo, T.G. Toschi, G. Lercker, Food Chem. 81 (2003) 63 1.
36. B.-L. Lee and C.-N. Ong, J. Chromatogr. A 881 (2000) 439.
37. H. Horie and K. Kohata, J. Chromatogr. A 881 (2000) 425.
38. J.C. Walker, S.E. Zaugg, E.B. Walker, J. Chromatogr. A 78 1 (1 997) 48 1.
39. C.C.T. Worth, M. Wiessler, O.J. Schmitz, Electrophoresis 21 (2000) 3634.
40. A. Pizzariello, J. Svorc, M. Stred'ansky, S. Miertus, J. Sci. Food Agricul. 79
(1999) 1136.
41. H. Horie, T. Mukai, K. Kohata, J. Chromatogr. A 758 (1997) 332.
42. 2. Bouhsain, J.M. Garrigues, S. Garrigues, M. de la Guardia, Vibration1
Spectrosc. 21 (1999) 143.
43. A.G. Caudle, Y. Gu, L.N. Bell, Food Res. Int. 34 (2001) 599.
44. B. Stavric, R. Klassen, B. Watkinson, K. Karpinski, R. Stapley, P. Fried, Food
Chem. Toxicol. 26 (1998) 1 1 1.
45. H.Horie, A. Nesumi, T. Ujihara, K. Kohata, J. Chromatogr. A 942 (2002) 271.
46. D.T. Holland, K.A. Godfredsen, T. Page, J.D. Connor, J. Chromatogr. B 707
(1998) 105.
47. H. Schnieder, L. Ma, H. Glatt, J. Chromatogr. B 789 (2003) 227.

48. M. Arando and G. Marlock, Rapid Commun. Mass Spectrom. 21 (2007) 1297.
49. C. Vogt, S. Conradi and E. Rohde, J. Chem. Ed. 74 (1997) 1126.
50. A. Wang, L. Li, F. Zang and Y. Fang, Anal. Chim. Acta 419 (2000) 235.
51. S.E. Geldart and P.R. Brown, J. Chromatogr. A 83 1 (1999) 123.
52. C.-N. Chen, C.-N. Liang, J.-R. Lai, Y.-J. Tsai, J.-S. Tsay, J.-K. Lin, J. Agric.
Food Chem. 5 1 (2003) 7495.
53. L.L. Sombrab, M.R. Gomeza, R. Olsinab, L.D. Martlnezb, M.F. Silvab, J.
Pharm. Biomed. Anal. 36 (2005) 989.
54. E.P.C. Lai and E. Dabek-Zlotorzynska, Electrophoresis 20 (1999) 2366.
55. N. Chiem and D.J. Harrison, Anal. Chem. 69 (1997) 373.
56. N. Chiem and D.J. Harrison, Clinic. Chem. 44 (1998) 591.
57. Q.-L. Zhang, H.-Z. Lian, W.-H. Wang, H.-Y. Chen, J. Chromatogr. A 1098
(2005) 172.
58. L. L6pez-Martinez, P.L. L6pez-de-Alba, R. Garcia-Campos, L.M. De Leon-
Rodriguez, Anal. Chim. Acta 493 (2003) 83.
59. http://www.dep~.$re~~edu/~~vschllGSS 20021teamslteam7.h;ltn
60. D. Heiger, High performance capillary electrophoresis, Agilent technologies,
2000.
61. R.P. Oda and J.P. Landers, in: J.P. Landers (Ed.), Handbook of capillary
electrophoresis, CRC Press, 1994.
62. S. Hoffstetter-Kuhn, A. Paulus, E. Gassman, M.H. Widmer, Anal. Chem. 63
(1991) 541.
63. T. Soga, Hewlett-Packerd Application Note: Capillary Zone Electrophoresis
of Carbohydrates By Borate Complexation Utilizing EOF Reversal, Hewlett-
Packard, 1995.
64. R.J. Nelson and D.S. Burgi, in: J.P. Landers (Ed.), Handbook of capillary
electrophoresis, CRC Press, 1994.
65. G.A. Spiller, Basic metabolism and physiological effects of the
methylxanthines, CRC Press, Boca Raton, 1998.
66. H. Hoiie, A. Nesumi, T. Ujihara, K. Kohata, J. Chromatogr. A 942 (2002)
271.
67. J.L Blauch and S.M. Tark, J. Food Sci. 48 (1983) 745.
68. W.J. Crai and T.T. Nguyen, J. Food Sci. 49 (1984) 302.
69. B.L. Zoumas, W.E. Kreiser, R.A. Martin, J. Food Sci. 45 (1980) 3 14.

70. J.W. DeVries, K.D. Johnson, J.C. Heroff, J. Food Sci. 46 (1981) 1968.
71. A.G. Claudle, Y. Gu, L.N. BeI1, Eoor Res. Int. 34 (2007) 599.
72. http:/iweb 1 .carvacademv.or,dch~s~/rushin/StudentProiectsJCompoundWe
73. The Unites States Phmacopoeia USP 25, The United States Pharmacopoeia
Convention, RockvilIe, MD, USA 200 1.

CHAPTER 3
DETERMINATION OF ASSOCIATION CONSTANTS OF
INCLUSION COMPLEXES O@ STEROID HORMONES AND
CYCLODEXTRINS

3.1 INTRODUCTION
There is considerable analytical interest in the determination of estrogens.
This interest is due to their physiological functions in the body and the potential
danger in disruption of the endocrine system. Recently studies linking estrogens to
the feminisation of fish, breast and ovarian cancer in women and reproductive health
problems in men have generated M h e r interest in these chemicals [I].
3.1.1 Estrogens
Estrogens belong to the group of hormones called steroids. They are
synthesized from cholesterol. Prominent in their structure is a series of carbon rings:
typically three six-membered rings conjugated with a five-membered one [2].
Several compounds with a structure similar to natural estrogens have been
synthesised for different purposes. Chemical formulas of some natural and synthetic
estrogens are shown in Figure 3.1.
The pKa values of steroids are high (Table 3. I), whch means they are more
likely to remain in protonated form even at alkaline pH. They display a property of
hydrophobic compounds - the magnitudes of solubility are rather low (Table 3.1).

(2) Equilin
(3) Estrone
(7) Progesterone
Figure 3.1. Structures of steroids.
(6) Norethindrone
C H ~ H


3.1.2 Determination of estrogens
3.1.2.1 Biological assay
The biological potency of estrogens can be determined using in vivo or in
vitro tests. Their activity is expressed relative to that of estradiol, which is the most
common endogenous estrogen. Imrnunoassays, such as radioimmunoassay [lo],
receptor binding assays [I 11, DNA binding assays [ l 11 and others, are very important
for their ongoing contribution to estrogen analysis, At the same time they contribute
to our understanding of estrogen biochemistry and physiology [12]. Despite the wide
variety of assays, generally they produce very consistent results, which mean that if a
compound is estrogenic in one assay is estrogenic in all others [13]. A chemical that
is estrogenic to one living species is estrogenic to all other animals due to the
conserved structure of estrogen receptor between species. Currently 0.4 mL or more
of plasma is required to testjust one estrogen by immunoassay in general [12]. One of
the lowest limits of detection 0.48 pg m ~ - ' was reported for estradiol by non-
extraction chemiluminescent assay [ 141.
3.1.2.2 HPLC
Compounds of polar and non-polar nature can be efficiently separated by
HPLC through changes in stationary and mobile phases. The octanol-water partition
coefficients of estrogens fiom Table 3.1 show that they are quite hydrophobic. In
general, reversed-phase HPLC columns are used in estrogen analysis; the mobile
phase consists of acetonitrile and/or methanol in combination with water containing
some acid.
All estrogens and their metabolites contain at least one aromatic ring in their
structure, which is responsible for their ability to absorb UV light. The UV detection
method is widely used in the determination of estrogens [15-171. Detection based on
fluorescence is generally more sensitive than UV absorption [18]. For example, in the

method of Yoon et al. [19] for the determination of 17P-estradiol, ethynyl estradiol
and bisphenol A by HPLC with fluorescence detection, the LODs for 17P-estradiol
and ethynyl estradiol were 1.15 and 0.96 nM, respectively. The detection was
performed at an excitation wavelength of 280 nm and an emission wavelength of 3 10
nm. Electrochemical detection combined with the HPLC separation was also able to
provide very sensitive detection of estrogens. This technique was used by Devanesan
et al. [20] to detect 1 pmole (-300 pg) of estrogen in a sample, whch was 1 g of tissue
of hamster treated with 4-hydroxyestradiol. LODs and LOQs for estrogens in a range
of 0.1 - 10 ng m ~ - ' have been reported when using HPLC-ESI-MS-MS [26, 271.
However, liquid-liquid extraction and derivatisation with dansyl chloride had to be
employed in a study of Zhang et al. [27] in order to be able to detect 17a-ethynyl
estradiol in the aquatic environment.
The use of chiral stationary phases can alter the selectivity of HPLC. A P- cyclodextrin was employed in several analyses as a chiral stationary phase to separate
structurally related estrogens, natural and synthetic [21-231, or chiral selector can be
included in the mobile phase. Several articles by Zarzycki et al. [24,25] are dedicated
to the investigation of the effect of P-cyclodextrin and its concentration in the mobile
phase for separation of 6 to 8 estrogens. The retention of steroids was strongly
influenced by temperature when 12 mM of P-CD was added to the mobile phase.
Unlike GC-MC, a liquid chromatographic technique does not require
compounds to be volatile or to have high molecular weight. HPLC-MS has its
disadvantages in not being as sensitive as some biological imrnunoassays but it is
available for the analysis of a wide range of compounds and not limited by the
availability of specific antiserum [28].

3.1.2.3 Gas chromatography
GC-MS has also been employed extensively for the determination of several
estrogens [28-321. The technique is advantageous in terms of good separation
efficiency and selectivity, small sample and reagent demand and is readily coupled to
mass spectrometric detection. This provides the sensitivity required for the
quantification of environmental and biological levels of estrogens in real samples.
They are often present in ng L-' to pg L-' range. Estrogens are not volatile, therefore
GC-MS analyses are usually carried out after derivatisation of analytes, which means
longer preparation time and increased risk of error.
Hernando et al. [29] optirnised and compared two GC methods - GC-MS and
GC-MS-MS for the analysis of five EDCs in wastewaters (with estrone, 17P-estradiol
and ethynyl estradiol among them). For the GC-MS method, compounds were
derivatised with N,O-bis(trimethylsilyl)trifluoracetamide. Both methods included
solid phase extraction allowing an enrichment factor for wastewater samples of 100-
fold. Validation studies obtained comparable results in both cases. LODs for GC-MS
and GC-MS-MS were 8.5 and 7.5 ng L-' (estrone), 17.0 and 27.5 ng L-l (17P-
estradiol) and 4.0 and 17.5 ng L-' (ethynyl estradiol), respectively.
A combination of different techniques produced promising results in the
determination of steroids. R. Gibson et al. [16] have developed an analytical method
to detect estrogenic compounds in fish bile. Estrogenic metabolites in bile were
deconjugated using enzymatic hydrolysis and concentrated by SPE prior to
fractionation by reversed-phase HPLC. The estrogenic potency of active HPLC
fractions was detected by yeast estrogen receptor transcription screen and analysed by
GC-MS after trimethylsilylation. The whole method recovery was reported to be
8 1*7% (n=7).

3.1.2.4 Capillary electrophoresis
Table 3.1 contains pKa values of severd estrogens. It can be seen that they are
quite high, ranging fiom 10.10 to 10.91 and the difference in pKa between each
analyte is not very significant, which means that the mechanism of CZE mode cannot
be used for their separation. The addition of an organic solvent like methanol can
improve the situation somewhat, as studied by Potter et al. [33].
In 1995 Chan et al. [34] showed successfilly developed MEKC method for
the determination of 10 estrogens. A 10 mM borate buffer with pH 9.2 ccntaining 100
mM sodium cholate achieved the separation of 9 of 10 estrogens (4-hydroxyestradiol
and 4-hydroxyestrone coeluted) in 12 min. UV detection was at 200 nm. The addition
of 20% methanol to 10 mM phosphate buffer pH 7.0 containing 50 mM SDS allowed
the separation of all 10 compounds in 24 min. Many of the estrogens have very
similar structures and some of them are optical isomers, therefore the addition of
cyclodextiin is helphl in that type of separation. In the same work Chan et al. [34]
showed that y-CD is better than P-CD for the analysis of 10 particular estrogens and
allows complete separation in less than 10 min. Althougb the separation of all
analytes was achieved, the reason for choosing the concentration of y-CD to be 20
mM was not explored, nor was the change in the migration order of analytes with P- and y-CD.
Ji et al. [35] published a method for the separation of urinary estrogens
(estrone, estriol and estradiol with internal standard d-equilenin) by MEKC. In this
study a cholate was chosen as the surfactant agent and the buffer was a mixture of 5
mM borate and 5 mM phosphate at pH 8.7. With the addition of 20% MeOH to the
run buffer the separation of all analytes was achieved in 7 min.
Several recent publications [36-381 showed the advantages of CDs in the run
buffer when analysing steroid hormones. Work carried out by Poole [36] studied
separation of 10 steroids with a-CD, P-CD and y-CD in the run buffer. The addition
of 20 mM a-CD to the 20 rnM sodium borate - sodium phosphate buffer (pH 8)
containing 50 mM SDS did not improve resolution of any 10 analytes. While 20 mM
P-CD in the run buffer separated 9 peaks out of 10 almost to baseline resolution.

When 20 mM y-CD was used in place of P-CD significant changes in the migration
order of analytes were observed and baseline resolution of all ten estrogens was
obtained. It is difficult to judge the migration times of peaks fi-om the figure in the
paper but most of the compounds had shorter migration times with y-CD, while 17a-
dihydroequilin and equilin had longer migration time.
Munro and colleagues [3 71 investigated the enhancement in sensitivity of CE
for the analysis of 17P-estradiol, estrone and estriol when charged cyclodextrin-
mediated sample stacking was employed. The sulfated P-CD was reported to allow
extremely long injections (up to 36% of the capillary) while still providing baseline
resolution of the analytes (17 P-estradiol, estrone, estriol). The improvement in
sensitivity allows UV detection (200 nrn) of estrogens in the part-per-billion range.
Different derivatives of cyclodextrin proved to be useful in the separation of
estrogens. Deng et al. [39] showed that the addition of anionic sulfobutyl ether P- cyclodextrin has advantages over the neutral CD in the separation of five estrogens
and two stereoisomers. Specifically, the amount of SBE-P-CD required was markedly
less than the neutral CD. A 6-dimethyl- P-CD was employed in the separation of
levonorgester, progesterone, testosterone and estradiol by MEKC [38]. Changes in
the migration order were reported to have a complicated effect.
Harino et al. [40] reported LOD of 0.16-0.30 nM for estrogen in the sample of
water that were achieved due to the combination of SPE treatment and sweeping with
the MEKC separation method. Katayama et al. [41] reported simultaneous
determination of a large number of compounds (16 estrogens,
dehydroepiandmstemne and their glucuronide and sulphate conjugates) by MEKC
withn 14 min. A number of articles [42-441 showed the separation of estrogens along
with other endocrine disrupting compounds (EDCs). In [44] as many as 19 endocrine
EDCs of estrogenic and alkylphenolic nature were separated by MEKC in a single
run.

3.1.3 The role of cyclodextrins in the analysis of estrogens
The overview of the existing methods for the determination of steroid
hormones reveals that the employment of cyclodextrins in chromatographic [21-251
and, especially, capillary electrophoretic methods [34, 36-39] has the advantages of
enhanced selectivity of the separations. The association of steroid hormones with
certain types of cyclodextrin was studied by Sadlej-Sosnowska [45, 461 using HPLC
and the binding constants of analyte-cyclodextrin equilibrium were determined.
Several papers [47-491 have demonstrated that different techniques for the
determination of association constants give rather different results, which is likely to
be due to the differences in the experimental conditions required by each individual
technique.
3.1.4 Theory of CE separation with cyclodextrin
The mechanism of the separation in cyclodextrin modified capillary
electrophoresis is revised in detail in Chapter 1.4.3. Cyclodextrins are truncated cone-
shaped molecules with a hollow, tapered cavity, which posses a hydrophobic
property. It is known that various organic molecules form inclusion complexes with
cyclodextrin [50]. Fundamental knowledge of equilibrium and the association
constants of analysed compounds and ligand in the system is a powerfbl factor in the
understanding of that system and in discovering ways to evaluate it.
The association of cyclodextrin C and analyte molecules A, and the
dissociation of the formed complex AC are controlled by equilibrium for a 1 :I
complexation scheme [5 11:
A + C = A C Equation 3.1
where A, C and AC are the free analyte, cyclodextrin and the complex respectively.

The effective electrophoretic mobility (b) of analyte represents the summary
of the complexed (p,) and free (pf) solute [52]:
P, = XfPf +%I% Equation 3.2
where Xf is the molar fraction of free analyte and X, is the the molar fraction of
complexed analyte. Representing the molar fraction through the equilibrium
concentration the fillowing is obtained:
[A1 LAC1 " ' [A] + [AC] '+ [A] + [AC]
The expression of equilibrium constant for the considered case:
Equation 3.3
Equation 3.4
Combined with equation 3.3 the mobility of analyte at any given concentration of the
ligand equals [52]:
Equation 3.5
The model of that complexation was reviewed by Szejtli [5 11.
This expression can be rearranged in order to linearise it in a several ways
[52]:

1 - - 1 1 -+ 1 Equation 3,6
~ P , - P J - 1 I ~ c - v f )
The data can be transformed into a double reciprocal plot of I/(hk - 11~) versus
1 /[C].
From this plot the appmt binding constant K-interceptlslop.
LC1 - 1 LC1 -t- 1 Equation 3.7
(P. - ~ t l - (PC -P,) (11, - Pr IK
This equation leads to Y-reciprocal plot of [C]/(bb - pf) versus [C]. From there
K=slope/inte~ept.
Ccl :
Equation 3.8
This leads to the X-~*eciprocal plot of (b - pr)l[C] versus {lt- pf), where K =
-slope.

3.1.5 Aim of this work
To the authors~knowledge the association constants for steroids and
cyclodexttins have not previously been determined from capillary electrophoresis
separation data, The aim of this work was to fill this gap, as this data has a hi&
importance in the understanding of the electrophoretic behavior of analytes in the
presence of cyclodextrirr; in the run buffer. The objectives involved the examination
of the mechanism of indusion of cyclodextrim and steroids. Different types of
natural CDs and their derivatives were investigated in that regad. This work also
demonstrated the pdential of capillary electrophoresis as a fbndarnental resea~ch tool,

3.2 EXPERIMENTAL
3.2.1 Equipment
CE separations were performed using the system described in Chapter 2.
The fused silica capillaries (Composite Metal Services ltd., The Chase, Hallow,
Worcs. WR2 6LD, UK) were 54 cm in length (46 cm to the detector) with an
internal diameter 50 pm.
3.2.2 Reagents
All analyte compounds investigated in the separations had purity of 99%
and were used without further purification. Estriol, estrone, 17P-estradiol,
ethinylestradiol, equilin, norethindrone, mestranol, progesterone, a-cyclodextrin,
2HP-a-CD, P-cyclodextrin, y-cyclodextrin, 2HP-P-CD (degree of substitution - 4-
lo), 2HP-y-CD (molecular substitution - 0.6), sodium phosphate (dibasic), HCl,
NaOH, methanol (HPLC grade), SDS were purchased from Sigma-Aldrich,
Dublin, Ireland. Buffers were prepared using distilled water and adjusted to the
desired pH using 1 M and 0.1 M NaOH.
3.2.3 Standards
Stock solutions of estriol, estrone, ethinylestradiol, 17P-estradiol, equilin,
norethindrone, mestranol and progesterone were prepared in methanol of
concentration 1 mM. Stock solutions were stored in darkness and evaporation of
methanol fiom the flasks was prevented.

3.2.4 Separation conditions
The electrophoretic buffer was optimised in advance and consisted of 20
mM borate pH 11 -5 and I 0 mM SDS, P-CD, y-CD, 2HP-P-CD, 2HP-y-CD were
added to the buffer separately in a range of five concentrations from 1 mM to 1 0
mM. Separations were carried out at 30 kV electrophoretic voltage and at a
temperature of 20'~. Injections were carried out hydrodynamically at 50 mbar for
2 sec. UV detection was at 21 4 nm and 254 nm. The concentration of each analyte
in a mixture was 0.125 rnM in methanol. Conditioning of the CE capillary
between runs was performed with 0.1 M NaOH for 2 min and nm buffer for 2
min. All separations were repeated at least three times.

3.3 RESULTS AND DISCUSSION
3.3.1 Initial conditions
The theory of the formation of inclusion complexes was reported to be valid
only for cases of 1 : 1 stoichiometry [5 11. A number of steroid hormones, including
four of the target analytes in this work (estriol, 17a-estradiol, estrone and
ethinylestradiol), have been investigated by N. Sadlej-Sosnowska [45, 461. The
conclusion was that 1 : 1 stoichiometry applies to the complexes of studied steroids
with P-CD and y-CD. Due to the high structural similarity of steroids it was assumed
in this paper that inclusion of equilin, mestranol, norethindrone and progesterone
follows the same pattern.
Throughout the series of experiments, the run buffer composition was held
constant (except for cyclodextrin type and concentration which were varied). Thus the
analytes were involved in two equilibria: the analyte-micelle and analyte-
cyclodextrin. The presence of surfactant (SDS) and operating pH of 11.5 requires
explanation. Compounds 1-5 (as in Figure 3.1) were in their deprotonated form at this
pH because their pKa value lies between 10.26 and 10.71 [3, 51. The structures of
mestranol, norethindrone and progesterone pointed to even higher pKa values
(pKa-13.1 for mestranol [53]) and thus they were neutral at the conditions of
separation. Such close pKa magnitudes and molecular weights of steroids did not
allow their separation in a simple mode of capillary zone electrophoresis. All target
analytes were quite hydrophobic. The calculated lo&, values are 2.81, 3.22, 3.43,
3.94, 4.12, 4.68, 2.99 and 3.67, for estriol, equilin, estrone, 17P-estradiol,
ethinylestradiol, mestranol, norethindrone, and progesterone respectively [54]. The
latter provoked their interaction with the rnicelles in the run buffer as well as
cyclodextrins when added. The interaction between molecules of surfactant and
cyclodextrins also takes place. In the work of Lin et al. [55] it was found that the
complexes formed between P-CD and SDS monomers exist predominantly in the
form of a 1:l stoichiometry. The variations of the electrophoretic mobility of probe

molecules as a function of surfactant concentration suggested that as a consequence
of a strong inclusion complexation between P-CD and SDS, the encapsulation of P- CD with probe molecules is greatly diminished. Even though the interaction of the
cyclodextrins and analytes was to a less degree due to the surfactant, the presence of
the micelles in the run buffer was necessary in order to observe the difference in the
mobility of analytes while adding neutral cyclodextrins.
The top electropherogram in Figure 3.2(A) represented the separation of tar@
estrogens at primary conditions, e.g. without cyclodextrin. It could be seen that
analytes reached the detection window aRa the electro osmotic flow; association
with negatively charged micelles was the reason for their migration towards the
anode, which was against the EOF in this separation mode.
According to Rekharsky and Inoue [50] any differences in the free analyte's
interaction with the buffer prior to inclusion complexation did not contribute
measurably to the complexation thermodynamics. Since the concentration of SDS
was held constant at every separation, the true effect of cyclodextrin was seen while
adding it at different concentrations. The separation with 1 rnM of each cyclodextrin
is shown in Figure 3.2 (B-E). The change in migration time of analytes clearly
demonstrated the occurrence of analyte-cyclodextrin interaction. The mobility
changes were more significant in the case of y-CD and 2HP-y-CD than those of P-CD
and 2HP-P-CD. Analyte mobility was increased due to the interaction with neutral
cyclodextrins. Attraction to the ancde was lower.

Migration time, rnin
Figure 3.2: Electropherogram of separation of 8 steroid hormones. Separation conditions: 20 mM phosphate buffer pH 11.5 and 10 mM SDS, A - no CD added, B - 1 mM P-CD, C - 1 mM 2HP-P-CD, D - 1 mM y-CD, E - 1 mM 2HP-y-CD; separation voltage 30 kV; capillary 54 cm (46 cm is effective length), 50 pm i.d.; 200C; hydrodynamic injection 2 seconds; UV detection 214 nm. Concentration of each analyte is 0.125 mM in methanol. Peak identification 1 - estriol, 2 - equilin, 3 - estrone, 4 - 17gestradio1, 5 - ethinylestradiol, 6 - norethindrone, 7 - progesterone, 8 - mestranol.

Association constants were calculated from the mobility values of estrogens,
which were determined at 1 mM, 3 mM, 5 mM, 7 mM and 10 mM of each
cyclodextrin in the run buffer. The effect of the concentration of cyclodextrins in the
separation buffer on the mobility of analytes is presented in Figure 3.3 - 3.7. The
calculated values of the constants determined by three linearisation methods are given
in Tables 3.2 - 3.5 along with R2 of each plot and %RSD. The association constants
for a single compound obtained using the plotting methods show quite different
values. Regardless of that fact, the same relative order of the constants within the
same plotting method was observed for each compound. The exception to this case is
shown in Table 3.2. For 17P-estradiol and estriol the relative values for the double
reciprocal fit data differed from Y-reciprocal and X-reciprocal fit. It was shown
previously by Rundlett and Armstrong [56] that at low ligand concentrations (in this
case cyclodextrin) the double reciprocal fit masks deviations fiom linearity. The data
obtained in this work indeed proved this to be the case as R2 values for the double
reciprocal fit for each complexation shows good linearity. The negative association
constant values however, pointed to the lack of inclusion of the analytes
(progesterone and mestranol) with the CD. Ths leads to the conclusion that the Y-
and X - fits are more reliable in assessing analyte (steroid) - ligand intelaction

In this study an attempt was made to investigate the nature of the inclusion of
steroids with a-CD. This study was performed using estriol, estrone, 17P-estradiol
and ethinylestradiol. It can be seen in Figure 3.2 that the modification of the effective
mobility value of the analytes in this study occurred quite gradually over the
investigated concentration range of the cyclodextrin. The size of a-CD cavity (-5 A) is not large enough for the inclusion complex to be formed, while the diameter of
only one benzene ring is 5 A. Thus, the formation of the inclusion complex of each
steroid with a-CD was not possible. An attempt was made to arrange this data
according to the 3.6 - 3.8. The values of R' for linearisation trendlines were very poor
and apparent binding constants had negative values (results are not shown). This was
expected since no inclusion complexes occurred.
Figure 3.3: Effect of the concentration of a-CD on the electrophoretic mobility of steroids. Separation conditions as in Figure 3.2. Analyte identification: 4 Estriol, 17J3-Estradiol, - Estrone, - Ethinylestradiol.

From this study it was found that the highest magnitudes of association
constants belong to the inclusion of target steroids in y-CD (Table 3.2). The diameter
of the inside cavity of y-CD was 10A, which is more sterically suitable for the 4-ring
conventional structure of analytes than P-CD [57] with the diameter 8A. Large
association constants of 33 1 M-I (Y-reciprocal fit) for equilin and up to 1770 M-' (X-
reciprocal fit) for ethinylestradiol were observed.
The double reciprocal fit and the Y-reciprocal fit were found to have R2
values in the range 0.9797-0.9989. The relative standard deviations were observed to
be less than 3.5% for the association of compounds 1-5. The latter demonstrated that
the analyte inclusion process took place with the CD and its stoichiometry was 1 : 1. It
should be noted that the R2 value for the X-reciprocal fit for those compounds lay in a
lower range (R2 = 0.8969-0.9665) of linearity. The effect of varying the CD
concentration on the mobility was most pronounced using the X-reciprocal fit
compared with other linearity approaches. The latter is due to the plot parameters of
(pa - pf)/[C] versus (pa - pf). The concentration range chosen for the plots also affects
the R~ values obtained.

Table 3.2. The value of association constants of target steroids and y-CD, R2 for each linearisation method, %RSD (n=3) and literature values of constants.
K W-'1 %RSD RZ K (M-') lit. [46]
Estriol 32005370 Double reciprocal fit 1282 0.95 0.9585 Y-reciprocal fit 798 2.75 0.993 6
X-reciprocal fit 1088 1.32 0.898 1
Equilin Double reciprocal fit 477 3.44 0.98 12 Y-reciprocal fit 33 1 1.15 0.9821
X-reciprocal fit 3 87 2.28 0.8969
Estrone 2550h230 Double reciprocal fit 642 2.33 0.9797 Y-reciprocal fit 46 1 0.83 0.9901
X-reciprocal fit 545 1.64 0.9162
17P-Estradiol 7 100*400 Double reciprocal fit 123 1 1.61 0.9844 Y-reciprocal fit 953 1.73 0.9978
X-reciprocal fit 1137 1.40 0.9583
Ethinylestradiol 1060e960 Double reciprocal fit 1873 1.57 0.9842 Y-reciprocal fit 1506 2.22 0.9989
X-reciprocal fit 1770 1.51 0.9665
Norethindrone Double reciprocal fit 9 1 4.64 0.9980 Y-reciprocal fit 9 1 2.58 0.8669
X-reciprocal fit 75 3.31 0.7375
Progesterone Double reciprocal fit -44 13.56 0.9984 Y-reciprocal fit -42 4.92 0.6164
X-reciprocal fit -52 2.44 0.7235
Mestranol Double reciprocal fit -62 12.12 0.9984 Y-reciprocal fit -44 7.29 0.5591
X-reciprocal fit -56 4.20 0.6997

Figure 3.4: Effect of the concentration of y-CD on the electrophoretic mobility of steroids. Separation conditions as in Figure 3.2. Analyte identification:
-t Estriol, - Equlin, Estrone, - 17p-Estradiol,
- Ethinylestradiol, A Norethindrone, - Progesterone, - Mestranol.
It can be noted that the mobility plots of analytes in Figure 3.4 corresponded
to the association constants of analytes. For compounds 1-5 the decrease in mobility
occurred quite sharply; at the concentration of 1-3 rnM of cyclodextrin the mobilities
have reached their maximum. The magnitudes of the association constants for these
compounds represent sufficiently large values (Table 3.2). Norethindrone,
progesterone and mestranol had very small or non interaction with the cyclodextrin.
The change in mobility of these analytes was gradual over the investigated
concentration range of y-CD and the maximum was at 7 mM.
Negative values of constants for progesterone and mestranol, along with poor
linearity and precision, pointed to the fact that these steroids did not interact with y-
CD or the nature of interaction was something other than inclusion. Inclusion of

norethindrone was characterised by the association constant 75 M-' (X-reciprocal fit)
with %RSD less than 5% and linearity 0.73.
Rekharsky and Inoue [50] attributed the following contributions to the
stabilisation of cyclodextrin complexes from a thermodynamic point of view: a)
penetration of the hydrophobic part of the guest molecule into thecyclodextrin cavity,
b) dehydration of the organic guest, c) hydrogen-bonding interaction, d) the release of
the water molecules originally included in the cyclodextrin cavity to bulk water [58-
601 and e) the conformational changes or strain release of the cyclodextrin molecule
upon corriplexation [6 1-63].
According to the factors listed above the possible reasons for strong inclusion
of compounds 1-5 and weak or absence of inclusion for compounds 6-8 should be
explained by referring to the differences in structural characteristics of the complexes,
i.e. structures of steroids incorporated into a cyclodextrin type, which was kept
constant. According to the literature hydrophilic groups, such as hydrohxyl, amino
and carboxyl [64], remain exposed to the bulk solvent even after inclusion of the
hydrophobic moiety [50]. An exception to this general rule is the aromatic hydroxyl
group, which can penetrate deeply into the cyclodextrin cavity where it hydrogen-
bonds to one of cyclodextrin's peripheral hydroxyl groups [65]. Ring A of compounds
1-5 is identical; it was aromatic with a hydroxyl group on it. The difference was in the
ring D (and nonsaturated bond in ring B of equilin) where hydrophilic hydroxyl and
ketone groups and hydrophobic ethilyn group attached. According to the literature
estriol, equilin, estrone, 17P-estradiol and ethinylestradiol penetrated 7-CD and form
a hydrogen bond with the hydroxyl group of CD. The structural difference of ring D
and logKO, values explained the different K values obtained. Norethindrone and
progesterone did not contain any aromatic ring with a hydroxyl group on it and the
aromatic hydroxyl group of mestranol was methylated. Ring D of the latter
compounds contained hydrophilic and hydrophobic groups. However, neither
constituent of ring A nor ring D appeared to be the reason for the inclusion as the
calculated association constants were negative. A small degree of interaction was
observed in the case of norethindrone but as to which one of the above mentioned

contributions or their combination was responsible for the association constant of 75
M-' (X-reciprocal fit) was not clear.
Table 3.2 contains some literature association constant values for several
steroids, obtained fi-om HPLC data. To the authors knowledge association constants
for other investigated steroids and other cylodextrin types are not available. It was
reported previously [47-511 that equilibrium constants detennined by different
experimental methods for the same reaction can significantly deviate fi-om each other.
The HPLC constants were much greater than the data obtained in this work but
notably the relative order of the association constants was the same. The mechanism
of the separation method influences the magnitude of the association constant values.
In CE, the binding constant values are determined mainly by the charge/mass ratio. In
HPLC the distribution of analyte between the mobile and stationary phases play an
important role. The effect of SDS on the association constants for CD in CE is
discussed later.

From this investigation a significant decrease in the magnitude of the
association constants was found for the interaction of the selected steroids with P-CD
(Table 3.3). Figure 3.5 shows that at lower concentrations of P-CD the change in
mobility of steroids was rather small, particularly for compounds 6-8, in which case
no change in the mobility could be noticed at 1 mM P-CD in the buffer. Increasing
further the concentration of P-CD caused a sharper change in mobility for compounds
6-8.
0
-0.0001
r: 3
V1
3 -0.0002 -'a 0 d
-0.0003
-0.0004
-0.0005 Concentration, M - - - - -
Figure 3.5: Effect of the concentration of $-CD on the electrophoretic mobility of steroids. Separation conditions as in Figure 3.2. Analyte identification as in Figure 3.4.

Associationconstants values as low as 56 M-I (X-reciprocal fit) for estriol and
120 M - ~ (Y-reciprocal fit) for ethinylestradiol were found. The association constants
were accompanied by a slightly increased deviation £rom linearity ( R ~ ) for estriol,
equilin and 17P-estradiol and a large decrease in linearity for estrone and
norethindrone. Relative standard deviation of the obtained K was quite high for
estriol (over 30%). The small diameter of J3-CD (8A [56]) did not allow penetration of
steroids to the same degree as the cavity of y-CD. It is likely that the inclusion of only
the most hydrophobic part of the molecules took place. The rest of the structure
remained in the bulk solvent. Ethinylestradiol had the highest association constant
among P-CD complexes followed by 17P-estradiol, equilin and estriol. It is
interesting to note that the last three compounds had the same K values calculated by
the three linearisation methods within experimental error. Partial interaction of the
same structural fi-agment of the three molecules took place. Estrone and
norethindrone did not undergo any interaction with P-CD, which was supported by
negative constants. It has to be noted that in case of y-CD equilin exhibited less
interaction than estrone. This was not true for inclusion into J3-CD. Because there is
no other difference in the steroid structures it is likely that the double bond of the B-
ring of equilin induced a different interaction with the CD.
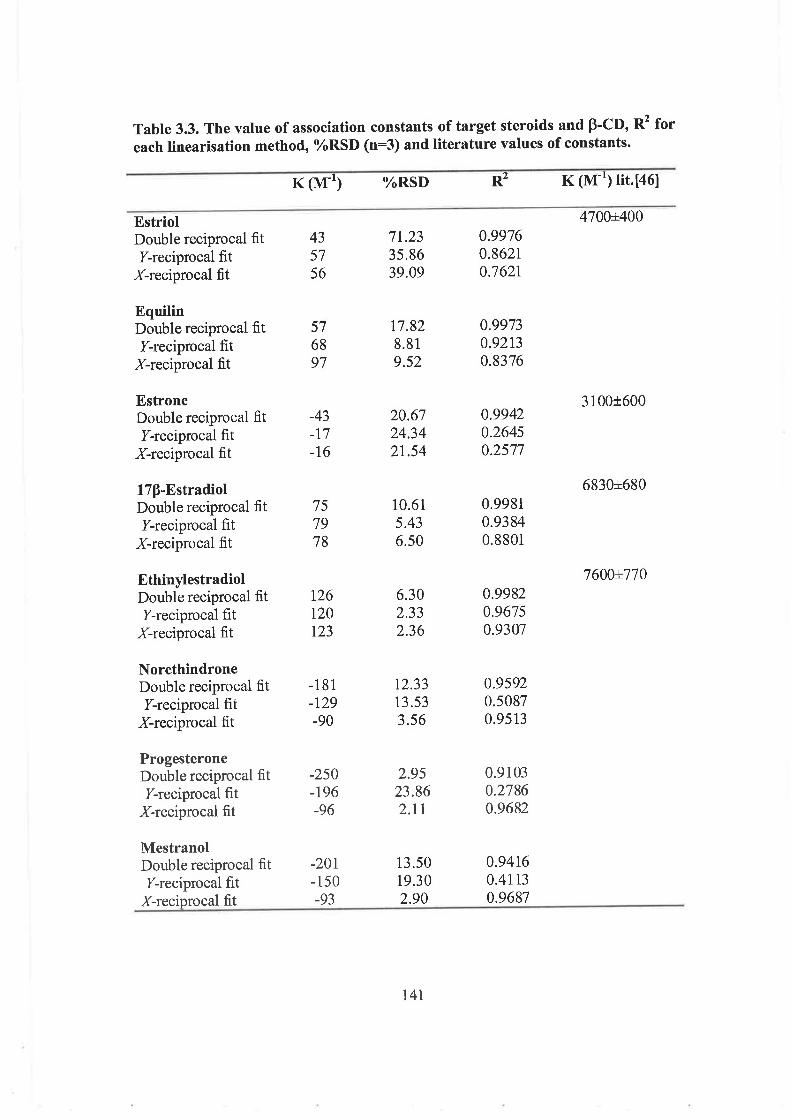
Table 3.3. The value of association constants of target steroids and P-CD, R' for each linearisation method, %RSD (n=3) and literature values of constants.
Estriol 4700h400 Double reciprocal fit 43 71.23 0.9976 Y-reciprocal fit 5 7 35.86 0.8621
X-reciprocal fit 56 39.09 0.7621
Equilin Double reciprocal fit 57 17.82 0.9973 Y-reciprocal fit 68 8.81 0.9213
X-reciprocal fit 97 9.52 0.8376
Estrone 3 100f 600 Double reciprocal fit -43 20.67 0.9942 Y-reciprocal fit -17 24.34 0.2645
X-reciprocal fit -16 21.54 0.2577
17P-Estradiol 6830h680 Double reciprocal fit 75 10.61 0.9981 Y-reciprocal fit 7 9 5.43 0.93 84
X-reciprocal fit 7 8 6.50 0.8801
Ethinylestradiol 7600*770 Double reciprocal fit 126 6.30 0.9982 Y-reciprocal fit 120 2.33 0.9675
X-reciprocal fit 123 2.36 0.9307
Norethindrone Double reciprocal fit -181 12.33 0.9592 Y-reciprocal fit -129 13.53 0.5087
X-reciprocal fit -90 3.56 0.9513
Progesterone Double reciprocal fit -250 2.95 0.9 103 Y-reciprocal fit -196 23.86 0.2786
X-reciprocal fit -96 2.1 1 0.9682
Mestranol Double reciprocal fit -201 13.50 0.9416 Y-reciprocal fit -150 19.30 0.41 13
2.90 0.9687

3.3.5 2HP-y-CD and 2HP-P-CD
Modification of the structure of the cyclodextrin has many beneficial effects,
contributing to its solubility or affinity for analytes. In this study 2 hydroxypropyl
functionalised y-CD and P-CD were investigated. It was found that a general decrease
in association constants could be noted for the inclusion of target steroids into 2HP-y-
CD (Table 3.4). It was reported that hydroxypropyl substituents elongate the actual
CD cavity when attached through primary or secondary hydroxyl groups of the
glucose ring [51]. Molecular substitution of the employed 2HP-y-CD was 0.6 but it
was not controlled and thus the actual position of hydroxypropyl groups was
unknown. The comparison of the association constants for 2HP-y-CD with parent y-
CD would suggest that this substitution caused some structural difficulties for steroid
molecules to penetrate the cavity and/or the hydrogen bonds were not able to form
between analytes and substituted hydroxyls on the CD.
The plots of the mobility of analytes against the concentration change of 2HP-
y-CD and 2HP-P-CD are shown in Figures 3.6 and 3.7. They correspond to a trend of
the mobility change as for natural y-CD and P-CD, respectively. The compounds that
had a high degree of inclusion have shown a sharper change in mobility at lower
concentration of CD in the separation buffer. The slow reduction in mobility was
correlated to negative constant values of progesterone and mestranol.

The data in Table 3.5 shows the association constants of steroids with 2HP-P-
CD. A slight deviation from linearity of the plots could be noticed here, which was
similar to the linearisation plots for natural P-CD. There was noticeably improved
linearity for estrone accompanied by increased association constants. Even though the
%RSD of the calculated constants was high, a general increase in the constant value
was noted with the functionalised CD compared to the natural P-CD. Hydroxypropyl
groups are oriented so that penetration of the part of analytes was quite similar,
thereby not distinguishing types clearly. Due to the fact that there is only a slight
difference between constant values for several compounds (Table 3 3 , it is evident
that the HP-substituted P-CD (degree of substitution = 4-10) does not recognise the
structural variations of analytes to the same degree as y-CD for instance.
I
I I I I
Concentration, M I I I
--
Figure 3.6: Effect of the concentration of 2HP-y-CD on the electrophoretic mobility of steroids. Separation conditions as in Figure 3.2. Compound identification as in Figure 3.4.

Figure 3.7: Effect of the concentration of 2HP-p-CD on the electrophoretic mobility of steroids. Separation conditions as in Figure 3.2. Compound identification as in Figure 3.4.

Table 3.4. The value of association constants of target steroids and 2HP-y-CD, R' for each linearisation method, %RSD (n=3).
Estriol Double reciprocal fit Y-reciprocal fit
X-reciprocal fit
Equilin Double reciprocal fit Y-reciprocal fit
X-reciprocal fit
Estrone Double reciprocal fit Y-reciprocal fit
X-reciprocal fit
17P-Estradiol Double reciprocal fit Y-reciprocal fit
X-reciprocal fit
Ethinylestradiol Double reciprocal fit Y-reciprocal fit
X-reciprocal fit
Norethindrone Double reciprocal fit Y-reciprocal fit
X-reciprocal fit
Progesterone Double reciprocal fit Y-reciprocal fit
X-reciprocal fit
Mestranol Double reciprocal fit Y-reciprocal fit
X-reciprocal fit

Table 3.5. The value of association constants of target steroids and 2HP-P-CD, R2 for each linearisation method, %RSD (n=3).
Estriol Double reciprocal fit 114 20.42 0.9908 Y-reciprocal fit 74 11.88 0.9404
X-reciprocal fit 8 1 14.32 0.8926
Equilin Double reciprocal fit 96 31.79 0.9940 Y-reciprocal fit 63 21.31 0.9369
X-reciprocal fit 69 24.29 0.8881
Estrone Double reciprocal fit 5 7 58.59 0.9941 Y-reciprocal fit 3 1 45.43 0.8616
X-reciprocal fit 3 3 48.71 0.8206
17P-Estradiol Double reciprocal fit 1 02 30.55 0.9971 Y-reciprocal fit 84 17.82 0.9875
X-reciprocal fit 8 8 2 1.39 0.9689
Ethinylestradiol Double reciprocal fit 105 28.78 0.9969 Y-reciprocal fit 84 17.16 0.9922
X-reciprocal fit 88 20.54 0.9775
Norethindrone Double reciprocal fit -3 5 102.46 0.9970 Y-reciprocal fit -47 25.48 0.7930
X-reciprocal fit -48 18.03 0.8680
Progesterone Double reciprocal fit -17 278.04 0.9925 Y-reciprocal fit -53 23.22 0.6962
X-reciprocal fit -59 12.96 0.861 1
Mestranol Double reciprocal fit -10 466.88 0.99 19 Y-reciprocal fit -50 23.73 0.6558
X-reciprocal fit -5 8 12.59 0.8472

3.3.6 The effect of SDS
While it is clear fiom the association constants determined that the
concentration and type of CD is important in selecting particular steroids, a study of
the effect of SDS was carried out to investigate the impact of SDS on the analyte
interaction with the CD. The effect of SDS concentration in the run buffer was
investigated using 2HP-y-CD. The value of association constants of target steroids
and 2W-y-CD with two run buffers containing 10 mM SDS and 20 mM SDS are
presented in Table 3.4 and 3.6, respectively. The steroid-micelle interaction is strong
due to high hydrophobicity of analytes (lo&, values of each analytes have been
mentioned above). It was found that by increasing the concentration of SDS, this
leads to the equlibrium being moved toward increased micelle interaction.
This fact provoked a decrease in inclusion of steroids into the cyclodextrin
cavity when the concentration of SDS was 20 mM. The values of the association
constants at 20 mM SDS (Table 3.6) were 2 to 3 times less than at 10 mM SDS
(Table 3.4). It has to be noted that K value for estriol was affected significantly less
than the rest of the constants. The value for estriol was even hgher than the
association constant for 17P-estradiol (Y and X fits). Although estriol is the least
hydrophobic compound of all target analytes it strongly included into the 2HP-y-CD
cavity. These results demonstrated that in this case, the inclusion is due to the strong
hydrogen bonding of the vicinal hydroxyl groups on the D ring with hydroxyls of the
cyclodextrin. As expected, the increase in the concentration of SDS in the run buffer
did not affect the association constants ofthe compounds 6-8, which remain negative.

Table 3.6. The value of association constants of target steroids and 2HP-y-CD with 20 mM SDS in the run buffer, R2 for each linearisation method, %RSD (n=3).
Estriol Double reciprocal fit 395 6.10 0.9996 Y-reciprocal fit 410 4.64 0.9996
X-reciprocal fit 403 5.41 0.9968
Equilin Double reciprocal fit 97 28.16 0.9994 Y-reciprocal fit 1 02 14.06 0.9861
X-reciprocal fit 99 16.70 0.9694
Estrone Double reciprocal fit 134 20.08 0.9995 Y-reciprocal fit 137 10.23 0.9938
X-reciprocal fit 134 12.60 0.9842
17P-Estradiol Double reciprocal fit 405 3.57 0.9993 Y-reciprocal fit 3 88 2.34 0.9995
X-reciprocal fit 3 96 2.83 0.9957
Ethinylestradiol Double reciprocal fit 638 6.78 0.9994 Y-reciprocal fit 610 4.34 0.9999
X-reciprocal fit 628 5.64 0.9973
Norethindrone Double reciprocal fit -12 88.51 0.9992 Y-reciprocal fit 8 99.32 0.1742
X-reciprocal fit 4 182.67 0.0880
Progesterone Double reciprocal fit -39 39.32 0.9999 Y-reciprocal fit -40 21.13 0.957 1
X-reciprocal fit -3 8 17.89 0.9749
Mestranol Double reciprocal fit -49 46.51 0.9997 Y-reciprocal fit -42 30.99 0.9126
X-reciprocal fit -4 1 28.74 0.93 16

3.4 CONCLUSIONS
This chapter documents a study using capillary electrophoresis to determine
the association constants of inclusion complexes of steroid hormones and
cyclodextrins. The mechanism of inclusion of steroids by cyclodextrins was
investigated. The most powefil agent for the inclusion of the target analytes was
found to be y-CD followed by 2HP- y-CD. High values of association constants were
accompanied by good linearity of the plots. The constants values obtained for
individual analytes correlate with their structural characteristics contributing to their
inclusion. Interaction with the cavity of P-CD was rather weak while 2HP-P-CD
failed to recognise the difference in structure between estriol, equilin,
ethinylestradiol, 17P-estradiol and estrone. It was found that the association constant
values decreased when the concentration of micelles in the run buffer was increased.
In general the estimation of association constants of steroid compounds with
cyclodextrins was a straightforward process due to the hrgh efficiency and simple
performance of capillary electrophoresis when combined with the three plotting
methods used

3.5 REFERENCES
1. S.H. Safe, Environmental and dietary estrogens and human health: is there a
problem. Environ. Health Perspect, 1995.
2. R.W. Hill and G. A. Wyse, Animal Physiology. 2nd edition. Harper & Row,
Publishen, Inc., 1989.
3. A.R. Hurwitz and S. T. Liu, J. Pharm. Sci. 49 (1977) 624.
4. R. Kirdani and M. Burgett, Arch. Biochem Biophys. 118 (1967) 33.
5. V. Egorova, A. Zakharychev, S. Ananchenko, Izv. Akad. Nauk SSSR Ser.
Khim. 3 (1972) 726.
6. V. Egorova, A. Zakharychev, S. Ananchenko, Tetrahedron 29 (1973) 301.
7. K. Lewis and R. Archer, Steroids 34 (1979) 485.
8. K.M. Lai, M.D. Scrimshaw, J.N. Lester, Sci. Total Envir. 289 (2000) 159.
9. Y. Deng, M.-J. Huang, Inter. J. Quantum Chern. 100 (2004) 746.
10. T. Chard, An Introduction to Radioimunnoassays and Related Techniques, North-
Holland, Amsterdam, 198 1.
11. A.J. Oosterkamp, B. Hock, M. Seifert, H. Irth, Trends Anal. Chem. 16 (1997)
544.
12. R.W. Giese, J. Chromatogr. A 1000 (2003) 401.
13. J. Toppari, JC. Laren, P. Christiansen, A. Givercman, P. Grandjean, L.J.
Guillette, B. Jegou, T.K. Jensen, P. Jouannet, N. Keiding, H. Leffers, J.A. Mclachlan,
0 . Meyer, J. Muller, E. Rajped-De Meytes, T. Scheike, R. Sharpe, J. Sturnpter, N.E.
Skakkebeck, Environ. Health Perspect. 104 (1 996) 741.
14. B.G. England, G.H. Parsons, R.M. Possley, D.S. McConnell, A.R. Midgley, Clin.
Chem. 48 (2002) 1584.
15. J. Novacovic, V. Pacakova, J. Sevcik, T. Cserhati, J. Chromatogr. B 681 (1996)
115.
16. R. Gibson, C.R. Tyler, E.M. Hill, J. Chromatogr. A 1066 (2005) 33.
17. A. Penalver, E. Pocurull, F. Bormll, R.M. Marce, J. Chromatogr. A 964 (2002)
153.
18. C.-C. Wang, J.K. Prasain, S. Barnes, J. Chromatogr. B 777 (2002) 3.

19. Y. Yoon, P. Westerhoff, S.A. Snyder, M. Esparza, Water Research 37 (2003)
3530.
20. P. Devanesan, R. Todorovic, J. Zhao, M.L. Gross, E.G. Rogan, E.L. Cavalieri,
Carcinogenesis 22 (2001) 489.
21. K. Shimada, T. Masue, H. Chiba, J. Chromatogr. Sci. 27 (1989) 557.
22. H. Lamparczyk, P.K. Zarzycki, J. Nowakowska, R.J. Ochocka, Chromatographia
38 (1994) 168.
23. M. Liu, L.-S. Li, S.-L. Da, Y.-Q. Feng, Talanta 66 (2005) 479.
24. P.K. Zarzycki, M. Wierzbowska, H. Lamparczyk, J. Pharm. Biomed Anal. 15
(1997) 1281.
25. P.K. Zarzycki and R. Smith, J. Chromatogr. A 912 (2001) 45.
26. M.S. Diaz-Cruz, M.J. Lopez de Alda, R. Lopez, D. Barcelo, J. Mass Spectrom 38
(2003) 9 1 7.
27. F. Zhang, M.J. Bartels, J.C. Brodeur, E.L. McClyrnont, K.B. Woodburn, Rapid
Commun. Mass Spectrom. 18 (2004) 2739.
28. M.J. Lopez de Alda and D. Barcelo, J. Chromatogr. A 892 (2000) 391.
29. M.D. Hemaldo, M. Mezvua, M.J. Gomez, 0 . Malato, k Aguera, A.R. Fernandez-
Alba, J. Chromatogr. A 1047 (2004) 129.
30. M. Kawaguchi, Y. Ishi, N Sakui, N. Okanouchi, R. Ito, K. Inoue, K. Saito, H.
Nakazawa, J. Chmmatogr. A 1049 (2004) 1.
31. J. Carpinteiro, J.B. Quintana, I. Rodriguez, A.M. Carro, R.A. Lorenzo, R. Cela, J.
Chromatogr. A 1056 (2004) 179.
32. I. Garcia, L. Sarabia, M.C. Ortiz, J.M. Aldama, Anal. Chem. Acta 526 (2004)
139.
33. K.J. Potter, R.J.B. Allington, J. Algaier, J. Chromatogr. A 652 (1993) 427.
34. K.C. Chan, G.M. Muschik, H.J. Issaq, P.K. Siiteri, J. Chromatogr. A 690 (1995)
149.
35. A.J. Ji, M.F. Nunez, D. Machacek, J.E. Ferguson, M.F. Iossi, P.C. Kao, J.P.
Landers, J. Chromatogr. B 669 (1995) 15.
36. S.K. Poole and C.F. Poole, J. Chromatogr. A 749 (1996) 247.

37. N.J. Munro, J. Palmer, A.M. Stalcup, J.P. Landers, J. Chromatogr. B 731 (1999)
369.
38. Q.J. Xu, Z.W. Gu, X.L. Chen, T.G. Liu, Chlnese J. Anal. Chern. 27(2) (1 999)
193.
39. Y. Deng, J. Zhou, M.D. Perkins, S.M. Lunte, Analyt. Cornmun. 34 (1997) 129.
40. H. Harino, S. Tsunoi, T. Sato, M. Tanaka, Fresenius J. Anal. Chern. 369 (2001)
546.
41. M. Katayama, Y. Matsuda, K. Shimokawa, S. Kaneko, Biomed. Chomatogr. 17
(2003) 263.
42. B. Forgaty, F. Regan, E. Dempsey, J. Chromatogr. A 895 (2000) 237.
43. F. Regan, A. Moran, B. Forgaty, E. Dempsey, J. Chromatogr. B 770 (2002) 243.
44. F. Regan, A. Moran, B. Forgaty, E. Dempsey, J. Chromatogr. A 1014 (2003) 141.
45. N. Sadlej-Sosnowska, J. Chromatogr. A 728 (1996) 89.
46. N. Sadley-Sosnowska, J. Inclusion Phenom. Mol. Recognit. Chem. 27 (1997) 31.
47. M. Cirri, F. Maestrelli, S. Orlandini, S. Furlanetto, S. Pinzauti, P. Mura, J. Pharm.
Biomed. Anal. 37 (2004) 995.
48. D.J. Wood, F.E. Hruska, W.J. Saenger, Am. Chem. Soc. 99 (1977) 1735.
49. K. Uekama, F. Hirayama, M. Otagiri, Y. Otagiri, K. Ikeda, Chern. Pharrn. Bull. 26
(1978) 1162.
50. M.V. Rekharsky and Y. Inoue, Chem. Rev. 98 (1998) 1875.
5 1. J. Szejtli, Chem. Rev. 98 (1998) 1743.
52. M.S. Bellini, Z. Deyl, G. Manetto, M. Kohlickova, J. Chromatogr. A. 924 (2001)
483.
53. J.B. Quiiltana, J. Carpinterio, I. Rodriguez, R.A. Lorenzo, J. Chromatogr. A 1024
(2004) 177.
54. http://www.syrres.comlesc/kowwin.ht~n
55. C.-E. Lin, H.-C. Huang, H.-W. Chen, J. Chromatogr. A 917 (2001) 297.
56. K.L. Rundlett and D. W. Armstrong, Electrophoresis 1 8 (1 997) 2 194.
57. Luminescence Applications in Biological, Chemical, and Hydrological Sciences,
ACS Symposium Series 383, 1989.

58, D. Hallh, A. Schiin, I. Shehatta, I. Wadsii, J. Chem. Soc. Faraday Trans. 88
(1 992) 2859.
59. G. Bmne, G. Castronuovo, P. Del Vecchio, V. Elia, J. Chem Soc. Faraday
Trans. 82 (1986) 2089.
60. H. Fujiwm, H. fmkawa, S. Murata, Y. Sasaki, B. Chem. Soc. Jpn. 60 (1987)
3891.
6 1. M. L. Bender and M. I<orniyama, Cyclodextrin Chemistry, S pringer-VerZag,
Berlin 1978.
62. Y. Matsui md K. Mochida, Bull. Chem Soc. Jpn. 52 (1 979) 2808.
63. W. Saa~ger, Angew. Chem. Int, Edit. 1 9 (1 980) 344.
64. T. Kinashita, F. linuma, A. Tsuji, Chem. Pharm. Bull. 22 (1 974) 24 13.
65. P.D. Ross and M.V. Rekharsky, Biophys. J. 71 (1 996) 21 44.

CHAPTER 4
DETERMINATION OF MONTELUKAST SODIUM AND
SIGNIFICANT IMPURITIES

4.1 INTRODUCTION
Montelukast sodium (MK) is currently being produced at Merck & Co as
an active ingredient for treatment of bronchial asthma. To monitor the
manufacturing process an HPLC method is being employed. This method requires
up to 35 min for each run, consumes large volume of organic solvents and uses
expensive HPLC columns. In this work a CE method is proposed as an alternative
to HPLC. Significantly shorter analysis times, inexpensive equipment along with
reproducible and very efficient separations are incontestable advantages of the CE
method.
4.1.1 Montelukast
Montelukast sodium (free acid of SingulairT*), also known as MK-0476
[I -(((I (R)-(3 -(2-(7-chloro-2-quinolinyl)-(E)-ethenyl)phenyl)(3-2-(l -hydroxy- 1 - methylethyl) phenyl) propyl) thio) methyl) cyclopropane) acetic acid sodium salt],
was developed by Merck & Co [I] as a therapeutic agent for the treatment of
bronchial asthma. The chemical structure of the compound is presented in Figure
4.1.
Figure 4.1. Chemical structure of montelukast sodium.
155

The only available data about montelukast sodium was received fi-om
Merck & Co. It is surnmarised in Table 4.1.
Table 4.1. Information on montelukast sodium.
Information Value
MW 608.2 g mole-'
pH Between 9.4 and 10.2
Solubility in water at 25OC Greater than 100 mg m ~ - '
Soluble in other solvents
Melting point
Ethanol, methanol
135.5"C
Partitioning coefficient Log K,, 2.3
Montelukast sodium is very sensitive to exposure to light or moisture.
Light exposure is reported to cause isomerisation (formation of the cis-isomer).
Exposure to oxygen causes formation of sulfoxide impurities at elevated levels. In
case of prolonged exposure to the atmosphere the compound picks up moisture
and degrades. According to the literature provided by Merck & Co, Montelukast
degrades at 60°C.

4.1.2 Montelukast in the treatment of asthma
Montelukast sodium is a potent and selective leukotriene D-4 (cysLT-1)
receptor antagonist [2,3]. The role of the cysteinyl leukotrienes (leukotrienes C-4,
D-4 and E-4) in asthma has been established [4]. Leukotrienes are produced and
released from proinflammatory cells, including eosinophils and mast cells, and are
at least 1000 times more potent than histamine or methacholine as
bronchoconstrictors in healthy and asthmatic subjects. Leukotrienes mediate many
of the pathophysiologic processes associated with asthma, including
microvascular leakage, bronchoconstriction, and eosinophil recruitment into the
airways. Agents that interrupt the action of the leukotrienes (5-lipoxygenase
inhibitors and leukotriene receptor antagonists) have improved measures of
chronic asthma in clinical studies, thus providing evidence for the role of
cysteinyl leukotrienes in this disease [ 5 ] .
Montelukast has been shown to substantially block airway leukotriene
receptors in patients with asthma for as long as 24 hours aRer oral dosing [6].
Administered once daily, it reduced symptoms of chronic asthma in adults and
children [7, 81 and attenuated exercise-induced bronchoconstriction [9, 101.

4.1.3 Determination of Montelukast
Relatively few methods have been reported for the determination of
montelukast in the open literature. The majority of the methods have been
dedicated to the analysis of montelukast in biological fluids and only a few
methods were developed for pharmaceutical formulations. All methods are
discussed below.
Amin et al. [I 11 developed an HPLC assay for the determination of
montelukast in human plasma involving protein precipitation and fluorescence
detection. With this method, chromatography was performed on a Cl8 column
with a mobile phase of acetonitrile-ammonium phosphate (pH 3.5; 50 mM)
(62:38, vlv). The assay was linear in the range of 28.9 - 2890 ng m ~ - ' of
montelukast. Montelukast and the internal standard (very similar in structure to
montelukast) were separated in 5 min, which is reasonable and would allow the
analysis of a number of samples in a clinical laboratory. The advantage of
sensitive fluorescence detection was low LOD 5 ng m ~ - ' , which would be useful
for analysis of traces of montelukast in plasma.
Liu et al. [12] outlined a method for analysis of montelukast enantiomers
in human plasma. Samples of plasma undergo extraction on the Chromospher 5
Biomatrix extraction column, with subsequent switching to an analytical
stereoselective column of an HPLC instrument. The assay included protein
precipitation and fluorescence detection. Separation was performed on an a-acid
glycoprotein chiral column with a mobile phase of acetonitrile-ammonium acetate
(pH 5.8; 10 mM) (25175, vlv). Separation of two enantiomers and an internal
standard required up to 35 min. The linearity range for enantiomers was narrower
than for single montelukast and was between 28.9 and 386 ng m ~ - ' of free acid of
montelukast and its S-enantiomer. The research group studied several healthy
volunteers who received a dosage of montelukast daily and concluded that there is
no apparent bioinversion of montelukast to its S-enantiomer in humans.
In a study by Ochiai et al. [I31 a sample pre-treatment step was developed
for a direct injection of plasma sample onto the HPLC system with CLs column. A
six-port switching valve was employed to transfer the sample fiom pre-column to
the analytical column. A mobile phase of acetonitrile-acetate buffer (pH 3.5, 25
rnM) (80:20, vlv) was used to elute montelukast from the analytical column. The
158

temperature of the analytical column was maintained at 40°C. A linearity range of
1 - 500 ng m ~ - ' was achieved. Although the limit of detection was not
determined, it could be sufficient as fluorescence detection was employed. The
time required for processing samples using this method was shortened due to on-
column pre-treatment but the actual separation time was quite long - just under 25
min.
Al-Rawithi et al. [14] described a human plasma assay for the analysis of
montelukast. Authors claimed that a simple extraction of the plasma is less time
consuming than column switching. That is why extraction was used before the
drug was measured by HPLC with a C-8 4-pm particle size radial compression
cartridge at 40°C and identified with fluorescence detector with the excitation and
emission wavelengths set at 350 and 400 nm, respectively. The mobile phase was
delivered at 1.0 mL min-'. This mobile phase consisted of 200 mL of 0.025 M
sodium acetate, pH adjusted to 4.0 with acetic acid, to 800 mL of acetonitrile,
with 50 mL triethylarnine. With a run time of only 10 min per sample, this assay
had an overall recovery of >97% and improved detection limit of 1 ng m ~ - l .
The most recent human plasma assay for the analysis of montelukast
sodium was published by Kitchen and colleagues [I 51. The novelity of the method
was in the use of a semi-automated 96-well protein precipitation method. The
analysis was performed by HPLC with fluorescence detection. The method
offered significant time savings over the manual methods and reached limit of
quantitation of 3 ng m ~ - ' .
Radhahshna et al. [16] published the only up to date HPLC method for
the simultaneous determination of montelukast and loratadine in pharmaceutical
formulations and separation of impurities of montelukast using high-low
chromatography technique. HPLC separation was achieved with a Symmetry C18
column and acetonitrile-sodium phosphate buffer (pH 3.7; 0.025 M) (20:80, vlv)
as eluent at a flow rate of 1.0 mL min". UV detection was performed at 225 nm.
The separation of impurities of montelukast was performed in approximately 35
min per single run, which would be quite a time consuming procedure in the busy
environment of the pharmaceutical industry. As an alternative, second derivative
spectrophotometry was reported to be successful for the simultaneous
determination of montelukast and loratadine in pharmaceutical formulations. The
second-order derivative spectrophotometry was applied due to overlap of the UV
159

spectra of loratadine and montelukast in the area from 200 nrn to 310 nrn. The
zero-crossing technique was applied at 276.1 nm, but for montelukast, peak
amplitude at 359.7 nm (tangent method) was used.
Pressurised liquid extraction technology for the extraction of montelukast
sodium from oral chewable tablets was introduced. In the study by Hoang et al.
[17] samples were extracted using two cycles of water for 2 min with a cell
temperature of 40°C and a pressure of 1*lo4 kPa, to disintegrate the tablet,
followed by three cycles of methanol for 3 min at 70°C and 1*104 kPa, to
solubilise montelukast sodium. The method demonstrated an improvement in
extraction efficiency of 98.2% of label claim compared to 97.6% obtained using a
validated mechanical extraction method, the % RSD was 1.3% (n=10) compare to
0.9% RSD from mechanical method. Quantitative analysis was performed using
an HPLC system.
A high performance thin layer chromatographic method for the
determination of montelukast sodium in bulk drug and pharmaceutical
preparations was reported by Sane et al. [1 81. Chromatography was performed on
silica gel 60F254 HPTLC plates, the mobile phase used for elution was toluene-
ethyl acetate-glacial acetic acid, 6.0 + 3.4 + 0.1 (vlv). Plates were evaluated by
densitometry at 344 nm. The linearity of the method was established in the range
0.8 - 10 pg m ~ - ' . Coefficient of variation was less than 2%. Each analysis
required approximately 45 min, which is even longer than the reported [16] HPLC
method.
A case of chiral separation of montelukast and its S-enantiomer by
capillary electrophoresis has been reported by Hoang et al. on the Tenth
International Symposium on Pharmaceutical and Biomedical Analysis [19].
However the results of the above were not published in the peer-reviewed
literature.
Duran Meras et al. [20] studied the complexation of montelukast and
heptakis-(1, 6-di-0-methyl)-P-cyclodextrin using fluorimetry. It has been proven
that fluorescence of montelukast was significantly intensified in the presence of
cyclodextrins. A 1: 1 stoichometry was established and the association constant of
the inclusion complex was 959 M-I. The pKa values of montelukast were also

estimated in two different ethano1:water media, 70:30(v/v) and 10:90 (vlv) and
were pKa = 2.9 * 0.1, pKal = 2.0 k 0.1 and pKa2 = 6.5 k 0.1, respectively.
As reported at present mainly HPLC and HPTLC methods have been
developed for this purpose. All of them are quite time consuming methods - the
separation time of HPLC method is just under 35 min in reported work of
Radhakrishna el al. [16], 45 min is required for an HPTLC analysis [18].
Obviously long analysis time in HPLC requires larger quantities of mobile phase,
waste of which can add to the cost of analysis.
Even though a capillary electrophoresis method has not been developed
yet, this technique proved to be very advantageous in pharmaceutical separations.
Many ways to vary parameters of the run buffer lead to the possibility of adapting
each composition for the specific case whether charged or neutral compounds,
structurally related or optical isomers have to be separated. The high efficiency of
the separation, shorter analysis time, small volumes of samples and buffers
required - these are the reasons why this method should be investigated in the
determination of montelukast sodium and its related impurities.

4.1.4 Aim of this work
The aim of this work was to determine montelukast sodium and significant
impurities. A fast analysis time and reproducible separation were among the
objectives of the research in order to develop n capillary electrophoresis method
comparable to the conventional methods.

4.2 EXPERIMENTAL
4.2.1 HPLC instrumentation
HPLC separations were performed on a Hewlett Packard series 1050
system with a Model 78953C variable wavelength detector. The instrument was
operated using Agilent ChemStation Software version A.09.03 (Agilent
Technologies, Palo Alto, CA, USA). An Alltech BRAVA BDS column (25 cm x
4.6 mm, particle size 5 pm) was used. The mobile phase flow was maintained at 1
mL min-I. Separations were performed at 20°c. UV detector was at 225 nm unless
otherwise stated.
4.2.2 CE instrumentation
CE separations were performed using the system described in Chapter 2.
The fused silica capillaries (Composite Metal Services ltd., The Chase, Hallow,
Worcs. WR2 6LD) were 64 cm in length (56 cm to the detector) with an internal
diameter of 50 pm unless otherwise stated.
4.2.3 Reagents
All compounds investigated in the separations had purity 99% and were
used without further purification. Montelukast sodium was kindly supplied by
Merck, Sharp & Dohrne Irl Ltd. (Ballydine, Kilsheelan, Co. Tipperary, Ireland).
NaH2P04, HC1, NaOH, sodium dodecyl sulphate, (2-hydroxypropy1)-a-
cyclodextrin (MS - 0.6), (2-hydroxypropy1)-P-cyclodextrin (DS - 4- 1 O), (2-
hydroxypropy1)-y-cyclodextrin (MS - 0.6), y-cyclodextrin, KBr were purchased
from Sigma-Aldrich, Dublin, Ireland. Methanol (HPLC grade) and acetonitrile
(HPLC grade) were from Lab-Scan, Dublin Ireland. Boric acid was from Riedel-
de Haen, Seelze, Germany. Buffers were prepared using distilled water and
adjusted using 1 M and 0.1 M NaOH and 0.1 M HC1.

4.2.4 Standards
Stock solutions of 1 rnM or 10 mM montelukast sodium were prepared in
methanol .For CE experiments. For the HPLC experiment 8.2 m M stock solution of
montelukast sodium was prepared in water:ACN=20:80 (vJv). All were kept in
amber flasks. Samples of mont-elukast for analysis were exposed to the light and
air (oxygen) for 4 days unless otherwise stated.
4.2.5 Procedure
All procedures with mantefukast sodium were performed in a dark room.
All buffers were filtered through a 0.2 prn filter before use. Separations were
carried out at 30 kV electrophoretic voltage and temperature 20°C. Injections were
hydrodynamic 50 mbar for 2 sec. Conditioning between runs was performed with
0.1 M NaOH for 1 min, followed by MeOH for 1 min and run buffer for 2 min.
All separations were repeated at least three times.

4.3 RESULTS AND DISCUSSION
4.3.1 HPLC
In order to be able to observe impurities it is necessary to inject large
sample concentration. While this chapter's main focus was the development of a
CE method, it was first desirable to detect the impurities in the HPLC separation
and compare the results with the literature. In the work of Radhakrishna et al. [16]
the impurities of montelukast sodium were determined by HPLC method. A high-
low chromatography technique was employed in this case.
'""i , , , , , * , , , ,
0 7." 30
Retentinn tune, min
l d , I " " I ' " V E " " I " " 1 " " I " " I ' " '
0 5 10 15 2 0 2 5 3 0 55 Retention time, min
Figure 4.2. A - high-low chromatogram of montelukast. B - expanded high-low chromatogram of montelukast. Chromatographic conditions: Alltech BRAVA BDS CI8 column, 250*4.6 mm, 5 pm column; mobile phase 0.025 M NaH2P04 pH 3.7:ACN = 20:80 (v/v), flow rate 1 rnL min-' ; injection 10 pL; detection at 200 nm. Peak identification: 1-9, 11 - not identified, 10 - montelukast. Concentration of montelukast 1.64 mM.

The aim of the method was to analyse the sample containing a high
concentration of mantelukast and improve sensitivity toward low-level impurities.
The weight percentage of each impurity present in the sample was calculated by
comparing its response to Ule response of diluted montelukast (0,5%), prepared
€ram concentrated sample (5 mg m~-'). Three unknown impurities and cis-isomer
were separated from the main component in less than 35 min, Since this was the
only available information about impurities of montelukast sodium, it was taken
into account for future investigation.
Figure 4.3. Chromatogram of the injection of water:ACN = 20:80 (vlv). Chromatographic conditions as in Figure 4.2. Peaks 1-6 not identified.
d U 2 3 J
0.5 1 :
-0.5:
-1 :
0 5 10 15 20 25 30 35 T i e , rnin
4 1 5
.? \ I " " I " " ' I ' " " " " l " " 1 " " 1 ' "

The method reported by Radhakrishna et al. [16] was applied to the
sample of montelukast sodium under investigation. The resultant chromatogram is
shown in Figure 4.2. The elution time of montelukast (peak 10 on the
chromatogram) was in accordance with the chromatogram in the work [16]. The
number of obtained peaks exceeded the number of peaks in work of Radhakrishna
et al. [16]. Four peaks in this separation belonged to the impurities of the solvent,
in which a fresh sample of montelukast was prepared. Figure 4.3 shows a
chromatogram obtained after the injection of water:ACN = 20:80 (v/v). Peaks 1,
2, 4 and 5 with the elution times 2.06 min, 2.27 min, 4.03 min and 8.14 min,
respectively, corresponded to peaks 1 (2.07 min), 2 (2.28 min), 4 (4.03 min) and
8 (8.13) in Figure 4.2. It has to be noted that the elution time of peak 6 in the
injection of the solvent (12.15 min) was identical to the montelukast peak (12.15
min) in Figure 4.3. This leads to the view that the method of Radhakrishna et al.
[16] was not completely suitable for the analysed system, unless the area of that
peak was ignored due to its small value.
Peak 9 on the chromatogram of the montelukast was proposed to be a cis-
isomer of montelukast as it corresponded to the identified peak in work of
Radhakrishna and colleagues [16]. Peaks 5 and 11 also agreed with the elution
times of two impurities in the literature [16]. One of the peaks in the sample of
Radhaktlshna et al. [16] did not correspond to any of the peaks in Figure 4.2
where several other peaks were present. This and other obtained peaks could be
due to the specifity of the analysed sample of montelukast sodium.
The chromatographic analysis of the sample under the investigation
showed at least 6 peaks of different intensity (peaks 3, 5, 6, 7, 9 and 1 1), which
could repesent the potential impurities, although a number of less significant
peaks were present on the chromatogram.

4.3.2 CZE
The common drawback of the CE-UV analysis is poor sensitivity. This
could strongly affect the aim of this study to develop a separation of montelukast
and impurities, as the impurities in montelukast sodium are present at elevated
levels. It was thought that intentional exposure of the montelukast sodium sample
to the light and air (oxygen) would cause an increase in the concentration of the
potential impurities, which would be desirable especially for the method
development.
Several modes of CE were tested in order to separate impurities of
montelukast sodium. Figures 4.5-4.7 show electropherograms in CZE, MEKC and
CD-MEKC modes. Free zone elctrophoresis (Figure 4.5) was found to be
unsuitable for such a challenging problem and only a single peak was obtained in
this separation. Montelukast and its impurities possess a negative charge at the
conditions of the separation (pH 9.2) and comigrate against EOF with comparable
velocities, whch points to their high similarity in structure. The pH of the
experiment was then gradually increased to 10.2. A change in mobility was
observed but no separation of the compounds was observed.
Figure 4.5. Electropherogram of CZE separation of MK. Separation conditions: 20 mM borate buffer pH 9.2, 30 kV, 20°C, hydrodynamic injection 2 sec., detection at 225 nm, capillary 56cm (48cm), 50 pm i.d. 1mM MK in methanol exposed.
- 40'
20' -
EOF
0 -;f -
I
1 2 3 Mgration time, min
4

Montelukast sodium is quite a hydrophobic compound as its log&, is 2.3
(Table 4.1).The resolving power of MEKC [2 11 provides separation capability for
compounds of hydrophobic nature. The hydrophobic properties of montelukast
would induce its incorporation into the micelles. Figure 4.6 shows the
electropherogram of MEKC separation of exposed sample of monteluklast
sodium. A micelle-forming additive SDS, was introduced to the run buffer in
concentration from 2.5 mM to 50 mM. Additional peaks were observed in the
eletropherograms. It was found that at lower concentration of SDS they eluted the
capillary with better resolution than at higher SDS concentration. The optimum
was found to be at 6 mM SDS, which is lower than the critical micelle
concentration of SDS, 8.2mM (this magnitude is lower in a buffer solution than in
water) [22]. Thus the mechanism of actual MEKC separation should be
questioned in this separation.
Figure 4.6. Electropherogram of MEKC separation of MK. Separation cond.: 20 mM borate buffer pH 9.2 6 mM SDS, 30 kV, 20°C, hydrodynamic injection 2 sec., detec. at 225 nm, capillary 56cm (48cm), 50 pm i.d. 1mM MK in methanol exposed.

4.3.4 CD-MEKC
4.3.4.1 The type of cyclodextrin
It is known that one of the main impurities in montelukast sodium is its
cis-isomer. The addition of cyclodextrin to the run buffer should have a positive
effect on this separation and help to resolve such closely structured compounds. A
range of cyclodextrins was investigated in this study. The electropherograms
illustrating the separations are shown in Figure 4.7. A concentration of 5 mM of
each cyclodextrin was added to the run buffer containing 20 mM borate at pH 9.2,
with 6 mM SDS. This composition was optimised in advance. It can be seen that
the separation with 2HP-a-CD or 2HP-P-CD was not successful, as it resulted in
coelution of the analyte and impurities. The addition of 2HP-y-CD and y-CD
improved the separation and several additional peaks could be noted in Figure 4.7
(C, D). These results pointed to the fact that the size of the cavity of the employed
cyclodextrins played the key role in the separation. The cavity of 2HP-a-CD and
2HP-P-CD was not large enough for the molecule of montelukast or its cis-isomer
to penetrate the cyclodextrin and form the inclusion complex. The diameter of the
cavity of y-CD is reported to be 10A [23]. This is likely to have allowed the
formation of the inclusion complex of the molecule of analyte and cyclodextrin to
occur.

X 16& EOF
I
15 I 6 d
EOF
LfVl -.
C 1 4-u
1 2 '& 2 5
I " " I ' " ' 1 " I " '
3 3.5 4 4.5 Mgration time. min
Figure 4.7. Electropherograms of CD-MEKC separation of MK. Separation cond.: 20 mM borate buffer pH 9.2,6 mM SDS, 5 mM of A - 2HP-a-CD, B - 2HP-P-CD, C - 2HP-y-CD, D - y-CD, 30 kV, 20°C, hydrod. inj. 2 sec., detec. at 225 nm, capillary 64 cm (56 cm), 50 pm i.d. 1mM MK in methanol exposed.

Interestingly, Meras et al. [20] studied the complexation of montelukast
and heptakis-(I , 6-di-0-methyl) subsitutes of P-cyclodextrin using fluorimetry.
Their investigation showed that a complex between montelukast and cyclodextrin
was formed. The association constant of the inclusion complex was found to be
959 M-'. The cyclodextrin investigated in this work and in work [20] are
substitutes of P-CD and thus the cavity of both cyclodextrins should be similar in
size (7 glucose unite in the ring).
There can be several reasons for the difference in the behaviour of
cyclodextrins. Firstly, the difference in the nature of functional groups of P- cyclodextrins and the degree of cyclodextrin substitution can make significant
inpact on the results [24]. Secondly, the concentration of cyclodextrin can have an
effect. In this study 5 mM 2HP-y-CD was used with I mM montelukast (before
the sample was exposed). In the work of Meras et al. [20] it was demonstrated
that greater than 1000 times CD - montelukast molar concentration ratio did show
inclusion. Cyclodextrin was employed in the concentration 6.9 mM while the
investigated level of montelukast was 1.8 pM [20]. Such a low concentration of
montelukast could not be investigated in this work as the objective was to study
the impurities. Thirdly, the solvent employed in the study of Meras et al. [20]
consisted of ethanol, acetate buffer and water. At such conditions montelukast is
in its protonated form; according to the results of this paper pKa of montelukast is
2.9. For the capillary electrophoretic analysis montelukast has negative charge as
borate buffer pH 9.2 was used. The hydrophobic inclusion is less likely to occur
while the guest molecule was charged.

One major peak and one peak of a lower intensity can be seen in the
electropherogram in Figure 4.7 with y-CD and 2HP-y-CD. One of the peaks is
montelukast. The second peak is likely its cis-isomer as the sample was exposed
to the light and air for 4 days.
There were other minor peaks separated with the investigated conditions.
At the concentration of 5 mM the number of peaks separated with 2HP-y-CD was
higher than with y-CD. Also, tailing of peaks could be noted in the separation with
y-CD, indicating that the mobility of the analytes is lower that the mobility of the
buffer 1251. Peaks 1 and 2 on the electropherogram of the separation with 2HP-y-
CD are due to buffer constituents. Their presence was observed on the
electropherogram of the blank injection. The number of the peaks (6) matching
the impurities formed after the exposure of the montelukast to the light and air
corresponded to the number of impurities obtained in the separation by HPLC
method (Figure 4.2).
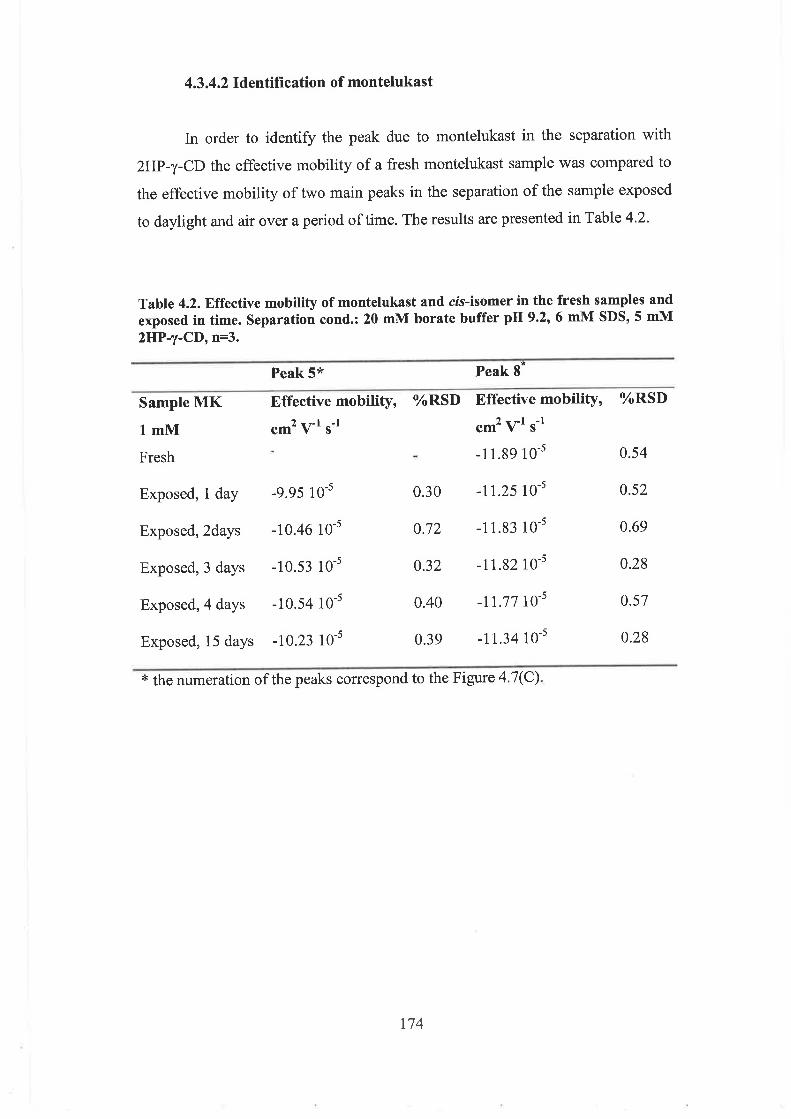
4.3.4.2 Identification of montelukast
In order to identify the peak due to montelukast in the separation with
2HP-y-CD the effective mobility of a fresh montelukast sample was compared to
the effective mobility of two main peaks in the separation of the sample exposed
to daylight and air over a period of time. The results are presented in Table 4.2.
Table 4.2. Effective mobility of montelukast and cis-isomer in the fresh samples and exposed in time. Separation cond.: 20 mM borate buffer pH 9.2, 6 mM SDS, 5 mM 2HP-y-CD, n=3.
Peak 5* Peak 8*
Sample MK Effective mobility, %RSD Effective mobility, %RSD
1 mM -1 -1 c m 2 v s cm2 v-' i1 Fresh - -1 1.89 0.54
Exposed, 1 day -9.95 lo-' 0.30 -11.25 lo-' 0.52
Exposed, 2days -10.46 0.72 -11.83 0.69
Exposed, 3 days -10.53 10" 0.32 -11.82 0.28
Exposed, 4 days -10.54 10-5 0.40 -1 1.77 0.57
Exposed, 15 days -10.23 0.39 -1 1.34 0.28
"thenumeration of the peaks correspond to the Figure 4.7(C).

The negative values of the mobility of montelukast and its cis-isomer
mean that the molecules migrated against EOF. It can be seen that the mobility of
peak 8 in the separation with 2HP-y-CD (Figure 4.7(C)) corresponded to the
effective mobility of montelukast in the fresh sample. The effective mobility of
montelukast was consistent while the sample was exposed to the light and air for
up to 15 days. It has to be noted that the area of montelukast peak 8 in Figure
4.7(C) is smaller than area of peak 5, which is supposedly its cis-isomer. This
sample was exposed to the daylight and air for approximately 4 days, when most
of the montelukast was converted to the isomer.
Table 4.3. Effective mobility of montelukast and cis-isomer in the fresh samples and exposed in time. Separation cond.: 20 mM borate buffer pH 9.2, 6 mM SDS, 5 mM y-CD, n=3.
Peak 2* Peak 5*
Sample MK Effective mobility, %RSD Effective mobility, %RSD
1 mM cm2 v-' s-' cm2 v' s-' Fresh - -15.04 0.24
Exposed, -13.68 0.67 -15.28 0.24
4 days
* the numeration of the peaks correspond to the Figure 4.7(D).

A similar study was performed to identify the montelukast peak in the
separation with y-CD. The effective mobility is shown in Table 4.3. Thus the
mobility of peak 5 in Figure 4.7(D) corresponds to the mobility of the montelukast
in a fresh sample. Even though the study on the inclusion complexation of y-CD
and 2HP-y-CD and montelukast was not performed, the obtained data on the
effective mobility can represent this information to some extent. The inclusion of
analyte molecule in 2HP-y-CD occurred to a greater degree than in y-CD, as the
effective mobility had a less negative magnitude. The molecules of cyclodextrin
did not posses their own mobility at the conditions of the experiment as they were
neutral and migrated along the capillary with EOF. Any interaction of the analyte
molecule, which possesses negative mobility, with a neutral species would result
in the change of the analyte mobility to the less negative magnitude as the general
mobility of the complex. The stronger interaction would lead to a greater change
in the mobility. The effective mobility of montelukast in the case of the separation
with 2HP-y-CD was -11.89 lo-' cm2 V-' S-l, which is higher than the mobility of
montelukastat in the case of separation with y-CD -1 5.04 lo-' cm2 V-I s".

4.3.4.3 Concentration of cyclodextrins
Both cyclodextrins (y-CD and 2HP-y-CD) had shown an improvement in
the separation of montelukast and its impurities, therefore it was decided to
investigate the influence of the concentration of each cyclodextrin on the
separation. The range of concentration 3 - 10 mM was evaluated for y-CD and 3 -
20 mM for 2HP-y-CD. Tables 4.4 and 4.5 represent the data obtained. Since the
aim of this research was to separate the montelukast from its impurities, only the
peak of montelukast was considered when choosing the parameters of separation.
In the table 4.4 it could be seen that resolution of montelukast peak was very good
(>2) in the full range of the investigated concentration of y-CD. The efficiency of
the peak was over 200000 theoretical plates. The migration time was very precise
as %RSD was between 0.23 and 1.07. The actual magnitude of the migration time
of montelukast did not change significantly. Thus, the concentration of y-CD that
allowed more efficient separation of montelukast could be chosen for further
investigation.
Table 4.4, Effect of the concentration of y-CD on the parameters of the separation. Separation cond.: 20 mM borate buffer pH 9.2,6 mM SDS, n=3.
Conc. 1 R 2**
* resolution of peaks 5 and 4 in Figure 4.7(D). ** resolution of peaks 5 and 6 in Figure 4.7(D).

The determination of montelukast with 2HP-y-CD in the run buffer was
even more efficient and the general trend of the efficiency was to increase with
increased concentration of cyclodextrin. Only at 20 mM 2HP-y-CD the efficiency
was observed to decrease. The results are presented in Table 4.5. The %RSD of
the migration time was under 2%, while the actual magnitude of the migration
time increased with increased concentration of 2HP-y-CD in the run buffer. The
resolution of montelukast peak has shown to improve with higher concentration of
cyclodextrin. For the resolution with the peak 7 (as in Figure 4.7(C)) a maximum
was observed at the concentration 10 rnM of 2HP-y-CD, after which the
resolution decreased again. A 10 mM concentration could be chosen for further
investigation of the separation with 2HP-y-CD.
Table 4.5. Effect of the concentration of 2HP-y-CD on the parameters of the separation. Separation cond.: 20 mM borate buffer pH 9.2,6 mM SDS, n=3.
Conc. t, (min) %RSD N R l* R 2**
ZHP-)I-CD (t m)
3 m M - - - 0 0
* resolution of peaks 8 and 7 in Figure 4.7(C). ** resolution of peaks 8 and 9 in Figure 4.7(C).

4.3.4.4 The effect of organic solvent
The addition of an organic solvent such as acetonitrile or methanol to the
run buffer often increases the efficiency and improves the resolution of separation
[26, 271. A 10% MeOH concentration was added to the run buffer comprising 20
mM borate pH 9.2, 6 mM SDS, 10 rnM 2HP-y-CD. The comparison of the
obtained electropherogram and the electropherogram without organic additive is
shown in Figure 4.8. The addition of methanol to the run buffer resulted in a
significant decrease in EOF, which led to longer time of analysis. The poor
efficiency and resolution and diffusion of the leading edge of the peaks could be
noted in this separation. The latter is due to the higher mobility of the solute zone
in comparison to the mobility of the buffer [25]. It was decided not to employ
methanol in further separation of the impurities of montelukast by CD-MEKC.
4 I - - - - * I - - - - . I - - - '
2 3 4 5 6 7 8 Mgration time, m h
Figure 4.8. Electropherograms of CD-MEKC separation of MK with and without MeOH in the run buffer. Separation cond.: 20 mM borate buffer pH 9.2,6 mM SDS, 10 mM 2HP-y-CD, ---- - with 10% MeOH, ---- - without MeOH, 30 kV, 20°C, hydrod. inj. 2 sec., detec. at 225 nm, capillary 64cm (56cm), 50 pm i.d. 1mM MK in methanol exposed.

4.3.4.5 Concentration of SDS
In order to optimise the concentration of the surfactant in the CD-MEKC
system the range of 3 - 15 mM SDS was studied. The parameters of the obtained
results are presented in Table 4.6. The resolution of montelukast with peaks 7 and
9 (as in Figure 4.7(C)) was not affected significantly by the changes in the
concentration of SDS; only at higher concentration (15 mM) was the resolution
found to be less than 1. Good reproducibility of the migration time (%RSD < 2)
could be observed. A definite increase in the efficiency of the montelukast peak
followed the increase of the SDS concentration up to 10 mM SDS where the
maximum efficiency was over 900000 theoretical plates. The latter conditions
were chosen as optimum in t h s study.
Table 4.6. Effect of SDS concentration on the parameters of the separation. Separation cond.: 20 mM borate buffer pH 9.2,10 mM 2HP-y-CD, n=3.
Conc. t,(rnin) %RSD N R I* R 2**
SDS (t m)
3 mM 3.99 0.45 309427k12258 1.76 2.2 1
* resolution of peaks 8 and 7 in Figure 4.7(C). ** resolution of peaks 8 and 9 in Figure 4.7(C).

4.3.4.6 Purity of montelukast peak
The purity of the montelukast peak was established by the peak-area ratio
method for fresh standard and the sample of montelukast exposed to the light and
air for 4 days at different wavelengths. The results are demonstrated in Table 4.7
and Table 4.8. The developed method has yielded consistent purity of montelukast
peak with cyclodextrins, y-CD and 2HP-y-CD, in the run buffer.
Table 4.7. Purity of montelukast peak established by the peak-area ratio method of standard solutions and exposed sample at various wavelengths. Separation cond.: 20 mM borate buffer pH 9.2,10 rnM SDS, 10 mM 2HP-y-CD.
Wavelength ratio Peak area ratio Peak area ratio
LlIL2 Fresh MK* M K exposed*
* Mean from three determinations with %RSD <5%.
Table 4.8. Purity of montelukast peak established by the peak-area ratio method of standard solutions and exposed sample at various wavelengths. Separation cond.: 20 mM borate buffer pH 9.2,6 mM SDS, 5 rnM y-CD.
Wavelength ratio Peak area ratio Peak area ratio
k11L2 Fresh MK* M K exposedt
2 141200 0.71 0.72
* ~ e a n from three determinations with %RSD < 5%.

4.3.4.7 Validation of the method
The method development has shown that both cyclodextrins y-CD and
2HP-y-CD are suitable for the sepdation of montelukast and its impurities. For
method validation the buffer containing 2HP-y-CD was chosen, as the cost of this
compound was significantly less than the natural y-CD. The parameters of the
optimised method are summarised in Table 4.9.
Table 4.9. The parameters of the optimised method for the determination of montelukast and its impurities.
Buffer 20 rnM borate pH 9.2
Buffer additives 10 mM SDS
Temperature of separation 20°C
Separation voltage 30 kV
Injection conditions 50 mbar, 2 sec
Detection
Capillary
225 nm
64 cm (56 cm), 50 pm i.d.
Preconditioning 1 min 0.1 M NaOH
1 min MeOH
2 min run buffer

The calibration graph was established with the peak-area as ordinate
versus the concentration in mM as axis. The obtained linear regression equation
was y = 166.71~ - 6.2014, ~~=0 .9941 , n=3. The data indicates good linearity of
the method over the studied concentration of montelukast 0.01 mM - 1 mM.
Relative standard deviations of the migration time and peak area of I mM fresh
sample of montelukast sodium were 0.53% and 4.50%, respectively.
The developed method only allows the determination of montelukast fiom
its impurity in the samples that have been exposed to the light or air, which
increases the concentration of the impurity in the sample. No impurity could be
detected at their elevated levels in the fresh stock of montelukast. Further
improvements of the detection limits are necessary in order to be able to employ
the developed method for the purity test of montelukast sodium.

4.3.4.8 Temporal study of the degradation of montelukast
The developed method was employed in the investigation of the
degradation of montelukast sodium under exposure to air and light. One series of
1 mM solutions of montelukast sodium were exposed to the light and air for 1, 2,
6 and 8 days. Before capillary electrophoresis analysis the solvent level of each
sample was adjusted to obtain the same concentration. The second series of 1 mM
solutions of montelukast were kept in air tight vials and exposed to light only, for
1, 2, 6, and 8 days. It has to be mentioned that the light exposure was to indoor
light for 24 hours a day. The concentration of montelukast was obtained through
the calibration curve. The results are presented in Figure 4.9. It can be seen that
the most significant decrease in the concentration of montelukast occurs during
the first two days of the sample being exposed to light and air. The concentration
of montelukast in the sample that was exposed only to light decreased faster and
to around 0.3 rnM after 2 days. The concentration of the sample exposed to both
light and air approached 0.5 mM after 2 days.
1.2 -
L-
It 3 m
0 I 1 1 I
0 2 4 6 8
Time, days - - - - -
.I
Figure 4.9. Effect of light and air on the concentration of montelukast. Separation cond.: 20 mM borate buffer pH 9.2, 10 mM SDS, 10 mM 2HP-y-CD, 30 kV, 20°C, hydrod. inj. 2 sec., detec. at 225 nm, capillary 64cm (56cm), 50 pm i.d. 1mM MK in methanol exposed. + - exposure to light and air, +-- - exposure to light.

Figure 4.10 shows the effect of light and air on the peak area of cis-isomer
of montelukast. It gradually increased during all period of exposure. Noticeably,
the peak area of cis-isomer from the sample, which was in contact only with light,
became more intense than from the sample where both light and air were
involved. These results from Figure 4.9 and 4.10 pointed to the fact that
degradation of montelukast and the formation of cis-isomer were to a higher
degree when there was no contact with the air (oxygen) in the exposed sample. It
was thought that the presence of oxygen induced some other processes in the
sample, which slowed down the formation of cis-isomer. This rather unusual
kinetics of the degradation of montelukast and the formation of cis-isomer in
presence of light and light and air can suggest that most of the montelukast is
transformed into its cis-isomer under "the light conditions". The presence of
oxygen (from the air) appears to slow down the degradation of montelukast and
the formation of cis-isomer, possibly due to the acceleration of an alternative
degradation mechanism and alternative degradation products, which were not
detected in current study.
I
80 -
ce 60 - 0 % 3 &
0 2 4 6 8
Time, days
Figure 4.10. Effect of the light and air on the peak area of cis-isomer of rnontelukast. Separation cond.: 20 mM borate huffer pH 9.2,16 mM SDS, 10 mM 2HP-y-CD, 30 kV, 20nC, hydrod. inj. 2 sec, detec. at 225 nm, capillary 6 b 1 (56crn), 50 pm 3.d. 1mM MK in methanol exposed. + - exposure to light and air, - - exposure to light.

The developed method for the determination of montelukast and its
impurities allowed to obtained valuable information about the stability of
montelukast and different rates of the conversion to its cis-isomer. This data has
never been obtained before by capillary electrophoresis or other analytical
techniques.
4.3.5 Comparison of HPLC and CE methods
The comparison with the HPLC method published in literature [16] of the
developed capillary electrophoresis method for the determination of montelukast
and its impurity is presented in Table 4.10. It can be seen that one CE analysis
required only 9 min, 4 of which were for conditioning the capillary prior the
analysis. The HPLC analysis took over 30 min. The montelukast peak had an
acceptable resolution from its impurity, even though that its resolution was less
than in HPLC method. Extremely high efficiency of capillary electrophoresis
separation could be noted in Table 4.10. The repeatability of the migration time
was very good for both methods.
Table 4.10. Comparison of the parameters of the HPLC and CE methods for the separation of the impurity in montelukast sodium.
HPLC CE
tr/tm of MK 12.15 min 4.15 min
Complete time of 1 analysis 33 min 9 min
Resolution of MK peak 9.4 and 12.2 1.72 and 2.72
Efficiency of MK peak 3544k10 936859*34080
Repeatability (%RSD of tr/tm) 0.23% 0.53%

4.4 CONCLUSIONS
The aim of this work was to develop the capillary electrophoresis method
for the separation of the related impurities in montelukast sodium. The completed
study has not been achieved at this point as the available instrumentation did not
allow sufficient detection sensitivity of the impurity at the elevated levels as in a
fresh stock of montelukast. However, even at the present stage of developing the
method, CE has showed good potential and many advantages over HPLC method
for the determination of montelukast sodium. The advantages of the CE method
for the determination of montelukast sodium to date are:
1. The full analysis time is less than 9 min, which is significantly less than
the 35 min of HPLC method [16];
2. A high efficiency of the montelukast sodium peak over 900000
theoretical plates was recorded with the achieved method;
3. The impurities were not identified but their quantities were in
accordance with HPLC results obtained with the method [I 61;
4. Further experiments are required to improve the sensitivity of the
method and to identify the peaks of the impurities. The employment of the mass
spectral detection system could possibly achieve these goals.

4.5 REFERENCES
1. D.F. Schoors, M.D. Smet, T. Reiss, D. Margolskee, H. Cheng, P. Larson, R.
Amin, G. Somers, Br. J. Clin. Pharmacol. 40 (1995) 277.
2. M. LaBelle, M. Belley, Y. Gareau, J.Y. Gauthier, D. Guay, R. Gordon, S.G.
Grossman, T.R. Jones, Y. Leblanc, M. McAuliffe, C.S. MaFarlane, P. Masson,
K.M. Metters, N. Ouimet, D.H. Patrick, H. Piechuta, C. Rochette, N. Sawyer,
Y.B. Xiang, C.B. Pickett, A.W. Ford-Hutchinson, R.J. Zamboni, R.N. Young,
Biogr. Med. Chem. Lett. 5 (1995) 283.
3. T.R. Jones, M. LaBelle, M. Belly, E. Champion, L. Charrette, A.W. Ford-
Hutchinson, J.Y. Gauthier, A. Lord, P. Masson, M. McAuliffe, C.S. McFarlane,
K.M. Metters, C. Pickett, H. Piechuta, C. Rochette, I.W. Rodjer, N. Sawyer, R.N.
Young, R. Zamboni, W.M. Abraham, Can. J. Physiol. Pharmacol. 73 (1995) 191.
4. W.W. Busse, Clin. Exp. Allergy. 26 (1996) 868.
5. J.M. Drazen, E. Israel, P.M. O'Byrne, N. Engl. J. Med. 340 (1999) 197.
6. I. De Lepepeir, T.F Reiss, F. Rochette, Clin. Pharmacol. Ther. 61 (1997) 83.
7. T.F Reiss, P. Chewinsky. R.J Dockhorn, Arch. Intern. Med. 158 (1998) 1213.
8. S. Singo, J. Zhang,T.F. Reiss, Eur. Respir. J. 17 (2001) 220.
9. A.J. Leff, W.W. Busse, D. Pearlman, N. Engl. J. Med. 339 (1998) 147.
10. J.P. Kemp, R. J. Dockhorn, G.G. Shapiro, H.H. Nguyen, T.F. Reiss, B.C.
Seidenberg, B. Knorr, J. Pediatr. 133 (1998) 424.
11. R.D. Arnin, H. Cheng, J.D. Rogers, J.Pharm. Biomed. Anal. 13 (1995) 155.
12. L. Lui, H. Chang, J.J. Zhao, J.D. Rodgers, J. Pharm. Biomed. Anal. 15 (1 997)
631.
13. H. Ochiai, N. Uchiyama, T. Takano, K. Hara, T. Kamei, J. Chromatogr. B 713
(1998) 409.
14. S. Al-Rawithi, S. Al-Gazlan, W. Al-Ahrnadi, LA. Alshowaier, A. Yusuf, D.A.
Raines, J. Chromatogr. B 754 (2001) 527.
15. C.J. Kitchen, A.Q. Wang, D.G. Musson, A.Y. Yang, A.L. Fisher, J. Pharm.
Biomed. Anal. 3 1 (2003) 647.
16. T. Radhakrishna, A. Narasaraju, M. Ramahshna, A. Satyanarayana, J.
Pharm. Biomed. Anal. 31 (2003) 359.
17. T. Hoang, R. Farkas, C. Wells, S. McClintock, M. Maso, J. Chromatogr. A
968 (2002) 257.

18. R.T. Sane, A. Menezes, M. Mote, A. Moghe, G. Gundi, J. Planar. Chromatogr.
17 (2004) 75.
19. http://www.ku.edu/-pbasymp/html/abstract.html
20. I.D. Meras, A. Espinosa-Mansilla, D. Airado Rodriguez, J. Pharrn. Biomed.
Anal. 43 (2007) 1025.
21. P.G. Muijselaar, K. Otsuka, S. Terabe, J. Chromatogr. A 780 (1997) 41.
22. M. Gratzel and J.K. Thomas, in: E.L. Wehry (Ed.), Modern Fluorescence
Spectroscopy, Plenum Press, 1976.
23. Luminescence Applications in Biological, Chemical, and Hydrological
Sciences, ACS Symposium Series 3 83.
24. N. Kawasaki, M. Araki, T. Nakamura, S. Tanada, J. Colloid Interface Sci. 238
(2001) 215.
25. D. Heiger, High performance capillary electrophoresis, Agilent technologies
2000.
26. J. Gorse, A.T. Balchunas, D.F. Swaile, M.J. Sepaniak, J. High Resolut.
Chromatogr. Chromatogr. Comrnun. 1 1 (1 988) 554.
27. C. Vogt, J. Vogt, A. Becker, E. Rohde, J. Chromatogr. A 781 (1997) 391.

CHAPTER 5
SIMULTANEOUS SEPARATION OF ANTHRACYCLINES AND
TAXANES BY CAPILLARY ELECTROPHOERSIS

5.1 INTRODUCTION
Cancer causes 7 million deaths every year or 12.5% of deaths worldwide
[I]. There are over 200 different types of cancer, and each has a specific name,
treatment and chance of being cured [2]. When a cancer cell begins to grow it
multiplies out of control, taking over the organ. An intensive growth of cancer
cells leads to formation of a tumor. This tumor can cause serious health problems
by blocking internal ducts, or by pressing against other organs, preventing their
normal function.
Treatment consists of surgery (removal of affected tissue by an operation),
chemotherapy (treatment using drugs) or radiotherapy (using radiation) [2].
Chemotherapy may be given before surgery (neo-adjuvant therapy) to shrink a
tumour so that it is easier to remove fi-om the body, after surgery (adjuvant
therapy) to make sure that any cancerous cells left in the body after removal of a
tumour are killed (this makes it less likely that the cancer will come back) and in
advanced cancer to remove cancerous cells that have spread through the body, or
to slow the progress of the disease [3]. Most chemotherapy drugs work by
affecting the DNA in cancer cells. Alkylating drugs, such as cyclophospharnide,
stick to one of the DNA strands and prevent them dividing. Antimetabolites, such
as methotrexate, stop cells working by preventing them making and repairing
DNA. Vinca alkaloids, such as vindesine, disrupt the mechanism that enables one
cell to split into two new cells. Cytotoxic antibiotics, such as doxorubicin, stick to
DNA causing it to become tangled and preventing the cell from dividing. Other
drugs include taxanes and platinum compounds like carboplatin. They have
various modes of action [3].

5.1.1 Anthracyclines
Doxorubicin (DOX), daunorubicin (DAU) and epirubicin (EPI) belong to
the anthracycline antibiotic family. They are isolated from a pigment-producing
Streptomyces [4]. Chemical structures are shown in Figure 5.1. A planar,
hydrophobic tetracycline ring of anthracyclines is linked to a daunosamine sugar
through a glucosidic linkage. Anthracyclines are among the most widely used
anticancer agents. In the past 40 years over 200 naturally occurring anthracyclines
have been identified and numerous derivatives have been synthesised in order to
minimise their side effects and multi-drug resistance [5, 61. The mechanism of
their action is uncertain and complex. Doxorubicin intercalates between adjacent
DNA base pairs, which interferes with DNA strand separation and inhibits DNA
topoisomerase 11, DNA and RNA polyrnerises. This also inhibits DNA replication
and transcription, which eventually induces DNA fragmentation [ 7 ] . A
cumulative dose-related cardiotoxicity is one of the most severe toxic effects of
anthracyclines [8]. Controversially, doxorubicin-mediated free radical formation
and lipid peroxidation, which produce direct membrane damage, are more directly
responsible for its cardiotoxic effect than antitumor effect [8-101. Epirubicin is a
4'-epimer of doxorubicin due to the difference of spatial orientation of the
hydroxyl group at the C-4' daunosamine ring. The latter does not change the
therapeutic efficacy of epirubicin but reduces its toxicity. DOX and EPI are
prescribed to patients with solid tumors such as breast, ovarian cancer, lung
cancer, lymph system cancer or stomach cancer [l 11. DAU is utilised in treatment
of leukaemia [12, 131.
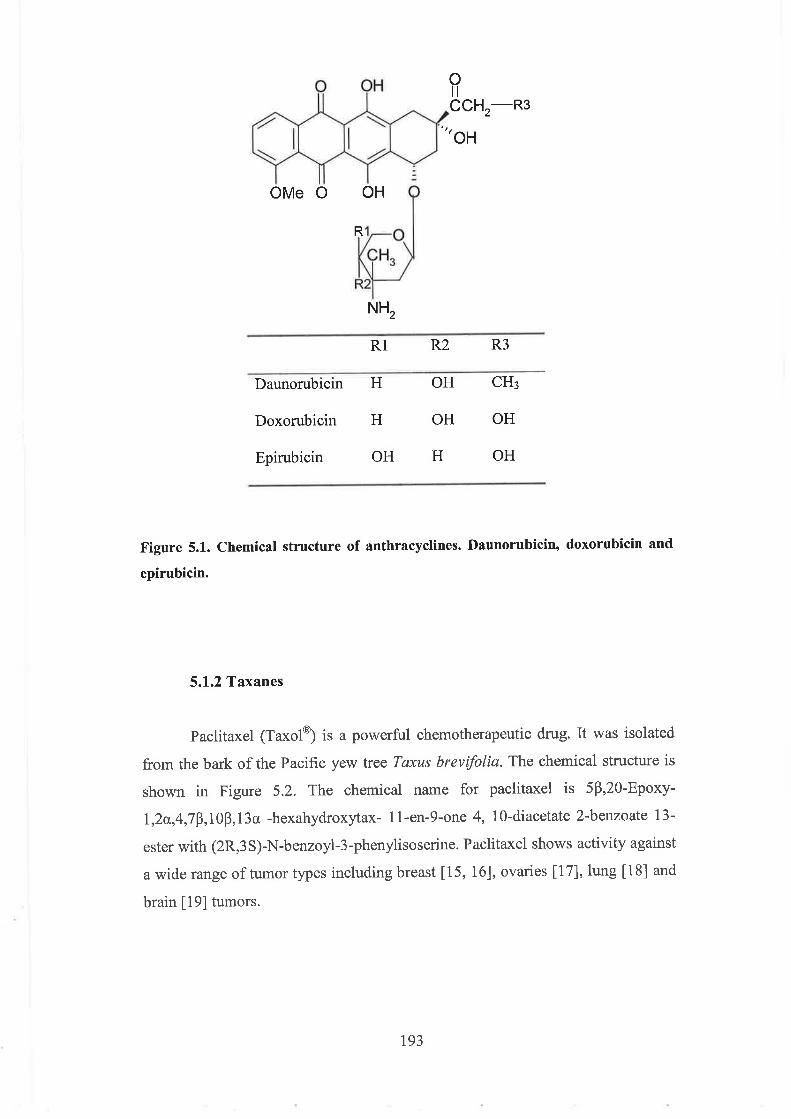
Daunorubicin H OH CH3
Doxorubicin H OH OH
Epirubicin OH H OH
Figure 5.1. Chemical structure of anthracyclines. Daunorubicin, doxorubicin and
epirubicin.
5.1.2 Taxanes
Paclitaxel (~axol') is a powerful chemotherapeutic drug. It was isolated
from the bark of the Pacific yew tree Taxus brevijiolia. The chemical structure is
shown in Figure 5.2. The chemical name for paclitaxel is 5P,20-Epoxy-
1,2a,4,7P, 1 OP, 13a -hexahydroxytax- 1 1 -en-9-one 4, 10-diacetate 2-benzoate 13-
ester with (2RY3S)-N-benzoyl-3-phenylisoserine. Paclitaxel shows activity against
a wide range of tumor types including breast [15, 161, ovaries [I 71, lung [18] and
brain [19] tumors.

Docetaxel (~axotere? is an analogue of paclitaxel and is obtained by
semisynthesis fkom 10-deacetyl-baccatin 111, which is extracted from the needles
of the European Yew Tree Taus baccata [20, 211. The chemical structure is
shown in Figure 5.2. The chemical name for docetaxel is (2R, 3s)-N-carboxy-3-
phenylisoserine, N-tert-butyl ester, 13-ester with 5P-20-epoxy- 1,2a,
4,7P,lOb,l3a-hexahydroxytax-l l -en-9-one 4-acetate 2-benzoate.
Figure 5.2. Chemical structures of paclitaxel and docetaxel [14].
The cytotoxic properties of taxanes are due to their ability to inhibit
microtubule depolymerisation and to promote tubulin assembly [22, 231. This
restrains the normal dynamic reorganization of the microtubule network, which is
essential for vital interphase and mitotic cellular functions. This leads to the
production of microtubule bundles without normal function and to the
stabilisation of microtubules, which results in the inhibition of mitosis in cells.

The binding of taxanes to microtubules does not alter the number of
protofilaments in the bound microtubules, a feature that differs from most spindle
poisons currently in clinical use.
Docetaxel was first given to cancer patients in 1990 and has proven to be
generally more active than paclitaxel [24-261. Paclitaxel is formulated using
Cremophor EL due to its poor solubility in water. This excipient is quite toxic and
responsible for strong hypersensitivity reactions [27, 281. Docetaxel is solubilised
in a less toxic polysorbate 80 formulation; nevertheless, the hypersensitivity
reactions in patients have occurred at high rates [29]. All patients should be
premedicated with oral corticosteroids such as dexamethasone in order to prevent
fluid retention. Myelosuppression, skin toxicity and peripheral neurotoxicity are
among other side effects [2 11.
Paclitaxel displays nonlinear pharmacokinetics [30]. The relationship
between dose and peak plasma concentration does not correspond to a linear
equation [3 11. The monitoring of plasma concentration should be of high priority
as to prevent side effects of overdosing.

5.1.3 Combination therapy of anthracyclines and taxanes
Combination therapy is a method of treating disease through the
simultaneous use of a variety of drugs to eliminate or control the biochemical
cause of the disease [32]. It is used in the treatment of conditions such as
tuberculosis, leprosy, cancer, malaria, and HIVIAIDS [33]. The first attempt to
combine two or more chemotherapeutic drugs was in the 1950s to manage
metastatic breast cancer [34]. Taxanes and anthracyclines have emerged as the
most active agents for treating breast cancer. The rationale for combining
docetaxel with an anthracycline includes high clinical activity of each individual
agent, lack of complete clinical cross resistance, and non-overlapping toxicity
profiles [34].
The combination therapy of anthracyclines and taxanes has shown
survival benefits. The disease-free survival after 4 or 5 years is in a range 65%-
75% and an overall survival rate of 77%-87 was reported in several studies [35-
3 81. An overall reduction of 7 1-8 1 % was found in patients with metastatic breast
cancer after doses of 50-75 mg/m2 docetaxel in combination with 40-50 mg/m2
doxorubicin administered every 3 weeks as first-line chemotherapy [39].
Paclitaxel4oxorubicin combination gave similar results [40].
Paclitaxel significantly increases the peak concentration of DOX when
injected first in combination therapy [41]. The distribution and elimination of
DOX is non-linear and dose-dependent [42]. It was found that paclitaxel followed
by DOX was more toxic than the opposite sequence [43] and could sometimes
involve a risk of congestive heart failure. The combination of docetaxel and
epirubicin could represent a safer alternative. Side effects like fluid retention and
cardiotoxicity were not seen in a clinical trial with 75 mg/m2 docetaxel plus 90
mg/m2 epirubicin, whereas neutrophenia was the dose-limiting toxicity [44]. The
administration of EPI does not affect the pharmacokinetics of paclitaxel even at
hgh concentrations (90 mg/m2 paclitaxel plus 200 mg/m2 EPI), while the level of
EPI was reduced as the paclitaxel dose increased [45]. The time interval at which
paclitaxel is injected has significant impact on the metabolism of EPI [46].

5.1.4 Methods for identification of anthracyclines and taxanes
It has to be noted that all the methods of identification reported in the
literature are developed either for anthracyclines or taxanes only, no single
method for simultaneous determination of the drugs of interest has been published
up to date. Ceruti et al. [46] investigated the pharmacokinetic interactions of
epirubicin and docetaxel in metastatic breast cancer. Over period of 24 hours after
treatment the levels of drugs in plasma can vary from 4500 ng m ~ ' to 20 ng mL'
'. Thus, very sensitive methods are required for the determination of target
compounds during therapy. The most sensitive methods have been reported using
mass spectral detection 0.5 ng r n ~ - ' 147-501 and immunoassay, 0.3 ng ml-' [51].
Both anthracyclines and taxanes have chromophores due to the extensive ring
structure and thus UV detection is used with chromatographic and capillary
electrophoretic methods for their determination [52-541. Anthracyclines contain
both electroactive and native fluorescent quinone moiety and thus electrochemical
[55,56], fluorescence and laser-induced fluorescence detection systems have been
used [7,57-741.
5.1.4.1 Sample preparation
In order to exclude interference from biofluids (protein binding), it is
necessary to carry out a sample pretreatment step prior to analysis. A liquid-liquid
phase extraction using tert.-butylmethyl ether was used for paclitaxel sample
manipulations in human plasma [53]. Methanol was used by Fahrny et al. [75] for
protein precipitation prior to sample preparation of DOX in combination with 5-
FU. The percentage recovery was found to be between 99.4 and 100.4%.
Acetonitrile deproteinisation of serum samples for the determination of different
anthracyclines is widely employed [61, 621. Hempel et al. [65] employed liquid-
liquid extraction with the mixture of sodium phosphate buffer at pH 7.4 and
chlorophorm (1 : 10) when analysing plasma with low concentration of DOX (up
to 50 pg m ~ - ' ) . The recovery was 72.8% accompanied by 7.86% RSD, which
means that a significant amount of drug was co-extracted with proteins.

A 92&2% extraction efficiency of docetaxel was achieved by loading
plasma onto the C2 SPE microcolumn followed by RP HPLC separation [76]. C8
SPE cartridges have also been used for sample pretreatment of anthracyclines and
taxanes analysis [47]. Clg and C2 cartridges were used in the analysis of EPI and
docetaxel, respectively, in a combinational therapy [46]. On-line column
switching from a clean-up column to the analytical column eliminates the need for
sample clean-up from plasma. Mader et al. [77] used C4 clean up column in
combination with C8 analytical column for the determination of paclitaxel in
human plasma. The mean overall recovery was 98.8%. Alvarez-Cedon et al. [78]
developed a single solvent deproteinising step (using methanol-ZnS04) with a
high recovery of doxorubicin (close to 100%) while Murdter et al. [79]
successfully used AgN03 for this purpose.
5.1.4.2 Chromatographic methods
The majority of analytical techniques for anthracyclines described in the
literature use reversed-phase HPLC in combination with fluorescence detector. If
the method is developed for a single anthracycline only minor adjustments are
needed to analyse related compounds and most methods employ one of the
anthracyclines as an internal standard in the analysis of others.
DOX and DAU (I.S.) were separated [7] on a C18 column using a
complicated gradient elution of ACN and 1-heptanesulfonic acid. With the
excitation and mission of fluorescence detection set at 480 nm and 550 nm,
respectively, LOD for DOX was 1 ng rn~- ' . The method is precise with inter-day
and intra-day RSD within 0.5% and 6.7%. Picomolar limits of detection for the
determination of DOX and its metabolites in biological fluids were reported by
Israel et al. [80] when using fluorescence as a detection techmque. The plasma
concentration ( ~ 3 8 ng m ~ ' ) of EPI and its metabolites was analysed by HPLC
with fluorescence detector [81]. The method has been shown to be applicable to
clinical plasma sample taken during a 96-h infusion of epirubicin in a patient with
multiple myeloma. Only small volumes (<200 pL) were required to be treated by
precipitation, the elution time of EPI was around 10 min. For human serum
containing 25 ng/ml of epirubicin, the inter- and intra-day variation was 4 0 % .
The metabolites epirubicinol and 7-deoxydoxorubicinolone, but not 7-
deoxydoxorubicinone, were also detected and measured.
Badea et al. [82] developed a method for RP HPLC separation of 7
anthracyclines including EPI, DOX and idarubicin (IDA) hydrochloride on Cs
column with the mobile phase containing SDS. The separation was performed in
10 min. Using UV detection the achieved LODs for DAU, DOX and EPI were 42,
110 and 128 ng m ~ - l , respectively. Paclitaxel in human plasma was separated on
C8 analytical column (after switching from a clean-up column) with ammonium
acetate buffer - ACN mobile phase using UV detection [74]. The overall analysis
time was rather long (30 min). LOD in plasma was 11 ng ml-l. The mean
accuracy of the method was 1.4%.
Docetaxel and epirubicin were analysed by two different methods in work
of Ceruti et al. [46], where the pharmacokinetic interactions of these drugs were
investigated in combinational therapy of metastatic breast cancer. In this work the
HPLC-UV method for the determination of docetaxel was developed by [39] and
employed ACN : water (60:40, vlv) mobile phase. The analysis of EPI required
75% phosphate buffer and 25% ACN. UV detection was at 229 nrn and 232 nm
for EPI and docetaxel, respectively. The methods had shown to be quite sensitive
with LODs of 20 ng m ~ - l for docetaxel and 30 ng m ~ - ' for epirubicin. The
procedure resulted in a very long total analysis time as it involved 6 min
separation time for docetaxel, 15 min for EPI and the time required for a separate
sample pretreatment of each drug prior to the analysis.
Microbore HPLC offers rapid column equilibration and enhanced
sensitivity and resolution, and applicability to HPLC-MS methodologies. Zao and
Dash [59] carried out their analysis on a 50x1-mrn Cl8 Luna column with a flow
rate of 0.1 mL min-' and a mobile phase of ACN-1% acetic acid (80:20).
Fluorescence detection (hEx = 505 nm, hEm = 550 nrn) achieved the detection
limits of 1 ng r n ~ ' , which are very similar to those on a normal column.

5.1.4.3 Capillary electrophoresis
Although a significant number of the routine analysis of anthracyclines
and taxanes are still performed by chromatographic techniques [7, 39, 47, 59, 77,
821, there have been numerous attempts to challenge the resolving power of
capillary electrophoresis in the separation of these compounds [54, 56, 6 1-63, 67,
83, 841. It has to be mentioned once again that all methods developed to date do
not allow simultaneous determination of anthracyclines and taxanes. Table 5.1
shows several of the most representative CE methods.
Both reported methods for the separation of taxanes [83, 841 used buffers
at alkaline pH and involved MEKC mechanism of separation, although a
significant amount of organic phase (ACN) 30-35% was required. The time of the
run, at which the paclitaxel and docetaxel could be separated were 18 and 12 min
[83, 841. The high concentration of SDS 100 mM in the first method was the
reason for a longer run time even though only two compounds were analysed.
Shao et. al. [84] achieved the separation of paclitaxel and 13 related taxanes in
only 12 min with 40 mM SDS in the separation buffer. A 10 mM urea was added
to the latter system but the authors suggested that it did not affect the separation
significantly.
Most of the CE methods for the determination of anthracyclines employed
free zone electrophoresis with 30% to 70% of organic additive, such as MeOH or
ACN [54, 61-63]. Hu and colleagues [56] used only high concentration phosphate
buffer at pH 7.8 for the determination of a single compound DAU. The
amperometric detection which was employed in this method was able to achieve
LOD of 0.8 pM in urine, while neither sample preparation nor preconcentration
were involved, apart from filtering. LIF was widely employed as a detection
technique [61-63, 671, the benefit of which was a very low LODs (Table 5.1).
Gavenda et al. [54] used reversed polarity of separation at low pH 2.5 for DOX
and DAU. Employing a sweeping technique to preconcentrate the analytes and a
traditional UV detector (234 nm) it was possible to quantify 10 nM of analytes in
plasma. A single cell analysis of DOX, doxorubicinol (DOXol) and other
metabolites was investigated by Andersson et al. [67] using MEKC mode of
separation and LIF detector. A five min separation time and LOD of 61h13 zmol
were the achievements of the method.

MEKC was also employed to reveal differences in intracellular
metabolism between liposomal and free doxorubicin treatment of human
leukaemia cells [74]. Liposome-encapsulated form is where anthracycline is in a
small vesicle composed of 2: 1 molar ratio of distearoyl phosphatidylcholine and
cholesterol [85]. It was reported to be less cardiotoxic then corresponding
anthracycline, DAU or DOX [86]. An organic modified CZE method was
developed for the determination of free and liposome-associated DAU and
daunorubicinol (DAUol) in plasma [7 11.
A pressurised capillary electrochromatography method for the
determination of DOX was developed by Nagaraj and Kames [87]. A 100 pm i.d.
hsed silica capillary was packed with 3 pm C-18 particles and separation was
carried out at 25 kV using 70% ACN : 30% phosphate (10 mM, pH 4.8) as mobile
phase. Doxorubicin was derivatised in order to use visible diode laser induced
fluorescence. The obtained results showed a very attractive LOD (1.7 ng m ~ l ) .
5.1.5 Observations
The analysis of anthracyclines and taxanes is of a high importance for
cancer therapy, as evidenced by the numerous developed analytical methods for
the determination of these compounds. Neither chromatographic nor capillary
electrophoretic methods developed to date offer the possibility of simultaneous
analysis of anthracyclines and taxanes, which are administered together in
combinational therapy of metastatic breast cancer. The literature review shows
that the methods employing CE can offer low LOD, which are similar to those in
HPLC, and shorter times of analysis.

Table 5.1. Some representative methods for CE separation of anthracyclines and taxanes.
I
Analytes Time, Buffer Additives Capillary Voltage Injection Tempe Detec Sample LOD Ref. min &pH length rature tor prep. /
Pact itaxel, Docetaxel
Paditaxel & 13 taxanes
DOX, DAU
x ID preconc.
18 25mM 100 mM 67/60 418 0.5 psi Not UV Yeslyes 20 ng m ~ ' [83] Tris- SDS, cm x Vlcm 12 sec reported (10 times) Plasma, phosph 35% 50 pm 50 mg m ~ ' pH 8.5 ACN * urine
12 25 mM 40 mM 7215 0 25 kV 5 in. 30 "C UV Not Not [a41 Trizrna SDS, cm x Hg reported reported
PH 9 30% 50 pm 1 sec ACN, 10 mM urea
14 lOmM 40% 75/45 -30 kV 30 kV 25°C UV Yestno 10 nM [541 phosph MeOH cm x 3-5 min plasma pH 2.5 50 pm **
D m EPI, 1
DAU
8 100 mM 70% 70165 20 kV 12 kV Not LIF Yeslyes 35,70,50 [61] phosph ACN cm x 5 sec reported Pg InL -' pH 4.2 75 pm

Table 5.1. Continue
"Extended light pass was employed, ** Sweeping was employed, *** Single cell analysis.
Analytes Time, Buffer Additives Capillary Voltage Injection Tempe Detec Sample LOD Ref.
1
min &pH length rature tor prep. / x ID preconc.
DOX, f)OXol, DAU, m A , u3.401
metabolites
DAU
-
5 100 mM 60 pM 40(ef) cm 25 kV 10 kV Not LIF Yeslyes <2 pg L - ~ 1631 phosph spennin, x50 pm 7 sec reported (2times) (LOQ)
PH 5 70% ACN
pH 9.3 *+*
6 150 rnM non 35cm 8kV 8kV Not Ampe Nolno 0.8 [561 phosph x 25 pm 10 sec reported romet pmol L-' pH 7.8 rY urine
DOX DAU, IDA
DOX, DOXol&
10 1OOmM 30% 57150cm 15kV 3.45kPa 25°C LIF Yeslno <0.9 [621 borate ACN x 75 pn 5-15 sec ng m ~ - ' pH 9.5 (LOQ)
5 10 mM 10 mM 35 cm 14.12 3.53 kV Not LIF Yeslno 61*13 1671 borate SDS x50pm kV 5 sec reported m o l

5.1.6 Aim of this work
The above review has shown that anthracyclines and taxanes have been
prescribed to cancer patients in combination and such therapy has proven to
increase survival rates. Only one anthracycline and one compound of the taxane
type are administered at the same time, Although these drugs are taken by patients
simultaneously, their control and determination in biological fluids is still
performed separately. Hence, it is worthwhile for high sample throughput to
examine the feasibility of analysing these compounds by a single method.
Anthracyclines and taxanes are quite different compounds by their nature, which
makes the development of a method for their simultaneous determination very
challenging.
The bdamental aim of this work was to investigate the capability of the
capillary electrophoretic technique for simultaneous determination of taxanes and
anthracyclines.

5.2 EXPERIMENTAL
5.2.1 CE instrumentation
CE separations were performed using the system described in Chapter 2.
The fused silica capillaries (Composite Metal Services ltd., The Chase, Hallow,
Worcs. WR2 6LD) were 56 cm in length (48 cm to the detector) with an internal
diameter of 50 p.m.
5.2.2 Reagents
All analyte compounds investigated in the separations had purity of at
least 99% and were used without further purification. Daunorubicin, doxorubicin
hydrochloride, docetaxel, paclitaxel, equilin, naproxane, 2, 4-
dichlorophenoxyacetic acid, Tris ([hydroxymethyl] aminomethane hydrochloride
and Trizma base), NaH2P04, HC1, NaOH, sodium dodecyl sulphate, human
plasma and bovine plasma were purchased from Sigma-Aldrich, Dublin, Ireland.
n-octane and n-heptane were from BDH Laboratory Supplies, Poole, England. n-
butyl alcohol was from May & Baker ltd., Dagenham, England. Methanol (HPLC
grade), acetonitrile (HPLC grade) and ethyl acetate were from Lab-Scan, Dublin
Ireland. Boric acid and phosphoric acid were from Riedel-de Haen, Seelze,
Germany. Buffers were prepared using distilled water and adjusted using 1 M and
0.1 M NaOH, 0.1 M HC1 or diluted phosphoric acid.
5.2.3 Standards
Stock solutions of docetaxel 2.5 mg m ~ - ' in methanol and paclitaxel 2.5
mg mL'l in methanol were kept in a freezer, while 2 mg mL-' daunorubicin
hydrochloride in methanol and 2 mg mL-I doxorubicin hydrochloride in 0.9%
solution of NaCl were stored in a refrigerator. Stocks of 2 mg m ~ - ' equilinl, 3.46
mg mL-' 2, 4-dichlorophenoxyacetic acid and 2 mg mL-' naproxen were made up
in methanol and stored in a refrigerator.

5.2.4 Plasma
5.2.4.1 Direct plasma injection
Distilled water was added to the dry human plasma in the amount
suggested by the manufacturer. Obtained plasma was diluted with the separation
buffer in ratios 20: 80, 50 : 50, 80 :20 and 100 : 0 (vlv) to obtain 0.5 mL solution
in total. Each of these samples was spiked with 0.04 mL DAU, 0.04 mL docetaxel
and 0.003 mL naproxen (IS) from their stocks.
5.2.4.2 Plasma pretreatment
Distilled water was added to the dry bovine plasma in the amount
suggested by the manufacturer. The procedure for plasma pre-treatment was taken
from the work of Polson et al. [88] with some modifications. A 0.2 mL aliquot of
plasma was mixed with 0.005 mL DAU (45.5 pg m ~ - ' ) , 0.005 mL docetaxel(56.8
pg m ~ - ' ) and 0.01 mL equilin (IS) 2 rng m~-'(90.9 pg mml). This mixture was
vortexed for 10 sec. Acetonitrile was added in amount of 0.6 mL; this was
vortexed for 20 sec and then left for 20 min ensuring protection from light. The
mixture was placed in a centrifuge at 3000 rpm for 10 min. A 0.7 mL of
supernatant was transferred into an eppendorf and evaporated under nitrogen until
dryness. The residue was reconstituted in 0.05 mL of separation buffer of choice
before the analysis. In order to inject such a small quantity of sample, small
eppendorfs (with lids cut off) were inserted into the standard CE vials. The offset
of the capillary was set to 13 mm (3 rnrn in all other separations).
5.2.5 Procedure
All buffers were filtered through a 0.2 pm filter before use. Taxanes and
anthracyclines were detected at 230 nm. Separations were carried out at 30 kV
electrophoretic voltage and temperature 20°C, unless otherwise stated. Injections

were hydrodynamic 50 mbar for 6 or 12 see for CZE and MEKC experiments, 50
mbar for 2 sec for octane MEEKC separations atid -50 mbar for 2 see for high-
speed MEEKC, unless otherwise stated. CZE, MEKC and octane MEEKC
separations included conditioning between runs with 2 rnin MeOH, foIlowed by
0.1 M NaOH for 3 min and run buffer for 3 min. Conditioning for high-speed
MEEKC included 1 min with 0.1 M NaOH, followed by MeOH for I min and run
buffer for 1 min. Samples were diluted in the run buffer, unless otherwise stated.
A11 separations were repeated at least three times.

5.3 RESULTS AND DISCUSSION
5.3.1 Separation of anthracyclines and taxanes by CZE
For the purpose of this study doxorubicin and docetaxel were used as test
analytes.
As it can be seen in Table 5.1 a lot of the methods developed for the
separation of anthracyclines have employed organically modified free zone
electrophoresis. The separation buffers have been employed in the low pH (below
5) and high pH (8-9) range in order to ensure full or partial ionisation of analytes.
The presence of organic solvent in the separation buffer was necessary in order to
increase solubility of hydrophobic docetaxel in the aqueous electrolyte. It was
decided to use this strategy for the simultaneous separation of anthracycline and
taxane. The addition of two organic solvents methanol and acetonitrile at different
concentrations to a 20 mM borate buffer pH 9 was investigated. The
electropherograms of the obtained separations are presented in Figure 5.3 and 5.4.
Methanol in the concentration 30% or 70% didn't have enough resolving power
for the separation of two analytes, they coeluted with the EOF.
Figure 5.3. Electropherograms of CZE separation of docetaxel and DOX. Separation cond.: 20 mM borate buffer pH 9, A - with 30% MeOH, B - with 70% MeOH, 30 kV, 20°C, hydrod. inj. 2 sec., detec. at 230 urn, capillary 56cm (48cm), 50 prn i.d. Sample: DOX 54.1 pg m ~ " and docetaxel67.6 pg r n ~ ~ ' in the run buffer.

Resolution of more than 1.5 was obtained when acetonitrile was added to
the run buffer. It can be seen that the increased amount of organic solvent resulted
in an decrease in EOF and that is why the migration times of the analytes with
70% MeOH (Figure 5.3 B) or ACN (Figure 5.4 B, C) in the buffer were longer. A
higher amount of acetonitrile added to the separation buffer was beneficial for the
separation as the efficiency of both analyte peaks increased. The data is shown in
Table 5.2. At the conditions of the separation (pH 9) doxorubicin possessed some
negative charge as the phenolic hydroxyl group was deprotonated. This was the
reason why the molecules of DOX showed negative mobility and migrated after
EOF and docetaxel.
2 4 6 8 Mgratiufi h e , min
Figure 5.4. Electropherograms of CZE separation of docetaxel and DOX. Separation cond.: 20 mM borate buffer pH 9, A - with 30% ACN, B, C - with 70% ACN, 30 kV, 20°C, hydrod. inj. 6 sec., detec. at 230 nm, capillary 56cm (48cm), 50 pm i.d. Sample: DOX 54.1 pg mL-' and docetaxel 67.6 pg r n ~ - ' in the run buffer (A and B) / ACN (C).

The electropherogram in Figure 5.4 C and data in Table 5.2 showed that
the composition of the injected sample had an impact on the separation. The
efficiency of docetaxel injected in 100% ACN was significantly less than that in
the run buffer. On the other hand, the efficiency of doxorubicin was higher in the
solvent. The repeatability of the migration time was good as the %RSD was less
than 3% (Table 5.2).
Table 5.2. Effect of the ACN concentration and the composition of injection of the parameters of separation. n = 3
Conditions Docetaxel Doxorubicin
N OhRSD (t,) N %RSD (t,)
30% ACN,
sample in
the run buffer
70% ACN,
sample in 18838h1732 2.83
the run buffer
70% ACN,
sample in 3827&288 0.76 39734567 2.04 ACN

5.3.2 Separation of anthracyclines and taxanes by MEKC
The methods reported in the literature for determination of taxanes
employed micellar electrokinetic chromatography separations [83, 841. Taxanes
tend to have similar, large partition coefficients in the micelle phase due to their
small aqueous solubility [84]. Addition of an organic solvent to the separation
buffer increased the solubility of these compounds in the electrolyte. A
significantly higher concentration of organic solvent is reported to induce changes
in size and structure of the micelles [89-901. Vindevogel and Sandra [91] deduced
that SDS micelles might be stable at high concentrations of ACN in the aqueous
buffer due to the absence of the precipitation of SDS monomers, which are
insoluble in ACN. Shao and Locke [84] concluded that it is still not clear in
precisely what form surfactant molecules exist in the presence of organic solvent,
but separations achieved in these systems are not possible in the absence of the
organic additive.
One of the methods for the separation of doxorubicin and its metabolites
by Anderson et al. [67] employed MEKC with 10 mM SDS, but no organic phase
was required to achieve this separation. The methods for the separation of taxanes
[82, 831 and anthracyclines [67] used buffers at alkaline pH. Since MEKC was
previously reported to be successful in the independent determinations of taxanes
and anthracyclines, it was decided it would be worthwhile to test its resolving
power for the simultaneous separation of taxane and anthracycline.
For the purpose of this study doxorubicin and docetaxel were used as test
analytes. An alkaline buffer 25 mM Tris-phosphate at pH 9 was employed in the
MEKC separation as it created a strong EOF for the negatively charged micelles
to be swept towards the detector. As a zwitterionic buffer Tris generated minimal
current. The buffer contained 70% MeOH.

5.3.2.1 The effect of SDS on the separation of analytes
Figure 5.5 shows the effect of different concentration of SDS in the run
buffer. Analytes were diluted in the run buffer. The concentration of SDS was
varied from 10 mM to 100 mM. The migration times of analytes were noted to
increase. In this separation doxorubicin migrated along the capillary first and
before EOF, followed by docetaxel. The migration of the analytes in such a
manner suggests that it did not interact with micelles in the run buffer and also
possessed some positive charge as its mobility was higher than that of EOF. The
mobility of docetaxel was lower at high content of SDS as the hydrophobic
interaction with micelles was enhanced. The molecules of docetaxel were dragged
by micelles to the oposite direction of EOF. Docetaxel and doxorubicin were
resolved at the concentration of SDS above 50 mM. At this concentration the peak
of docetaxel migrated extremely close to the EOF. A 100 mM SDS resulted in
sufficient resolution of both peaks with each other and the EOF.

EOF 1
EOF
R
Figure 5.5. Electropherograms of MEKC separation of docetaxel and DOX Separation cond.: 25 mM Tris-phosphate buffer pH 9,70% MeOH, A - 10% SDS, B - 50% SDS, C - 100% SDS, 30 kV, 20°C, hydrod. inj. 12 sec., detec. at 230 nm, capillary 56cm (48cm), 50 ym i.d. Sample: DOX 0.121 mg m ~ - ' and docetaxel0.109 mg in the run buffer.
DOX
\ 1
+- EOF
d
s - I I..-.

5.3.2.2 Effect of sample matrix
Unacceptably poor resolution of docetaxel and doxorubicin was found
when using the optimum SDS concentration (100 mM) if the sample dissolved in
methanol was injected, as shown in Figure 5.6. The explanation for this is a mass
transfer factor [93]. The molecules of analyte are transferred into the micelles
from the injection solution at a slow rate, which is not the case for the injection of
already micellized solutions. However, this was only relative to the molecules of
docetaxel. From a previous experiment it was found that doxorubicin did not
interact with the micelle. The injection of the sample in methanol confirmed this
as the peak of DOX was very sharp compared to docetaxel, which means the peak
shape was independent of the injection media.
Figure 5.6. Electropherograms of MEKC separation of docetaxel and DOX. Separation cond.: 25 mM Tris-phosphate buffer pH 9, 70% MeOH, 100% SDS, other separation cond. as in Figure 5.5. Sample: DOX 0.128 mg I&-' and docetaxel 0.1 13 mg m ~ - ' in MeOH.

5.3.2.3 Effect of the pH
The effect of the pH of the run buffer on the mobility of the analyte's
peaks is shown in Figure 5.7. The increase of pH from 7.5 to 8.6 resulted in a
decrease in the mobility of DOX; at the pH 8.6 - 9.3 the mobility was almost
constant with a slight minimum at pH 9.0. At the pH below its pKa (8.34) [94],
doxorubicin was only partially deprotonated and had high effective mobility.
When the pH was in the region of the pKa value, the molecules of DOX had high
negative charge and their mobility toward cathode was slower. The effective
mobility of docetaxel was not significantly affected by the variation of the pH of
the separation buffer. This is because it was migrating with the micelles along the
capillary. The mobility of the micelles was affected by the pH through the change
in EOF, which was higher at high pH.
Figure 5.7. Effect of the pH on the effective mobilities of analytes. Separation cond.: 25 rnM Tris-phosphate buffer, 70% MeOH, 100% SDS, other conditions as in Figure 5.5. - DOX, docetaxel.

5.3.3 Separation of anthracyclines and taxanes by MEEKC
Microemulsion electrokinetic chromatography is known to be a powerful
technique in the separation of neutral and charged solutes. The principles of
MEEKC have been discussed previously in Chapter 1.4.4 MEEKC allows the
separation in a similar fashion as MEKC with the advantage of easier penetration
and partitioning of analytes into microemiltion droplets. This is because the
structure of the microemulsion is less rigid than that of a micelle [95]. While
MEEKC has been known to have a great separation capability for highly
hydrophobic compounds [96-1001, it also was demonstrated to be a reliable
separation tool for hydrophilic analytes [101, 1021. According to the above
mentioned reports, MEEKC could potentially be suitable for the separation of a
mixture of highly hydrophobic taxanes and hydrophilic anthracyclines.
5.3.3.1 Effect of separation voltage
In this study a typical composition required for the formation of oil
droplets 0.81% w/w octane, 3.31% wlw SDS and 6.61% wlw butan-1-01 [103-
1051 was employed in a combination with a 20 mM phosphate buffer pH 2.5 to
suppress EOF. At these conditions both anthracyclines and taxanes posses some
positive charges due to the presence of protonated amino groups. At low pH it is
necessary to reverse the voltage to attract the negatively charged droplets towards
the detector [97]. Figure 5.8 shows the effect of applied voltage on the separation
of docetaxel and doxorubicin. The velocities of analytes were found to increase
when the voltage was increased from -15 kV to -30 kV resulting in shorter
migration times and better resolution. It has to be noted that the acceptable
resolution wasn't achieved even with the maximum voltage. Voltage increase was
found to induce the enhanced current in the capillary, which was -38 uA, -85 uA
and -125 uA for -15 kV, -25 kV and -30 kV applied voltage, respectively. The
correlation of voltage and current (Ohm's plot) was plotted for the employed
buffer; the acceptable correlation coefficient R~ = 0.9994 was found for the
applied voltage of -15 kV. It has to be noted that even at highest applied voltage
the resolution of analytes was not satisfactory.

Figure 5.8. Electropherograms of MEEKC separation of docetaxel and DOX at different applied voltage. Separation cond.: 20 mM phosphate buffer pH 2.5, 0.81% wlw octane, 3.31% wlw SDS and 6.61% wlw butan-1-01, A -15 kV, B - 25 kV, C -30 kV, 20°C, hydrod. inj. 12 sec,, detec. at 230 nm, capillary 56cm (48cm), 50 pm i.d. Sample: DOX 0.108 mg r n ~ ' and docetaxel0.122 mg md'l in the run buffer.

5.3.3.2 Effect of oils on the analyte's separation
Highly hydrophobic organic compounds, such as long-chain alkanes, are
generally used as the oil phase in microemulsion. The influence of the oil type on
the separation of docetaxel and DOX was examined. The separation of analytes
by octane and heptane were compared (data not presented). It was found that the
selectivity was not affected by the carbon chain length of the oil. These results
were in agreement with previously published works on MEEKC, where the nature
of oil phase had little significance in the separation mechanism [loll . Octane was
chosen to be the core phase for future analysis due to the greater stability of the
emulsion, as suggested by Fu et al. [106]. This is due to the number of carbon
atoms in the surfactant (SDS) being equal the number of carbon atoms in the co-
surfactant (octane) plus the number of carbon atoms in the oil (butanol).
The effect of the core phase on the separation of analytes was investigated
in the narrow range 0.41% to 1.21% of octane in microemulsion. It has been
previously reported [I071 that the stability of the oil droplets suffers at higher
concentration of core phase as surfactant is not capable of maintaining core-phase
dispersion in the aqueous buffer. The parameters of the separations are shown in
Table 5.3. No significant changes in migration times, efficiency and resolution
could be obtained fiom the data. The optimum efficiencies of analyte peaks were
observed with 1.21% octane in the microemulsion, but the deviations fiom the
mean value were rather high (27% and 12% RSD).

Table 5.3. Effect of the concentration of octane on the parameters of the separation. Separation cond.: 20 mM phosphate buffer pH 2.5, 3.31% w/w SDS, 6.61% wlw butan-l-ol,25% MeOH, -20 kV, other conditions as in Figure 5.8. n = 3
YO Doxorubicin Docetaxel R
N octane t , t , N
(min) (min)
0.41% 13.77 41111*1619 14.48 45592k 1294 2.79
1.21% 13.61 55112h15421 14.3 1 66707h8433 3.3 1
* Mean from three determinations with %RSD < 1%.
5.3.3.3 Effect of organic solvent on the analyte's separation
Usually, the partitioning of analyte molecules between oil droplets and
aqueous phase can be easily affected by the addition of a water-miscible more
polar modifier. Organic solvent is more beneficial for the separation of
hydrophobic compounds [I 021. The effects of methanol and acetonitrile on the
.separation of docetaxel and DOX were investigated in this study. Figure 5.9
shows the electropherograms of the separation of analytes with the addition of
either methanol or ACN to the microemulsion buffer in a range 5%-25%.

DOX
'Figure 5.9. Electropherograms of MEEKC separation of docetaxel and DOX at different concentration of MeOEL Separation cond: A - 15% MeOWACN, B - 20% MeOWACN, C- 25% MeOHlACN, -15 kV, other conditions as in F'igure 5.8.

The results suggest that docetaxel and DOX were better separated when
the organic modifier was added to the buffer. The presence of organic solvent
decreases the degree of interaction between hydrophobic analyte and the oil
droplet. The increased amount of methanol in the emulsion led to a higher
resolution of analytes, although the broadening of peak tails was observed at
higher concentrations of methanol. This is due to the increased solubility of
analytes in the electrolyte solution and difference in the mobility of the oil
droplets and analytes. Acetonitrile was found to be a better modifier for the target
separation as resolution of docetaxel and doxorubicin was achieved at only 15%
of ACN in the buffer. The increase in the methanol content caused the velocities
of analytes to be significantly lower. This phenomenon suggests that methanol
dramatically decreased the partitioning of analytes into the oil droplets. This
delayed the migration of positively charged molecules of docetaxel and
doxorubicin towards the anode. The presence of organic solvent can also cause
changes in the degree of ionisation of analytes, thus, affecting their mobility
[108]. This effect was to a slightly less degree when acetonitrile was added to the
microemulsion buffer. The change in the selectivity was observed with the
presence of methanol: doxorubicin migrated first, followed by docetaxel. The
selectivity of the separation with ACN was identical to the one in the Figure 5.8,
were no organic modifier was employed.

5.3.3.4 Effect of SDS concentration on the analyte's separation
The oil droplets in microemulsion are stabilised by coating with the ions
of surfactant such as SDS. The effect of SDS content on the separation of
docetaxel and DOX was investigated. The concentration of SDS was examined in
a range 2.71% - 3.61% wlw. The results of the obtained separations are reported
in Table 5.4. The results indicated that the migration velocities of analytes were
affected only slightly by the change in SDS concentration. Even in this case it can
be noted that docetaxel was affected to a higher degree than DOX. The general
trend observed was a reduction in migration time with increased concentration of
SDS in the buffer. It points to the fact that docetaxel had a stronger interaction
with the oil droplets. At higher concentration of surfactant the number of ions of
SDS associated with each droplet increases, thus increasing the charge of the
droplets [109]. This can suggest that the nature of the interaction of analytes,
especially docetaxel, was based not solely on partitioning but could include ion-
pairing process as docetaxel held some positive charge due to the amine group in
its structure. The resolution of analytes decreased from 2.76 to 2.08 for the 2.71%
and 3.61% of SDS, respectively. The efficiencies of both analytes were enhanced
with higher amount of surfactant and were 53438 and 55288 theoretical plates for
DOX and docetaxel, respectively.
Table 5.4. Effect of the concentration of SDS on the parameters of the separation. Separation cond.: 20 rnM phosphate buffer pH 2.5, 0.81% w/w octane, 6.61% w/w butan-1-ol,25% MeOH, -20 kV, other conditions as in Figure 5.8. n = 3
YO Doxorubicin Docetaxel R
SDS r
N I
t m t m N
(min) (min)
2.71% 12.60 26781*2223 13.34 39801k6469 2.76
* Mean from three determinations with %RSD < 1 %.

5.3.3.5 Effect of co-surfactant on analyte's separation
In a study by Marshal et al. [I101 it was noted that co-surfactant is the
most influential constituent on the separation selectivity of microemulsion. Co-
surfactant is usually added to the microemulsion buffer to reduce levels of SDS
required for the formation of droplets. The influence of the concentration of co-
surfactant 1-butanol was studied in order to determine its effect on the separation
of docetaxel and doxorubicin. The examined concentration range of 1-butanol
was 5.61% - 7.61%. The parameters of the acquired electropherograms are
presented in Table 5.5. The increase in concentration of 1-butanol was
accompanied by reduced velocities of analytes, which resulted in longer migration
times. When the content of co-surfactant in the buffer is at higher rates, the
solution viscosity changes and the microemulsion droplets increase in size [I 111.
The latter is thereby reducing the ability of droplets to move faster in the direction
of the anode, which obviously affects the migration of analytes in the capillary if
they interact with the micelles. The resolution of analytes was quite consistent and
was approximately 2.6 with 6.1 1 % - 7.1 1 % of 1 -butan01 in the buffer, but reduced
to 1.89 at 7.61% I-butanol. The efficiency of analyte peaks was found to be the
best when the concentration of 1 -butan01 was 7.1 1 %.
Table 5.5. Effect of the concentration of 1-butanol on the parameters of the separation. Separation cond.: 20 mM phosphate buffer pH 2.5, 0.81% w/w octane, 3.31% w/w SDS, 25% MeOH, -20 kV, other conditions as in Figure 5.8. n = 3
YO Doxorubicin Docetaxel R
butanol t,* N t I,l N
(min) (min)
5.61% 12.35 44058*3331 12.91 48047*4482 2.55
* Mean from three determinations with %RSD < 1.5%.

5.3.3.6 The effect of temperature on the analyte's separation
The hydrophobic properties of analytes and thus their partitioning with the
oil droplets are influenced by the temperature, at which the separation is
performed in MEEKC. It was stated by Gong et al. [I121 that the optimised
temperature is a combination of dynamic and thermodynamic processes in the
system. In tenns of thermodynamics the increased temperature induces a decrease
in the partitioning coefficient of analytes between the oil phase and the water
phase. Regarding dynamics, the elevated temperature can speed up the
transferring velocity between the oil and the water phase.
The effect of temperature on the separation of docetaxel and doxorubicin
was studied at 20°C, 35°C and 50°C. The data obtained is shown in Figure 5.10. It
was found that increasing the temperature from 20°C to 50°C caused the
migration times of analytes to reduce from 13.28 min and 13.86 min to 9.46 and
9.58 min for doxorubicin and docetaxel, respectively. The migration time
decreased when the temperature increased due to the partitioning of the insoluble
compounds into the oil droplets being less as their solubility increase [I 131. The
EOF is higher at the elevated temperature as the viscosity of the buffer is lower;
therefore, the migration time is reduced [114]. In the present work docetaxel and
less hydrophobic doxorubicin were affected in a similar way by the elevated
temperature. It can be seen in Figure 5.10. (A) the efficiency of both peaks have
decreased dramatically when the temperature was raised. The resolution (Figure
5.10(B)) of docetaxel and doxorubicin was below 1 at 50°C. For this reason it was
decided to perform hrther experiments at 20°C, disregarding the advantage of
shorter analysis time at elevated temperature.

35 Temperature, 'C
2 0 3 5 5 0
Temperature, 'C
Figure 5.10. Effect of the temperature on the efficiency and resolution of analytes. Separation cond.: 20 rnM phosphate buffer pH 2.5, 3.31% wlw SDS, 6.61% wlw butan-1-01, 25% MeOH, -20 kV, other conditions as in Figure 5.8. A - efficiency of
- doxorubicin and - docetaxel, B - resolution. n = 3

5.3.3.7 The optimum composition of microemulsion
All optimised parameters, such as the content of octane, 1-butanol and
SDS, were combined in the final composition. This separation of docetaxel and
doxorubicin was then compared to the separation with the original
microemulsion. The parameters of both separations are shown in Table 5.6. The
migration times of analytes with the optimised microemulsion were enhanced.
The resolution was lower than at the separation with the original composition of
microemulsion, but still acceptable. The efficiencies of analytes were within the
error. Thus, both microemulsion compositions would be suitable for further
application.
Table 5.6. Parameters of the separation with original composition of microemulsion and optimised composition. Separation cond.: 20 mM phosphate buffer pH 2.5,25% MeOH, -20 kV, other conditions as in Figure 5.8. n = 3
Ni Microemulsion Doxorubicin Docetaxel R
N composition t m t m N
(min) (min)
1 0.81% octane,
6.61% butanol, 13.70 66701h1962 14.37 68791h6742 3.21
3.31% SDS
2 1.21 % octane,
7.1 1% butanol, 14.41 65864h2692 14.97 63974+3708 2.62
3.61% SDS
* Mean fkom three determinations with %RSD < 1 %.

5.3.4 Separation of anthracyclines and taxanes by high-speed
MEEKC
There are several ways to reduce the analysis times in CE in order to
increase sample throughput in many industrial environments. These approaches
include the employment of short capillaries, high voltages, high temperatures,
simultaneous application of pressure and voltage, and "short end" injection [ 1031.
The common composition of the microemulsion 0.81% wlw octane,
3.31% wlw SDS and 6.61% wlw butan-1-01 [103-1051 does not allow fast
separation due to the high amounts of SDS employed. The amount of added
surfactant depends on the surface tension of the oil. Ethyl acetate (EA) and di-n-
butyl tartrate are the oils that have lower surface tension and have previously been
used [115, 1 161. These oils require only 0.6% SDS to form the oil droplets [97].
In this study a microemulsion consisting of 0.5% w/w ethyl acetate, 1.2%
W/W butan-1-01, 0.6% SDS, was employed in a combination with a 20 mM
phosphate buffer pH 2.5 [97]. The injection of the sample was performed with -50
mbar for 2 sec from the "short end", which is the end of the capillary near the
detector. The effective capillary length (normally 48 cm) was reduced to 8 cm
with this type of injection. In this case there was no need to reverse the voltage of
separation while a low pH buffer was employed. A positive voltage of 30 kV was
applied providing a stable current not higher than 30 uA.

5.3.4.1 Effect of organic solvent on the analyte's separation
The attempt to achieve the separation of docetaxel and DOX with the
above conditions failed as two analytes comigrated. The previous experiments in
this chapter have shown the important role of the organic solvent in the
partitioning of analyte molecules between oil droplets and aqueous phase. Figure
5.11 shows the effect of the concentration of MeOH on the separation of
docetaxel and doxorubicin. It was found that the analyte peaks were sharper but
less resolved (R = 1.13) at 10 % MeOH. The baseline resolution (R = 3.42) was
obtained with 25% MeOH in the microemulsion buffer, but the efficiencies of the
analytes, and especially doxorubicin, were extremely low (N = 842 for DOX).
These results suggest that MeOH decreases the partitioning of analytes into the oil
droplets. The same effect of methanol on the efficiency of analytes was found
with octane microemulsion (Section 5.3.3.3). Regardless of the low resolution of
analytes when 10 % MeOH was added to the buffer, this concentration was
chosen for hrther experiments as better efficiency of peaks will enable the
observation of the effects of other components of microemulsion. The time of
analysis in this study was significantly shorter compare to the octane MEEKC
conditions and was just over 1 min.
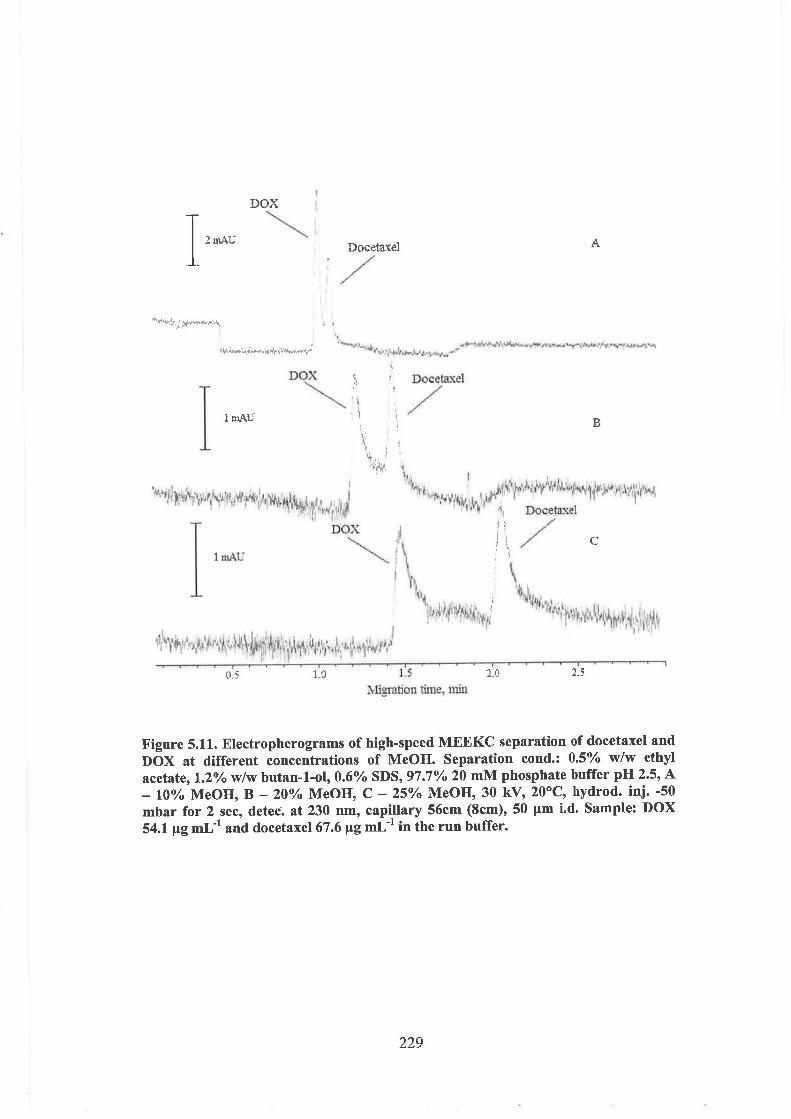
U . ' ' . I ' ' ' . ~
0.5 1.0 1.5 2.0 2.5 XIigmtion time,
Figure 5.11. Electropherograms of high-speed MEEKC separation of docetaxel and DOX at different concentrations of MeOH. Separation cond.: 0.5% w/w ethyl acetate, 1.2% w/w butan-1-ol,0.6% SDS, 97.7% 20 mM phosphate buffer pH 2.5, A - 10% MeOH, B - 20% MeOH, C - 25% MeOH, 30 kV, 20°C, hydrod. inj. -50 mbar for 2 sec, detec. at 230 nm, capillary 56cm (8cm), 50 pm i.d. Sample: DOX 54.1 pg mL-' and docetaxel67.6 pg mL-' in the run buffer.

5.3.4.2 Optimisation of the separation
In order to optimise the separation of docetaxel and doxorubicin with
high-speed MEEKC the effect of each component of the microemulsion on the
separation was investigated. Table 5.7 represents the obtained parameters of the
separation of docetaxel and DOX while varying the concentration of SDS, 1-
butanol and ethyl acetate, respectively, in the microemulsion.
Table 5.7. Effect of SDS, 1-butanol and EA on the parameters of the separation. Separation cond.: 20 mM phosphate buffer pH 2.5,10% MeOH, other conditions as in Figure 5.11. n = 3
Varied Doxorubicin Docetaxel R
parameter t, *
N - t m N
(min) (mi@
%SDS Microemulsion composition: 0.5% w/w EA, 1.2% w/w butan-
%butan01 Microemulsion composition: 0.5% w/w ethyl acetate, 0.6%
SDS
1.4% 0.98 5757*220 1.02 3 992*434 0.76
%EA Microemulsion composition: 1.6% w/w butan-l-01,0.5~/0 SDS
0.6% 0.94 8232zt751 1 .OO 8215*869 1.37
0.7% 0.95 8789*1451 1.02 793 8k944 1.54
. * Mean from three determinations with %RSD < 1.5%.

It has to be noted that the efficiencies of docetaxel and doxorubicin in
Table 5.7 are significantly lower than those obtained with octane MEEKC. This is
due to the difference of the effective length in two separations. The analyte
migration distance was 48 cm when injection was performed from the "normal"
end of the capillary. With the "short end" injection this value was 8 cm.
In general, the effect of the concentrations of SDS, butan-1-01 and ethyl
acetate on the separation of docetaxel and doxorubicin was in agreement with the
previously obtained data for the octane microemulsion. However due to the very
short migration times and a narrow concentration range of the varied parameter,
the difference in the change in migration time was quite small and the effect of
the varied parameters was difficult to observe.
Thus, an increase in SDS concentration resulted in increased efficiency of
doxorubicin. The efficiency of docetaxel was quite similar within the error in the
range of studied concentration of SDS, only at 0.5% SDS the efficiency was
higher but was accompanied by a large error. The resolution of analytes was
better at low concentration of SDS in the microemulsion. The significant increase
of the efficiency of docetaxel and the resolution of analytes was only noticed at
2% of butan-1-01 in microemulsion (Table 5.7). The parameters of the separation
at the concentration 1.4% and 1.6% were lower than those obtained at a higher
content of 1-butanol and did not differ significantly. A greater content of the core
phase resulted in higher resolution of analytes and better efficiency of
doxorubicin.
The optimised values of the content of ethyl acetate, 1-butanol and SDS
were combined in the final composition. The separation of docetaxel and
doxorubicin was compared to the separation with the original microemulsion. The
parameters of both separations are shown in Table 5.8. The migration times of
analytes with the optimised microemulsion (Ne 2 in Table 5.8) were slightly
longer. The resolution approached the acceptable value and was 2.19. The
efficiencies of analytes separated with the optimised microemulsion were
significantly higher than in the original microemulsion. But they were also
accompanied by larger %RSD values. In general, the optimised composition of
microemulsion was somewhat more advantageous over the first microemulsion
and can be suggested for further development.

Table 5.8. Parameters of the separation with original and optimised composition of microemulsion. Separation cond.: 20 rnM phosphate buffer pH 2.5, 10% MeOH, other conditions as in Figure 5.11. n = 3
Nc Microemulsion Doxorubicin Docetaxel R N composition t I?d t I" N
(min)
1 0.5% EA,
1.2% butanol, 0.98 4898*1270 1.04 4765%1887 0.85
0.6% SDS
2 0.7%EA,
2.0% butanol, 1.13 12324*5023 1.23 10687h6026 2.19
0.4% SDS
* Mean from three determinations with %RSD <IS%.
5.3.4.3 Choice of the internal standard
In order to ensure the repeatability of the separation the internal standard
is required in the analysed sample. Naproxen, equilin and 2, 4-
dichlorophenoxyacetic acid (2, 4-D) were considered as internal standards in the
separation of doxorubicin and docetaxel. The electropherograms of the obtained
separations are shown in Figure 5.12. All potential compounds could be used as
IS for the simultaneous determination of doxorubicin and docetaxel. The mobility
of naproxen, equilin and 2, 4-D differed from the mobilities of analytes at the
conditions of the experiment and all the compounds were separated. It has to be
noted that chosen IS possessed weak partitioning into the oil droplets as they
migrated after the analytes. The separation with equilin and naproxen was short
and took just over 2 min, which is preferential in terms of minimising the time of
analysis.

Figure 5.12. Electropherograms of separation of docetaxe1 and DOX with different IS. Separation cond.: 0.7% w/w ethyl acetate, 2% w/w butan-1-ol,0.4% SDS, 97.7% 20 mM phosphate buffer pH 2.5, 10% MeOH, other conditions as in Figure 5.11. Peak identification: 1 - DOX, 2 - docetaxel, IS: A - naproxen 52.6 pg rnl-l, B - 2,4- D 91.1 pg mL-', C - equilin 52.6pg mL".

5.3.4.4 Application of the method to different anthracyclines and
taxanes
The developed method was applied to the separation of various
combinations of anthracyclines and taxanes. The electropherograms in Figure
5.13 show the separation of daunorubicin and docetaxel (A), daunorubicin and
paclitaxel (B) and doxorubicin and paclitaxel (C) .
i a 3 1 Migrdo~ h e , mh
Figure 5.13. Electropherograms of separation of anthracyclines and taxanes. Separation conditions ns in Figure 5.12. Peak identification: A: 1 - DAU (52.6 pg m~.'), 2 - docetrxel (65.7 pg rn~-') ; B: 1 - DAU (52.6 pg mLe'), 2 - paclitaxel (65.7 pg rn~-'1; C: - 1 - DOX (52.6 pg m~.'), 2 - paclitaxel(65.7 pg m ~ ~ ' ) ; IS - naprorane (55.2 Gpg m ~ l ) .

It can be seen that all of the combinations of cancer drugs were separated
successfully using the developed method. Daunorubicin and doxorubicin have the
same electrophoretic behaviour and have the same position on the
electropherogram. The method developed for docetaxel was suitable for
paclitaxel. This is due to the high similarity in chemical structure of DAU and
DOX and paclitaxel and docetaxel, as was discussed in 5.1.1 and 5.1.2. This
experiment led to the assumption that the developed method could be a generic
method for the determination of any anthracycline and any taxane.
5.3.4.5 Method precision
While the investigated method has shown a good potential for fast
simultaneous separation of anthracyclines and taxanes, several issues can arise
when performing statistical analysis of the data. In order to measure the precision
of the developed method the repeatability of the migration time, peak area and
peak height for each analyte were determine. The data was collected over 10 and
17 consequent experiments and presented in Tables 5.9 and 5.10. The
combinations of DAU and docetaxel and DOX and docetaxel with equilin as an
IS were investigated. Excellent repeatability of the migration times over 10 or 17
runs for all compounds could be noticed.
The %RSD of the peak area and height were higher for anthracyclines
rather than for taxane and were up to 33% and 18%, respectively. Tables 5.9 and
5.10 also contain information about the peak area and height ratios in relation to
the IS. The introduction of the IS into the calculation of the peak areas and heights
levels out the precision of analytes and brings closer the average values between
1 0 and 17 consequent runs.
Due to the hydrophilic properties of anthracyclines, their interaction with
hydroxyl groups of silica of the capillary walls can take place, in the same way as
they can be adhered to the glass sample vial [I 171. This can affect the peak shape,
area and height. The capillary was often required to be replaced as the
repeatability of the method was seriously suffering, but more experiments are
necessary in order to establish the life time of the capillary. The employment of

several capillaries resulted in slight diffaences of the migration times of analytes
tested on each capillary.
It was noted that precipitation occurred with anthracyclines in the
microemulsion on some occasions. It is advisable therefore to prepare samples in
the separation buffer directly before the analysis.
Table 5.9. Repeatability parameters of numerous separations of DOX and docetaxeI.
Parameter N DOX Docetaxel IS (Equilin)
Avr. %RSD Avr, %RSD Avr. %RSD
tm 17 1.58 1.8 1.75 2.1 2.10 3.0
(dn) 10 1.59 1.8 1.77 1.4 2.13 2.0
Peak 17 17.7 32.9 10.6 10.8 4.6 18.0
Area 10 14.6 34.1 10.3 9.0 4.3 20.3
Peak 17 6.3 22.8 3.6 8.4 2.4 19.3
Height 10 5.6 24.7 3.6 9.8 1.4 24.0
Area ratio 17 3.8 1 . 2.4 19.3 - -
to IS 10 3.5 22.5 2.5 22.4 - -
Height 17 4.6 23.0 2.6 23.1 - - ratio 10 4.1 25.8 2.7 27.7 - -
to IS

Table 5.10. Repeatability parameters of numerous separations of DAU and docetaxel.
Parameter n DAU Docetaxel IS (Equilin)
Avr. %RSD Avr. %RSD Avr. %RSD
t m 17 1.57 1.7 1.75 1.7 2.10 2.6
10 1.59 1.5 1.77 1.3 2.14 1.7
Peak 17 15.2 26.5 10.4 8.5 4.6 17.8
Area 10 16.4 26.5 10.0 7.0 4.8 17.7
Peak 17 5.8 3 1.9 3.7 14.9 1.4 28.0
Height 10 6.6 27.8 3.9 18.3 1.6 27.7
Area ratio 17 3.3 17.9 2.3 21.3 - - to IS 10 3.4 14.0 2.1 20.1 - -
Height 17 4.1 15.3 2.7 22.7 - - ratio 10 4.2 13.9 2.5 21.5 - q
to IS
While the capillary was washed for a long period of time at the beginning
of the experiments, the first run of the day was always characterised by better
efficiencies of the peaks. But this was not taken into account while obtaining
statistical data. This and the high values of %RSD (7-34.1% for peak area) can
suggest that capillary conditioning should be investigated in more detail. At the
current state of the method development the rinsing between runs consisted of 1
min was with 0.1 M NaOH, followed by MeOH for 1 min and run buffer for 1
min. Taking into the account the complex nature of target analytes, the
prewashing step should be optimised.

5.3.4.6 Sensitivity of the method
The issue of sensitivity is a matter of a high priority for the analysis of
cancer treatment drugs in biological samples. The levels of anthracyclines and
taxanes in plasma can vary hom 4.5 pg mL-' to 0.02 pg m ~ - l over a period of 24
hours after injection [46]. The working concentrations of anthracycline and taxane
were 52.6 pg mL-' for DAU and DOX and 65.7 pg mL-I for docetaxel. Although
the LODs and LOQs were not identified for the developed high speed
microemulsion separation, it is clear that the method needs further improvement
in relation to the sensitivity issue.
Choice of optimum wavelength is one of the ways to improve the detector
response. Figure 5.14 shows the investigated separation at the employed
wavelengths of 230 nm and 200 nm. It can be seen that the intensity of docetaxel
at 200 nrn was double the intensity at 230 nm. Most commercial detectors allow
recording two wavelengths simultaneously. This is how the optimum signal for
each compound can be obtained.
Another way of achieving a higher signal is a higher loading of sample
onto the capillary. A hydrodynamic injection was investigated at 5 sec and 10 sec
and the obtained electropherograms are presented in Figure 5.15. The resolution
and efficiency suffered when 10 sec injection (B) was performed, while peak area
has increased. An injection of 5 sec (A) was a better compromise for the
resolution, efficiency signal of the peaks.
For hrther modification of the analysis with the UV detector it is possible
to use an extended light pass capillary, where the diameter of the capillary at the
detection window is 3 times greater than the diameter in the separation part. This
was previously employed for the analysis of paclitaxel and docetaxel [83] (Table
5.1). The achieved LODs were in the required analytical range.

Figure 5.14. Electropherograms of separation of docetaxel and DAU at different wavelengths. A - 200 nm, B - 230 nm. Other separation conditions and peak identification as in Figure 5.12(C).
The most radical and probably most successful way of approaching the
desirable detection range would be to employ a different detection technique.
Thus, fluorescence detector was proven to be very sensitive for anthracyclines
[61-631. In order to perform a simultaneous determination of the anthracyclines
and taxanes, a derivatization step would be required for taxanes as they do not
exhibit natural fluorescence. Mass spectral detection can be universal for both
compounds, but its compatibility with the microemulsion composition and the
applied voltage should be investigated in details.

Figure 5.15. Electropherograms of separation of docetaxel and DAU at different time of hydrodynamic injection. A - 5 sec, B- 10 sec. Other separation conditions and peak identification as in Figure 5.12(C).

5.3.5 Application to plasma samples
5.3.5.1 Direct plasma injection
For the application of the method for real time monitoring, minimal
preparation of the biological samples is desirable. Preliminary experiments were
performed in order to test the suitability of the capillary electrophoresis
simultaneous determination of taxane and anthracycline for direct injection of
human plasma samples. Daunorubicin and docetaxel were used to spike a plasma
sample. This was then directly injected onto the capillary and analysed with the
developed EA MEEKC method. Figure 5.15 represents the electropherogram of
the separation of plasma diluted with the run buffer in the ration 20 : 80 (vlv). The
spiked sample (B) was compared to the blank mixture injection (A). The peaks of
daunorubicin and docetaxel could be identified. Peaks were noticeably broader,
compared to the peaks on the electropherogram, where analytes were injected in
100% separation buffer (Figure 5.13 (A)). It took slightly longer for daunorubicin
and docetaxel to migrate. The electropherogram in Figure 5.15 (A)) shows that no
interfering peaks were observed in blank plasma.
Figure 5.15. Electropherograms of direct plasma injection. Injection composition: plasma : separation buffer = 20: 80 (vlv). A - blank plasma, B - plasma spiked with docetaxel, DAU and IS. Separation conditions as in Figure 5.12. Peak identification: 1 - DAU 53.8 pg mLml 2 - docetaxel67.2 pg r n ~ - ' , IS - naproxen 11.3 pg mL-'.

In the electropherogram in Figure 5.16 the plasma was diluted with the
run buffer in the ration 50 : 50 (vlv). Peaks of analytes were identified and no
interfering peaks were observed in blank plasma. Lowering the content of the
separation buffer in the injection and increasing the plasma part of it resulted in a
low efficiency and resolution of analyte's peaks. This can suggest that molecules
of analytes are transferred into the oil droplets at a lower rate when the buffer part
in the injection decreases. This implies that analytes undergo strong binding with
proteins of plasma [I181 and change their electrophoretic behaviour and, thus, do
not elute from the capillary. When a combination of daunorubicin and docetaxel
was injected in 100% plasma or an injection was composed with over 50% of
plasma, no peaks due to analyte could be seen on the electropherograms (data is
not presented).
Preliminary experiments have shown that the direct injection of plasma
was possible, but required large dilutions of the sample. This is not desirable for
low detection limits. Further experiments are required in order to investigate the
reliability of this method.
Figure 5.16. Electropherograms of direct plasma injection. Injection composition: plasma : separation buffer = 50: 50 (vlv). A - blank plasma, B - plasma spiked with docetaxel, DAU and IS. Separation conditions as in Figure 5.12. Peak identification as in Figure 5.15.

5.3.5.2 Separation of pretreated plasma
In order to disrupt the protein-drug binding so that the total amount of
drug can be extracted for analysis it is advisable for a sample to undergo a
pretreatment step prior to analysis [119]. Using precipitation techniques to
denature the proteins, their ability to bind drugs can be destroyed depending on
the binding mechanism [120]. In this study the acetonitrile precipitation of
proteins was employed. The organic solvent lowers the dielectric constant of
plasma protein solution, which increases the attraction between charged
molecules and facilitates electrostatic protein interaction [119]. The molecules of
acetonitrile also displace the molecules of water in the hydrophobic part on the
protein surface. When the hydrophobic interactions between proteins are minimal,
the electrostatic interactions become predominant and lead to the aggregation of
proteins.
Three potential methods for the simultaneous separation of daunorubicin
and docetaxel were tested in this study. The separation buffers and conditions that
revealed the separation of target analytes in CZE (5.3.1), MEKC (5.3.2) and
MEEKC (5.3.3) modes of capillary electrophoresis were applied for the blank
plasma and plasma spiked with analytes. The precipitation of plasma proteins was
performed according to the procedure described in 5.2.4. The obtained
electropherograms are shown in Figure 5.1 7 - 5.19.
The electropherogram in Figure 5.17 (B) illustrates that the CZE method
failed to determine analytes in the plasma, while the sufficient separation was
obtained in a test mixture (Figure 5.4 (B)). The electropherogram of blank plasma
(Figure 5.17 (A)) shows that there was a peak attributed to plasma and it
interfered with the migration of analytes.
Three electropherograms in Figure 5.18 represent the separation of blank
plasma (A), spiked plasma (B) and the separation of a test mixture of DAU,
docetaxel and IS (equilin) (C). The latter experiment was required to be repeated
as the IS was added to the mixture. It shows that the obtained MEKC method was
suitable for the separation of equilin from both analytes. The mobility of equilin
in the capillary was lower than the mobility of docetaxel as the interaction with
the micelles was stronger. The analysis of spiked plasma sample was quite

successful, as all peaks were separated and plasma peak was resolved from
analytes.
Figure 5.17. Electropherograms of the CZE separation of the pretreated plasma samples. A - blank plasma, B - plasma spiked with 45.5 pg m ~ - ' DAU, 56.8 p~ mt" docetaxel and 90.9 pg m ~ - ' equilin (IS). Separation cond.: 20 mM borate buffer pH 9, 70% ACN, 30 kV, 20°C, hydrod. inj. 2 sec., detec. at 230 nm, capillary 56cm (48cm), 50 pm i.d.
A high speed microemulsion electrokinetic chromatography with the ethyl
acetate as a core phase was also tested with the injection of deproteinised plasma.
The electropherogram of the blank plasma extract (Figure 5.19 (A)) shows the
peaks of several compounds which were present in the acetonitrile supernatant of
plasma. Daunorubicin, docetaxel and IS were separated in a spiked sample, as can
be seen in Figure 5.19 (B). However the experiment was not successful as the
peak attributed to plasma overlapped with the anthracycline.

Figure 5.18. Electropherograms of the MEKC separation of the extracted plasma samples. A - blank plasma, B - plasma spiked with 45.5 pg m ~ - ' DAU, 56.8 pg r n ~ - ' docetaxel and 90.9 pg m ~ - ' equilin (IS), C - test mixture of DAU 52.6 yg docetaxel 65.2 pg rnL-' and equilin 52.6 yg the run buffer. Separation cond.: 25 rnM Tris-phosphate buffer pH 9,70% MeOH, 100% SDS, 30 kV, 20°C, hydrod. inj. 2 sec., detec. at 230 nm, capillary 56cm (48cm), 50 pm i.d.
From this experiment it can be concluded that the three analysed methods
representing different modes of capillary electrophoresis were proven to be
powerful in the separation of test mixtures of daunorubicin and docetaxel.
However, their resolving ability was affected in a different way when real
samples of plasma were analysed. CZE mode can only be effective in the
separation of charged molecules. This was probably not the case in the analysis of
pretreated plasma and that explains why the method had failed. MEKC and
MEEKC were more successful in the application to the real samples as they are
able to separate more species using partitioning mechanism.

4 b d o n time, min
Figure 5.19. Electropherograms of the EA MEEKC separation of the extracted plasma samples. A - blank plasma, B - plasma spiked with 45.5 pg m ~ ~ ' DAU, 56.8 pg m ~ ~ ' docetaxel and 90.9 pg m ~ - ' equilin (IS). Separation cond.: 0.5% wlw ethyl acetate, 1.2% wlw butan-1-01, 0.6% SDS, 97.7% 20 rnM phosphate buffer pH 2.5, 10% MeOH, 30 kV, 20°C, hydrod. inj. -50 mbar for 2 sec, detec. at 230 nm, capillary 56cm (8cm), 50 pm i.d.
The high speed MEEKC is a very attractive method from the point of
short migration time - one run lasts 2.5 min. But the determination of
anthracycline is difficult due to its comigration with the plasma peak. An
alternative method for plasma pretreatment could be designed in order to improve
the removal of undesirable plasma components. The use of solid-phase extraction
can be very advantageous as a plasma pre-treatment method and preconcnetration
procedure in order to achieve lower LODs. The aim of this work did not include
the development of the pretreatment procedure. At this stage of the work it was
found that the MEKC method for the simultaneous determination of anthracycline
and taxane has the most potential in application to the plasma extracts.
Nonetheless it cannot yet be used for the determination of the plasma samples
from patients due to the sensitivity issue. Even though the LODs for daunorubicin
and docetaxel were not determined it can be seen from the intensity of the peaks
that they are greatly exceed the required values.

5.4 CONCLUSIONS
For the first time simultaneous analysis of anthracyclines and taxanes is
reported. Several modes of capillary electrophoresis were screened in order to
achieve the separation and investigate the electrophoretical behaviour of analytes.
The separation is possible using CZE, MEKC and MEEKC techniques. The
importance of the role of organic solvent in each mode of separation was noted.
While CZE and MEKC have previously been used in the separation of
anthracyclines and taxanes in single runs, the MEEKC method is successfully
applied to these compounds for the first time. The effects of different parameters
of microemulsion on the electrophoretic behaviour of both drugs have been
examined in detail.
An innovative approach of shortening the analysis time was employed.
The injection was performed from the "short end" of the capillary, so that the
separation was performed only on 8 cm of the effective length. With the addition
of low surface tension core phase in microemulsion it was possibly to use small
concentrations of surfactant and, thus, to apply high voltage for more efficient
separation. This all resulted in a run time of less than 2 min.
A high speed MEEKC method have shown to be a generic method as
combinations of different anthracyclines and taxanes could be analysed. This is
highly beneficial for clinical analysis in cancer therapy when the combinations of
prescribed drugs can be varied.
Even though at present there is need for future strategy on achieving the
required sensitivity levels for analytes, MEKC and high speed MEEKC methods
were proven to show good potential in their application to deproteinised plasma
spiked with analytes. This is especially true for the MEKC method where all
analytes and plasma components were separated. The plasma pretreatment
procedure requires further development. CZE method has failed to separate
anthracyclines and taxane in the deproteinised plasma. High speed MEEKC was
also capable of determining the analysed drugs in the direct injection of plasma,
but high dilutions with the separation buffer were required.

This work represents a novel approach in the analysis of drugs employed
in combinational therapy of cancer. The sample throughput of a clinical
laboratory can be significantly increased by using fast methods for simultaneous
monitoring of pharmacokinetics of anthracyclines and taxanes.

5.5 REFERENCES
1. www.who.int
2. www.cancer.ie
3. !-tttp://hcd2+bupa.co.uk/fact sheetsf i t rnl /c l~motI~~ap~ .htn11
4. F. Arcamone, Doxorubicin Anticancer Antibiotics, Academic Press, New
York, 1981.
5. F. Arcamone and J.W. Lown, Anthracycline and Anthracenedoine-based
Anticancer Agents, Elsevier Science, New York, 1 989.
6. G. Lukacs and M. Ohno, Recent Progress in the Chemical Synthesis of
Antibiotics, Springer, New York, 1990.
7. A. Kummerle, T. Krueger, M. Dusmet, C. Vallet, Y. Pan, H.B. Ris, L.A.
Decoster, J. Pharm. Biomed. Anal. 33 (2003) 475.
8. G.N. Hortobagyi, Drugs 54 (1997) 1.
9. D.A. Gewirtz, Biochem. Pharmacol. 57 (1999) 727.
10. R. Danesi, S. Fogli, A. Gennari, P. Conte, M. Del Tacca, Clin. Pharmacokinet.
41 (2002) 431.
1 1. www.nlrn.nih.~ov
12. L.Turker, J. Mol. Struct. 583 (2002) 81.
13. X. Brazzolotto, M. Andriollo, P. Guiraud, A. Favier, J. Moulis, Biochim.
Biophys. Acta (2003) 209.
14. T.-H. Tsai, J. Chromatogr. B 764 (2001) 27.
15. V. Valero, S.E. Jones, D.D. Von Hoff, J. Clin. Oncol. 16 (1 998) 3362.
16. E.A. Perez, C.L. Vogel, D.H. Irwin, J.J. Kirshner, R. Patel, Breast Cancer Res.
Treat. 73 (2002) 85.
17. K. Hata, M. Osaki, D.K. Dhar, K. Nakayama, R. Fujiwaki, H. Ito, N. Nagasue,
K. Miyazaki, Cancer Chemother. Pharmacol. 53 (2004) 68.
18. H. Malonga, J.F. Neault, S. Diamantoglou, H.A. Tajmir-Riahi, Mini Rev.
Med. Chem. 5 (2005) 307.
19. G. Hempel, C. Rube, C. Mosler, M. Wienstroer, A. Wagner-Bohn, A. Schuck,
N. Willich, J. Boos, Anticancer Drugs 14 (2003) 417.
20. B. Fluton and C.M. Spencer, Drugs 51 (1996) 1075.
21. E.K. Rowinsky, Ann. Rev. Med. 48 (1997) 353.
22. S.B. Horwitz, Trends Pharmacol. Sci. 13 (1992) 134.

23. F. Gueritte-Voegelein, D. Guenard, F. Lavelle, M.-T. Le Goff, L. Mangatal, P.
Potier, J. Med. Chem. 34 (1991) 992.
24. M.C. Bissery, D. Guenard, F. Gueritte-Voegelein, F. Lavelle, Cancer Res. 51
(1991) 4845.
25. I. Ringel and S.B. Honvitz, J. Natl. Cancer Inst. 83 (1991) 288.
26. A.R. Hanauske, D. Degen, S.G. Hilsenbeck, M.C. Bissery, D.D. Von Hoff,
Anti-Cancer Drugs 3 (1 992) 12 1.
27. E.K. Rowinsky and R.C. Donehower, N. Engl. J. Med. 332 (1995) 1004.
28. A. Sparreboom, 0 . van Tellingen, W.J. Nooijen, J.H. Beijnen, Cancer Res. 56
(1996) 21 12.
29. A.T. van Oosterom and D. Schrijvers, Anti-Cancer Drugs 6 (1995) 356.
30. L. Gianni, C.M. Kearns, A. Gainni, J. Clin. Oncol. 13 (1995) 180.
31. H.L. McLeod, C.M. Keams, J.G. Kuhn, R. Bruno, Cancer Chemother.
Pharmacol. 42 (1998) 155.
32. h t t p : l l m e d o
33. M.S. Aapro, Oncologist 6 (2001) 376.
34. J. Crown, EJC Supplements 4 (2006) 2.
35. M. Martin, T. Pienkowski, J. Mackey, N. Engl. J. Med. 352 (2005) 2302.
36. M.L. Citron, D.A. Berry, C. Cirrincione, J. Clin. Oncol. 21 (2003) 1431.
37. I.C. Henderson, D.A. Berry, C.T. Cirrincione, J. Clin. Oncol. 21 (2003) 976.
38. E.P. Mamounes, J. Bryant, B. Lembersky, J. Clin. Oncol. 23 (2005) 3686.
39. M. DYIncalci, J. Schuller, T. Colombo, M. Zucchetti, A. Riva, Semin. Oncol.
(suppl. 13) 25 (1998) 16.
40. J.A. O'Shaughnessy, J.S. Fisherman, K.H. Cowan, Semin. Oncol. (suppl. 8)
21 (1994) 19.
41. F.A. Holmes, T. Madden, R.A. Newman, V. Valero, R.L. Theriault, G.
Fraschini, R.S. Walters, D.J. Booser, A.U. Buzdar, J. Willey, G.N. Hortobagyi, J.
Clin. Oncol. 14 (1 996) 27 13.
42. L. Gianni, L. Vigano, A. Locatelli, G Capri, A. Giani, E. Tarenzi, G.
Bonadonna, J. Clin. Oncol. 15 (1997) 1906.
43. L. Gianni, E. Munzone, G Capri, F. Fulfaro, E. Tarenzi, F. Villani, C.
Spreafico, A. Laffranchi, A. Caraceni, C. Martini, M. Stefanelli, P. Valagussa, G.
Bonadonna, J. Clin. Oncol. 13 (1995) 2688.
44. 0. Pagani, Semin. Oncol. (suppl. 12) 25 (1998) 23.

45. P.F. Conte, E. Baldini, A. Gennari, A. Michelotti, B. Salvadori, C. Tibaldi, R.
Danesi, F. Innocenti, A. Gentile, R. Dell'Anna, 0 . Biadi, M. Mariani, M. Del
Tacca, J. Clin. Oncol. 15 (1 997) 25 10.
46. M. Ceruti, V. Tagini, V. Recalenda, S. Arpicco, L. Cattel, M. Airoldi, C.
Bumma, I1 Farmaco 54 (1999) 733.
47. C. Mazuel, J. Grove, G. Gerin, K.P. Keenan, J. Pharm. Biomed. Anal. 33
(2003) 1093.
48. C. Scottani, C. Minoia, M. DYIncalci, M. Paganii, M. Zucchetti, Rapid
Comrnun. Mass Spectrom. 12 (1998) 25 1.
49. Y. Gaillard, G. Pepin, J. Chromatogr. B 733 (1999) 181.
50. F. Lachatre, P. Marquet, S. Ragot, J.M. Gaulier, P. Cardot, J.L. Dupuy, J.
Chromatogr. B 73 8 (2000) 28 1.
51. P.G. Grothaus, T. J. G. Raybould, G.S. Bignami, C.B. Lazo, J.B. Brynes, J.
Immun. Methods 15 8 (1 993) 5.
52. D. Song, J.L.S. Au, J. Chromatogr. B 663 (1995) 337.
53. J.G. Supko, R.V. Nair, M.V. Seiden, H. Lu, J. Pharm. Biomed. Anal. 21
(1 999) 1025.
54. A. Gavenda, J. Sevcik, J. Psotova, P. Bednar, P. Bartiik, P. Adamovsky, V.
Simiinek, Electrophoresis 22 (2001) 2782.
55. Q. Hu, T. Zhou, L. Zhang, H. Li, Y. Fang, Fresenius J. Anal. Chem. 368
(2000) 844.
56. Q. Hu, L. Zhang, T. Zhou, Y. Fang, Anal. Chim. Acta 416 (2000) 15.
57. G. Nicholls, B.J. Clark, J.E. Brown, J. Pharm. Biomed. Anal. 10 (1 992) 949.
58. G. Nicholls, B.J. Clark, J.E. Brown, Anal. Proc. 30 (1993) 51.
59. P. Zhao and A.K. Dash, J. Pharm. Biomed. Anal. 20 (1999) 543.
60. N. Simeon, E. Chatelut, P. Canal, M. Nertz, F. Couderc, J. Chromatogr. A 853
(1999) 449.
61. N.J. Reinhoud, U.R. Tjaden, H. Irth, J. van der Greef, J. Chromatogr. 574
(1992) 327.
62. T. Perez-Ruiz, C. Martinez-Lozano, A. Sanz, E. Bravo, Electrophoresis 22
(2001) 134.
63. G. Hempel, P. Schulze-Westhoff, S. Flege, N. Laubrock, J. Boos,
Electrophoresis 19 (1 998) 2939.

64. G. Hempel, S. Haberland, P. Schulze-Westhoff, N. Mohling, G. Blaschke, J.
Boos, J. Chromatogr. B 698 (1997) 287.
65. G. Hempel, P. Schulze-Westhoff, S. Flege, J. Boos, J. Chromatogr. B 758
(2001) 221.
66. A.B. Anderson, C.M. Ciriacks, K.M. Fuller, E. A. Arriaga, Anal. Chem. 75
(2003) 8.
67. A.B. Anderson, J. Gergen, E.A. Arriaga, J. Chromatogr. A 769 (2002) 97.
68. S. Nagaraj and H.T. Kames, Biomed. Chromatogr. 14 (2000) 234.
69. G. Xiong, Y. Chen, E.A. Arriaga, Anal. Chem. 77 (2005) 3488.
70. N. Laubrock, G. Hempel, P. Schulze-Westhoff, G. Wurthwein, S. Flege, J.
Boos, Chromatographia 52 (2000) 9.
71. N. Griese, G. Blaschke, J. Boos, G. Hempel, J. Chromatogr. A 979 (2002)
379.
72. G. Hempel, D. Reinhardt, U. Creutzig, J. Boos, Br. J. Clin. Pharmocol. 56
(2003) 370.
73. Y. Chen, R. J. Walsh, E.A. Arriaga, Anal. Chem. 77 (2005) 2281.
74. A. R. Eder and E.A. Arriaga, J. Chromatogr. B 829 (2005) 115.
75. O.T. Fahmy, M.A. Korany, H.M. Maher, J. Pharm. Biomed. Anal. 34 (2004)
1099.
76. M.R. Rouini, A. Lotfolahi, D.J. Stewart, J.M. Molepo, F.H. Shirazi, J.C.
Vergniol, E. Tomiak, F. Delorme, L. Vernillet, M. Giguere, R. Goel, J. Pharm.
Biomed. Anal. 17 (1 998) 1243.
77. R.M. Mader, B. Rizovski, G.G. Steger, J. Chromatogr. B 769 (2002) 357.
78. L. Alvarez-Cedron, M.L. Sayalero, J.M. Sayalero, J.M. Lanao, J. Chromatogr.
B 721 (1999) 271.
79. T.E. Murdter, B. Sperker, K. Bosslet, P. Fritz, H.K. Kroemer, J. Chromatogr.
B 709 (1998) 289.
80. M. Israel, W.J. Pegg, P.M. Wilkinson, M.B. Garnick, J. Liq. Chromatogr. 1
(1978) 795.
81. I.K. Barker, S.M. Crawford, A.F. Fell, J. Chromatogr. B 681 (1996) 323.
82. I. Badea, L. Lazar, D. Moja, D. Nicolescu, A.Tudose, J. Pharm. Biomed.
Anal. 39 (2005) 305.
83. G. Hempel, D. Lehrnkuhl, S. Krumpelmann, G. Blaschke, J. Boss, J.
Chromatogr. A 745 (1 996) 173.

84. L.K. Shao and D.C. Locke, Anal. Chem. 70 (1 998) 897.
85. E.A. Forssen, M. Ross, J. Liposome Res. 4 (1994) 481.
86. P. Pouna, S. Bonoron-Adele, G. Gouvemeur, L. Tariosse, P. Besse, J. Robert,
Br. J. Pharmacol. 117 (1 996) 1593.
87. S. Nagaraj and T. Kames, Biomed. Chromatogr. 14 (2000) 234.
88. C. Polson, P. Sarkar, B. Incledon, V. Raguvaran, R. Grant, J. Chromatogr. B
785 (2003) 263.
89. M. Almgren and S. Swarup, J. Colloid Interface Sci. 91 (1983) 256.
90. M.F. Emerson and A. Holtzer, J. Phys. Chem. 71 (1967) 3320.
91. J. Vindevogel and P. Sandra, Anal. Chem. 63 (199 1) 1530.
92. J.S. Fritz, Electrophoresis 24 (2003) 1530.
93. M.J. Sepaniak, A.C. Powell, D.F. Swaile, R.O. Cole, in: P.D. Grossma and
J.C. Colburn (Eds.), Capillary Electrophoresis. Theory and Practice, Academic
Press, New York, 1992.
94. F. Arcamone, Doxorubicin. Academic Press, New York, 1981.
95. C. Gabel-Jensen, S.H. Hansen, S. Pedersen-Bjergaard, Electrophoresis 22
(2001) 1330.
96. K.D. Altria, M.F. Broderick, S. Donegan, J. Power, Electrophoresis 25 (2004)
645.
97. P.-E. Mahuzier, B.J. Clark, S.M. Bryant, K.D. Altria, Electrophoresis 22
(2001) 3819.
98. H. Watarai, Chem. Lett. 231 (1991) 391.
99. E.F. Hilder, C.W. Klampfl, W. Bunchberger, P.R. Haddad, J. Chromatogr. A
922 (2001) 291.
100. X. Cahours, S. Cherkaoui, G. Rozing, J.-L. Veuthey, Electrophoresis 23
(2002) 2320.
101. H.-Y. Huang, Y.-C, Lai, C.-W. Chiu, J.-M. Yeh, J. Chromatogr. A 993
(2003) 153.
102. S. Gong, T. Bo, L. Huang, K.A. Li, H. Liu, Electrophoresis 25 (2004) 1058.
103. K.D. Altria, J. Chromatogr. A 844 (1999) 371.
104. K.D. Altria, Chromatographia 49 (1999) 457.
105. K.D. Altria, J. Chromatogr. A 892 (2000) 171.
106. X. Fu, J. Lu, A. Zhu, J. Chromatogr. A 735 (1996) 353.
107. B. Forgaty, E. Dempsey, F. Regan, J. Chromatogr. A 1014 (2003) 129.

108. C.W. Klapfl, Electrophoresis 24 (2003) 1537.
109. M.F. Miola, M.J. Snowden, K.D. Altria, J. Pharm. Biomed. Anal. 18 (1998)
785.
110. A. Marshal, B. Clark, M. Broderick, J. Power, S. Donegan, K. Altria,
Electrophoresis 25 (2004) 3970.
1 1 1. H. Hoffinan, Phys. Chem. 100 (1 996) 1 109.
112. S. Gong, T. Bo, L. Huang, K.A. Li, H. Liu, Electrophoresis 25 (2004) 1058.
1 13. J. Vindelvogen and P. Sandra, Introduction to micellar electrokinetic
chromatography, Huthing Press, Heidelberg, 1992.
114. K.D. Altria, B.J. Clark, P.-E. Mahuzier, Chromatographia 53 (2000) 758.
115. G. Li, X. Chen, M. Liu, Z. Hu, Analyst 123 (1998) 1501.
1 16. J.H. Aiken, C.W. Huie, Chromatographa 35 (1993) 448.
117. J. Robert, in: L.B. Grochow and M.M. Arnes (Eds.), A Clinician's guide to
Chemotherapy: Pharmacokinetics and Pharmacodynamics, Williams and Wilkins,
Baltimore, MD, 1998.
1 18. www.rxlist.com
119. C. Polson, P. Sarkar, B. Incledon, V. Raguvaran, R. Grant, J. Chromatogr. B
785 (2003) 263.
120. J. B. Chamberlain, in: The analysis of drugs in biological fluids, 2nd ed,
CRC Press, Boca Raton, FL, 1995.

CHAPTER 6
CONCLUSIONS AND FUTURE WORK

6.1 PROGRESSION OF THF, RESEARCH
The outstanding analytical strength of capillary electrophoresis lies in its vast
resolving power, high speed of analysis, high efficiency and superior versatility along
with minimal sample and reagents consumption. This makes it highly advantageous in
the area of pharmaceutical analysis. The potential of capillary electrophoresis was
investigated in this work in an attempt to provide fast, efficient and selective methods
for the analysis of several pharmaceuticals.
6.1.1 CE in the analysis of alkylxanthines
Capillary electrophoresis has been shown to be a very rapid and simple method
for the simultaneous determination of alkylxanthines. A full analysis could be
performed in just 2 min. The method did not require rinsing of the capillary between
runs as only borate buffer was employed as the background electrolyte without any
additives. This is the fastest reported method for the analysis of this group of
compounds. The same method can be used as for the separation of both single
compounds and mixtures. The method was successfully employed in the analysis of
commercial pharmaceuticals and food samples. The achieved limits of detection were
satisfactory for the analysed sample and excellent repeatability of the method was
reported.
6.1.2 Analysis of the association complexes of steroids and cyclodextrins
The capability of CE in the measurement of physicochemical properties was
investigated. Cyclodextrins are often employed in chromatographic and
elecectrophoretic methods for the determination of steroid hormones due to their high
structural similarity. Fundamental knowledge of equilibrium and the association
constants of analysed compounds and ligand in the system is a powerful element in the
understanding of that system and in discovering ways to evaluate it. For the first time
the association constants of inclusion complexes of estriol, 17P-estradiol,

ethynylestradiol, estrone, progesterone, mestranol and norethindrone and different types of
cyclodextrins were investigated by capillary electrophoresis. The estimation of
association constants of steroid compounds with cyclodextrins was a straightforward
process due to the high efficiency and simple performance of capillary electrophoresis
in a combination with three plotting methods, which were used to ensure the reliability
of the data. The most powerful agent for the inclusion of the target analytes was found
to be y-CD followed by 2HP- y-CD. Interaction with the cavity of P-CD was rather
weak, while 2HP-P-CD failed to recognise a difference in structure of estriol, equilin,
ethynylestradiol, 17P-estradiol and estrone. It was found that the association constant
values decreased when the concentration of micelles in the run buffer was increased.
To obtain a large picture of the steroid inclusion in cyclodextrins and to
investigate the mechanism of inclusion in more detail it would be beneficial to study a
large number of steroids. The investigation of enatiomers of steroid compounds would
be beneficial as many of them are optically active. The employment of molecular
modelling and nuclear magnetic resonance technique would provide complementary
data for this research.
6.1.3 Determination of montelukast sodium and relatedcompounds
Capillary electrophoresis has shown good potential and many advantages over the
HPLC method for the determination of montelukast sodium. The full analysis time
was less than 9 min, which is significantly less than the 35 min analysis time of the
HPLC method. A high efficiency of the montelukast sodium peak of over 900000
theoretical plates was recorded with the achieved method. The conversion of
montelukast to its cis-isomer was investigated using the developed method. It was not
possible to quantify the impurity in a fresh sample of montelukast due to their low
concentration present and the insufficient sensitivity of the employed instrument (CE-
W). The employment of mass spectral detection in combination with the developed
separation could potentially achieve this goal and, additionally, provide information
on structural characteristic of the impurities.

6.1.4 CE for the simultaneous determination of anthracyclines and
taxanes
The achievements of this research open an avenue for future improvement in
the analysis of anticancer drugs used in combinational therapy. For the first time
simultaneous analysis of anthracyclines and taxanes was reported, which can
significantly increase a sample throughput of a clinical laboratory. Anthracyclines
and taxanes were separated by CZE, MEKC and MEEKC mechanisms of capillary
electrophoresis. MEEKC method was successfully applied to these compounds for
the first time and was characterised by very short separation time, high efficiencies of
peaks and was proven to be generic for the separation of different combinations of
anthracyclines and taxanes. This is highly beneficial for clinical analysis in cancer
therapy when the combinations of prescribed drugs can be varied. MEKC and high
speed MEEKC methods were proven to show good potential in their application to
plasma samples. Further strategy on the plasma pretreatment step should be
investigated. The employment of an alternative detection technique, such as
fluorescence or electrochemical detection, is the next step for this research in order to
achieve the limits of detection, which are required for the monitoring of therapeutic
levels of drugs in blood. Development of a microchip device for the simultaneous
capillary electrophoretic separation of anthracyclines and taxanes could benefit even
further the needs of high-throughput analysis in the clinical laboratory and point-of-
care testing fro improved patient care.

6.2 CONCLUSIONS
In this work the high value of capillary electrophoresis in the determination of
phmaceuticals was demonstrated using the examples of several investigated
methods. Taking into account the undoubted potential for high eficiency, selectivity
and speed, capillary electrophoresis should be given more opportunities in analyses,
where it can perfom at a high level.

Appendix
PUBLICATIONS
1. "Rapid simultaneous determination of alkytxanthines by CZE and its appIication in
anaIysis of pharmaceuticals and food samples" Anal. Chim. Acta 540 (2005) 103.
Yuliya ShakaIisava and Fiona Regan
2. 'Tletermination of association constants of inclusion complexes of steroid
hormones and cyclodextrins from their electrophoretic mobility' Electrophoresis 27
(2006) 3048.
Yuliya Shakalisava and Fiona Regan
3. "Simultaneous determination anthracyclines and taxanes 'by capillary
eIectrophoresis" Article in preparation.
Yuliya Shakdisava and Fiona Regm
4. '"epamtion of montelukast sodium and related impurities by capillary
electrophoresis" Article in preparation.
Yuliya Shakalisava and Fiona Regan

ORAL PRESENTATION
5 8 ~ Research colloquium 2006, Galway, Ireland
"A capillary electrophoretic study of the inclusion of steroid hormones in
cyclodextrins"
Yuliya Shakalisava
POSTER PRESENTATIONS
1. Analytical Forum 2004, Warsaw, Poland
"Capillary zone electrophoresis for the determination of alkylxanthines"
Yuliya Shakalisava and Fiona Regan
2. European Summer School "Human environment: energy, forests, health and
society" 2004, Nancy, France
"Cyclodextrin-modified capillary electrophoresis determination of endocrine
disrupting chemicals with direct sample injection"
Fiona Regan, Barbara Forgaty, Anne Moran and Yuliy Shakalisava
3. Microscale Bioseparations 2005, New Orleans, USA
"Cyclodextrin-modified capillary electrophoresis determination of steroids"
Yuliya Shakalisava and Fiona Regan
4. Analytican Forum 2005, Plymouth, UK
"Advantages of cyclodextrins in the development of novel generic methods for the
determination of steroid hormones by capillary electrophoresis"
Yuliya Shakalisava and Fiona Regan

5 . Microscale Bioseparations 2006, Amsterdam, Netherlands
"Development of capillary electrophoresis method for the detmination of related
impurities in montelu kast sodium"
Yuliya Shakalisava and Fiona Regan
6. MicmScale Bioseparations 2006, Amsterdam, Netherlands
'The potential of cyclodextrin in developing generic buffers for the separation of
steroids"
Yulfya Shakaiisava and Fiona Regan
7. ITP 2006, Paris, Fmce
"Determination of antiashatic colnpounds by capi IIary electrophoresis"
YuIiya Shakalisava and Fiona Regan

Available online at www.sciencedirect.com
Analytica Chimica Acta 540 (2005) 103-110
ANALYTICA CHIMICA Am
Rapid simultaneous determination of alkylxanthines by CZE and its application in analysis of pharmaceuticals and food samples
Fiona Regan*, Yuliya Shakalisava School of Chemical Science, Dublin C i p Universip, Glasnevin, Dublin 9, Ireland
Receivcd 2 July 2004; received in revised form 13 October 2004; accepted 13 October 2004 Available online 23 December 2004
Abstract
Capillary electrophoresis (CE) offers the possibility of fast, cheap and reproducible separations for pharmaceutical preparations. Alkylx- anthines make up a family of compounds that are used in the treatment and prevention of bronchi asthma and chronic pulmonary disease. The group of analysed compounds include caffeine, dyphylline, theophylline, theobromine and enprofylline. This paper shows a simple capillary zone electrophoretic (CZE) method for separation of this group of xanthines. Using 20 rnM borate buffer at pH 9.4 as n~nning buffer at 55 'C it was possible to complete a total separation of a sample in 2 min. Limits of detection in the range 1.9-2.5 mg 1 ' were achieved with %R.S.D. of 0.0&0.22% ( n = 5). The technique is applied to a range of samples containing the analytes, including tablets and chocolate. Reproducibility (%R.S.D.) of the chocolate analysis technique by CZE was less than 4.5%. O 2004 Elsevier B.V. All rights reserved.
Kqvlvords: Capillary zone elctrophorcsis; Fast separation; Alkylxanthincs; Chocolate
1. Introduction
A family of compounds alkylxanthines (Fig. 1) that includes caffeine, theophylline and theobromine is very well known in pharmaceutical science due to the following prop- erties [l]: antiasthmatic, analgetic adjuvants, antitussives, bronchodilators, cardiac stimulants, cognition enhancers, diuretics, lipolytic agents, cancer chemotherapy adjuvants, treatment of cerebral ischemia, treatment of Parkinson's disease, renal failure. The freq~~ency of human consumption of this type of pharmacologically active compounds speaks for itself. Xanthines are present in all kinds of tea, coffee, carbonated beverages, chocolate and chocolate products and chewing gum [2]. Adding all these factors together, the necessity of quality control of pharmaceuticals and alkylxanthines contents of food becomes very important.
A large amount of articles have been published on HPLC analysis of alkylxanthines [3-71. In general, chroinatographic
* Corresponding author. Tel.: +353 1 7005765; fax: +353 1 7005503. E-mail address: [email protected] (F. Regan).
methods for the separation of alkylxanthines require a clean- up step prior to the analysis itself and at least 20 min for the last compound to elute. It takes less, only if a single compound is analysed [6]. Usually a UV detector is employed at 214, 230, 270-275 or 280nm [lo] and the limit of detection is approximately 50 ng ml-' . Relative standard deviation for caffeine ranged between 0.86 and 1.97% (intraday) and 1.04 and 3.90% (interday) [4].
While capillary electrophoresis has been reported to show successful separation of this group of compounds [8,9,11-171, lengthy capillary rinse times and pre-rinses make total analysis times long (Table 1). Due to the fact, that most of alkylxanthines are weak bases the alkali pH (Fig. 1) of several buffers (such as borate [9,18], phosphate [I 1,141, glycine [13,19] or a mixture of them [20]) is employed for the CE separation. Some separations use inicellar electrokinetic chromatography (MEKC) [8,9,12] thereby increasing the ne- cessity for lengthy rinses between the separations and irre- versible modification of the capillary takes place. MEKC is often necessary in order to determine the neutral compounds in this group [8,9,19].
0003-26701s -see front matter 0 2004 Elsevier B.V. All rights reserved. doi:10.10 161j.aca.2004.10.033

104 E: Regan, L: Shakalisava /Analytica Chimica Acta 540 (2005) 103-1 I0
R1
Theophylline -CH3
Theobrornine -H Caffeine -CH, Enprofylline -H
Dyphylline -CH3
The aim of this study was to develop a method of rapid simultaneous determination of alkylxanthines using capillary zone electrophoresis. To select the optimum conditions the following factors were investigated: buffer composition, the effects of pH, buffer concentration, voltage of separation, hy-
R3 R7 pKa drodynamic and electrokinetic types of injection and temper- -CH3 -H ature of separation. The application of the proposed method -CH, -CH3 in the quality control of theobromine in chocolate samples -CH3 -CH3 14.0 and theophylline in commercial tablets were studied. -CH,CH,CH, -H 8.4
Fig: 1. Chemical structures and pK, values of some alkylxanthines [8,9]. 2. Experimental
Each of the analytical techniques for the detrmination of alkylxanthines have advantages and disadvantages. Thus, both chromatographic and spectroscopic methods require a sample pretreatment step, while some of the CE samples can be injected directly. They can reach very low limits of de- tection; and this is advantageous when the concentration of target compounds is low. A disadvantage of the chromato- graphic technique is a long time of analysis, up to 20 min, while CE methods can take just a few minutes [11,13], and sometimes methods are coinplicated with the necessity to change the composition of the mobile phase [5]. Chromato- graphic methods require expensive equipment compared to some CE systems. The problem with spectroscopic methods is that methylxanthines give high spectral overlap [21] when determined simultaneously and that is why this technique is poorly developed. All the methods are characterized with high reproducibility.
According to all the reasons noted above, capillary elec- trophoresis methods have a very high potential in the sepa- ration of alkylxanthines and, in the opinion of the authors, there is more potential for further improvement.
2.1. Reagents
All analyte compounds investigated in the separations had purity 99% and were used without further purification. Caf- feine, theophylline, dyphylline (7-[2,3-dihydroxypropyll- theophyllin), enprofylline (3-propylxanthine), theobromine (3,7-dimethylxanthine), sodium phosphate (monobasic and dibasic), HCl, NaOH, methanol (HPLC grade were pur- chased from Sigma-Aldrich, Dublin, Ireland. Boric acid was from Riedel-de Haen, Seelze, Germany. Buffers were pre- pared using distilled water and adjusted using 1 and 0.1 M NaOH and 0.1 M HCL.
2.2. Equipment
All separations were performed using an Agilent CE In- strument. The PDA detector range was 190-600 nm. The CE instrument was operated using Agilent CheinStation soft- ware. The fused silica capillaries (Composite Metal Services Ltd., The Chase, Hallow, Worcs. WR26LD) were 56.3 cm long (48.3 cm to the detector) with an i.d. 50 km.
Table 1 Comparison of analysis time of different CE methods for the dctennination of xanthines
Analy tes Mcthod Time of run (min) Rinsing between luns (min) Total time of analysis (min)
Caffeine, theobromine, paraxan- MEKC [ l 11 2 Not repolted -11- thine, thophylline Caffeine, theophylline, MEKC [9] 4 8 12 dyphylline Theophylline and its metabolites MEKC [12] 30 3 6 33-36 Caffeien, aspartame, asp-phe, CZE [13] 2 Two volumes - benzoic acid, phenylalanine Theophylline, ephedrine, pheno- CZE [14] 9 4 13 barbital Theophylline, enprofylline theo- MEKC [6] 8 6 14 bromine, caffeine, theophylline- 7-acetic acid, dyphylline, proxy- phyllinc, pentoxifylline Caffeine, thcobromine, MEKC [ I 51 10 10 20 thcophylline Caffeine, theobromine, MEKC [ 1 61 13 Not Reported - theophy lline Caffeine, theobromine, CZE [17] 16 Not reported - theophylline, adenine, guanine, hypoxanthine, xanthine, uric acid

I? Regan, K Shakalisava /Analytica (
2.3. Standards
3himica Acta 540 (2005) 103-110
3. Results and discussion
Stock solutions of lOmM caffeine, theophylline, dy- phylline, 2mM stock of theobromine and 1 mM stock of enprofylline were prepared using distilled water. Stock so- lutions were stored in a refrigerator.
2.4. Procedure
All buffers were filtered through a 0.2 pm filter before use. Xanthines were detected at 200 nm, where all exhib- ited maximum absorption. Separations were carried out at 30 kV electrophoretic voltage and temperature 25 "C, un- less otherwise stated. Conditioning between runs included a rinse of 0.1 M NaOH for 2 min, water for 5 min, run- ning buffer for 5 min, unless otherwise stated. It is ad- visable to rinse the capillary with 1 M HCl, 1 M NaOH, MeOH, distilled water and running buffer once a day (be- fore the analysis). All separations were repeated at least three times.
2.5. Sample preparation
2.5.1. Chocolate The sample preparation technique was taken directly from
[22] and was not further optimized in this work. Pieces of chocolate were placed into a mortar and pes-
tle. Liquid nitrogen was poured over the chocolate to freeze it, allowing it to be ground into a fine powder. One gram of this chocolate powder was measured out using an analyt- ical balance, and 5 ml of chloroform was added to a coni- cal flask and the flask was covered. This sample was placed in a sonicator for 50min until the solution became a sus- pension of very small particles. A syringe and a 0.22 pm filter were used to remove any large or precipitated par- ticles. About 2.5 ml of the filtered extracted solution was transferred into another vial. The chloroform was evaporated by placing the vial into a warm water bath and blowing an air stream over it. About 10 ml of ethanol was added to the vial following the evaporation, and a gentle swirling action was applied to dissolve the crystals of the compounds in the ethanol. The dissolved ethanol solution was placed into an HPCE vial using a micropipette, while taking care to avoid transferring any of the cocoa butter (insoluble in ethanol) into the vial. The vial was placed into the auto sampler for analysis.
2.5.2. Pharmacezitical tablet Each of 10 commercial tablets containing 300 mg of theo-
phylline was weighed and ground to afine powder. One sam- ple of 0.01 g of each tablet powder was weighed and placed in 100 ml volumetric flasks, filled with water and then son- icated until dissolved. The solutions were filtered through a 0.22 pm filter and transferred to the vials that were placed into the autosampler for CE analysis.
3.1. Running buffer conditions
CZE technique involves the use of a simple electrolyte buffer system for the separation of charged compounds. Bo- rate buffer has to be employed in the separation of the mixture of compounds where dyphylline is present. Dyphylline is a derivative of theophylline with the CH2CHOHCH20H rad- ical at N7 (Fig. 1). Its pK, is 11.6, therefore it is a neutral compound and in CZE it migrates with EOF, like caffeine. Even a high pH near 12 does not deprotonate dyphylline and it cannot be separated from caffeine this way. The specific re- action of borate ions with vicinal diols (such as dyphylline) is known [23,24]. The complexation with borate ions in the BGE generates charge on the dyphylline molecules and that is how it emerged after EOF although it possessed no ionizable chemical group [8].
The effect of pH of the running buffer was investigated for the separation of caffeine and theophylline. Borate buffer was studied in its working range between pH 8 and 10. Electropherogramms showed that longer migration times resulted at high pH. Similar effect was obtained from the increase of concentration (10-100 mM borate) of the borate buffer. This is reported due to a decrease in the magnitude of the EOF that has been correlated to a decrease in the zeta potential of colloidal silica [25]. The optimum concentration of borate buffer for the separation of five compounds was 20mM and pH 9.1. This was selected by comparing analyte resolution and migration time with each buffer composition.
A series of experiments were carried out in order to in- vestigate the influence of varying temperature on the separa- tion of analytes. The Agilent CE system is supplied with a thermostat, which allows the temperature of the cassette to be maintained at the 4-60 "C. The separation of the mixture was performed at 25, 35,45 and 55 "C. It was found that an increase in the temperature strongly affects the migration pa- rameters of the separation. The increase of the temperature of the cassette provokes the decrease in resolution of caffeine and dyphylline accompanied by peak broadening. As men- tioned above, the resolution of these two compounds is based on complexation of dyphylline with borate ions; as thought, with the temperature increase this complex becomes weaker, thereby leading to poorer resolution. Peaks were found to tail due to an increase in diffusion because of overall ele- vated column temperatures or radial gradients in tempera- ture. These temperature changes cause changes in the pH, mobility, distortion of the flat zone profile, and convection [261.
The positive effect of this study is that the migration time of the analytes decreases significantly with an increase in separation temperature. Further experiments showed that by increasing the pH of 20 mM borate buffer to 9.4 (previously 9.1) at 55 "C, the resolution of caffeine and dyphylline peaks reaches 1.5.

106 K Regan. K Shakalisavo /Analyticn Chimica Acta 540 (2005) 103-1 10
Table 2 Intcgration data for optimizing rinsing conditions between runs (n = 5)
Conditionsa N1 N2 N3 N4 N5 ~ 1 - 2 " R&5
I 48907 53547 113432 106452 1 17494 1.6 1.7 2 67412 70238 147768 149214 162165 1.8 2 3 88326 74792 239434 210579 225465 2 2.3 4 42588 47087 101726 80278 87721 1.5 1.4 5 38345 47801 110259 102368 103683 1.5 1.7
N: efficiency; R: resolution; 1: caffeine; 2: dyphylline; 3: theobromine; 4: enprophylline; 5: theophylline. a Condition: (I) rinsing before the injection with 1.5 min 0.1 M NaOH, then 1.5 min water following by 3 min buffer; (2) 1.5min 0.1 M NaOH+ 1.5min
water+2 rnin buff; (3) 1.5 min 0.1 M NaOH + 1.5 min water+ I min buff; (4) 1 min 0.1 M NaOH+ I min water + 3 min buff; (5) no rinse, just injection. b ~ 2 - 3 > 5 and R 3 4 > 17 in all cases
3.2. Injection type
CE requires only minute volumes of sample to be loaded into the capillary to maintain high efficiency [27]. Typi- cally the plug length of the sample should be 1-2% of the whole capillary length. Hydrodynamic and electroki- netic injections were investigated. A hydrodynamic injec- tion pressure of 50 Mbar was applied in the experiment for 1-6 and 10s. A parallel study of electrokinetic injection was curried out. The injections of 3, 5, 8, 10, 15 kV were applied for 5 s. Taking into account the resolution of caf- feine and dyphylline (resolution of dyphylline and theo- phylline peaks is more than 10) and the efficiency of all peaks, the optimum parameters of hydrodynamic injection are 1 s at 50 Mbar and an electrokinetic injection of 3 kV for 5 s. In this case hydrodynamic injection is somewhat more preferable.
3.3. Rinsing between runs
Many studies show lengthy rinse steps in CZE (Table 1). These add to the overall analysis time and are often not re- ported, thereby providing an ambiguous or false impression of the actual analysis times. A series of experiments were done to study the influence of capillary rinse between runs on the parameters of separation. As stated in Section 2.4, all experiments were initially accomplished with 2min 0.1 M NaOH, 5 min water, and 5 min buffer rinse before the injec- tion. Rinsing time was reduced with all possible combina- tions of rinses and finally it was found that rinsing could be excluded altogether. Final resolution of all peaks was at least 1.5 and efficiency was not affected significantly. Some of the results are presented in Table 2 including all five tar- get analytes. Further experiments were accomplished with- out rinsing between runs. It allowed a single analysis to be performed in less than 2 min. This is the shortest reported time for separation of caffeine, theophylline, dyphylline, enprophylline and theobromine by CZE to the author's knowledge.
3.4. Optimised system
Fig. 2 shows the optimised separation of caffeine, theophylline, dyphylline, theobromine and enprofylline.
The calibration graphs were established with the peak- area as ordinate versus the concentration in mgl-' as axis. From the slopes of the curves the method shows greater sensitivity toward theophylline determina- tion and least for enprofylline. The linear regression equations were obtained as follows: for caffeine assay: y = 17 .18~ - 0.7546, n = 5, R~ = 0.9977; for theophylline as- say: y =23.875x - 1.0807, n=5, R2 =0.9997; for dyphylline assay; y = 16.927~ - 1.6334, n= 5, R2 =0.9975; for theo- bromine assay: y =20.402x+ 0.0001, n = 5, R2 = 0.9991; for enprophylline: y =20.091x+ 0.0216, n = 5, R2 = 0.9995. The data indicates good linearity of the method over the stud- ied range of 1.9-1900 mg 1-' for caffeine and theophylline, 1.8-1800 mg I-' for dyphylline, 2.5-250 mg 1- for theo- bromine and 1.8-180 ing I-' for enprofylline. Table 3 rep- resents data on repeatability of the method. Here three concentrations are shown (each measured in triplicate) and %R.S.D. for all measurements are below 5%. Re- sults show that in general at higher analyte concentra- tions in each case %R.S.D. values improve with the exception of enprofylline. Relative standard deviations of the migration time and peak area of analytes and LODs are shown in Table 4. Here it can be noted that acceptable %R.S.D. were achieved. Limits of detection for the study varied between 1.8 and 2.5 rnglp'. This range is ideally
migration time, min
Fig, 2. Separation of mixture of five compounds. Peak identifi- cation: 1 =caffeine; 2 = dyphylline; 3 =theobromine; 4 = enprophylline; 5 = theophylline. Concentration of each co1npound=0.05 mM. Separation conditions: 20 mM boratc, pH 9.4.30 kV, 55 'C, capillary 56.3 cm (48.3 cm to the detcction window), 50 Frn i.d., detection at X = 200 nm. Injection con- ditions: 50 Mbar for I s.

I? Regan, 1 Shakalisava / Anabtica Chimica Acta 540 (2005) 103-1 10 107
Table 3 Data on repeatability of the method
- -
Concentration known (mM) Concentration found (mM) R.S.D. (%) 95% confidence interval
Caffeine (n = 3) 0.5 1 5
Theophylline (n= 3) 0.5 0.5201t0.016 1 1.045f0.017 5 5.090 f 0.056
Dyphylline (n=3) 0.5 1 5
Theobromine (n = 3) 0.1 0.5 I
Enprofylline (n = 3) 0.1 0.107 f 0.007 0.5 0.509 f 0.006 0.8 0.793 f 0.017
-
suited for determination of the samples under investi- gation, as discussed later. LOD values are selected on the basis of a signal that is three times baseline noise measurement.
3.5. Application
3.5.1. Chocolate Methylxanthine has previously been determined in differ-
ent types of food and beverages. The majority of research has focused on the analysis of methylxanthines in coffee, tea and cola beverages [28]. Less data exist on methylxanthine con- tent of chocolate products. To the authors knowledge there is no information about the CE method being employed in the analysis of methylxanthines in chocolate. And thus this work is the first determination of theobromine in chocolate by CZE.
Eight different chocolates from three brands and one type of cocoa powder were analysed (Table 5). As ex- pected, theobromine was determined in all samples of milk, dark chocolate and cocoa powder, but not in the sam- ples of white chocolate. Fig. 3 shows electropherogramms
Table 4 Relative standard deviations of the migration time and peak area of analytes, LOD (n=5)
h a l y t c Migration %R.S.D. Peak %R.S.D. LOD time (min) area (mg I-' )
Caffeine 1.28 0.10 3.4 1.67 1.9 Dyphylline 1.32 0.06 3.5 1.42 1.8 Theobromine 1.42 0.14 4.7 1.24 2.5 Enprofylline 1.8 1 0.22 1.0 3.54 1.8 Theophylline 1.85 0.1 1 4.9 2.06 1.9
of the white chocolate "Milkybar", milk chocolate "Bub- bly" and dark chocolate "Bournville". It is immediately ob- vious from the electropherograrnm that the concentration of theobromine in dark chocolate is higher than in milk chocolate.
The time of a single analysis is less than 2min. The concentrations of theobromine in all the samples are rep- resented in the bar chart shown in Fig. 4 and com- pared to the amount of cocoa solids in the chocolate bars.
The highest concentration of theobromine in cocoa pow- der corresponds to 100% of cocoa solids in it. Then 1.46 mg g-' concentration of theobromine in dark choco- late "Bournville" lies very close to 39% of cocoa solids. All samples of milk chocolate with 20-25% of cocoa solids have some variations in the theobromine concentration. Nes- tle chocolate "Aero All BubbleH(mint) contains noticeably less theobromine. This is due to the nature of this chocolate, which consists of mint part and milk chocolate outer coating. There is no data on cocoa solids contained on the product,
Table 5 Samples of chocolate analyscd
Name of chocolate Type of chocolate -
Cadbury "Bubbly" Milk Cadbury "Boumville" Dark Ncstle "Milkybar" White Nestle "Aero All Bubble" Milk Nestle "Aero All Bubble" Milk and mint Cadbury "Buttons" Milk Cadbury "Buttons" White Teny's "Orange" Milk Cadbury "Cocoa" Cocoa powder

I? Regan, K Shakalisnva /Annlyrica Chimicn Acta 540 (2005) 103-110
Fig. 3. Elechopheroframms oftheobromine determination in chocolate samples. Peak identification: I =caffeine/EOF; 2 =ethanol; 3 = theobromine. Separation conditions and injection conditions as in Fig. 2.
m AU 8
6
4
2
0
-2 - -4 - -6
but it is obvious that it is only the chocolate part that contains it.
Table 6 represents statistical analysis of the data obtained. Relative standard deviation for peak area is less than 5%, while the %R.S.D. of the extraction is over 5%, and espe- cially high in the case of Nestle "Aero All Bubble" (mint) (%R.S.D. 15.02). The reason for this is the heterogeneous nature of the sample. As previously stated, the extraction method was not optimised since it is not the objective of this work.
M~lkybar
-w-
. . . . , . . . , 1 - " 1 "" ' . '
0 theobromlne concentration, mglg I cocoa sol~ds m ~ n l m u m ~ , %
Fig. 4. Concentration of theobromine and cocoa solids in analysed samplcs: (a) information taken from the wrapping; (b) no data.
rn AU
3.5.2. Pharmaceu~ical tablets A tablet sample containing 300 mg theophylline was anal-
ysed using the optimized method. An electropherograrnm of the commercial sample is shown in Fig. 5. A single analysis is completed in less than 2 min. Theophylline is the only peak in this separation. Analytical results for content uniformity of theophylline tablet obtained from a commercial source are shown in Table 7. The analytical values (% claimed content) obtained were found to be between 95.0 and 105.0%, which falls within the range of 94.0-106.0%, required by the USP 25 for theophylline [29].
0 25 0 5 0.75 1 1 . h , [:-,: 2
Table 6 Relative standard deviations of CE analysis and extraction (n=3)
Sample Run # Area Extraction (%R.S.D.) I%R.S.D.I
Nestle "Aero All Bubble" 1 2.94 5.81 2 2.86 3 0
A
Nestle "Aero All Bubble" mint 1 4.35 15.02 2 0 3 3.46
6-
4 - 2 -
-2 - -4 -
mAU 12 -
Bubbly
0 - 7 - -
8 -
b
I
4 - 1
2 I " " ' # > ' " # . - " T ' - " l "
0 25 0 5 0.75 1 1 25 1 5 1 75 2 3
Bournv~lle
E 0
-4 -
-- L--
0 25 0.5 0 75 4 1.25 1'5 1 75 2 mlgrat~on t ~ m e , mln

E Regan, Z Shokalisava / Analytica Chimica Acta 540 (2005) 103-110
0.25 0.5 0.75 1 1.25 1.5 1.75 2
migration time, min
Fig. 5. Electropherogramm of commercial sample. Peak identification: 1 = theophylline. Separation conditions and injection conditions as in Fig. 2.
Table 7 Analytical results for content uniformity of theophylline tablet obtained from a commercial sourcc
Tablet" Amount found"mg) Claimed content (%)
I 292.6 f 5.2 98 2 304.3 k 14.9 101 3 291.9 f 6.3 97 4 303.9 f 20.6 101 5 2 9 7 . 0 f 11.0 99 6 315.4f 13.0 105 7 292.6 f 2.6 98 8 289.3 f 5.4 96 9 293.3 f 9.7 98 10 283.6 f 9.6 95
Mean (%) 99 S.D. 2.9
-
a Labeled amount or theophyllinc in each tablet is 300mg. M e a n f S.D. (n=3).
4. Conclusions
The CZE method was developed for detelmination of caffeine, theophylline, dyphylline, theobromine and enpro- fylline. The main advantage of this method is a very short (less than 2 min) full time of a single analysis. It is the short- est reported time of analysis of above mentioned components by CZE to the author's knowledge. The peculiarities of the method are as follows: caffeine cannot be determined if other neutral components are present that migrate with EOF (then MEKC must be employed). If dyphylline is analysed, sam- ples must be dissolved in the borate buffer with concentration and pH close to the run buffer (20 mM borate pH 9.4).
This method has been shown to be a good alternative tech- nique to HPLC and will be usehl for quality control in phar- maceutical and food industries.
Acknowledgements
References
[I] J.W. Daly, J. Autonomic Nervous Syst. 81 (2000) 44. [2] R.P. Oda, J.P. Landers, in: J.P. Landers (Ed.), Handbook of Capillary
Electrophoresis, CRC Press, 1994 (Chapter 2). [3] D.T. Holland, K.A. Godfredsen, T. Page, J.D. Connor, J. Chromatogr.
B 707 (1998) 105. [4] Y.-R. Ku, K.-C. Wen, L.-K. Ho, Y.4. Chang, J. Pharm. Biomed.
Anal. 20 (1999) 351. [5] K.A. Georga, VF. Samanidou, LN. Papadoyannis, J. Chromatogr. B
759 (2001) 209. [6] H. Horie, A. Nesumi, T. Ujihara, K. Kohata, J. Chromatogr. A 942
(2002) 27 1. [7] H. Schnieder, L. Ma, H. Glatt, J. Chromatogr. B Analyt. Technol.
Biomed. Life Sci. 789 (2) (2003) 227-237. [8] M. Blanco, I. Valverde, J. Chromatogr. A 950 (2002) 293. [9] W.-S. Huang, S.4. Lin, H.L. Wu, S.-H. Chen, J. Chromatogr. B 795
(2003) 329. [lo] E. Schreibcr-Deturmeny, B. Brugucrolle, J. Chromatogr. B 677
(1996) 305. [I I] Y. Zhao, C.E. Lunte, J. Chromatogr. B 688 (1997) 265. [I21 Z.-Y. Zhang, M.J. Fasco, L.S. Kaminsky, J. Chromatogr. B 665
(1995) 201. [I31 J.C. Walker, S.E. Zaugg, E.B. Walker, J. Chromatogr A 781 (1997)
481. [I41 A. Haque, X. Xu, J.T. Stewart, J. Pharm. Biomed Anal. 21 (1999)
1063. [I51 C. Vogt, S. Conradi, E. Rohde, J. Chem. Educ. 74 (1997)
1126. [I61 A. Wang, L. Li, F. Zang, Y. Fang, Anal. Chem. Acta 419 (2000)
235. [17]S.E. Geldart, P.R. Brown, J. Chrornatogr. A 831 (1999)
123. [I81 H. Horie, T. Mukai, K. Kohata, J. Chromatogr. A 758 (1997)
332. [I91 T. Hyotylainen, H. Sirtn, h.1.-L. Rickkola, J. Chromatogr. A 735
(1996) 439. [20] I.M. Johansson, M.-B. Gron-Rydberg, B. Schmekcl, J. Chromatogr.
A 652 (1993) 487. [21] L. Lbpez-Martinez, P.L. L6pez-de-Alba, R. Garcia-Campos, L.M. De
Lebn-Rodriguez, Anal. Chem. Acta 493 (2003) 83. [22] http:l/www.depts.dre~v.eddgovschVGSS2002lteamsltea1n7.htm. [23] S. Hoffstetter-Kuhn. A. Paulus, E. Gassman, M.H. Widmel; Anal.
Chem. 63 (1991) 541. [24] T. Soga, Hewlett-Packerd Application Note: Capillary Zone Elec-
trophoresis of Carbohydrates By Borate Complexation Utilizing EOF The authors would like to acknowledge the Innovation Reversal, Hewlett-Packard, 1995.
Partnership grant, Enterprise Ireland for funding this re- [25] B. Van Oman, G. Liversidge, G. McIntire, J. Microcol. Sep. 2 (1990) search. 176.

UG] RJ. Nelson, D.S. Butgi, in: f.s! Lnndcrs CEd.), Handbook of Cnpil- p8] G.A. Spillcr. in: G.A. Spillcr (Ed.), Basic Metabolism nnd Physio- law Elcctmphatcsis. CRC Prcss. 1994 (Cllaptcr 2 1). logical Erects of lhc Mcthylxnnthines, CRC P a s , Bocn Raton. FL,
[2TJ D.N. 14eigr. Applicntion of Ilcwlctt-Pacbrd 3D Cnpillnry 1998. ElucrmpI~orcsis systcm, Hcwlctt-hekard, IVaIdbronn. Gcrrnany, p9] US Pbamacopcicia 25-Nntional Formulsry 20. Asinn, United SWcs 1992. Pharrnacopeinl Convcnlion Jw.. MD, 2001.

Yuliya Shakalisava Fiona Regan
Electrophoresis 2006,27, 3048-3056
Research Article
School of Chemical Science, Dublin City University, Dublin, Ireland
Received November 17,2005 Revised January 19,2006 Accepted January 26,2006
Determination of association constants of inclusion complexes of steroid hormones and cyclodextrins from their electrophoretic mobility
CE estimation of the association constants of several steroid hormones with P-CD and y-CD and their hydroxypropyl derivative is presented. Estriol, 17P-estradiol, ethynyl- estradiol, estrone, progesterone, mestranol and norethindrone are among the target analytes. The calculation of the cyclodextrin:analyte association constants were per- formed from the electrophoretic mobility values of steroids at different concentration of CDs in the run buffer. The reliability of the final data was ensured by employing three different linearisation plots (double reciprocal fit, Y-reciprocal fit and X-reciprocal fit). The highest inclusion affinity of target analytes was observed towards y-CD and its hydroxypropyl derivative, which is demonstrated by high association constant values and corresponding good linearity of the plots. The affinity of steroids towards a par- ticular CD type based on physical and structural characteristics is explored.
Keywords: Association constants / Cyclodextrins / Steroid hormones DO1 10.1002/elps.200500842
1 Introduction
There is considerable analytical interest in the determina- tion of steroids. This interest is due to their physiological functions in the body and the potential danger in disrup- tion of the endocrine system. Structures of the target steroid analytes are shown in Fig. 1. A number of different techniques have been previously employed in the separation of steroids; these include immunoassays [I] , chromatographic [2, 31 and CE [4] techniques from a variety of sample matrices. An LC technique does not require compounds to be volatile or to have high molecu- lar weight like those requiring GS-MS determination. The limitations of LC techniques include high solvent volumes and the need for gradient elution.
Several publications show the enhanced selectivity of HPLC methods for steroids when CDs are employed as a chiral stationary phase [5, 61 or in the mobile phase [7, 81.
Correspondence: Dr. Fiona Regan, School of Chemical Science, Dublin City University, Glasnevin, Dublin 9, Ireland E-mail: Fiona.reganQdcu.ie Fax: +353-01-700-5503
Abbreviation: HP, hydroxypropyl
@ 2006 WILW-VCH Verlag GmbH &Go. KGaA, Weinheim
Recent studies [9,10] in CE have shown the advantage of CDs in the run buffer to aid separation of closely eluting compounds. Thus Munro and co-workers [9] investigated the enhancement in sensitivity of CE for the analysis of I7P-estradiol, estrone and estriol when charged CD- mediated sample stacking was employed. Work carried out by Poole [I 01 studied separation of ten steroids with a-CD, P-CD and y-CD in the run buffer. The addition of 20 mM r-CD to the 20 mM sodium borate-sodium phos- phate buffer (pH 8) containing 50 mM SDS did not improve resolution of any ten analytes. While 20 mM a-CD in the run buffer separated nine peaks out of ten al- most to baseline resolution. When 20 mM 71-CD was used in place of P-CD significant changes in the migration order of analytes were observed and baseline resolution of all ten estrogens was obtained. It is difficult to judge the migration times of peaks from the figure in the paper but most of the compounds had shorter migration times with y-CD, while 17u-dihydroequilin and equilin had longer migration time. Chan etal. [4] have shown the separation of ten estrogens with 20 mM y-CD in the run buffer. Even though the separation of all analytes was achieved the reason for choosing the concentration of I/-CD to be 20 mM was not explored as well as the change in the migration order of analytes with P- and y-CD.

Electrophoresis 2006, 27, 3048-3056 CE and CEC 3049
[ I ] Estriol
- [7] Progesterone
o &- [6] Norethindrone
H P &=cH [8] Mestranol
Figure 1. Structures of steroids.
CDs are truncated cone-shaped molecules with a hollow, tapered cavity, which posses a hydrophobic property. It is known that various organic molecules form inclusion complexes with CD [ I I]. Fundamental knowledge of equilibrium and the association constants of analysed compounds and ligand in the system is a powerful ele- ment in the understanding of that system and in dis- covering ways to evaluate it.
The association of CD C and analyte molecules A, and the dissociation of the formed complex AC are controlled by equilibrium for a 1 : I complexation scheme [ I 21:
where A, C and AC are the free analyte, CD and the com- plex, respectively.
The model of that complexation was reviewed in the literature [I 2, 131. The mobility of analyte pa at any given concentration of the ligand [C] equals
1 K[Cl pa - - [Lf + -
1 + K [C] 1 + K [C] ILC
where pf is the free analyte mobility, p, is the complexed analyte mobility, and K is the association constant.
This expression can be rearranged in order to linearise it in a several ways [ I 41:
The data can be transformed into a double-reciprocal plot of 1 /(pa - pd versus 1 /[GI.
From this plot the apparent binding constant K = intercept/ slope.
(B):
This equation leads to Y-reciprocal plot of [C]/(pa - pf) versus [C]. From there K = slopelintercept.
This leads to the X-reciprocal plot of (pa - pf)/[C] versus (11, - pf), where K = -slope.
The association of steroid hormones with certain types of CD was studied by Sadlej-Sosnowska [14, 151 using HPLC and the binding constants of analyte-CD equilibri- um were determined. Several papers [16-181 have demonstrated that different techniques for the determi- nation of association constants give rather different results, which is likely to be due to the differences in the experimental conditions required by each one. To the authors' knowledge the association constants for ster- oids and CDs have not previously been determined from CE separation data. The aim of this work is to fill this gap, as this data has a high importance in the understanding of the electrophoretic behaviour of analytes in the presence of CDs in the run buffer.
2 Materials and methods
2.1 Reagents
All analyte compounds investigated in the separations had purity of 99% and were used without further purifi- cation. Estriol, estrone, 17p-estradiol, ethynylestradiol, equilin, norethindrone, mestranol, progesterone, p-CD, yCD, 2-hydroxypropyl (HP)-p-CD (degree of substitution -4-1 O), 2HP-y-CD (molecular substitution -0.6), sodium phosphate (dibasic), HCI, NaOH, methanol (HPLC grade), SDS were purchased from Sigma-Aldrich (Dublin, Ireland). Buffers were prepared using distilled water and adjusted to the desired pH using 1 M and 0.1 M NaOH.
O 2006 WILEY-VCH Verlag GmbH & Co. KGaA, Weinheim

3050 Y. Shakalisava and F. Regan Electrophoresis 2006, 27, 30484056
2.2 Equipment
All separations were petformed using an Agilent Technol- ogies 30CE system (Agilent Technologies). Data acquisi- tion and signal processing were performed using Agilent Technolodies 30CE ChemStation (rev. A.09.03, Agilent Technologies). The fused-silica capillaries (Composite Metal Services, UK) were 53.7 cm long (45.5 cm to the detector) with an internal diameter of 50 pm.
2.3 Standards
Stock solutions of estriol, estrone, ethynylestradiols, 17P- estradiol, equilin, norethindrone, mestranol and proges- terone were prepared in methanol in a concentration of 1 mM. Stock solutions were stored in the dark and eve- poration of methanol from the flasks was prevented.
2.4 Separation conditions
The electrophoretic buffer consisted of 20 mM phosphate pH 11.5 and 10 mM SDS. P-CD, y-CD, 2HP-P-CD, 2HP- y-CD were added to the buffer separately in a range of five concentrations from 1 mM to 10 mM. Separations were carried out at 30 kV electrophoretic voltage and at a tem- perature of 20°C. Injections were carried out hydro- dynamically at 50 mbar for 2 s. UV detection was at 214 nm and 254 nm. The concentration of each analyte in a mixture was 0.125 mM in methanol. Conditioning of the CE capillary between runs was performed with 0.1 M NaOH for 2 min and run buffer for 2 min. All separations were repeated at least three times.
2.5 Data evaluation
All migration times were converted to the mobility using following equation [ I 91:
11, = IltE = ILAV (6)
where pa = 11, + p,,, V is the applied voltage, I is the effective capillary length (to the detector), L is the total capillary length, t is the migration time and E is the electric field. The mobility data plots were calculated using Microsoft Excel.
3 Results and discussion
The theory of the formation of inclusion complexes was reported to be only valid for cases of 1: l stoi- chiometry [12]. A number of steroid hormones, includ- ing four of the target analytes in this work (estriol, 17P-
estradiol, estrone and ethynylestradiol), have been investigated by Sadlej-Sosnowska [14, 151. The conclu- sion was that 1 :1 stoichiometry applies to the complexes of studied steroids with P-CD and y-CD. Due to the high structural similarity of steroids it was assumed in this paper that inclusion of equilin, mestranol, norethindrone and progesterone follows the same scenario.
Throughout the series of experiments, the run buffer composition was held constant (except for CD type and concentration which were varied). The presence of sur- factant (SDS) and pH 11.5 requires explanation. Com- pounds 1-5 (as in Fig. 1) were in their deprotonated form at this pH because their pKa value lies between 10.26 and 10.71 [20, 211. The structures of mestranol, nor- ethindrone and progesterone pointed to even higher pKa values (pKa = 13.1 for mestranol [22]) and thus they were neutral at the conditions of separation. Such close pKa magnitudes and molecular weights of steroids did not allow their separation in a simple mode of capillary zone electrophoresis. All target analytes were quite hydro- phobic. The calculated logKO, values are 2.81, 3.22, 3.43, 3.94, 4.12, 4.68, 2.99 and 3.67, for estriol, equilin, estrone, 17P-estradiol, ethynylestradiol, mestranol, nor- ethindrone, and progesterone respectively (http:I/ www.syrres.com/esc/kowwin.htm). The latter provokes their interaction with the micelles in the run buffer as well as CDs when added. Thus two equilibria were involved, the analyte-micelle and analyte-CD interaction. The presence of the micelles in the run buffer was necessary in order to observe the difference in the mobility of ana- lytes while adding neutral CDs. The top electro- pherogram in Fig. 2A represented the separation of tar- get estrogens at primary conditions, e.g. without CD. It could be seen that analytes reached the detector win- dow after the electro osmotic flow; association with negatively charged micelles was the reason for their migration towards the anode, which was against the EOF in this separation mode.
According to Rekharsky and lnoue [I I ] any differences in the free analyte's interaction with the buffer prior to inclu- sion complexation did not contribute measurably to the complexation thermodynamics. Since the concentration of SDS was held constant at every separation, the true effect of CD was seen while adding it at different con- centrations. The separation with 1 mM of each CD is shown in Figs. 2E-E. The change of the migration time of analytes clearly demonstrated the occurrence of analyte- CD interaction. The mobility changes were more signifi- cant in the case of y-CD and 2HP-y-CD than P-CD and 2HP-P-CD. Analyte mobility was increased due to the interaction with neutral CDs and the attraction to the anode was lower.
C 2006 WILEY-VCH Verlag GmbH & Co. KGaA, Weinheim

Electrophoresis 2006,27, 3048-3056 CE and CEC 3051
6 7+ 8 Figure 2. Electropherogram of
I - 1 separation of 8 steroid hor-
2 3+4 mones. Separation conditions:
I hn 5 20 mM phosphate buffer
C 6 7 8 pH 11.5 and 10 mM SDS, (A) no A CD added, (8) 1 mM P-CD, (C)
I mM 2HP-P-CD, (D) I mM y-CD, (E) I mM 2HP-y-CD; separation voltage 30 kV; capil-
7 8 lary 53.7 cm (45.5 cm is effec-
d tive length), 50 prn id; 20°C; hydrodynamic injection 2 s; UV detection 214 nm. Concentra- tion of each analyte is 0.1 25 mM
a in methanol. Peak identification: 6 crt]7,, 1 - estriol, 2 - equilin, 3 -
C estrone, 4 - 17P-estradiol, 5 - ethynylestradiol, 6 - norethin-
I I 1 1
2 6 8 drone, 7 - progesterone, 8 - ~igra t ion t ime, min mestranol.
Association constants were calculated from the mobility 3.1 y-CD values of estrogens, which were determined at 1 mM, 3 mM, 5 mM, 7 mM and 10 mM of each CD in the run buffer. The calculated values of the constants determined by three linearisation methods are given in Tables 1-4 along with R2 of each plot and % RSD. The association constants for a single compound obtained using the plotting methods show quite different values. Regardless of that fact, the same relative order of the constants within the same plotting method was observed for each com- pound. The exception to this case is shown in Table 1 . For 17p-estradiol and estriol the relative values for the double reciprocal fit data differed from Y-reciprocal and X-reci- procal fit. It was shown previously by Rundlett and Arm- strong [23] that at low ligand concentrations (in this case CD) the double reciprocal fit masks deviations from line- arity. The data obtained in this work indeed proved this to be the case as R2 values for the double reciprocal fit for each complexation shows good linearity. The negative association constant values however, pointed to the lack of inclusion of the analytes (progesterone and mestranol) with the CD. This leads to the conclusion that the Y- and X-fits are more reliable in assessing analyte (steroid)- ligand interaction.
From thisstudy itwas found thatthe highest magnitudes of association constants belong to the inclusion of target steroids in y-CD Fable 1). The diameter of the inside cavity of y-CD was 10 a, which is more sterically suitable for the 4-ring conventional structure of analytes than p-CD [24] with the diameter 8 a. Large association constants of 331 M-' (Y-reciprocal fit) for equilin and up to 1770 M-' (X- reciprocal fit) for ethynylestradiol were observed.
The double reciprocal fit and the Y-reciprocal fit were found to have R2 values in the range of 0.9797-0.9989. The relative standard deviations were obsewed to be less than 3.5% for the association of compounds 1-5. The latter demonstrated that the analyte inclusion process took place with the CD and its stoichiometry was 1: l . It should be noted that the R2 value for the X-reciprocal fit for those compounds lay in a lower range (R2 = 0.8969- 0.9665) of linearity. The effect of varying the CD con- centration on the mobility was most pronounced using the X-reciprocal fit compared with other linearity approa- ches. The latter is due to the plot parameters of (11, - pJ/
[C] versus (11, - kt?). The concentration range chosen for the plots also affects the R' values obtained.
C2 2006 WILEY-VCH Verlag GmbH & Co. KGaA, Weinheim

3052 Y. Shakalisava and F. Regan Electrophoresis 2006,27, 3048-3056
Table 1. The value of association constants of target steroids and y-CD, R2 for each linearisation method, % RSD (n = 3) and literature values of constants
K (M-') % RSD R2 K (M-') [ I 51
Estriol Double reciprocal fit Y-reciprocal fit X-reciprocal fit
Equilin Double reciprocal fit Y-reciprocal fit X-reciprocal fit
Estrone Double reciprocal fit Y-reciprocal fit X-reciprocal fit
170-Estradiol Double reciprocal fit Y-reciprocal fit X-reciprocal fit
Ethynylestradiol Double reciprocal fit Y-reciprocal fit X-reciprocal fit
Norethindrone Double reciprocal fit Y-reciprocal fit X-reciprocal fit
Progesterone Double reciprocal fit Y-reciprocal fit X-reciprocal fit
Mestranol Double reciprocal fit Y-reciprocal fit X-reciprocal fit
Negative values of constants for progesterone and mes- tranol, along with poor linearity and precision, pointed to the fact that these steroids did not interact with y-CD or the nature of interaction was something other than inclu- sion. Inclusion of norethindrone was characterised by the association constant 75 M-' (X-reciprocal fit) with % RSD less than 5% and linearity 0.73.
Rekharsky and lnoue [ l l ] attributed the following con- tributions to the stabilisation of CD complexes from a thermodynamic point of view: a) penetration of the hydrophobic part of the guest molecule into the CD cavity, b) dehydration of the organic guest, c) hydrogen-bonding interaction, d) the release of the water molecules origi-
Table 2. The value of association constants of target steroids and P-CD, R2 for each linearisation method, % RSD (n = 3) and literature values of constants
Estriol Double reciprocal fit Y-reciprocal fit X-reciprocal fit
Equilin Double reciprocal fit Y-reciprocal fit X-reciprocal fit
Estrone Double reciprocal fit Y-reciprocal fit X-reciprocal fit
17p-Estradiol Double reciprocal fit Y-reciprocal fit X-reciprocal fit
Ethynylestradiol Double reciprocal fit Y-reciprocal fit X-reciprocal fit
Norethindrone Double reciprocal fit Y-reciprocal fit X-reciprocal fit
Progesterone Double reciprocal fit Y-reciprocal fit X-reciprocal fit
Mestranol Double reciprocal fit Y-reciprocal fit X-reciprocal fit
K (M-') % RSD R2 K (M-') [15]
4700 t_ 400 43 71.23 0.9976 57 35.86 0.8621 56 39.09 0.7621
nally included in the CD cavity to bulk water [25-271 and e) the conformational changes or strain release of the CD molecule upon complexation [28-301.
According to the factors listed above the possible rea- sons for strong inclusion of compounds 1-5 and weak or absence of inclusion for compounds 6-8 should be explained by referring to the differences in structural characteristics of the complexes, i.e. structures of ster- oids incorporated into a CD type, which was kept con- stant. According to the literature hydrophilic groups, such as hydrohxyl, amino and carboxyl[31], remain exposed to the bulk solvent even after inclusion of the hydrophobic moiety [ I l l . An exception to this general rule is the
O 2006 WILR-VCH Verlag GmbH & Co. KGaA. Weinheim

Electrophoresis 2006, 27, 3048-3056 CE and CEC 3053
Table 3. The value of association constants of target steroids and 2HP-y-CD with two run buffers containing 10 mM SDS and 20 mM SDS, R2 for each linearisation method, % RSD (n = 3).
10 mM SDS 20 mM SDS
Estriol Double reciprocal fit Y-reciprocal fit X-reciprocal fit
Equilin Double reciprocal fit Y-reciprocal fit X-reciprocal fit
Estrone Double reciprocal fit Y-reciprocal fit X-reciprocal fit
17P-Estradiol Double reciprocal fit Y-reciprocal fit X-reciprocal fit
Ethynylestradiol Double reciprocal fit Y-reciprocal fit X-reciprocal fit
Norethindrone Double reciprocal fit Y-reciprocal fit X-reciprocal fit
Progesterone Double reciprocal fit Y-reciprocal fit X-reciprocal fit
Mestranol Double reciprocal fit Y-reciprocal fit X-reciprocal fit
aromatic hydroxyl group, which can penetrate deeply into the CD cavity where it hydrogen-bonds to one of CD's peripheral hydroxyl groups [32]. Ring A of compounds 1-5 is identical; it was aromatic with a hydroxyl group on it. The difference was in the ring D (and nonsaturated bond in ring B of equilin) where hydrophilic hydroxyl and ketone groups and hydrophobic ethilin groups attached. According to the literature estriol, equilin, estrone, 17P-estradiol and ethynylestradiol penetrated y-CD and form a hydrogen bond with the hydroxyl group of CD. The structural difference of ring D and IogK,, values ex- plained the different K values obtained. Norethindrone and progesterone did not contain any aromatic ring with a hydroxyl group on it and the aromatic hydroxyl group of
mestranol was methylated. Ring D of the latter com- pounds contained hydrophilic and hydrophobic groups. However, neither constituent of ring A nor ring D appeared to be the reason for the inclusion as the calcu- lated association constants were negative. A low degree of interaction was observed in the case of norethindrone but as to which one of the above mentioned contributions or their combination was responsible for the association constant of 75 M-' (X-reciprocal fit) was not clear.
Table 1 contains some literature association constant values for several steroids, obtained from HPLC data. To the authors knowledge association constants for other investigated steroids and other CD types are not avail-
0 2006 WILEY-VCH Verlag GmbH & Co. KGaA, Weinheim

3054 Y. Shakalisava and E Regan Electrophoresis 2006,27, 3048-3056
able. It was reported previously [I 6-1 81 that equilibrium constants determined by different experimental methods for the same reaction can significantly deviate from each other. The HPLC constants were much greater than the data obtained in this work but notably the relative order of the association constants was the same. The mechanism of the separation method influences the magnitude of the association constant values. In CE, the binding constant values are determined mainly by the charge/mass ratio. In HPLC the distribution of analyte between the mobile and stationary phases play an important role. The effect of SDS on the association constants for CD in CE is dis- cussed later.
3.2 P-CD
From this investigation a significant decrease in the mag- nitude of the association constants was found for the interaction of the selected steroids with P-CD (Table 2). Association constants values as low as 56 M-' (X-reci- procal fit) for estriol and 120 M-' (Y-reciprocal fit) for ethynylestradiol were found. The association constants were accompanied by a slightly increased deviation from linearity (R2) for estriol, equilin and 1713-estradiol and a large decrease in linearity for estrone and norethindrone. Relative standard deviation of the obtained K was quite high for estriol (over 30%). The small diameter of P-CD (8 A [25]) did not allow penetration of steroids to the same degree as the cavity of y-CD. It is likely that the inclusion of only the most hydrophobic part of the molecules took place. The rest of the structure remained in the bulk sol- vent. Ethynylestradiol had the highest association con- stant among P-CD complexes followed by 17p-estradiol, equilin and estriol. It is interesting to note that the last three compounds had the same K values by three linear- isation methods within experimental error. Partial interac- tion of the same structural fragment of the three mole- cules took place. Estrone and norethindrone did not undergo any interaction with 13-CD, which was supported by negative constants. It has to be noted that in case of y-CD, equilin possessed less interaction than estrone. This was not true for inclusion into P-CD. It is likely that the double bond of the B-ring of equilin induced a different interaction with the CD.
3.3 2HP-y-CD and 2HP-P-CD
Modification of the structure of the CD has many bene- ficial effects, contributing to its solubility or affinity for analytes. In this study two HP functionalised y-CD and P- CD were investigated. It was found that a general de- crease of association constants could be noted for the inclusion of target steroids into 2HP-y-CD (Table 3). It was
reported that HP substituents elongate the actual CD cavity when attached through primary or secondary hy- droxyl groups of the glucose ring [12]. Molecular sub- stitution of the employed 2HP-y-CD was 0.6 but it was not controlled and thus the actual position of HP groups was unknown. The comparison of the association constants for 2HP-y-CD with parent y-CD would suggest that this substitution caused some structural difficulties for steroid molecules to penetrate the cavity and/or the hydrogen bonds were not able to form between analytes and sub- stituted hydroxyls on the CD.
The data in Table 4 shows the association constants of steroids with 2HP-P-CD. A slight deviation from linearity of the plots could be noticed here, which was similar to the linearisation plots for natural P-CD. There was notice- ably improved linearity for estrone accompanied by increased association constants. Even though the % RSD of the calculated constants was high, a general increase of the constant value was noted with the functionalised CD compared to the natural P-CD. HP groups are orien- ted so that penetration of the part of analytes was quite similar, thereby not distinguishing types clearly. Due to the fact that there is only a slight difference between constant values for several compounds (Table 4), it is evident that the HP-substituted P-CD (degree of substitution = 4-1 0) does not recognise the structural variations of analytes to the same degree as y-CD for instance.
3.4 The effect of SDS
While it is clear from the association constants deter- mined that the concentration and type of CD is important in selecting particular steroids, a study of the effect of SDS was carried out to investigate the impact of SDS on the analyte interaction with the CD. The effect of SDS concentration in the run buffer was investigated using 2HP-y-CD. The value of association constants of target steroids and 2HP-y-CD with two run buffers containing 10 mM SDS and 20 mM SDS are presented in Table 3. The steroid-micelle interaction is strong due to high hy- drophobicity of analytes (logKO, values of each analytes were mentioned in Section 3). It was found that by increasing the concentration of SDS, this leads to the equilibrium being moved toward increased micelle inter- action.
The latter reason provoked the decrease of the inclusion of steroids into the CD cavity when the concentration of SDS was 20 mM. The values of the association constants at 20 mM SDS were two to three times less than at 10 mM SDS (Table 3). It has to be noted that Kvalue for estriol was affected significantly less than the rest of the constants. The value for estriol was even higher than the
@ 2006 WILEY-VCH Verlag GmbH & Co. KGaA, Weinheim

Electrophoresis 2006,27, 3048-3056 CE and CEC 3055
Table4. The value of association constants of target steroids and 2HP-P-CD, R2 for each linearisation method, % RSD (n = 3)
Estriol Double reciprocal fit Y-reciprocal fit X-reciprocal fit
Equilin Double reciprocal fit Y-reciprocal fit X-reciprocal fit
Estrone Double reciprocal fit Y-reciprocal fit X-reciprocal fit
17P-Estradiol Double reciprocal fit Y-reciprocal fit X-reciprocal fit
Ethynylestradiol Double reciprocal fit Y-reciprocal fit X-reciprocal fit
Norethindrone Double reciprocal fit Y-reciprocal fit X-reciprocal fit
Progesterone Double reciprocal fit Y-reciprocal fit X-reciprocal fit
Mestranol Double reciprocal fit Y-reciprocal fit X-reciprocal fit
association constant for 17P-estradiol (Yand X fits). Even though 170-estradiol is the least hydrophobic compound of all target analytes it strongly included into the 2HP-y- CD cavity. This result demonstrated that in this case, the inclusion is due to the strong hydrogen bonding of the vicinal hydroxyl groups on the D ring with hydroxyls of the CD. As expected, the increase in the concentration of SDS in the run buffer did not affect the association con- stants of the compounds G 8 , which remain negative.
4 Concluding remarks
The interaction of several steroids with different CD types was characterised and steroid-CD association constants were determined. The most powerful agent for the inclu-
sion of the target analytes was found to be y-CD followed by 2HP-y-CD. High values of association constants were accompanied by good linearity of the plots. The con- stants values obtained for individual analytes correlate with their structural characteristics contributing to their inclusion. Interaction with the cavity of 8-CD was rather weak while 2HP-P-CD failed to recognise difference in structure of estriol, equilin, ethynylestradiol, 17P-estradiol and estrone. It was found that the association constant values decreased when the concentration of micelles in the run buffer was increased.
In general the estimation of association constants of steroid compounds with CDs was a straightforward pro- cess due to high efficiency and simple performance of CE in a combination with three plotting methods used.
The authors would like to acknowledge the Innovation Partnership grant, Enterprise Ireland for funding this re- search.
5 References
[I] Oosterkamp, A. J., Hock, B., Seifert, M., Irth, H., Trends Anal. Chem. 1997, 16,544-553.
[2] Devanesan, P., Todorovic, R., Zhao, J., Gross, M. L. et a/., Carcinogenesis 2001,22, 489-497.
[3] Hernaldo, M. D., Mezvua, M., Gomez, M. J., Malato, 0 . et al. , J. Chromatogc A 2004, 1047, 129-1 35.
[4] Chan, K. C., Muschik, G. M., Issaq, H. J., Siiteri, P. K., J. Chromatogl: A 1995,690, 149-1 54.
[5] Shimada, K., Masue, T., Chiba, H., J. Chromatogs Sci. 1989, 27,557-560.
[6] Lamparczyk, H., Zarzycki, P. K., Nowakowska, J., Ochocka, R. J., Chromatographia 1994,38, 168-172.
[7] Zarzycki, P. K., Wierzbowska, M., Lamparczyk, H., J. Pharrn. Biomed. Anal. 1997, 75, 1281 -1 287.
[8] Zarzycki, P. K., Smith, R., J. Chromatogc A 2001, 912, 45- 52.
[9] Munro, N. J., Palmer, J., Stalcup, A. M., Landers, J. P., J. Chromatogc B 1999, 731,369-381.
[I 0] Poole, S. K., Poole, C. F., J. Chrornatogr. A 1996, 749, 247- 255.
[Ill Rekharsky, M. V., Inoue, Y., Chem. Rev. 1998, 98, 1875- 1918.
[I 21 Szejtli, J., Chem. Rev. 1998,98, 1743-1 753. [I31 Bellini, M. S., Deyl, Z., Manetto, G., Kohlickova, M., J.
Chromatogr. A 2001,924,483-491. [I 41 Sadlej-Sosnowska, N., J. Chromatogr. A 1996, 728, 89-95. [I51 Sadley-Sosnowska, N., J. Inclus. Phenom. Mol. 1997, 27,
31 -40. [I61 Cirri, M., Maestrelli, F., Orlandini, S., Furlanetto, S. et al., J.
Pharm. Biomed. Anal. 2004,37, 995-1 002. [I71 Wood, D. J., Hruska, F. E., Saenger, W. E., J. Am. Chem.
SOC. 1977,99, 1735-1 740. [I81 Uekama, K., Hirayarna, F., Otagiri, M., Otagiri, Y., Ikeda, K.,
Chem. Pharm. Bull. 1978,26,1162-1168. [I 91 Heiger, D., High Performance Capillary Electrophoresis,
Agilent Technologies, Waldbronn, Germany 2000, p. 27.
0 2006 WILEY-VCH Verlag GmbH & Co. KGaA, Weinheim

3056 Y. Shakarrseva and F, Regan
[20] Huwitr, A. R., Ltu, S. T, J. Pharm. Sci, 1977.49, 624-627, 1211 Egorova, V., Zakharychev, A., Ananchenka, S., Tetrahedron
Left 1973.29,301-307. [22] Oulntsna, J. B., Carpintdo, J,, Rodriguez. I.. Lorenao. A. A.
et at., J. Chmmatogr. R 2004, 1024,177-7 85. 1231 Rundletl, K. L, Anstrong, D. W., Electmphoresis 1997. Is,
21 94-2202. 1241 Luminescence ApplEcatlons In Bialoqical, Chemlcd, and
Hydrological Sciences. ACS Symposium Series 383,1969. P5] Hallen, D., SchBn, A., Shshatta, i., Wads& Letat., J, Chem.
Soc, Faraday Trans. 1992,88,2859-2863. 1261 Barone, G., Castronuovo, G.. Del Vecchio. F?, €?la, V. et st., J.
Chem. Soc., Faraday Trans. 1986,82,2088-2095.
O 2006 WILEY-VGH Verlag GmbH & Co. KGaA, Weinheim
[27j Fujiwara, H., Arakawa, H., Murata, S., Sasaki, Y., 8. Chem. SOC. Jpn. 9 987,60,3891-3899.
[28j Bender, M. L,, Komlyama, M., CyclodeMn Chemlsty, Springer-Verlag, Berlin 1978.
[39l Matsui, Y., Mochida, K., 8. Chem. Soc. Jpn. 1979,52,280&- 281 6.
PO] Saanger, W., Angm Chem. Int. Edit. 1080,10,344-362.
[31] TKinnshlta, T, linurna, E, Tsuji, A, Chem. Phsrm. Bull. 1974, 22,24 7 3-2422.
[32] Ross, F? D., Rekharsky, M. V., Biophys. J. 7996, 77, 2144- 2154.