further development of the children’s mathematics anxiety ... · (
TRANSCRIPT

Further development of the Children’s Mathematics AnxietyScale UK (CMAS-UK) for ages 4–7 years
Dominic Petronzi, et al. [full author details at the end of the article]
Published online: 31 October 2018
AbstractThere are currently many mathematics anxiety rating scales designed typically for adult andolder children populations, yet there remains a lack of assessment tools for younger children(< 7 years of age) despite a recent focus on this age range. Following previous testing andvalidation, the 26-item iteration of the Children’s Mathematics Anxiety Scale UK (CMAS-UK) for ages 4–7 years was further validated with 163 children (4–7 years) across two schoolsin the UK to test the validity and reliability of the items through subsequent exploratory andconfirmatory factor analysis. The predictive validity of the scale was also tested by comparingscale scores against mathematics performance on a mathematics task to determine the rela-tionship between scale and mathematics task scores. Exploratory factor analysis and associatedparallel analysis indicated a 19-item scale solution with appropriate item loadings (> 0.45) andhigh internal consistency (α = 0.88). A single factor model of Online Mathematics Anxietywas related to the experience of an entire mathematics lesson, from first entering the classroomto completing a task. A significant negative correlation was observed between the CMAS-UKand mathematics performance scores, suggesting that children who score high for mathematicsanxiety tend to score to perform less well on a mathematics task. Subsequent confirmatoryfactor analysis was conducted to test a range of module structures; the shortened 19-itemCMAS-UK was found to have similar model indices as the 26-item model, resulting in themaintenance of the revised scale. To conclude, the 19-item CMAS-UK provides a reliableassessment of children’s mathematics anxiety and has been shown to predict mathematicsperformance. This research points towards the origins of mathematics anxiety occurring whennumber is first encountered and supports the utility of the CMAS-UK. Subsequent research inthe area should consider and appropriately define an affective component that may underliemathematics anxiety at older ages. Mathematics anxiety relates to more complex proceduresthat elude the experiences of younger children and may instead be the result of number-basedexperiences in the early years of education.
Keywords Mathematics anxiety . Factor analysis . Mathematics performance
1 A foundation phase of mathematics anxiety
Although well researched in adult populations, a definitive foundation for mathematicsanxiety has yet to be identified (Harari, Vukovic, & Bailey, 2013). However, there is now
Educational Studies in Mathematics (2019) 100:231–249https://doi.org/10.1007/s10649-018-9860-1
# The Author(s) 2018

emerging research that focuses on primary school education (Mizala, Martinez, &Martinez, 2015; Petronzi, Staples, Sheffield, Hunt, & Fitton-Wilde, 2017; Ramirez,Gunderson, Levine, & Beilock, 2013) and the influence of early negative experiencesin the classroom is becoming accepted as a key factor in mathematics anxietydevelopment.
Nicolaidou and Philippou (2003) considered that children are intrinsically motivated tolearn mathematics with positive attitudes but begin to form attitudes that may be negative.Once mathematics anxiety develops, it can be viewed as cyclic (Ashcraft, 2002; Preis &Biggs, 2001) as negative attitudes relate to avoidance and poor performance whichescalates negative feelings. This adverse consequence emphasises the importance ofunderstanding and identifying the issue early in education. Indeed, psychologists (e.g.,Rossnan, 2006) have posited that mathematics anxiety can develop at any age and isrooted within a child’s first experience of school mathematics. Mazzocco, Hanich, andNoeder (2012) also suggest that efforts should begin in early childhood to steer childrenaway from paths that lead towards negative outcomes. This is made more important byresearch findings showing that despite demonstrating normal performance in most think-ing and reasoning tasks, mathematics anxious individuals demonstrate poor performancewhen solving mathematics problems (Maloney & Beilock, 2012). Anxiety is not exclusiveto mathematics and exists in other subjects, particularly when performing in front ofothers, including foreign language learning, music performance, and literacy learning,particularly for those with dyslexia (Dowker, Sarkar, & Looi, 2016). Punaro and Reeve(2012) reported that whilst children aged 9 years had literacy and mathematics anxiety inrelation to difficult problems in both subjects, mathematics caused more-intense worryrelated to performance. This suggests that whilst mathematics is not unique in causinganxiety, it may be the subject that produces the most intense responses.
Qualitative research conducted by Petronzi et al. (2017) explored and identified factorscontributing to the development of mathematics anxiety in the early years of UKeducation. Mathematics anxiety in children aged 4–7 years refers to worrisome thoughtssurrounding the manipulation of numbers in tasks that require basic mathematical skills.Within this educational context, children encounter number and place value, addition andsubtraction, multiplication and division in accordance with the National Curriculum;multiplication and division skills are worked on and developed throughout year 1 andyear 2 (UK Key Stage 1; ages 5–7 years) and at the end of this educational phase (UKyear 2; age 7 years), children are expected to count in multiples of 2s, 5s and 10s, shouldknow number bonds to 20 and be precise in using and understanding place value.Petronzi et al. identified themes that may have previously been underestimated or notconsidered as influencing mathematics-based attitudes in early education, for example,fear and stigma of failure, peer comparison/competition and awareness of a classroomhierarchy regarding mathematics ability. These findings highlight the importance ofaddressing the very early years of formal schooling to understand the development ofmathematics anxiety. However, the construct of mathematics anxiety and the current,long-standing definition is grounded within adult research and is associated with morecomplex mathematical procedures; it does not address its origins in the early years ofeducation. Indeed, mathematics anxiety in the early years has been considered as devel-oping to the point of a rigid educational obstruction (Baptist, Minnie, Buksner, Kaye, &Morgan, 2007) and could be regarded as a pre-requisite phase of mathematics anxiety inlater childhood and adulthood.
232 Petronzi D. et al.

2 Quantifying mathematics anxiety: a new assessment scale for children
Traditionally, measurement scales using Likert-scale response formats have been developedand adapted to determine the underlying factors of mathematics anxiety in adult populations,such as the Revised Mathematics Anxiety Rating Scale (RMARS) with emerging factors of (a)mathematics course anxiety, (b) evaluation anxiety, and (c) arithmetic computation anxiety(Plake & Parker, 1982); the Short Mathematics Anxiety Rating Scale (sMARS) (a) mathe-matics test anxiety and (b) numerical test anxiety (Suinn & Winston, 2003); and the Mathe-matics Anxiety Scale UK, (MAS-UK) (a) mathematics evaluation anxiety, (b) everyday/socialmathematics anxiety, and (c) mathematics observation anxiety (Hunt, Clark-Carter, & Shef-field, 2011). One notable exception is Dowker, Bennett, and Smith’s (2012) measure ofattitudes to mathematics for primary school children. This scale was developed with childrenaged 7–10 years and strayed from a typical Likert-scale response and instead adopted a facerating scale to ensure appropriateness for primary school-aged children. Children respondingto images on questionnaires has previously been assessed by the Koala Fear Questionnaire(Muris et al., 2003), which was found to be a valuable instrument for clinicians and researcherswhen assessing fears and fearfulness in pre and primary school-aged children. More recently,the Modified Abbreviated Mathematics Anxiety Scale (Carey, Hill, Devine, & Szucs, 2017)has been developed for children aged 8–13 years with a sample of 1746 children andadolescents. This consists of 9-items and participants respond to a 5-point Likert scale, rangingfrom low anxiety (1) to high anxiety (5). Typically, mathematics anxiety scales have favoureda Likert-scale response, although it seems more appropriate for response formats to be adaptedto support children’s understanding. This was a core consideration during the developmentprocess of the Children’s Mathematics Anxiety Rating Scale UK in the current and previousresearch (Petronzi, Staples, Sheffield, Hunt, & Fitton-Wilde, 2018).
Many existing mathematics anxiety scales are limited in their use with younger children interms of content and format. For example, the sMARS (Suinn & Winston, 2003) comprisesquestions focussing on advanced concepts that might be difficult for younger children tocomprehend. Other scales, including those for older children, e.g., the Mathematics AnxietyRating Scale for Elementary children (MARS-E) (Suinn, Taylor, & Edwards, 1988), theMathematics Anxiety Scale for Children (MASC) (Chiu & Henry, 1990), and the ChildMathematics Anxiety Questionnaire (CMAQ) (Ramirez et al., 2013) use a response formatthat include written labels pertaining to anxiety levels. Such a response format may not beappropriate for younger children in which comprehension of the labels may be compromised.Whilst the 26-item MARS-E was developed with 1119 fourth (U.K. age 9–10, year 5), fifth(U.K. age 10–11, year 6), and sixth graders (U.K. age 11–12, year 7) and the 22-itemMASC isintended for use with children aged 9–14. A focus on older age ranges represents anotherlimitation with existing scales. To address these points, the current study built on previousexploratory factor analysis of the CMAS-UK (N = 307) (Petronzi et al., 2018) and focused onthe further development of this scale using simple emoticons with three response choices.Notably, both the MARS-E and MASC have the advantage of being applicable to a wider agerange, unlike other scales, for example, the Scale for Early Mathematics Anxiety (ages 8–9 years) (Wu, Barth, Amin, Malcarne, & Menon, 2012).
In previous research (Petronzi et al., 2018), the CMAS-UK was implemented with childrenaged 4–7 years (N = 307). Factor analysis of 44 items resulted in the omission of 18 items andled to a 26-item iteration of the CMAS-UK. This produced a high internal consistency value(α = 0.89). Two factors were identified: the first related to prospective mathematics task
Further development of the Children’s Mathematics Anxiety Scale UK... 233

apprehension, e.g., seeing lots of numbers and walking into a mathematics lesson (and wasthus termed Prospective Mathematics Task Apprehension), and the second was associated withapprehension when completing mathematics tasks, e.g., making mistakes and explaining amathematics problem to the teacher (termed Online Mathematics Anxiety). A preliminaryanalysis was conducted to determine the extreme score discriminative power of the 26-itemsbased on a median split (47). All t test results were significant, suggesting that each item coulddiscriminate between extreme scores. Thus, our previous work suggested that the CMAS-UKis a valid tool for assessing mathematics anxiety in younger children, but further work wasneeded to validate the measure, particularly regarding the predictive validity of the scale in thecontext of mathematics performance.
3 Further validation of the Children’s Mathematics Anxiety Scale UK(CMAS-UK)
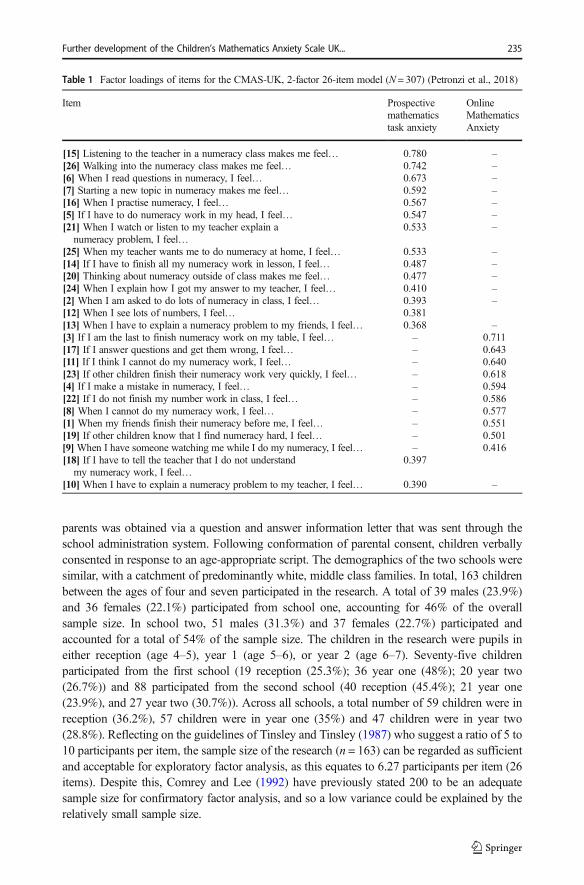
In the current study, the 26-item CMAS-UK was completed by a new sample of children (N =163) to further refine the scale items and to achieve a simple-to-administer scale for youngerchildren. In conjunction with this, children also completed a mathematics task with a difficultylevel that was relative to their year group. This was used as a measure of predictive validity totest whether the scale scores could predict mathematics performance. Predictive validity istypically established by presenting correlations between a measure of a predictive and othermeasures that should be associated with it. Suinn and Edwards (1982) determined thepredictive validity of the MARS-A by comparing scale scores with grade averages. The resultsindicated an association between higher anxiety scores and lower mathematics grade averages.Similarly, Suinn et al. (1988) correlated children’s Standardized Assessment Test scores(SATs) with their scores on the MARS-E. A relationship was found, supporting the predictivevalidity of the MARS-E. Chiu and Henry (1990) determined predictive validity of the MASCby comparing participants’ scores against, for example, the shortened version of the MARS,their most recent mathematics results, and scores from completing the Test Anxiety Scale forChildren (Wren & Benson, 2004). Participants who scored higher on the MASC had lowerachievement in mathematics, higher test anxiety, and lower achievement motivation. Thus, thecurrent study hypothesised that a higher score on the CMAS-UK would predict lowermathematics performance. Table 1 demonstrates the factor loadings and belonging of eachof the items for the 26-item version of CMAS-UK following Exploratory Factor Analysis(Petronzi et al., 2018).
4 Method
4.1 Design and participants
The study employed a cross-sectional design to further determine the reliability and validity ofa mathematics anxiety rating scale (CMAS-UK), in its 26-item iteration following factoranalysis in previous research (Petronzi et al., 2018). Measurements of mathematics perfor-mance were also taken.
Participants for the research were recruited through opportunity sampling from two stateprimary schools across the East Midlands region in the UK. Active informed consent from
234 Petronzi D. et al.
parents was obtained via a question and answer information letter that was sent through theschool administration system. Following conformation of parental consent, children verballyconsented in response to an age-appropriate script. The demographics of the two schools weresimilar, with a catchment of predominantly white, middle class families. In total, 163 childrenbetween the ages of four and seven participated in the research. A total of 39 males (23.9%)and 36 females (22.1%) participated from school one, accounting for 46% of the overallsample size. In school two, 51 males (31.3%) and 37 females (22.7%) participated andaccounted for a total of 54% of the sample size. The children in the research were pupils ineither reception (age 4–5), year 1 (age 5–6), or year 2 (age 6–7). Seventy-five childrenparticipated from the first school (19 reception (25.3%); 36 year one (48%); 20 year two(26.7%)) and 88 participated from the second school (40 reception (45.4%); 21 year one(23.9%), and 27 year two (30.7%)). Across all schools, a total number of 59 children were inreception (36.2%), 57 children were in year one (35%) and 47 children were in year two(28.8%). Reflecting on the guidelines of Tinsley and Tinsley (1987) who suggest a ratio of 5 to10 participants per item, the sample size of the research (n = 163) can be regarded as sufficientand acceptable for exploratory factor analysis, as this equates to 6.27 participants per item (26items). Despite this, Comrey and Lee (1992) have previously stated 200 to be an adequatesample size for confirmatory factor analysis, and so a low variance could be explained by therelatively small sample size.
Table 1 Factor loadings of items for the CMAS-UK, 2-factor 26-item model (N = 307) (Petronzi et al., 2018)
Item Prospectivemathematicstask anxiety
OnlineMathematicsAnxiety
[15] Listening to the teacher in a numeracy class makes me feel… 0.780 –[26] Walking into the numeracy class makes me feel… 0.742 –[6] When I read questions in numeracy, I feel… 0.673 –[7] Starting a new topic in numeracy makes me feel… 0.592 –[16] When I practise numeracy, I feel… 0.567 –[5] If I have to do numeracy work in my head, I feel… 0.547 –[21] When I watch or listen to my teacher explain a
numeracy problem, I feel…0.533 –
[25] When my teacher wants me to do numeracy at home, I feel… 0.533 –[14] If I have to finish all my numeracy work in lesson, I feel… 0.487 –[20] Thinking about numeracy outside of class makes me feel… 0.477 –[24] When I explain how I got my answer to my teacher, I feel… 0.410 –[2] When I am asked to do lots of numeracy in class, I feel… 0.393 –[12] When I see lots of numbers, I feel… 0.381[13] When I have to explain a numeracy problem to my friends, I feel… 0.368 –[3] If I am the last to finish numeracy work on my table, I feel… – 0.711[17] If I answer questions and get them wrong, I feel… – 0.643[11] If I think I cannot do my numeracy work, I feel… – 0.640[23] If other children finish their numeracy work very quickly, I feel… – 0.618[4] If I make a mistake in numeracy, I feel… – 0.594[22] If I do not finish my number work in class, I feel… – 0.586[8] When I cannot do my numeracy work, I feel… – 0.577[1] When my friends finish their numeracy before me, I feel… – 0.551[19] If other children know that I find numeracy hard, I feel… – 0.501[9]When I have someone watching me while I do my numeracy, I feel… – 0.416[18] If I have to tell the teacher that I do not understand
my numeracy work, I feel…0.397
[10] When I have to explain a numeracy problem to my teacher, I feel… 0.390 –
Further development of the Children’s Mathematics Anxiety Scale UK... 235

4.2 The Children’s Mathematics Anxiety Scale UK
The 26 items from the CMAS-UK were randomly numbered and related to general thoughtsand feelings about mathematics and typical day-to-day mathematics experiences, for example,teachers; peers and friends; difficulties with work; and receiving help or not. These items hadbeen created in collaboration with teachers who advised on the term “numeracy” instead of“maths”, “mathematics”, or “sums”. It was advised that children are more familiar with“numeracy” at this key stage and the National Curriculum in England predominantly refersto “mathematics” for Key Stage 2 (above the age range of the current research) and refers to“number” for Key Stage 1 (ages 4–7 years). Indeed, within the UK education system, childrenare familiar with the scheme “numeracy hour” (as well as “literacy hour”) and so areaccustomed to this consistently used terminology. Furthermore, our qualitative researchreinforced UK children’s understanding of “numeracy” (Petronzi et al., 2017)—the term iscommonplace in the context of UK Key Stage 1 education. Following factor analysis (Petronziet al., 2018), all items fell into either factor 1 (14-items; prospective mathematics taskapprehension) or factor 2 (12-items; Online Mathematics Anxiety) (α = 0.89). Children couldrespond to each item using an emoticon three-point Likert-scale, with one face representing“happy”, another signified uncertainty and the final face representing “sad”, for example “If Ihave to finish all my mathematics work in lesson, I feel…”.
4.3 The mathematics task
Three primary school teachers in a single school (not teachers of the participating children)were asked to create a set of intermediate mathematics problems that were age appropriate forreception, year one and year two children and utilised teacher expertise and understanding ofchildren’s abilities in each year group. These mathematics problems were deemed acceptableby teachers in the participating schools. The mathematics task for reception children was morepictorial based and called upon knowledge of shapes (searching for these in a house structure),addition, subtraction, missing numbers and visual identification of more and less (in waterbeakers); these were ratified by other teachers (appendix Fig. 5). Examples include:
Fill in the missing numbers:
1, 2, _ 4, 5, _ 7
Add the two numbers together to find the answer:
2 + 3 =5 + 4 =
For years one and two children, the mathematics task included longer addition (adding morethan two numbers together), money, division, multiplication, and using numbers to make aspecified value. In order for the tasks to be age appropriate, the year 2 task was of greaterdifficulty then the year 1 task (although tasks for each year group were set at medium ability).A time limit was not enforced when children were completing the mathematics task, as theintention was to measure their ability without pressure acting as a confounding variable.However, teachers typically allowed up to 15 min for task completion, although this wasnot stipulated to the children. The children were asked to work independently and to complete
236 Petronzi D. et al.

as much of the task as possible. To avoid children becoming too anxious when asked to dotheir own work, they were informed that the task was not a test and that the teacher would notsee their answers. Reception children could achieve a maximum score of 18 (1 point for eachcorrect answer), whilst years 1 and 2 children could achieve a maximum score of 20 (1 pointper answer); all scores were converted to percentages to reflect accuracy, which was theoutcome variable for mathematics performance.
4.4 Research procedure
For each research group, children in reception, year one and year two were taken to aseparate and quiet area of the school to avoid distractions and to encourage concentration.For children in reception, the researcher again limited the group size to a maximum ofthree, as previous research experience had taught that, although emotionally aware,younger children can struggle to understand the response procedure for scales and mayrequire assistance. A small group size enabled the researcher to ensure that all childrenresponded to the appropriate statement after it had been read aloud to them twice. Forchildren in years one and two, the maximum group size was eight, as children in theseyears were able to understand and follow the response procedure with minimal assistance.Once children had sat down in the research area of the school, introductions were made,and children were given time to talk generally. This time was used to record names, age,and year group. Following this, the researcher redirected the children’s attention to theresearch. A standard introduction to the research that had been written at an age appro-priate level was read to each group. Children also had the opportunity to ask any questionsand raise any concerns and were informed that they could stop whenever they liked.Children in all groups were also kindly asked to not discuss their statement responses witheach other, as the researcher’s previous research experience had shown that some childrencan alter their responses if others are expressing more confidence. Measures were taken interms of seating to avoid response copying, and avoid creating an anxiety evokingsituation, similar to a test. All children were provided with the 26-item CMAS-UK andgiven a pencil for circling the appropriate emoticon that reflected their feelings. Eachgroup was informed that the researcher would read each statement to the group and thentime would be given for their response. For each scale statement, the researcher read thestatement twice to ensure understanding. Once all children had responded, the researcherread the next statement. When the CMAS-UK had been completed, the children werethanked for their time and then returned to their class. The CMAS-UK was completedprior to the mathematics task to ensure that children were more inclined to respondgenerally rather than to the task. However, it is possible that children’s mathematics taskperformance may have been influenced by a priming effect of the CMAS-UK and is anarea of research interest.
Participating children completed the mathematics task in their classroom as a group thefollowing day, to avoid fatigue. It was explained to the children that this was not a test and thatthey should complete as much of the task as possible. They were also informed that there wasno time limit, and that they did not need to rush their work. The class teacher assisted inoverseeing the completion of the mathematics task and to ensure that children completed theirwork independently, although they were given assistance in reading the questions, particularlychildren in reception. Children were not made aware of their mathematics anxiety scale ormathematics tasks scores and these were calculated off site.
Further development of the Children’s Mathematics Anxiety Scale UK... 237

5 Results
5.1 Internal consistency and exploratory factor analysis
An exploratory factor analysis on the 26-items was conducted using principal componentanalysis (PCA) and varimax rotation. Bartlett’s test of sphericity was significant (p < 0.01),indicating that factor analysis was possible. The Kaiser-Meyer-Olkin (KMO) value wasalso sufficiently high (0.870) (Pallant, 2001). Considering the discrepancy between eigen-values suggesting 5-factors and the scree plot suggesting 1-factor (Fig. 1) a parallelanalysis (PA) was conducted simulating 1000 data files. According to Franklin, Gibson,Robertson, Pohlmann, and Fralish (1995), when comparing PA with the use of PCA inprevious research, PCA alone was shown to have potentially resulted in over-extraction ofcomponents, and therefore potentially misleading results. Accordingly, Franklin et al.(1995) recommend the routine use of PAwhich creates a random dataset based on originaldata (comparing eigenvalues from a pre-rotated data set from a matrix of random values ofthe same dimensionality). Regarding interpretation of this test, when parallel analysiseigenvalues (based on the random data) exceed the eigenvalues from PCA, these can beignored and the number of suggested components prior to intersect (if both PCA and PAeigenvalues and components were plotted on a graph) can be judged as the number ofcomponents to extract.
Our results suggested extraction of 1-factor explaining 31.26% of the variance as thesecond simulated eigenvalue (1.68) was higher than the empirical eigenvalue (1.37). A 1-factor solution with a loading threshold of more than .45 was forced, as the scale could bemade more statistically robust by implementing a higher cut-off. Stevens (1992) suggests thatfactors should load above 0.5 for a sample of 100 and 0.3 for a sample of 200, the currentstudy (n = 163) can be judged as between these values and thus > 0.45 was judged to be
Fig. 1 Factor analysis scree plot suggesting 1-factor
238 Petronzi D. et al.

acceptable. This resulted in the removal of seven items (2, 5, 6, 7, 9, 16, and 20), leaving a 19-item iteration of the CMAS-UK with high internal consistency (α = 0.88). A subsequentanalysis was conducted to determine the extreme score discriminative power of the 19-itemsbased on a median split (33). All t test results were significant, suggesting that each item coulddiscriminate between extreme scores.1
The current 19-item measure of mathematics anxiety corresponds to the 22-item MASC(Chiu & Henry, 1990) and 26-item MARS-E (Suinn et al., 1988) in terms of number ofitems and time to complete and should be more manageable for younger children. Futurecomparison against these validated scales is justified as, like the CMAS-UK, they weredeveloped for use with children, albeit somewhat older. In terms of a practical applicationto classrooms, it is beneficial for the CMAS-UK to have fewer items due to its intendedlower age range, with issues surrounding attention and fatigue in younger children,particularly those in reception. Table 2 shows the factor loadings of each item and theresponse frequencies, whilst Fig. 2 shows the range of CMAS-UK scores indicating a widespread and normal distribution.
5.2 Factor labelling
Items that loaded onto the single observed factor appeared to have a strong association withfeelings and situations during the moment-to-moment experience of performing a mathematicstask, i.e., explaining an answer to the teacher, being the last to finish mathematics work,making mistakes and getting work wrong. This factor was thus named, “Online MathematicsAnxiety”, maintaining the factor 2 name from the previous research (Petronzi et al., 2018).This factor consists of merged items from the initial factor 1 and factor 2. The entiremathematics lesson could be viewed as being an online task, as it requires the learner to notonly complete work, but to observe and listen closely to instruction—something that highanxious children may find difficult.
5.3 Confirmatory factor analysis—2-factor 26-items
A series of confirmatory factor analyses was used to test the previous 26-item version of theCMAS-UK against the revised 19-item scale that emerged in this research. Testing the 2-factormodel of the CMAS-UK identified in previous research (Petronzi et al., 2018), the fit indicesshowed that the data were not a perfect match to the model. The analysis of the 2-factorsolution (Fig. 3) resulted in a large and highly significant chi square, χ2(298) = 409.358,p < 0.001 although this can be sensitive to sample size (Goffin & Jackson 1988, as cited inKline (1994)). The comparative fit index (CFI) = 0.88 and the Tucker-Lewis Index (TLI) =0.87 did not indicate a good model fit (< 0.95), although the root mean for approximation wasacceptable (RMSEA= .05). Based on the CFI and TLI criteria (Table 3), the model did notindicate a good fit.
1 When a 2-factor solution was forced on the data collected with 26-items (N = 163) with a loading threshold toreplicate our previous study (0.35) (Petronzi et al. 2018), almost all of the same items were found to load on thesame factors according to the Rotated Component Matrix. First factor items (2, 5, 6, 7, 12, 13, 14, 15, 16, 24, 26)and second factor items (1, 4, 8, 11, 17, 18, 19, 21, 22, 25). The only disparity was observed with items 3 (reversedirection loading), 10, and 23 (loaded onto both factors) although the same items were removed (9 & 20) due toinsufficient loading (< 0.35) (see Table 1). This suggests reliability of the scale across our development studies,despite a 1 factor solution ultimately being indicated by more robust parallel analysis in the current research.
Further development of the Children’s Mathematics Anxiety Scale UK... 239

5.4 Confirmatory factor analysis—1-factor 26-items
A confirmatory factor analysis was used to further test a 1-factor model (Online Mathe-matics Anxiety) of the previous 26-item CMAS-UK to replicate the single factor identifiedin the current research. The fit indices showed that the data were not a perfect match to themodel. The analysis of the 1-factor solution resulted in a large and highly significant chisquare, χ2(299) = 454.01, p < 0.001 although this can be sensitive to sample size. Thecomparative fit index (CFI) = 0.84 and the Tucker-Lewis Index (TLI) = 0.82 did notindicate a good model fit (< 0.95), although the root mean for approximation was accept-able (RMSEA = 0.05). Based on the CFI and TLI criteria (Table 4), the model did notindicate a good fit.
Table 2 Factor loadings and response frequencies of the 19-item CMAS-UK (> 0.45 threshold)
Item Online numberapprehension
Frequency—happy
Frequency—uncertain
Frequency—sad
Q1: When my friends finish their work beforeme, I feel…
0.540 73 47 4344.8% 28.8% 26.4%
Q3: If I am the last to finish numeracy workon my table, I feel…
0.572 47 52 6428.8% 31.9 39.3
Q4: If I make a mistake in numeracy, I feel… 0.565 48 77 3829.4% 47.2% 23.3%
Q8: When I cannot do my numeracy work,I feel…
0.552 40 50 7324.5% 30.7% 44.8%
Q10: When I have to explain a numeracyproblem to my teacher, I feel…
0.540 74 60 2945.4% 36.8% 17.8%
Q11: If I think I cannot do my numeracywork, I feel…
0.617 46 56 6128.2% 34.4% 37.4%
Q12: When I see a lot of numbers, I feel… 0.520 105 45 1364.4% 27.6% 8%
Q13: When I have to explain a numeracyproblem to my friends, I feel…
0.520 89 53 2154.6% 32.5% 12.9%
Q14: If I have to finish all my numeracywork in lesson, I feel…
0.583 78 37 4847.9% 22.7% 29.4%
Q15: Listening to the teacher in my numeracyclass makes me feel…
0.496 115 35 1370.6% 21.5% 8%
Q17: If I answer questions and get themwrong, I feel…
0.624 41 53 6925.2% 32.5% 42.3%
Q18: If I have to tell the teacher that I do notunderstand my numeracy work, I feel…
0.542 50 70 4330.7% 42.9% 26.4%
Q19: If other children know that I findnumeracy hard, I feel…
0.639 53 46 6432.5% 28.2% 39.3%
Q21: When I watch or listen to my teacherexplain a numeracy problem, I feel…
0.465 87 55 2153.4% 33.7% 12.9%
Q22: If I do not finish my number work inclass, I feel…
0.615 40 62 6124.5% 38% 37.4%
Q23: If other children finish their numeracywork very quickly, I feel…
0.606 64 49 5039.3% 30.1% 30.7%
Q24: When I explain how I got my answerto my teacher, I feel…
0.479 91 45 2755.8% 27.6% 16.6%
Q25: When my teacher wants me to donumeracy at home, I feel…
0.515 92 37 3456.4% 22.7% 20.9%
Q26: Walking into the numeracy classmakes me feel…
0.567 98 45 2060.1% 27.6% 12.3%
240 Petronzi D. et al.

5.5 Confirmatory factor analysis of the current CMAS-UK: a 1-factor, 19-item model
A final confirmatory factor analysis was used to test the 1-factor model of the CMAS-UK. Theanalysis of the 1-factor solution (Fig. 4) resulted in a large and highly significant chi square,χ2(152) = 244.860, p < 0.001, although this can be sensitive to sample size. The comparativefit index (CFI) = 0.87 and the Tucker-Lewis Index (TLI) = 0.86 did not indicate a good modelfit (< 0.95), although the root mean for approximation was acceptable (RMSEA= 0.06). Insum, the model fit indices (Table 5) matches the acceptable and non-acceptable parameters ofthe 2-factor 26-item CMAS-UK and the 1-factor 26-item model, indicating that a refined 19-item version of the scale—which will be more manageable for younger children—can beretained and subsequently tested using a larger sample size in future work.
The results show that CFA standardised regression weights are only marginally smaller thanthe EFA factor loadings. The standardised regression weights in the CFA are favourable asthey closely link to the EFA, supporting the 19-item model and this is shown to be consistentacross statistical tests. The small observed difference between regression weights and factorloadings exert no effects on the model that would lead to differential theoretical interpretations.
5.6 CMAS-UK scores and the mathematics task
As expected due to the age-appropriateness of the mathematics tasks for each year group, therewas no significant effect of year group on mathematics task scores, F(2,160) = 1.88, p = 0.16;the means and standard deviations for each year group are shown in Table 6. There was nosignificant effect of primary school on mathematics performance F(1,161) = 1.71, p = 0.19, ormathematics anxiety F(1,161) = 1.00, p = 0.32. However, correlational analysis demonstrated alarge, negative correlation between scores on the 19-item CMAS-UK and performance on themathematics task (overall score accuracy), r(163) = − 0.620, p < 0.001. This correlation can beseen by year group: (1) reception, r(59) = − 0.597, p < 0.01, (2) year 1, r(57) = − 0.557,p < 0.01, and (3) year 2, r(47) = − 0.807, p < 0.01.
Fig. 2 The distribution of children’s CMAS-UK Scores (19-items)
Further development of the Children’s Mathematics Anxiety Scale UK... 241

6 Discussion
The extant literature on mathematics anxiety has given limited attention to the early yearsof mathematics education. Knowledge has therefore been limited with regard to the onsetof mathematics anxiety and whether factors in the early educational years have an
Fig. 3 CMAS-UK confirmatory factor analysis structure (2-factor 26-item model). *Measurement error. **Ob-served variables. ***Percent of variance explained. ****Standardised regression weights. *****Common factors
Table 3 Fit indices for the CMAS-UK (2-factor 26-items)
X2 df p CFI TLI NFI RMSEA Pclose
M1 409.358 298 < 0.001 0.88 0.87 0.67 0.05 0.603Cut off values
(Hu & Bentler, 1999)N/A N/A > 0.05 > 0.95 > 0.95 > 0.095 < 0.06 > 0.05
242 Petronzi D. et al.

association with this. Consequently, the CMAS-UK was developed to measure mathe-matics anxiety in young children (4–7 years), younger than those targeted by othermeasures (Chiu & Henry, 1990; Dowker et al., 2012). The current study further validatedthe scale using exploratory and confirmatory factor analysis and demonstrated a negativerelationship between mathematics anxiety and mathematics performance. The 19-itemCMAS-UK was shown to have high internal consistency (α = 0.88) (Lacobucci &Duhachek, 2003; Rattray & Jones, 2005) and is similar to that obtained in (Petronziet al., 2018) (α = 0.89).
Whilst the association between mathematics anxiety scores and mathematics perfor-mance scores was significant and large (r = − 0.620), this should be viewed with a degreeof caution. In some cases, children who obtained a high score on the mathematics task alsoobtained a high score on the CMAS-UK. Ashcraft (2002) also previously found thatdespite some children claiming a degree of mathematics anxiety, their competence scores
Table 4 Fit indices for the CMAS-UK (1-factor 26-items)
X2 df p CFI TLI NFI RMSEA Pclose
M1 454.014 299 < 0.001 0.84 0.82 0.64 0.05 0.151Cut off values
(Hu & Bentler, 1999)N/A N/A > 0.05 > 0.95 > 0.95 > 0.095 < 0.06 > 0.05
Fig. 4 CMAS-UK confirmatory factor analysis structure (1-factor 19-item model). *Measurement error. **Ob-served variables. ***Percent of variance explained. ****Standardised regression weights. *****Common factor
Further development of the Children’s Mathematics Anxiety Scale UK... 243

remained unaffected. Previously, Ashcraft, Kirk, and Hopko (1998) found that the effectsof anxiety were only apparent on certain mathematical concepts. Thus, it may be that thechildren were highly anxious, but were comfortable with the concepts on the mathematicstask, and thus performance was unaffected. Ashcraft (2002) stated that researchers shouldalways consider the competence-anxiety relationship, as those with higher anxiety maydemonstrate increased competence in varying circumstances. However, for the most partour data demonstrates that children with low CMAS-UK scores performed better on themathematics task whilst children with higher scores on the CMAS-UK generally hadlower mathematics performance scores. This large correlation supports the use of itemscreated following qualitative research with the target population (Petronzi et al., 2017) andsuggests that the items are an accurate reflection of children’s experiences. Indeed, it wasalso found that the items could discriminate extreme scores. In the current research, arange of anxiety scores was evident and there was a strong negative association betweenCMAS-UK scores and mathematics task scores; this addressed the aim of testing thepredictive validity of the CMAS-UK and has shown that it can be an appropriate measurefor early childhood difficulties in mathematics. Nevertheless, further research is requiredto assess the direction of causation. Previously, research by Ma and Xu (2004) used alongitudinal study with 3116 students from grade seven to twelve (UK age 12–17) todetermine causal ordering. Throughout the 6 years, students completed achievement testsin mathematics and science and a questionnaire which covered a variety of measures,including mathematics anxiety, basic numeracy skills, algebra, geometry, and quantitativeliteracy. Results from the study indicated that lower mathematics achievement scores inearlier grades were associated with higher mathematics anxiety scores in the later grades,suggesting that mathematics achievement had a causal priority over mathematics anxiety.
The current analyses suggested a 19-item single factor solution was appropriate andcontrasts to the previous 2-factor scale (Petronzi et al., 2018). Comparing the participationnumbers from our previous work (reception = 82; year 1 = 108; year 2 = 117) to the currentresearch’s (reception = 59; year 1 = 57; year 2 = 47) suggests a possible explanation for thedifference in model structure. In the previous research, the reception year group wasconsiderably less represented than year one and two—whilst in the current research weresimilar across the year groups. Adding to this, the numbers of participating schools in the
Table 5 Fit indices for the CMAS-UK (19-items)
X2 df p CFI TLI NFI RMSEA Pclose
M1 244.860 152 < 0.001 0.87 0.86 0.72 0.06 0.095Cut off values
(Hu & Bentler, 1999)N/A N/A > 0.05 > 0.95 > 0.95 > 0.095 < 0.06 > 0.05
Table 6 Means and standard devi-ations for year groups and mathe-matics performance scores
N Mean (SD)
Reception 59 72.46 (20.54)Year 1 57 68.77 (25.60)Year 2 47 77.23 (19.50)Total 163 72.55 (22.29)
244 Petronzi D. et al.

current research were less than in our previous scale development work; however, theschools were of similar socioeconomic status and ethnicity intake. The omission of an itemrelating to mental arithmetic is somewhat surprising as previous research, e.g., Ashcraft(2002) indicated that this is a particularly difficult aspect of mathematics and may act as akey differentiator between mathematics attitudes. Nevertheless, at the age of reception,children are learning and practising calculations, becoming familiar with numbers andstrategies to facilitate their learning. Thus, there is less emphasis on mental arithmeticwithin this younger age group, which becomes a more essential skill as children progressthrough education. Therefore, the mental arithmetic item (and its low factor loading) haslow saliency in this context for younger children. Again, this finding is a change in modelstructure from our previously observed 2-factor solution to the 1-factor solution in thecurrent research. However, CFA results showed that a 1-factor 19-item scale had similaracceptable and non-acceptable parameters as a 2-factor 26-item version of the CMAS-UK,indicating that the change in model structure—whilst warranting further research—shouldnot be considered concerning. Indeed, this shorter version is preferable and more man-ageable for younger children. Further to this, the current research also implemented aslightly increased and more robust loading threshold for items (> 0.45), although this hadno impact on the factor solution of the CMAS-UK. It is also notable that a forced 2-factorsolution on data for the 26-items with a loading threshold to replicate our previous study(0.35) indicated almost all the same items were found to load on the same factorsaccording to Rotated Component Matrix. Although a 1-factor solution on the current datawas advised by parallel analysis, the same items loading onto either of the two factorsindicates reliability of the scale across our development studies, again suggesting thatthere should be little concern in the change of model structure.
Of the 19-items that remained from the previous 26-item version of the scale, 11 weremaintained from the “Online Mathematics Anxiety” factor and it was thus preserved as thesingle dominant factor of the CMAS-UK. The additional 8 items were maintained from the“Prospective Mathematics Task” factors. The 19-items seemingly encapsulate a typicalmathematics lesson, from feelings when walking into a mathematics lesson, to beingunable or the last in a group to finish the work set and may explain the incorporation of“Prospective Mathematics Task” into the single factor solution. Other examples pertain toother children finishing their work quickly and having an awareness of someone strug-gling (failure and peer comparison); providing incorrect answers; making mistakes (failureand low self-efficacy); and holding the belief of being unable to complete work (low senseof ability and self-esteem). These items also identified in quantitative mathematics anxietyresearch with older populations, suggesting that the early years of education may some-what contribute to later difficulties and negative attitudes, although this requires furtherinvestigation.
As a point of reflection, it can be argued that younger children may not have thecapacity to accurately recall and rate their mathematics experiences. Young children’smemories are still developing throughout earlier years and are therefore restricted in howmuch information and experiences they can store in their short-term memory (Croker,2012). However, currently in the UK, children from 4 years are expected to engage in self-assessment and self-reflection of their learning and emotional state using school specificself-report measures (there is no standard measure). Yet in most cases children rate theirlearning-based feelings on a scale of 1–10 using emojis for visual support. Indeed,educational psychology services in the UK also implement and refer teachers and
Further development of the Children’s Mathematics Anxiety Scale UK... 245

childcare workers to a test bank of scales for the measurement of children’s emotional andmental well-being using quantitative measurement. In light of this, the CMAS-UK (withvisual emoji support) aligns with the current UK practise.
The development of the CMAS-UK is a positive response to Ashcraft and Moore (2009)and Mazzocco (2007) who stated that the appropriate tools have not been developed toexamine anxiety and those at risk of mathematics difficulties in early education. Rossnan(2006) argued that mathematics anxiety can develop at any age and the associated fear isdeeply rooted within a child’s first experience of school mathematics. The current studyhighlights an adverse relationship between young children’s early mathematics experiencesand performance that could potentially develop and progress into the later educational years.This relationship may be impacting performance much earlier than previously anticipated byresearch. Longitudinal studies may be beneficial to test the long-term consequences ofworrisome thoughts about mathematics from the ages of 4–7 years. The results of this studysupport that the early years and experiences of working with numbers are critical. Mazzoccoet al. (2012) further considered that mathematics anxiety in older children may be rootedwithin the early years of education and that efforts should be made in early childhood to steerthem away from negative outcomes. This contention is supported by the current research andreinforces the utility of the CMAS-UK in identifying children at risk of developing mathe-matics anxiety.
Moreover, it is necessary for future researchers to consider the multitude of potentialinfluences on the development of mathematics anxiety (Petronzi et al., 2018) including theuse of negative mathematics-based language around children, using mathematics as a punish-ment and exposing children to evaluation and pressure from peers. These and other influencesshould be considered when using an assessment measure such as the CMAS-UK to quantifyfeelings and experiences. Further predictive and convergent validation work on the scale isneeded with younger children, whilst the CMAS-UK can support projects evaluating inter-vention techniques that are known to be efficacious with older children. For example, Park,Ramirez, and Beilock (2014) that expressive writing following and prior to a mathematics taskincreases the mathematics performance of those with university students with higher mathe-matics anxiety.
In sum, previous research has neglected the assessment of affect towards numbersamong younger children. Our work has gone some way to address this shortfall byproviding an easily administrable scale with a parsimonious factor structure. Previousattempts to measure mathematics anxiety among older children and adults haveemphasised the multidimensionality of the construct whereas the current findings high-light the limited context in which young children are exposed to numbers. We demonstratethe importance of mathematics anxiety at a young age and the relation this has onmathematics performance. The current work should encourage further investigation intothe developmental relations between mathematics anxiety and mathematics performance;improved theoretical understanding may inform educational practices and support thedesign of effective interventions that stop negative trajectories of mathematics anxietyand performance from a young age.
Compliance with ethical standards
Competing interests The authors declare that they have no conflict of interest.
246 Petronzi D. et al.

Appendix 1
Fig. 5 Reception mathematics task
Further development of the Children’s Mathematics Anxiety Scale UK... 247

Open Access This article is distributed under the terms of the Creative Commons Attribution 4.0 InternationalLicense (http://creativecommons.org/licenses/by/4.0/), which permits unrestricted use, distribution, and repro-duction in any medium, provided you give appropriate credit to the original author(s) and the source, provide alink to the Creative Commons license, and indicate if changes were made.
References
Ashcraft, M. H. (2002). Mathematics anxiety: Personal, educational, and cognitive consequences. AmericanPsychological Society, 2, 181–185. https://doi.org/10.1111/1467-8721.00196
Ashcraft, M. H., Kirk, E. P., & Hopko, D. (1998). On the cognitive consequences of mathematics anxiety. In C.Donlan (Ed.), The development of mathematical skills (pp. 175–196). Hove, England: Psychology Press.
Ashcraft, M. H., & Moore, A. M. (2009). Mathematics anxiety and the affective drop in performance. Journal ofPsychoeducational Assessment, 27, 197–205. https://doi.org/10.1177/073428290833058.
Baptist, J., Minnie, L., Buksner, S., Kaye, R., & Morgan, J. (2007). Screening in the early years for mathematicsdifficulties and disabilities: Identifying red flags to support early learners at risk. Orbit, 37, 14–19.
Carey, E., Hill, F., Devine, A., & Szucs, D. (2017). The modified abbreviated mathematics anxiety scale: A validand reliable instrument for use with children. Frontiers in Psychology, 8, 1–13. https://doi.org/10.3389/fpsyg.2017.00011
Chiu, L., & Henry, L. (1990). Development and validation of the mathematics anxiety scale for children.Measurement and Evaluation in Counseling and Development, 23, 121–127.
Comrey, A. L., & Lee, H. B. (1992). A first course in factor analysis. Hillsdale, New Jersey: Erlbaum.Croker, S. (2012). The development of cognition. Hampshire: Cengage Learning.Dowker, A., Bennett, K., & Smith, L. (2012). Attitudes to mathematics in primary school children. Child
Development Research, 2012, 1–8. https://doi.org/10.1155/2012/124939Dowker, A., Sarkar, A., & Looi, C. Y. (2016). Mathematics anxiety: What have we learned in 60 years? Frontiers
in Psychology, 7, 1–16. https://doi.org/10.3389/fpsyg.2016.00508.Franklin, S. B., Gibson, D. J., Robertson, P. A., Pohlmann, J. T., & Fralish, J. S. (1995). Parallel analysis: A
method for determining significant principal components. Journal of Vegetation Science, 6, 99–106.https://doi.org/10.2307/3236261
Goffin, R. D., & Jackson, D. N. (1988). The structural validity of the Index of Organizational Reactions.Multivariate Behavioral Research, 23, 327–347. https://doi.org/10.1207/s15327906mbr2303_3
Harari, R. R., Vukovic, R. K., & Bailey, S. (2013). Mathematics anxiety in young children: An exploratory study.Journal of Experimental Education, 81, 538–555. https://doi.org/10.1080/00220973.2012.727888
Hu, L., & Bentler, P. M. (1999). Cut off criteria for fit indexes in covariance structure analysis: Conventionalcriteria versus new alternatives. Structural Equation Modeling, 6, 1–55. https://doi.org/10.1080/10705519909540118
Hunt, T. E., Clark-Carter, D., & Sheffield, D. (2011). The development and part validation of a UK scale formathematics anxiety. Journal of Psychoeducational Assessment, 29, 455–466. https://doi.org/10.1177/0734282910392892
Kline, P. (1994). An easy guide to factor analysis. New York, NY: Routledge.Lacobucci, D., & Duhachek, A. (2003). Advancing alpha: Measuring reliability with confidence. Journal of
Consumer Psychology, 13, 478–487. https://doi.org/10.1207/S15327663JCP1304_14Ma, X., & Xu, J. (2004). The causal ordering of mathematics anxiety and mathematics achievement: A
longitudinal panel analysis. Journal of Adolescence, 27, 165–179. https://doi.org/10.1016/j.adolescence.2003.11.003
Maloney, E. A., & Beilock, S. (2012). Mathematics anxiety: Who has it, why it develops, and how to guardagainst it. Trends in Cognitive Sciences, 16, 404–406. https://doi.org/10.1016/j.tics.2012.06.008
Mazzocco, M. M. (2007). Early predictors of mathematical learning difficulties: Variations in children’sdifficulties with mathematics. Redmond, USA: Exchange Press.
Mazzocco, M. M., Hanich, L. B., & Noeder, M. M. (2012). Primary school age students’ spontaneous commentsabout mathematics reveal emerging dispositions linked to later mathematics achievement. ChildDevelopment Research, 1, 1–12. https://doi.org/10.1155/2012/170310
Mizala, A., Martinez, F., & Martinez, S. (2015). Pre-service elementary school teachers’ expectations aboutstudent performance: How their beliefs are affected by their mathematics anxiety and student’s gender.Teacher Education, 50, 70–78. https://doi.org/10.1016/j.tate.2015.04.006
Muris, P., Meesters, C., Mayer, B., Bogie, N., Luijten, M., Geebelen, E., … Smit, C. (2003). The koala fearquestionnaire: A standardized self-report scale for assessing fears and fearfulness in pre-school and primaryschool children. Behaviour Research and Therapy, 41, 597–617.
248 Petronzi D. et al.

Nicolaidou, M., & Philippou, G. (2003). Attitude towards mathematics, self-efficacy and achievement inproblem-solving. European Research in Mathematics Education III (pp. 1–11). Pisa: University of Pisa.
Pallant, J. (2001). The SPSS survival manual: A step-by-step guide to data analysis using SPSS for Windows(version 10). Milton Keynes: Open University Press.
Park, D., Ramirez, G., & Beilock, S. L. (2014). The role of expressive writing in mathematics anxiety. Journal ofExperimental Psychology: Applied, 20, 103–111. https://doi.org/10.1037/xap0000013
Petronzi, D., Staples, P., Sheffield, D., Hunt, T., & Fitton-Wilde, S. (2017). Numeracy apprehension in youngchildren: Insights from children aged 4-7 years and primary care providers. Psychology and Education, 54,1–26.
Plake, B. S., & Parker, C. S. (1982). The development and validation of a revised version of the mathematicsanxiety rating scale. Educational and Psychological Measurement, 42, 551–557. https://doi.org/10.1177/001316448204200218
Preis, C., & Biggs, B. (2001). Can instructors help learners overcome mathematics anxiety? ATEA Journal, 28,6–10.
Punaro, L., & Reeve, R. (2012). Relationships between 9-year-olds’ mathematics and literacy worries andacademic abilities. Child Development Research. https://doi.org/10.1155/2012/359089
Ramirez, G., Gunderson, E. A., Levine, S. C., & Beilock, S. L. (2013). Mathematics anxiety, working memoryand mathematics achievement in early elementary school. Journal of Cognition and Development, 14, 187–202. https://doi.org/10.1080/15248372.2012.664593
Rattray, J., & Jones, M. C. (2005). Essential elements of questionnaire design and development. Journal ofClinical Nursing, 16, 234–243. https://doi.org/10.1111/j.1365-2702.2006.01573.x.
Rossnan, S. (2006). Overcoming mathematics anxiety. Mathitudes, 1, 1–4.Stevens, J. P. (1992). Applied multivariate statistics for the social sciences (2nd ed.). Hillsdale, NJ: Erlbaum.Suinn, R. M., & Edwards, R. (1982). The measurement of mathematics anxiety: The mathematics anxiety rating
scale for adolescents—MARS-A. Journal of Clinical Psychology, 38, 576–580.Suinn, R. M., Taylor, S., & Edwards, R. (1988). Suinn mathematics anxiety rating scale for elementary school
students (MARS-E): Psychometric and normative data. Educational and Psychological Measurement, 48,979–986. https://doi.org/10.1177/0013164488484013
Suinn, R. M., & Winston, E. H. (2003). The mathematics anxiety rating scale, a brief version: Psychometric data.Psychological Reports, 92, 167–173. https://doi.org/10.2466/pr0.2003.92.1.167
Tinsley, H. E. A., & Tinsley, D. J. (1987). Uses of factor analysis in counselling psychology research. Journal ofCounselling Psychology, 34, 414–424. https://doi.org/10.1037/0022-0167.34.4.414
Wren, D. G., & Benson, J. (2004). Measuring test anxiety in children: Scale development and internal predictivevalidation. Anxiety, Stress, and Coping, 17, 227–240. https://doi.org/10.1080/10615800412331292606
Wu, S. S., Barth, M., Amin, H., Malcarne, V., & Menon, V. (2012). Mathematics anxiety in second and thirdgraders and its relation to mathematics achievement. Frontiers in Psychology, 3, 1–11. https://doi.org/10.3389/fpsyg.2012.00162
Affiliations
Dominic Petronzi1 & Paul Staples1 & David Sheffield1 & Thomas E. Hunt1 &
Sandra Fitton-Wilde1
* Dominic [email protected]
1 University of Derby, Enterprise Centre, Bridge Street, Derby DE1 3LD, UK
Further development of the Children’s Mathematics Anxiety Scale UK... 249