fundassure - tata aia lifetataaia.com/pdf/customer-service/fund-assure-life-report-oct-2011.pdf ·...
TRANSCRIPT
Investment Report, October 2011
FundAssure
Contact UsCIO’s Letter Market Outlook Equity Debt Hybrid

Debt Funds Hybrid FundsEquity Funds
With an improving global macro triggered by key decisions taken by the 17 Euro zone countries in the EU summit and some positive domestic cues coming in from the RBI, as they virtually signaled the end of the current rate hike cycle, the Indian equity markets put in a stellar performance in the month of October 2011.
The FIIs bought around USD 480 million in October 2011,taking their net buys for the calendar year to date to a modest USD 535 million. The Insurance companies were net sellers to the tune of USD 423 million in October 2011, their overall net buy for the calendar year standing at USD 3.68 billion even as the domestic mutual funds were marginal net sellers at USD 43 million, their overall net inflows for the calendar year standing at USD 1.02 billion. .
th On October 25 2011, the RBI raised the repo rate by 25 bps along expected lines to 8.50% but the market was positively surprised by its explicit guidance for a pause in rate hikes in the medium term, subject to some caveats. The RBI made it clear in the policy statement that they were concerned about the lower growth trajectory and that the growth would start to take predominance over inflation. In an unexpected move, the RBI also deregulated the savings rate, thus triggering a rate war in the banking sector, which would eventually benefit the end consumer.
The European Union summit came up with some far reaching outcomes as the leaders focused on the sustainability of Greek debt to around 120% of GDP by 2020, proposing a 50% haircut on Greek debt held by private holders, as against the 21% agreed earlier. The leaders proposed to increase the European Financial Stability Fund (EFSF) to €1 trillion, to take care of contagion risks to the other peripheral European nations as well as mandated the banks to boost their capital ratios to 9.0% by early 2012, bank recapitalization costs pegged at around €106 billion.
India's exports for the first half of financial year April-September 2011 registered a robust performance clocking an impressive growth of 52% at USD 160 billion while imports jumped 32% to total USD 233.5 billion over the same period resulting in a first half trade deficit of USD 73.5 billion.The export numbers are particularly impressive, given the sharp slowdown in the global PMIs and moderating growth in most trading partner economies.
Wholesale Price Index (WPI) inflation for the month of September 2011 clocked 9.72% close to the consensus of 9.8% and marginally below the August 2011 reading of 9.78%. Inflation is expected to remain at an uncomfortable 9% plus levels for October 2011 and November 2011before trending to 8% levels in December 2011, primarily due to base effects.
The Index of Industrial Production (IIP) for August 2011 came in at a muted 4.1% year on year, below the consensus of 4.8%, despite a favorable base effect as the IIP growth in August 2010 was a low 4.5%. The economic growth is clearly on a decelerating trajectory on the back of a slew of rate hikes by the RBI as well as a weakening global growth outlook.
In what could well be a far reaching policy, the government approved the revised proposal on the national manufacturing policy in a bid to increase the share of manufacturing to 25% in the Indian GDP by 2022 from the current share of just 16%. This policy seeks to add 100 million jobs in the manufacturing sector as against 16 million jobs created over the past 5 years. The policy also focuses on the key enablers seeking to “enhance global competitiveness, domestic value addition, technological depth and environmental sustainability of growth”.
The equity markets have continued to witness earnings downgrades as the consensus earnings estimates for MSCI India has been further reduced over the month by around 1% and around 2% for financial year ending March 2012 and March 2013 respectively to 16% for each of the financial years. However, the equity markets continue to trade at reasonable valuations in spite of the October 2011 rally and present an attractive entry point for a long term investor.
Dear Friends,
The month of October 2011 witnessed a massive rally in global equity markets with the Indian benchmark indices, BSE Sensex and
CNX Nifty surging 7.6% and 7.8% respectively even as the CNX Midcap index put in a relatively modest performance, gaining 2.4%
for the month.
Saravana KumarChief Investment Officer
From the CIO’s DeskFundAssure, Investment Report, October 2011

Debt Funds Hybrid FundsEquity Funds
he month of October 2011 saw the the benchmark 10 year TGovernment security (G-sec) climbing to a 3 year high, starting
the month at 8.44% and hardening by 44 bps to close the month at
8.88%, at the highest yield levels for the month. This extraordinary
hardening can be largely attributed to the announcement in the last
week of September of additional government borrowing of close to
`52,900 crores in the second half of FY 2012, whose full impact was
felt in the month of October. The yields on the G-sec had eased off to
8.68% during the month soon after the RBI guidance in the second
quarter review of the monetary policy, signaling a near term pause in
the rate hike cycle.
The corporate bond yield hardening was comparatively muted at 17
bps in October 2011 from 9.58% to 9.75%, primarily due to a lack of
supply of PSU bonds in the long end, during the month. As a
consequence, the corporate bond spread over the 10 year G-sec,
which was in the range of around 95-100 bps over the month of
September, came off sharply to just 70 bps in October.
The systemic liquidity deficit remained in the RBIs comfort zone of
within 1% of banks' net demand and time liabilities (NDTL),
consistent with the anti-inflationary stance of monetary policy. This
year so far, the money supply (M3) and credit growth have been
above the indicative trajectories of the Reserve Bank but going
forward, the RBI expects the monetary aggregates to evolve along
the earlier projected trajectory at M3 growth projection for 2011-12 at
15.5% and non-food credit growth at 18%.
The Government borrowings for October 2011 stood at `43,000
crores in three auctions ,out of the revised second half borrowing of st`2,20,000 crores. On October 31 , there was an announcement of the
launch of a new 10 year G-sec, to be traded a week afterwards, which
would become the new benchmark G-sec due its higher liquidity.
Market Outlook - DebtFundAssure, Investment Report, October 2011
Wholesale Price Index (WPI) inflation for the month of September
2011 clocked 9.72%, close to the consensus of 9.8% and marginally
below the August 2011 reading of 9.78%. The headline WPI inflation
is expected to remain elevated at 9% plus levels in October and
November, before trending lower.
The Reserve Bank of India (RBI) in its second quarter review of the
monetary policy for FY 2012 has increased the repo rate by 25 basis
points from 8.25% to 8.5% along expected lines. The RBI sees the
inflation declining, starting December 2011, as indicated by the
moderation in the inflation momentum indicators, particularly the de-
seasonalised quarter-on-quarter headline and core inflation
measures. The RBI was concerned about the moderating growth,
mainly due to the cumulative impact of its past monetary policy actions
and expects to give due consideration to growth risks, as inflation
trends down in the medium term and stabilizes at a lower level.
The RBI has maintained the inflation target of 7% by March 2012 and
expects further moderation in the first half of 2012-13 due to the
combined effect of downward commodity price movements and the
cumulative impact of monetary tightening. RBI opines that due to the
expected lower trajectory for inflation, further rate hikes may not be
warranted, almost signaling the end of the current rate hike cycle in
the near term.
There would be some easing of yields in the medium term due the
explicit signaling of a pause in the policy rate hike cycle by the RBI,
though in the near term, the increased second half borrowing would
put pressure on the benchmark 10 year G-sec and keep the new 10
year G-sec in a range of 8.65-8.90% for the month.

Debt Funds Hybrid FundsEquity Funds
he global equity markets rallied over the month of October 2011, Twith the MSCI Emerging markets index surging 13% even as the
MSCI India gained 8% over the month in US dollar terms. The
benchmark indices, BSE Sensex and CNX Nifty gained 7.6% and
7.8% respectively even as the CNX Midcap index put on a relatively
modest 2.4% over the month.
Globally, the rally in risk assets can be best described as a relief rally,
post the EU summit, on expectations of some near term solution to
the sovereign credit crises as well as the receding possibility of US
recession, as the US third quarter GDP growth came in at a
reasonable 2.5%. On the domestic front, the RBI guidance of
signaling a pause in monetary tightening cycle acted as a catalyst for
investor sentiment.
The month of October 2011 saw FIIs resume their net purchases of
Indian equities after a two month lull, as they bought around USD
480 million in October 2011 even as Insurance companies were net
sellers to the tune of USD 423 million in October 2011, domestic
mutual funds being marginal net sellers at USD 43 million.
As the second quarter earnings season gathers momentum, it is
apparent that the interest rate increases pushed through by the RBI
over the last 18 months have dented corporate margins, even as they
have managed robust top line growth, on the back of high inflation. Of
the 90 companies among the BSE 200 companies that have
announced their second quarter results so far , the sales growth (ex
Banking and financial services companies) has been a robust 25.6%
year on year and 1.6% quarter on quarter. Profits for the overall
universe have meanwhile climbed by 8% year on year but are down
7% quarter on quarter. There is clearly evidence of a year on year fall
in operating margins, indicating continued stress to earnings faced by
corporate India, though it is too early to discern sectoral trends.
Market Outlook - EquityFundAssure, Investment Report, October 2011
Overall, the quarterly earnings performance reflects the underlying
macro trend of a strong rural consumption on the back of good
monsoons, high MSPs and increased rural led government
spending. It also reflects a weak capex cycle due to high interest
rates and muted business confidence of corporate India to
undertake significant expansion in an environment of high policy
uncertainty.
The equity markets have continued to witness earnings downgrades
as the consensus earnings estimates for MSCI India has been
further reduced over the month by around 1% and around 2% for
financial year ending March 2012 and March 2013 respectively to
16% for each of the financial years.
In the near term, the Indian markets could witness bouts of volatility,
primarily from the developments in the Euro zone. The European
nations are striving towards preventing contagion risks to large
economies like Italy and Spain, on the back of increasing uncertainty
in Greece, triggered by the Greek Prime minister's call of a
referendum on the EU summit deal.
We believe that the equity markets are reasonably priced at around
13 times one year forward price earnings, lesser than the 5 year
averages of one year forward price earnings, offering an attractive
entry point for a long term investor.

Debt Funds Hybrid FundsEquity Funds
Life Equity FundWhole Life
Mid-Cap Equity FundLife Large Cap
Equity FundFuture Equity Pension Fund
Life Select Equity Fund
Future Select Equity Fund Tata AIG Top 50 Tata AIG Top 200
Infrastructure Fund Super Select Equity Fund
Super Select Equity Pension Fund
FundAssure, Investment Report, October 2011
Debt Funds Hybrid FundsEquity Funds
Life Equity Fund
FundAssure, Investment Report, October 2011
Asset AllocationSector Allocation
Portfolio
Investment Style
Fund Details
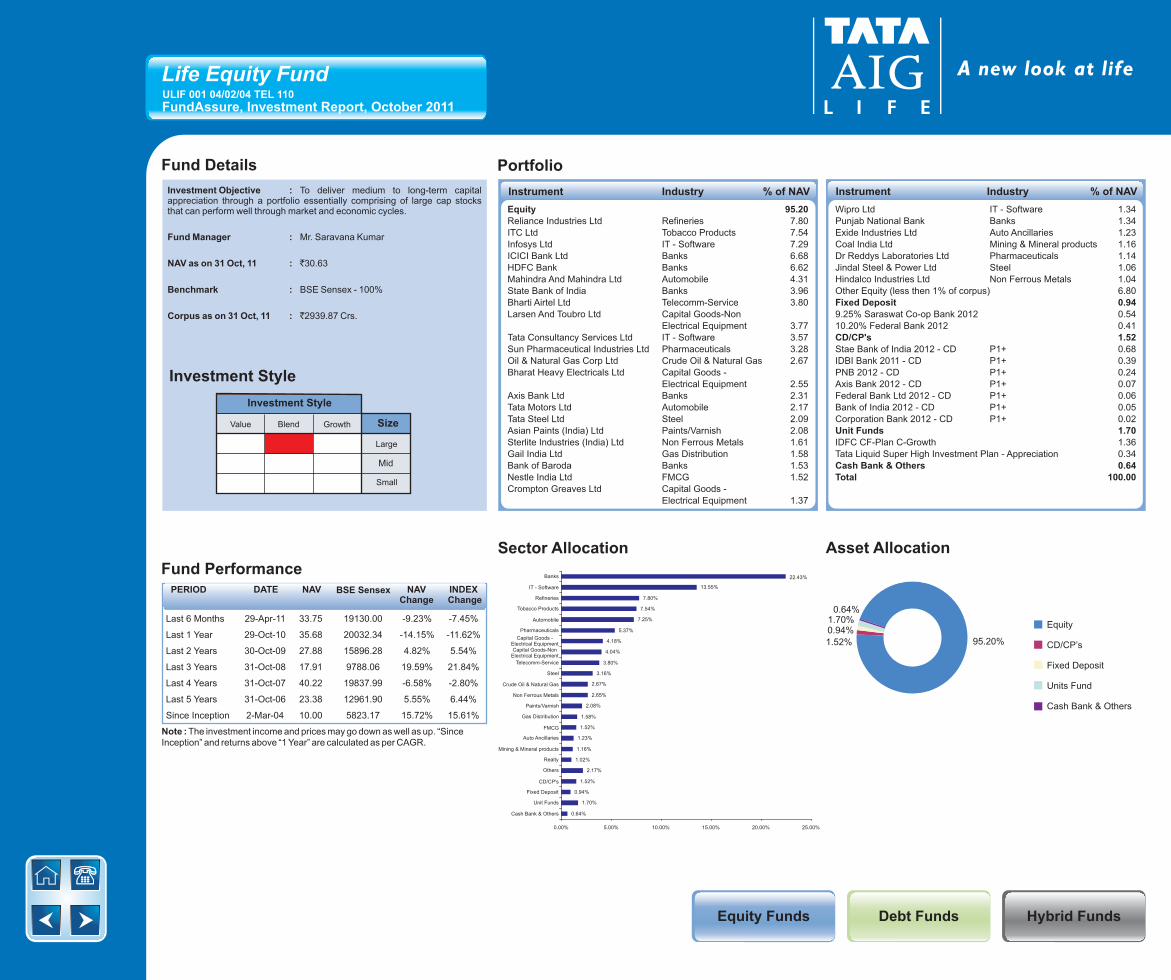
Investment Objective : appreciation through a portfolio essentially comprising of large cap stocks that can perform well through market and economic cycles.
Fund Manager : Mr. Saravana Kumar
NAV as on 31 Oct, 11 : `30.63
Benchmark : BSE Sensex - 100%
Corpus as on : `2939.87 Crs.
To deliver medium to long-term capital
31 Oct, 11
Investment Style
Value Blend Growth Size
Large
Mid
Small
Equity
CD/CP’s
Fixed Deposit
Units Fund
Cash Bank & Others
Instrument Industry % of NAVInstrument Industry % of NAV
Equity 95.20
Reliance Industries Ltd Refineries 7.80
ITC Ltd Tobacco Products 7.54
Infosys Ltd IT - Software 7.29
ICICI Bank Ltd Banks 6.68
HDFC Bank Banks 6.62
Mahindra And Mahindra Ltd Automobile 4.31
State Bank of India Banks 3.96
Bharti Airtel Ltd Telecomm-Service 3.80
Larsen And Toubro Ltd Capital Goods-Non
Electrical Equipment 3.77
Tata Consultancy Services Ltd IT - Software 3.57
Sun Pharmaceutical Industries Ltd Pharmaceuticals 3.28
Oil & Natural Gas Corp Ltd Crude Oil & Natural Gas 2.67
Bharat Heavy Electricals Ltd Capital Goods -
Electrical Equipment 2.55
Axis Bank Ltd Banks 2.31
Tata Motors Ltd Automobile 2.17
Tata Steel Ltd Steel 2.09
Asian Paints (India) Ltd Paints/Varnish 2.08
Sterlite Industries (India) Ltd Non Ferrous Metals 1.61
Gail India Ltd Gas Distribution 1.58
Bank of Baroda Banks 1.53
Nestle India Ltd FMCG 1.52
Crompton Greaves Ltd Capital Goods -
Electrical Equipment 1.37
Wipro Ltd IT - Software 1.34
Punjab National Bank Banks 1.34
Exide Industries Ltd Auto Ancillaries 1.23
Coal India Ltd Mining & Mineral products 1.16
Dr Reddys Laboratories Ltd Pharmaceuticals 1.14
Jindal Steel & Power Ltd Steel 1.06
Hindalco Industries Ltd Non Ferrous Metals 1.04
Other Equity (less then 1% of corpus) 6.80
Fixed Deposit 0.94
9.25% Saraswat Co-op Bank 2012 0.54
10.20% Federal Bank 2012 0.41
CD/CP's 1.52
Stae Bank of India 2012 - CD P1+ 0.68
IDBI Bank 2011 - CD P1+ 0.39
PNB 2012 - CD P1+ 0.24
Axis Bank 2012 - CD P1+ 0.07
Federal Bank Ltd 2012 - CD P1+ 0.06
Bank of India 2012 - CD P1+ 0.05
Corporation Bank 2012 - CD P1+ 0.02
Unit Funds 1.70
IDFC CF-Plan C-Growth 1.36
Tata Liquid Super High Investment Plan - Appreciation 0.34
Cash Bank & Others 0.64
Total 100.00
Asset Mix
Equity Upto 100% 92%
Debt * 0 8%
Cash & Money Market ** up to 100% 8%
Instrument INDEX Change
* Actual Asset Mix % includes Cash & Money Market** Cash & Money Market includes current assets
Asset Mix as per F&U
0.64%1.70%0.94%
1.52% 95.20%
Note : The investment income and prices may go down as well as up. “SinceInception” and returns above “1 Year” are calculated as per CAGR.
ULIF 001 04/02/04 TEL 110
Fund PerformancePERIOD DATE NAV INDEX
ChangeNAV
Change BSE Sensex
Last 6 Months 29-Apr-11 33.75 19130.00 -9.23% -7.45%
Last 1 Year 29-Oct-10 35.68 20032.34 -14.15% -11.62%
Last 2 Years 30-Oct-09 27.88 15896.28 4.82% 5.54%
Last 3 Years 31-Oct-08 17.91 9788.06 19.59% 21.84%
Last 4 Years 31-Oct-07 40.22 19837.99 -6.58% -2.80%
Last 5 Years 31-Oct-06 23.38 12961.90 5.55% 6.44%
Since Inception 2-Mar-04 10.00 5823.17 15.72% 15.61%
22.43%
13.55%
7.80%
7.54%
7.25%
5.37%
4.18%
4.04%
3.80%
3.16%
2.67%
2.65%
2.08%
1.58%
1.52%
1.23%
1.16%
1.02%
2.17%
1.52%
0.94%
1.70%
0.64%
0.00% 5.00% 10.00% 15.00% 20.00% 25.00%
Banks
IT - Software
Refineries
Tobacco Products
Automobile
Pharmaceuticals
Capital Goods - Electrical EquipmentCapital Goods-Non
Electrical Equipment
Telecomm-Service
Steel
Crude Oil & Natural Gas
Non Ferrous Metals
Paints/Varnish
Gas Distribution
FMCG
Auto Ancillaries
Mining & Mineral products
Realty
Others
CD/CP's
Fixed Deposit
Unit Funds
Cash Bank & Others

Debt Funds Hybrid FundsEquity Funds
Whole Life Mid-Cap Equity Fund
FundAssure, Investment Report, October 2011
Asset AllocationSector Allocation
Portfolio
Investment Style
Fund Details
Investment Objective : The primary investment objective of the fund is to generate long–term capital appreciation from a portfolio that is invested pre-dominantly in Mid Cap Equity and Mid Cap Equity linked securities.
Fund Manager : Mr. Saravana Kumar
NAV as on : `12.90
Benchmark : NSE CNX MIDCAP-100%
Corpus as on : `1555.88 Crs.
31 Oct, 11
31 Oct, 11
Investment Style
Value Blend Growth Size
Large
Mid
Small
Equity
Fixed Deposit
Units Fund
Cash Bank & Others
CD/CP’sNote : The investment income and prices may go down as well as up. “SinceInception” and returns above “1 Year” are calculated as per CAGR.
Instrument Industry % of NAVInstrument Industry % of NAV
Equity 90.93Lupin Ltd Pharmaceuticals 3.90Asian Paints (India) Ltd Paints/Varnish 3.82Cadila Healthcare Ltd Pharmaceuticals 3.01Titan Industries Ltd Consumer Durables 2.94Nestle India Ltd FMCG 2.78Divi'S Laboratories Ltd Pharmaceuticals 2.57Coromandel International Ltd Fertilizers 2.32Yes Bank Ltd Banks 2.23Oriental Bank of Commerce Banks 2.21Union Bank of India Banks 2.03Shriram Transport Finance Co Ltd Finance 2.02Glaxosmithkline Consumer Healthcare Ltd FMCG 2.00Bosch Ltd Auto Ancillaries 1.91Shree Cement Ltd Cement 1.89Godrej Consumer Products Ltd FMCG 1.87Rallis India Ltd Agro Chemicals 1.78Coal India Ltd Mining & Mineral products 1.77Federal Bank Ltd Banks 1.76Chambal Fertilizers And Chemicals Ltd Fertilizers 1.68Punjab National Bank Banks 1.63Torrent Pharmaceuticals Ltd Pharmaceuticals 1.61Jammu & Kashmir Bank Ltd Banks 1.49Exide Industries Ltd Auto Ancillaries 1.48Bharat Petroleum Corp Ltd Refineries 1.45
HCL Technologies Ltd IT - Software 1.41Bank of Baroda Banks 1.39Ultratech Cement Ltd Cement 1.35Gujarat Gas Company Ltd Gas Distribution 1.33Crompton Greaves Ltd Capital Goods - Electrical
Equipment 1.26Allahabad Bank Banks 1.22Power Finance Corp Ltd Finance 1.21Hindustan Zinc Ltd Non Ferrous Metals 1.18Colgate-Palmolive (India) Ltd FMCG 1.16Aditya Birla Nuvo Ltd Textiles 1.14United Phosphorus Ltd Agro Chemicals 1.13Petronet Lng Ltd Gas Distribution 1.03IPCA Laboratories Limited Pharmaceuticals 1.03ING Vysya Bank Ltd Banks 1.02Other Equity (less then 1% of corpus) 21.92CD/CP's 1.48Oriental Bank of Commerce2012 - CD P1+ 1.48Fixed Deposit 0.689.25% Saraswat Co-op Bank 2012 0.68Unit Funds 5.59IDFC CF-Plan C-Growth 3.86Tata Liquid Super High Investment Plan - Appreciation 1.74Cash Bank & Others 1.32Total 100.00
Asset Mix
Equity 85%
Debt * 0 15%
Cash & Money Market ** up to 100% 15%
up to 100%
Instrument INDEX Change
* Actual Asset Mix % includes Cash & Money Market** Cash & Money Market includes current assets
Asset Mix as per F&U
ULIF 009 04/01/07 WLE 110
Fund Performance
Last 6 Months 29-Apr-11 13.88 8200.95 -7.08% -11.39%
Last 1 Year 29-Oct-10 15.22 9360.70 -15.25% -22.37%
Last 2 Years 30-Oct-09 10.92 6579.80 8.67% 5.09%
Last 3 Years 31-Oct-08 6.60 3506.40 25.06% 27.50%
Last 4 Years 31-Oct-07 14.34 7450.35 -2.62% -0.62%
Since Inception 8-Jan-07 10.00 5156.45 5.43% 7.39%
PERIOD DATE NAV INDEX Change
NAV Change
NSE CNX MIDCAP 16.29%
13.37%
8.64%
4.98%
4.30%
3.82%
3.45%
3.40%
3.23%
3.23%
3.14%
2.90%
2.37%
2.03%
1.84%
1.77%
1.45%
1.18%
1.14%
1.02%
7.38%
1.48%
5.59%
0.68%
1.32%
0% 2% 4% 6% 8% 10% 12% 14% 16% 18%
Banks
Pharmaceuticals
FMCG
Auto Ancillaries
Fertilizers
Paints/Varnish
Consumer Durables
IT - Software
Cement
Finance
Gas Distribution
Agro Chemicals
Capital Goods - Electrical Equipment
Capital Goods-Non Electrical Equipment
Power Generation & Distribution
Mining & Mineral products
Refineries
Non Ferrous Metals
Textiles
Diversified
Others
CD/CP's
Unit Funds
Fixed Deposit
Cash Bank & Others
0.68%
1.32%1.48%5.59%90.93%

Debt Funds Hybrid FundsEquity Funds
Life Large Cap Equity Fund
FundAssure, Investment Report, October 2011
Asset AllocationSector Allocation
Portfolio
Investment Style
Fund Details
Investment Objective : The primary investment objective of the fund is to generate long-term capital appreciation from a portfolio that is invested pre-dominantly in equity and equity linked securities.
Fund Manager : Mr. Saravana Kumar
NAV as on : `10.47
Benchmark : S&P CNX Nifty-100%
Corpus as on : `751.85 Crs.
31 Oct, 11
31 Oct, 11
Investment Style
Value Blend Growth Size
Large
Mid
Small
Equity
Unit Funds
Cash Bank & Others
Note : The investment income and prices may go down as well as up. “SinceInception” and returns above “1 Year” are calculated as per CAGR.
Instrument Industry % of NAVInstrument Industry % of NAV
Equity 94.12
ITC Ltd Tobacco Products 8.19
Reliance Industries Ltd Refineries 7.16
ICICI Bank Ltd Banks 6.79
Infosys Ltd IT - Software 6.35
HDFC Bank Banks 6.22
State Bank of India Banks 3.96
Tata Consultancy Services Ltd IT - Software 3.49
Mahindra And Mahindra Ltd Automobile 3.40
Oil & Natural Gas Corp Ltd Crude Oil & Natural Gas 3.40
Sun Pharmaceutical Industries Ltd Pharmaceuticals 3.03
Bharti Airtel Ltd Telecomm-Service 2.97
Larsen And Toubro Ltd Capital Goods-Non
Electrical Equipment 2.82
Coal India Ltd Mining & Mineral products 2.74
Bajaj Auto Ltd - New Shs Automobile 2.19
Bharat Heavy Electricals Ltd Capital Goods -
Electrical Equipment 2.15
Axis Bank Ltd Banks 2.14
Tata Motors Ltd Automobile 1.95
Dr Reddys Laboratories Ltd Pharmaceuticals 1.95
Bank of Baroda Banks 1.59
Tata Steel Ltd Steel 1.48
Union Bank of India Banks 1.40
Jindal Steel & Power Ltd Steel 1.23
Punjab National Bank Banks 1.22
Sterlite Industries (India) Ltd Non Ferrous Metals 1.19
Divi'S Laboratories Ltd Pharmaceuticals 1.11
Hindalco Industries Ltd Non Ferrous Metals 1.09
HCL Technologies Ltd IT - Software 1.08
Gail India Ltd Gas Distribution 1.04
Other Equity (less then 1% of corpus) 10.79
Unit Funds 3.39
HDFC Cash Management Fund - Savings Plan (Growth Option) 3.39
Cash Bank & Others 2.49
Total 100.00
Asset Mix
Equity Upto 100% 88%
Debt * 0 12%
Cash & Money Market ** up to 100% 12%
Instrument INDEX Change
* Actual Asset Mix % includes Cash & Money Market** Cash & Money Market includes current assets
Asset Mix as per F&U
94.12%3.39%
2.49%
ULIF 017 07/01/08 TLC 110
Fund Performance
Last 6 Months 29-Apr-11 11.36 5749.50 -7.82% -7.36%
Last 1 Year 29-Oct-10 11.80 6017.70 -11.25% -11.48%
Last 2 Years 30-Oct-09 9.20 4711.70 6.70% 6.33%
Last 3 Years 31-Oct-08 5.95 2885.60 20.74% 22.67%
Since Inception 07-Jan-08 10.00 6279.10 1.21% -4.22%
PERIOD DATE NAV INDEX Change
NAV Change
S&P CNX Nifty
25.00%
23.32%
11.80%
8.19%
8.13%
8.10%
6.82%
3.40%
2.97%
2.93%
2.90%
2.74%
2.71%
2.28%
1.22%
1.04%
5.57%
3.39%
2.49%
0.00% 5.00% 10.00% 15.00% 20.00%
Banks
IT - Software
Tobacco Products
Automobile
Refineries
Pharmaceuticals
Crude Oil & Natural Gas
Telecomm-Service
Capital Goods-Non Electrical Equipment
Capital Goods - Electrical Equipment
Mining & Mineral products
Steel
Non Ferrous Metals
Power Generation & Distribution
Gas Distribution
Others
Unit Funds
Cash Bank & Others

Debt Funds Hybrid FundsEquity Funds
Future Equity Pension Fund
FundAssure, Investment Report, October 2011
Asset AllocationSector Allocation
Portfolio
Investment Style
Fund Details
Investment Objective : The primary investment objective of the fund is to generate long-term capital appreciation from a portfolio that is invested pre-dominantly in equity and equity-linked securities.
Fund Manager : Mr. Saravana Kumar
NAV as on : `11.91
Benchmark : S&P CNX Nifty-100%
Corpus as on : `212.74 Crs.
31 Oct, 11
31 Oct, 11
Investment Style
Value Blend Growth Size
Large
Mid
Small
Equity
Cash Bank & Others
Unit Funds
Note : The investment income and prices may go down as well as up. “Since Inception” and returns above “1 Year” are calculated as per CAGR.
Instrument Industry % of NAVInstrument Industry % of NAV
Equity 92.40
Infosys Ltd IT - Software 7.98
Reliance Industries Ltd Refineries 7.63
ITC Ltd Tobacco Products 6.61
HDFC Bank Banks 6.51
ICICI Bank Ltd Banks 6.13
State Bank of India Banks 3.81
Tata Consultancy Services Ltd IT - Software 3.67
Larsen And Toubro Ltd Capital Goods-
Non Electrical Equipment 3.45
Bharti Airtel Ltd Telecomm-Service 3.23
Sun Pharmaceutical
Industries Ltd Pharmaceuticals 2.73
Mahindra And Mahindra Ltd Automobile 2.44
Oil & Natural Gas Corp Ltd Crude Oil & Natural Gas 2.41
Bajaj Auto Ltd - New Shs Automobile 2.24
Axis Bank Ltd Banks 2.07
Dr Reddys Laboratories Ltd Pharmaceuticals 1.96
Bharat Heavy Electricals Ltd Capital Goods -
Electrical Equipment 1.87
Jindal Steel & Power Ltd Steel 1.85
Tata Motors Ltd Automobile 1.77
Tata Steel Ltd Steel 1.70
Coal India Ltd Mining & Mineral products 1.56
Power Finance Corp Ltd Finance 1.48
GAIL India Ltd Gas Distribution 1.39
Punjab National Bank Banks 1.38
Sterlite Industries (India) Ltd Non Ferrous Metals 1.34
Cipla Ltd Pharmaceuticals 1.25
Grasim Industries Ltd Diversified 1.17
Maruti Suzuki India Ltd Automobile 1.06
Bharat Forge Ltd Castings, Forgings & Fastners 1.06
Bank of Baroda Banks 1.04
NTPC Ltd Power Generation & Distribution 1.01
Other Equity (less then 1% of corpus) 8.61
Unit Funds 3.76
HDFC Cash Management Fund - Savings Plan (Growth Option) 3.76
Cash Bank & Others 3.84
Total 100.00
3.76%
92.40%
Asset Mix
Equity 80% - 100% 92%
Debt * 0 8%
Cash & Money Market ** up to 20% 8%
Instrument INDEX Change
* Actual Asset Mix % includes Cash & Money Market** Cash & Money Market includes current assets
Asset Mix as per F&U
3.84%
ULIF 020 04/02/08 FEP 110
Fund Performance
Last 6 Months 29-Apr-11 12.97 5749.50 -8.18% -7.36%
Last 1 Year 29-Oct-10 13.52 6017.70 -11.92% -11.48%
Last 2 Years 30-Oct-09 10.43 4711.70 6.86% 6.33%
Last 3 Years 31-Oct-08 6.59 2885.60 21.81% 22.67%
Since Inception 04-Feb-08 10.00 5463.50 4.79% -0.68%
PERIOD DATE NAV INDEX Change
NAV Change
S&P CNX Nifty21.94%
13.08%
7.63%
7.51%
6.61%
5.94%
3.55%
3.45%
3.23%
2.71%
2.69%
2.41%
2.33%
2.21%
1.56%
1.48%
1.39%
1.06%
0.83%
0.80%
3.76%
3.84%
0.00% 5.00% 10.00% 15.00% 20.00% 25.00%
Banks
IT - Software
Refineries
Automobile
Tobacco Products
Pharmaceuticals
Steel
Capital Goods-Non Electrical Equipment
Telecomm-Service
Power Generation & Distribution
Capital Goods - Electrical Equipment
Crude Oil & Natural Gas
Non Ferrous Metals
Diversified
Mining & Mineral products
Finance
Gas Distribution
Castings, Forgings & Fastners
Trading
Auto Ancillaries
Unit Funds
Cash Bank & Others

Debt Funds Hybrid FundsEquity Funds
Life Select Equity Fund
FundAssure, Investment Report, October 2011
Asset AllocationSector Allocation
Portfolio
Investment Style
Fund Details
Investment Objective : The primary investment objective of the fund is to provide income distribution over a period of medium to long term while at all times emphasizing the importance of capital appreciation. The fund will invest significant amount in equity and equity linked instruments specifically excluding companies predominantly dealing in Gambling, Lotteries / Contests, Animal Produce, Liquor, Tobacco, Entertainment (Films, TV etc) Hotels, Banks and Financial Institutions.
Fund Manager : Mr. Saravana Kumar
NAV as on : `17.11
Benchmark : S & P India 500 Shariah Index - 100%
Corpus as on : `172.03Crs.
31 Oct, 11
31 Oct, 11
Investment Style
Value Blend Growth Size
Large
Mid
Small
Equity
Cash Bank & Others (Non Interest Bearing Securities)
Note : The investment income and prices may go down as well as up. “SinceInception” and returns above “1 Year” are calculated as per CAGR.
Instrument Industry % of NAVInstrument Industry % of NAV
Equity 88.85
Infosys Ltd IT - Software 9.03
Reliance Industries Ltd Refineries 8.67
Bharti Airtel Ltd Telecomm-Service 4.10
Sun Pharmaceutical Industries Ltd Pharmaceuticals 3.52
Tata Consultancy Services Ltd IT - Software 3.24
Bajaj Auto Ltd - New Shs Automobile 2.77
Oil & Natural Gas Corp Ltd Crude Oil & Natural Gas 2.58
Godrej Consumer Products Ltd FMCG 2.52
Larsen And Toubro Ltd Capital Goods-Non
Electrical Equipment 2.46
Coal India Ltd Mining & Mineral products 2.22
Asian Paints (India) Ltd Paints/Varnish 2.20
Dr Reddys Laboratories Ltd Pharmaceuticals 2.14
Cadila Healthcare Ltd Pharmaceuticals 2.00
Jindal Steel & Power Ltd Steel 1.94
HCL Technologies Ltd IT - Software 1.93
Glaxosmithkline Consumer
Healthcare Ltd FMCG 1.91
Gail India Ltd Gas Distribution 1.84
Divi'S Laboratories Ltd Pharmaceuticals 1.79
Lupin Ltd Pharmaceuticals 1.78
Bharat Heavy Electricals Ltd Capital Goods -
Electrical Equipment 1.76
Gujarat Gas Company Ltd Gas Distribution 1.75
Oracle Financial Services
Software Ltd IT - Software 1.66
Titan Industries Ltd Consumer Durables 1.64
Cipla Ltd Pharmaceuticals 1.63
Sterlite Industries (India) Ltd Non Ferrous Metals 1.63
Hindustan Unilever Ltd FMCG 1.60
Castrol India Ltd Chemicals 1.58
Maruti Suzuki India Ltd Automobile 1.47
NTPC Ltd Power Generation &
Distribution 1.41
Exide Industries Ltd Auto Ancillaries 1.34
Motherson Sumi Systems Ltd Auto Ancillaries 1.30
Alstom Projects India Ltd Capital Goods -
Electrical Equipment 1.24
Wipro Ltd IT - Software 1.17
Crompton Greaves Ltd Capital Goods -
Electrical Equipment 1.14
Hindalco Industries Ltd Non Ferrous Metals 1.10
Thermax Limited Capital Goods-Non
Electrical Equipment 1.08
Grasim Industries Ltd Diversified 1.08
Colgate-Palmolive (India) Ltd FMCG 1.05
Other Equity (less then 1% of corpus) 3.58
Cash Bank & Others - Non Interest
Bearing Securities 11.15
Total 100.00
Asset Mix
Equity Upto 100% 92%
Debt * 0 8%
Cash & Money Market ** up to 100% 8%
Instrument INDEX Change
* Actual Asset Mix % includes Cash & Money Market** Cash & Money Market includes current assets
Asset Mix as per F&U
11.15%
88.85%
ULIF 024 06/10/08 TSE 110
Fund Performance
Last 6 Months 29-Apr-11 17.99 1322.23 -4.88% -4.95%
Last 1 Year 29-Oct-10 18.55 1408.93 -7.77% -10.80%
Last 2 Years 30-Oct-09 14.47 1132.92 8.76% 5.32%
Last 3 Years 31-Oct-08 10.02 684.97 19.54% 22.42%
Since Inception 06-Oct-08 10.00 844.46 19.13% 13.83%
PERIOD DATE NAV INDEX Change
NAV Change
S & P India 500 Shariah Index
17.64%
12.86%
8.67%
7.08%
4.24%
4.13%
4.10%
3.59%
3.55%
3.41%
3.11%
2.73%
2.43%
2.22%
2.20%
1.81%
1.64%
1.58%
1.41%
0.47%
11.15%
0.00% 2.00% 4.00% 6.00% 8.00% 10.00% 12.00% 14.00% 16.00% 18.00% 20.00%
IT - Software
Pharmaceuticals
Refineries
FMCG
Automobile
Capital Goods - Electrical Equipment
Telecomm-Service
Gas Distribution
Capital Goods-Non Electrical Equipment
Auto Ancillaries
Crude Oil & Natural Gas
Non Ferrous Metals
Steel
Mining & Mineral products
Paints/Varnish
Diversified
Consumer Durables
Chemicals
Power Generation & Distribution
Cement
Cash Bank & Others( Non Interest Bearing Securities)

Debt Funds Hybrid FundsEquity Funds
Future Select Equity Fund
FundAssure, Investment Report, October 2011
Asset AllocationSector Allocation
Portfolio
Investment Style
Fund Details
Investment Objective : The primary investment objective of the fund is to provide income distribution over a period of medium to long term while at all times emphasizing the importance of capital appreciation. The fund will invest significant amount in equity and equity linked instruments specifically excluding companies predominantly dealing in Gambling, Lotteries/Contests, Animal Produce, Liquor, Tobacco, Entertainment (Films, TV etc) Hotels, Banks and Financial Institutions.
Fund Manager : Mr. Saravana Kumar
NAV as on : `16.66
Benchmark : S & P India 500 Shariah Index - 100%
Corpus as on : `27.39 Crs.
31 Oct, 11
31 Oct, 11
Investment Style
Value Blend Growth Size
Large
Mid
Small
Equity
Cash Bank & Others (Non Interest Bearing Securities)
Note : The investment income and prices may go down as well as up. “SinceInception” and returns above “1 Year” are calculated as per CAGR.
Instrument Industry % of NAVInstrument Industry % of NAV
Equity 93.11
Reliance Industries Ltd Refineries 8.97
Infosys Ltd IT - Software 8.93
Bharti Airtel Ltd Telecomm-Service 3.93
Tata Consultancy Services Ltd IT - Software 3.67
Sun Pharmaceutical Industries Ltd Pharmaceuticals 3.41
Bajaj Auto Ltd - New Shs Automobile 2.99
Cadila Healthcare Ltd Pharmaceuticals 2.79
Oil & Natural Gas Corp Ltd Crude Oil & Natural Gas 2.64
Lupin Ltd Pharmaceuticals 2.58
Dr Reddys Laboratories Ltd Pharmaceuticals 2.47
Indraprastha Gas Ltd Gas Distribution 2.43
HCL Technologies Ltd IT - Software 2.43
Godrej Consumer Products Ltd FMCG 2.40
Larsen And Toubro Ltd Capital Goods-Non
Electrical Equipment 2.32
Asian Paints (India) Ltd Paints/Varnish 2.31
Glaxosmithkline Consumer
Healthcare Ltd FMCG 2.15
Hindustan Unilever Ltd FMCG 2.06
Jindal Steel & Power Ltd Steel 2.05
Castrol India Ltd Chemicals 1.98
Divi'S Laboratories Ltd Pharmaceuticals 1.97
Gail India Ltd Gas Distribution 1.93
Oracle Financial Services
Software Ltd IT - Software 1.93
Bharat Heavy Electricals Ltd Capital Goods - Electrical
Equipment 1.89
Sterlite Industries (India) Ltd Non Ferrous Metals 1.86
Coal India Ltd Mining & Mineral products 1.82
Titan Industries Ltd Consumer Durables 1.79
Maruti Suzuki India Ltd Automobile 1.64
Exide Industries Ltd Auto Ancillaries 1.55
NTPC Ltd Power Generation & Distribution 1.47
Cipla Ltd Pharmaceuticals 1.46
Hindalco Industries Ltd Non Ferrous Metals 1.14
Crompton Greaves Ltd Capital Goods - Electrical
Equipment 1.12
Wipro Ltd IT - Software 1.12
Other Equity (less then 1% of corpus) 7.92
Cash Bank & Others - Non Interest
Bearing Securities 6.89
Total 100.00
6.89%
93.11%
Asset Mix
Equity Upto 100% 91%
Debt * 0 9%
Cash & Money Market ** up to 100% 9%
Instrument INDEX Change
* Actual Asset Mix % includes Cash & Money Market** Cash & Money Market includes current assets
Asset Mix as per F&U
ULIF 023 06/10/08 FSE 110
Fund Performance
Last 6 Months 29-Apr-11 17.49 1322.23 -4.73% -4.95%
Last 1 Year 29-Oct-10 18.10 1408.93 -7.96% -10.80%
Last 2 Years 30-Oct-09 14.26 1132.92 8.08% 5.32%
Last 3 Years 31-Oct-08 10.01 684.97 18.52% 22.42%
Since Inception 06-Oct-08 10.00 844.46 18.10% 13.83%
PERIOD DATE NAV INDEX Change
NAV Change
S & P India 500 Shariah Index 18.57%
14.68%
8.97%
6.97%
4.63%
4.36%
3.93%
3.92%
3.79%
3.17%
2.67%
2.64%
2.51%
2.31%
1.98%
1.82%
1.79%
1.47%
0.91%
2.02%
6.89%
0.00% 2.00% 4.00% 6.00% 8.00% 10.00% 12.00% 14.00% 16.00% 18.00% 20.00%
IT - Software
Pharmaceuticals
Refineries
FMCG
Automobile
Gas Distribution
Telecomm-Service
Non Ferrous Metals
Capital Goods - Electrical Equipment
Capital Goods-Non Electrical Equipment
Steel
Crude Oil & Natural Gas
Auto Ancillaries
Paints/Varnish
Chemicals
Mining & Mineral products
Consumer Durables
Power Generation & Distribution
Diversified
Others
Cash Bank & Others( Non Interest Bearing Securities)

Debt Funds Hybrid FundsEquity Funds
Tata AIG Top 50
FundAssure, Investment Report, October 2011
Asset AllocationSector Allocation
Portfolio
Investment Style
Fund Details
Investment Objective : The fund will invest primarily in select stocks and equity linked instruments which are a part of Nifty 50 Index with a focus on generating long term capital appreciation. The Fund will not replicate the index, but aim to attain performance better than the performance of the Index.
Fund Manager : Mr. Saravana Kumar
NAV as on : `16.29
Benchmark : S&P CNX Nifty-100%
Corpus as on : `57.35 Crs.
31 Oct, 11
31 Oct, 11
Investment Style
Value Blend Growth Size
Large
Mid
Small
Equity
Unit Fund
Note : The investment income and prices may go down as well as up. “SinceInception” and returns above “1 Year” are calculated as per CAGR.
Instrument Industry % of NAVInstrument Industry % of NAV
Equity 95.05
Infosys Ltd IT - Software 8.53
Reliance Industries Ltd Refineries 8.42
ITC Ltd Tobacco Products 7.06
ICICI Bank Ltd Banks 6.90
HDFC Bank Banks 5.98
State Bank of India Banks 4.32
Larsen And Toubro Ltd Capital Goods-Non
Electrical Equipment 3.94
Tata Consultancy Services Ltd IT - Software 3.89
Bharti Airtel Ltd Telecomm-Service 3.24
Mahindra And Mahindra Ltd Automobile 2.72
Oil & Natural Gas Corp Ltd Crude Oil & Natural Gas 2.42
HDFC Ltd Finance 2.40
Sun Pharmaceutical Industries Ltd Pharmaceuticals 2.20
Tata Motors Ltd Automobile 2.08
Bharat Heavy Electricals Ltd Capital Goods -
Electrical Equipment 1.94
Axis Bank Ltd Banks 1.87
Bajaj Auto Ltd - New Shs Automobile 1.81
Tata Steel Ltd Steel 1.68
Hindustan Unilever Ltd FMCG 1.64
Jindal Steel & Power Ltd Steel 1.57
Gail India Ltd Gas Distribution 1.47
Dr Reddys Laboratories Ltd Pharmaceuticals 1.46
Sterlite Industries (India) Ltd Non Ferrous Metals 1.33
Grasim Industries Ltd Diversified 1.30
NTPC Ltd Power Generation &
Distribution 1.25
HCL Technologies Ltd IT - Software 1.24
Punjab National Bank Banks 1.19
Maruti Suzuki India Ltd Automobile 1.18
Power Grid Corp of India Ltd Power Generation &
Distribution 1.10
Bharat Petroleum Corp Ltd Refineries 1.09
Wipro Ltd IT - Software 1.05
Cipla Ltd Pharmaceuticals 1.03
Hindalco Industries Ltd Non Ferrous Metals 1.01
Other Equity (less then 1% of corpus) 4.75
Unit Funds 3.49
HDFC Cash Management
Fund - Savings Plan (Growth Option) 3.49
Cash Bank & Others 1.46
Total 100.00
Asset Mix
Equity Upto 100% 93%
Debt * 0 7%
Cash & Money Market ** up to 100% 7%
Instrument INDEX Change
* Actual Asset Mix % includes Cash & Money Market** Cash & Money Market includes current assets
Asset Mix as per F&U
3.49%
95.05%
1.46%Cash Bank & Others
ULIF 026 12/01/09 ITF 110
Fund Performance
Last 6 Months 29-Apr-11 17.34 5749.50 -6.03% -7.36%
Last 1 Year 29-Oct-10 18.02 6017.70 -9.61% -11.48%
Last 2 Years 30-Oct-09 14.52 4711.70 5.94% 6.33%
Since Inception 12-Jan-09 10.00 2773.10 19.04% 26.25%
PERIOD DATE NAV INDEX Change
NAV Change
S&P CNX Nifty 21.16%
14.71%
9.50%
7.78%
7.06%
4.69%
3.94%
3.49%
3.37%
3.24%
2.75%
2.42%
2.34%
1.94%
1.64%
1.47%
1.38%
1.30%
0.87%
3.49%
1.46%
0.00% 5.00% 10.00% 15.00% 20.00% 25.00%
Banks
IT - Software
Refineries
Automobile
Tobacco Products
PharmaceuticalsCapital Goods-Non
Electrical EquipmentSteel
Power Generation & Distribution
Telecomm-Service
Finance
Crude Oil & Natural Gas
Non Ferrous MetalsCapital Goods -
Electrical EquipmentFMCG
Gas Distribution
Cement
Diversified
Others
Unit Funds
Cash Bank & Others

Debt Funds Hybrid FundsEquity Funds
Tata AIG Top 200
FundAssure, Investment Report, October 2011
Asset AllocationSector Allocation
Portfolio
Investment Style
Fund Details
Investment Objective : The fund will invest primarily in select stocks and equity linked instruments which are a part of BSE 200 Index with a focus on generating long-term capital appreciation. The Fund will not replicate the index but aim to attain performance better than the performance of the Index.
Fund Manager : Mr. Saravana Kumar
NAV as on : `17.91
Benchmark : BSE 200 - 100%
Corpus as on : `97.54 Crs.
31 Oct, 11
31 Oct, 11
Investment Style
Value Blend Growth Size
Large
Mid
Small
Equity
Unit Fund
Note : The investment income and prices may go down as well as up. “SinceInception” and returns above “1 Year” are calculated as per CAGR.
Instrument Industry % of NAVInstrument Industry % of NAV
Equity 92.11
Reliance Industries Ltd Refineries 5.85
Infosys Ltd IT - Software 4.72
ICICI Bank Ltd Banks 4.30
ITC Ltd Tobacco Products 4.26
HDFC Bank Banks 4.02
Mahindra And Mahindra Ltd Automobile 2.88
Bharti Airtel Ltd Telecomm-Service 2.71
Tata Consultancy Services Ltd IT - Software 2.64
Axis Bank Ltd Banks 2.38
Larsen And Toubro Ltd Capital Goods-Non
Electrical Equipment 2.32
State Bank of India Banks 2.15
Coal India Ltd Mining & Mineral products 2.04
Jindal Steel & Power Ltd Steel 2.01
Tata Motors Ltd Automobile 1.88
Oil & Natural Gas Corp Ltd Crude Oil & Natural Gas 1.88
Power Finance Corp Ltd Finance 1.84
Nestle India Ltd FMCG 1.82
Gail India Ltd Gas Distribution 1.73
Dr Reddys Laboratories Ltd Pharmaceuticals 1.71
Sterlite Industries (India) Ltd Non Ferrous Metals 1.70
Sun Pharmaceutical Industries Ltd Pharmaceuticals 1.55
Bharat Forge Ltd Castings, Forgings & Fastners 1.54
Bharat Heavy Electricals Ltd Capital Goods - Electrical
Equipment 1.47
Titan Industries Ltd Consumer Durables 1.34
Federal Bank Ltd Banks 1.28
Bajaj Auto Ltd - New Shs Automobile 1.24
Tata Steel Ltd Steel 1.24
HDFC Ltd Finance 1.24
Lupin Ltd Pharmaceuticals 1.21
NTPC Ltd Power Generation & Distribution 1.19
Divi'S Laboratories Ltd Pharmaceuticals 1.07
Asian Paints (India) Ltd Paints/Varnish 1.07
United Phosphorus Ltd Agro Chemicals 1.05
Hindalco Industries Ltd Non Ferrous Metals 1.05
Union Bank of India Banks 1.04
Maruti Suzuki India Ltd Automobile 1.04
Grasim Industries Ltd Diversified 1.02
Other Equity (less then 1% of corpus) 16.65
Unit Fund 3.08
HDFC Cash Management
Fund - Savings Plan (Growth Option) 3.08
Cash Bank & Others 4.81
Total 100.00
Asset Mix
Equity Upto 100% 88%
Debt * 0 12%
Cash & Money Market ** up to 100% 12%
Instrument INDEX Change
* Actual Asset Mix % includes Cash & Money Market** Cash & Money Market includes current assets
Asset Mix as per F&U
3.08%
92.11%
4.81%
Cash Bank & Others
ULIF 027 12/01/09 ITT 110
Fund Performance
Last 6 Months 29-Apr-11 19.36 2361.52 -7.49% -8.72%
Last 1 Year 29-Oct-10 20.44 2541.85 -12.38% -15.20%
Last 2 Years 30-Oct-09 15.84 1962.88 6.33% 4.79%
Since Inception 12-Jan-09 10.00 1091.37 23.14% 27.52%
PERIOD DATE NAV INDEX Change
NAV Change
BSE 20018.24%
9.37%
7.23%
7.05%
6.68%
4.26%
3.61%
3.30%
3.29%
2.74%
2.71%
2.69%
2.46%
2.35%
2.15%
2.04%
1.73%
1.55%
1.54%
1.34%
1.07%
1.05%
1.04%
2.62%
3.08%
4.81%
0.00% 2.00% 4.00% 6.00% 8.00% 10.00% 12.00% 14.00% 16.00% 18.00% 20.00%
Banks
IT - Software
Pharmaceuticals
Automobile
Refineries
Tobacco Products
FMCG
Finance
Steel
Non Ferrous Metals
Telecomm-Service
Capital Goods-Non Electrical Equipment
Power Generation & Distribution
Capital Goods -Electrical Equipment
Crude Oil & Natural Gas
Mining & Mineral products
Gas Distribution
Diversified
Castings, Forgings & Fastners
Consumer Durables
Paints/Varnish
Agro Chemicals
Auto Ancillaries
Others
Unit Fund
Cash Bank & Others
Debt Funds Hybrid FundsEquity Funds
Infrastructure Fund
FundAssure, Investment Report, October 2011
Asset AllocationSector Allocation
Portfolio
Investment Style
Fund Details
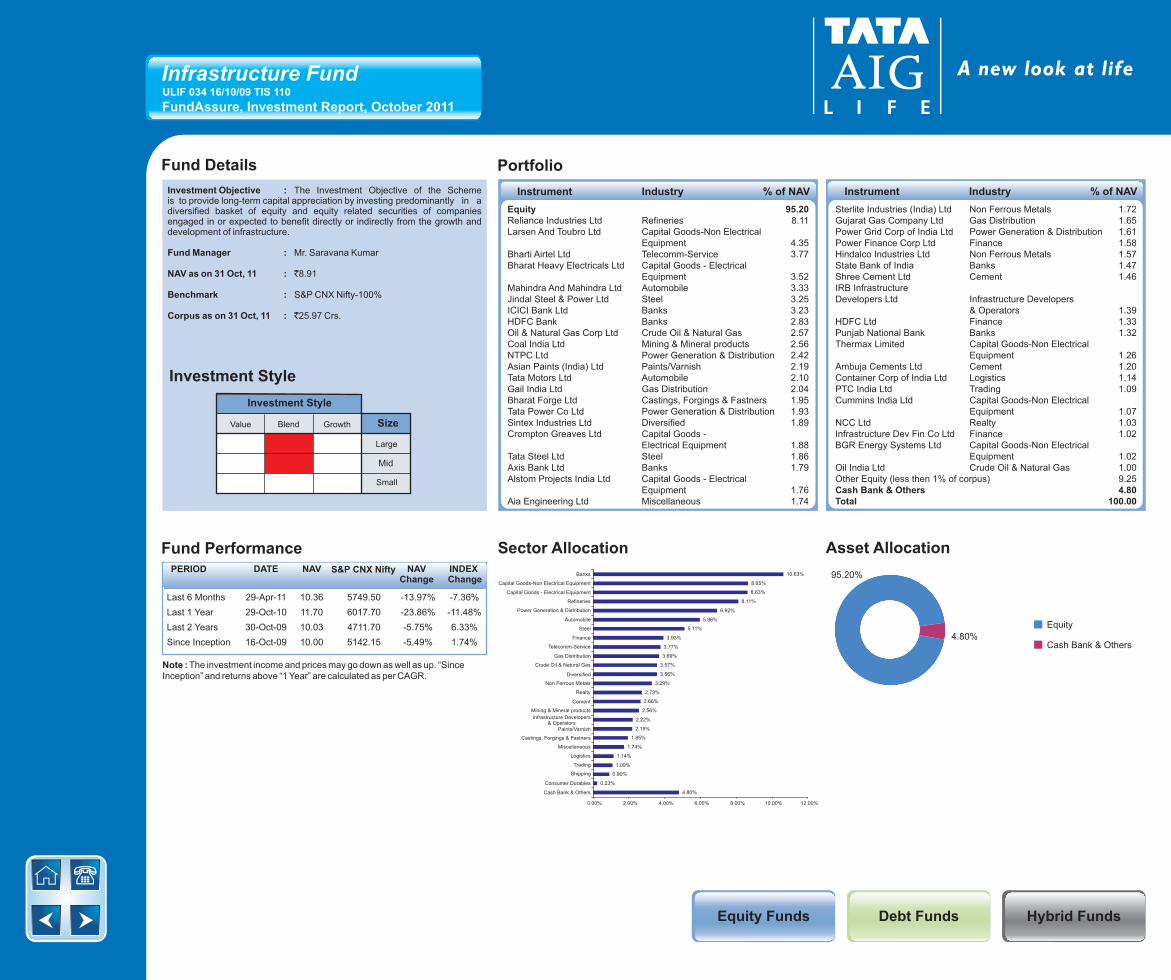
Investment Objective : The Investment Objective of the Scheme is to provide long-term capital appreciation by investing predominantly in a diversified basket of equity and equity related securities of companies engaged in or expected to benefit directly or indirectly from the growth and development of infrastructure.
Fund Manager : Mr. Saravana Kumar
NAV as on : `8.91
Benchmark : S&P CNX Nifty-100%
Corpus as on : `25.97 Crs.
31 Oct, 11
31 Oct, 11
Investment Style
Value Blend Growth Size
Large
Mid
Small
Equity
Cash Bank & Others
Note : The investment income and prices may go down as well as up. “SinceInception” and returns above “1 Year” are calculated as per CAGR.
Instrument Industry % of NAV Instrument Industry % of NAV
Equity 95.20Reliance Industries Ltd Refineries 8.11Larsen And Toubro Ltd Capital Goods-Non Electrical
Equipment 4.35Bharti Airtel Ltd Telecomm-Service 3.77Bharat Heavy Electricals Ltd Capital Goods - Electrical
Equipment 3.52Mahindra And Mahindra Ltd Automobile 3.33Jindal Steel & Power Ltd Steel 3.25ICICI Bank Ltd Banks 3.23HDFC Bank Banks 2.83Oil & Natural Gas Corp Ltd Crude Oil & Natural Gas 2.57Coal India Ltd Mining & Mineral products 2.56NTPC Ltd Power Generation & Distribution 2.42Asian Paints (India) Ltd Paints/Varnish 2.19Tata Motors Ltd Automobile 2.10Gail India Ltd Gas Distribution 2.04Bharat Forge Ltd Castings, Forgings & Fastners 1.95Tata Power Co Ltd Power Generation & Distribution 1.93Sintex Industries Ltd Diversified 1.89Crompton Greaves Ltd Capital Goods -
Electrical Equipment 1.88Tata Steel Ltd Steel 1.86Axis Bank Ltd Banks 1.79Alstom Projects India Ltd Capital Goods - Electrical
Equipment 1.76Aia Engineering Ltd Miscellaneous 1.74
Sterlite Industries (India) Ltd Non Ferrous Metals 1.72Gujarat Gas Company Ltd Gas Distribution 1.65Power Grid Corp of India Ltd Power Generation & Distribution 1.61Power Finance Corp Ltd Finance 1.58Hindalco Industries Ltd Non Ferrous Metals 1.57State Bank of India Banks 1.47Shree Cement Ltd Cement 1.46IRB Infrastructure Developers Ltd Infrastructure Developers
& Operators 1.39HDFC Ltd Finance 1.33Punjab National Bank Banks 1.32Thermax Limited Capital Goods-Non Electrical
Equipment 1.26Ambuja Cements Ltd Cement 1.20Container Corp of India Ltd Logistics 1.14PTC India Ltd Trading 1.09Cummins India Ltd Capital Goods-Non Electrical
Equipment 1.07NCC Ltd Realty 1.03Infrastructure Dev Fin Co Ltd Finance 1.02BGR Energy Systems Ltd Capital Goods-Non Electrical
Equipment 1.02Oil India Ltd Crude Oil & Natural Gas 1.00Other Equity (less then 1% of corpus) 9.25Cash Bank & Others 4.80Total 100.00
Asset Mix
Equity 65% - 100% 90%
Debt * 0% - 35% 10%
Cash & Money Market ** Up to 35% 10%
Instrument INDEX Change
* Actual Asset Mix % includes Cash & Money Market** Cash & Money Market includes current assets
Asset Mix as per F&U
95.20%
4.80%
ULIF 034 16/10/09 TIS 110
Fund Performance
Last 6 Months 29-Apr-11 10.36 5749.50 -13.97% -7.36%
Last 1 Year 29-Oct-10 11.70 6017.70 -23.86% -11.48%
Last 2 Years 30-Oct-09 10.03 4711.70 -5.75% 6.33%
Since Inception 16-Oct-09 10.00 5142.15 -5.49% 1.74%
PERIOD DATE NAV INDEX Change
NAV Change
S&P CNX Nifty10.63%
8.65%
8.63%
8.11%
6.92%
5.96%
5.11%
3.93%
3.77%
3.69%
3.57%
3.56%
3.29%
2.73%
2.66%
2.56%
2.22%
2.19%
1.95%
1.74%
1.14%
1.09%
0.90%
0.23%
4.80%
0.00% 2.00% 4.00% 6.00% 8.00% 10.00% 12.00%
Banks
Capital Goods-Non Electrical Equipment
Capital Goods - Electrical Equipment
Refineries
Power Generation & Distribution
Automobile
Steel
Finance
Telecomm-Service
Gas Distribution
Crude Oil & Natural Gas
Diversified
Non Ferrous Metals
Realty
Cement
Mining & Mineral products
Infrastructure Developers & Operators
Paints/Varnish
Castings, Forgings & Fastners
Miscellaneous
Logistics
Trading
Shipping
Consumer Durables
Cash Bank & Others

Debt Funds Hybrid FundsEquity Funds
Super Select Equity Fund
FundAssure, Investment Report, October 2011
Asset AllocationSector Allocation
Portfolio
Investment Style
Fund Details
Investment Objective : The primary investment objective of the fund is to provide income distribution over a period of medium to long term while at all times emphasizing the importance of capital appreciation. The fund will invest significant amount in equity and equity linked instruments specifically excluding companies predominantly dealing in Gambling, Lotteries/Contests, Animal Produce, Liquor, Tobacco, Entertainment (Films, TV etc) Hotels, Banks and Financial Institutions.
Fund Manager : Mr. Saravana Kumar
NAV as on : `11.23
Benchmark : S & P India 500 Shariah Index - 100%
Corpus as on : `308.85 Crs.
31 Oct, 11
31 Oct, 11
Investment Style
Value Blend Growth Size
Large
Mid
Small
Equity
Cash Bank & Others (Non Interest Bearing Securities)
Note : The investment income and prices may go down as well as up. “SinceInception” and returns above “1 Year” are calculated as per CAGR.
Instrument Industry % of NAVInstrument Industry % of NAV
Equity 85.97
Infosys Ltd IT - Software 8.85
Reliance Industries Ltd Refineries 8.24
Bharti Airtel Ltd Telecomm-Service 4.06
Sun Pharmaceutical Industries Ltd Pharmaceuticals 3.27
Tata Consultancy Services Ltd IT - Software 3.07
Coal India Ltd Mining & Mineral products 2.96
Bajaj Auto Ltd - New Shs Automobile 2.66
Oil & Natural Gas Corp Ltd Crude Oil & Natural Gas 2.47
Larsen And Toubro Ltd Capital Goods-Non Electrical Equipment 2.29
Godrej Consumer Products Ltd FMCG 2.12
Asian Paints (India) Ltd Paints/Varnish 2.12
Dr Reddys Laboratories Ltd Pharmaceuticals 2.06
Indraprastha Gas Ltd Gas Distribution 2.02
Jindal Steel & Power Ltd Steel 2.00
HCL Technologies Ltd IT - Software 1.87
Lupin Ltd Pharmaceuticals 1.83
Bharat Heavy Electricals Ltd Capital Goods - Electrical Equipment 1.67
Sterlite Industries (India) Ltd Non Ferrous Metals 1.65
GAIL India Ltd Gas Distribution 1.64
Gujarat Gas Company Ltd Gas Distribution 1.60
Titan Industries Ltd Consumer Durables 1.58
Divi'S Laboratories Ltd Pharmaceuticals 1.54
Glaxosmithkline Consumer
Healthcare Ltd FMCG 1.54
Cadila Healthcare Ltd Pharmaceuticals 1.53
Hindustan Unilever Ltd FMCG 1.53
Grasim Industries Ltd Diversified 1.53
Crompton Greaves Ltd Capital Goods -
Electrical Equipment 1.43
Cipla Ltd Pharmaceuticals 1.39
Maruti Suzuki India Ltd Automobile 1.37
NTPC Ltd Power Generation &
Distribution 1.30
Exide Industries Ltd Auto Ancillaries 1.29
Oracle Financial Services
Software Ltd IT - Software 1.20
Castrol India Ltd Chemicals 1.12
Hindalco Industries Ltd Non Ferrous Metals 1.10
Thermax Limited Capital Goods-Non Electrical Equipment 1.07
Other Equity (less then 1% of corpus) 7.02
Cash Bank & Others( Non Interest Bearing
Securities) 14.03
Total 100.00
Asset Mix
Equity 60% - 100% 88%
Debt * 0 12%
Cash & Money Market ** up to 100% 12%
Instrument INDEX Change
* Actual Asset Mix % includes Cash & Money Market** Cash & Money Market includes current assets
Asset Mix as per F&U
85.97%
14.03%
ULIF 035 16/10/09 TSS 110
Fund Performance
Last 6 Months 29-Apr-11 11.75 1322.23 -4.42% -4.95%
Last 1 Year 29-Oct-10 12.09 1408.93 -7.13% -10.80%
Last 2 Years 30-Oct-09 10.04 1132.92 5.76% 5.32%
Since Inception 16-Oct-09 10.00 1217.76 5.84% 1.56%
PERIOD DATE NAV INDEX Change
NAV Change
S & P India 500 Shariah Index
16.21%
11.61%
8.24%
6.58%
5.27%
4.06%
4.03%
3.91%
3.54%
3.36%
2.96%
2.89%
2.53%
2.13%
2.12%
1.96%
1.58%
1.30%
1.12%
0.58%
14.03%
0.00% 2.00% 4.00% 6.00% 8.00% 10.00% 12.00% 14.00% 16.00% 18.00%
IT - Software
Pharmaceuticals
Refineries
FMCG
Gas Distribution
Telecomm-Service
Automobile
Capital Goods - Electrical Equipment
Non Ferrous Metals
Capital Goods-Non Electrical Equipment
Mining & Mineral products
Crude Oil & Natural Gas
Auto Ancillaries
Steel
Paints/Varnish
Diversified
Consumer Durables
Power Generation & Distribution
Chemicals
Others
Cash Bank & Others( Non Interest Bearing Securities)
Debt Funds Hybrid FundsEquity Funds
Super Select Equity Pension Fund
FundAssure, Investment Report, October 2011
Asset AllocationSector Allocation
Portfolio
Investment Style
Fund Details
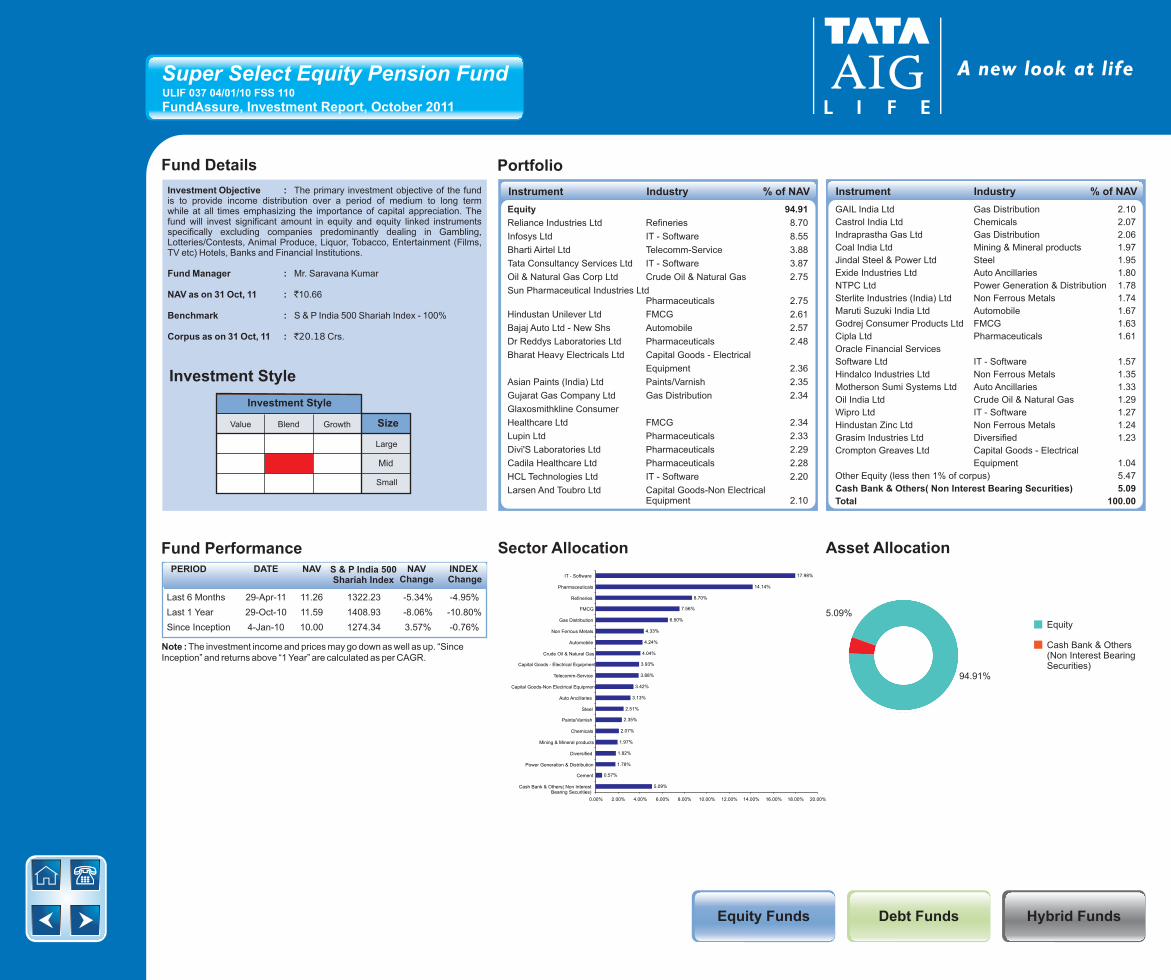
Investment Objective : The primary investment objective of the fund is to provide income distribution over a period of medium to long term while at all times emphasizing the importance of capital appreciation. The fund will invest significant amount in equity and equity linked instruments specifically excluding companies predominantly dealing in Gambling, Lotteries/Contests, Animal Produce, Liquor, Tobacco, Entertainment (Films, TV etc) Hotels, Banks and Financial Institutions.
Fund Manager : Mr. Saravana Kumar
NAV as on : `10.66
Benchmark : S & P India 500 Shariah Index - 100%
Corpus as on : `20.18 Crs.
31 Oct, 11
31 Oct, 11
Investment Style
Value Blend Growth Size
Large
Mid
Small
Equity
Cash Bank & Others (Non Interest Bearing Securities)
Note : The investment income and prices may go down as well as up. “SinceInception” and returns above “1 Year” are calculated as per CAGR.
Instrument Industry % of NAVInstrument Industry % of NAV
Equity 94.91
Reliance Industries Ltd Refineries 8.70
Infosys Ltd IT - Software 8.55
Bharti Airtel Ltd Telecomm-Service 3.88
Tata Consultancy Services Ltd IT - Software 3.87
Oil & Natural Gas Corp Ltd Crude Oil & Natural Gas 2.75
Sun Pharmaceutical Industries LtdPharmaceuticals 2.75
Hindustan Unilever Ltd FMCG 2.61
Bajaj Auto Ltd - New Shs Automobile 2.57
Dr Reddys Laboratories Ltd Pharmaceuticals 2.48
Bharat Heavy Electricals Ltd Capital Goods - Electrical
Equipment 2.36
Asian Paints (India) Ltd Paints/Varnish 2.35
Gujarat Gas Company Ltd Gas Distribution 2.34
Glaxosmithkline Consumer
Healthcare Ltd FMCG 2.34
Lupin Ltd Pharmaceuticals 2.33
Divi'S Laboratories Ltd Pharmaceuticals 2.29
Cadila Healthcare Ltd Pharmaceuticals 2.28
HCL Technologies Ltd IT - Software 2.20
Larsen And Toubro Ltd Capital Goods-Non Electrical Equipment 2.10
GAIL India Ltd Gas Distribution 2.10
Castrol India Ltd Chemicals 2.07
Indraprastha Gas Ltd Gas Distribution 2.06
Coal India Ltd Mining & Mineral products 1.97
Jindal Steel & Power Ltd Steel 1.95
Exide Industries Ltd Auto Ancillaries 1.80
NTPC Ltd Power Generation & Distribution 1.78
Sterlite Industries (India) Ltd Non Ferrous Metals 1.74
Maruti Suzuki India Ltd Automobile 1.67
Godrej Consumer Products Ltd FMCG 1.63
Cipla Ltd Pharmaceuticals 1.61
Oracle Financial Services
Software Ltd IT - Software 1.57
Hindalco Industries Ltd Non Ferrous Metals 1.35
Motherson Sumi Systems Ltd Auto Ancillaries 1.33
Oil India Ltd Crude Oil & Natural Gas 1.29
Wipro Ltd IT - Software 1.27
Hindustan Zinc Ltd Non Ferrous Metals 1.24
Grasim Industries Ltd Diversified 1.23
Crompton Greaves Ltd Capital Goods - Electrical
Equipment 1.04
Other Equity (less then 1% of corpus) 5.47
Cash Bank & Others( Non Interest Bearing Securities) 5.09
Total 100.00
Asset Mix
Equity 60% - 100% 87%
Debt * 0 13%
Cash & Money Market ** up to 40% 13%
Instrument INDEX Change
* Actual Asset Mix % includes Cash & Money Market** Cash & Money Market includes current assets
Asset Mix as per F&U
94.91%
5.09%
ULIF 037 04/01/10 FSS 110
Fund Performance
Last 6 Months 29-Apr-11 11.26 1322.23 -5.34% -4.95%
Last 1 Year 29-Oct-10 11.59 1408.93 -8.06% -10.80%
Since Inception 4-Jan-10 10.00 1274.34 3.57% -0.76%
PERIOD DATE NAV INDEX Change
NAV Change
S & P India 500 Shariah Index
17.98%
14.14%
8.70%
7.56%
6.50%
4.33%
4.24%
4.04%
3.93%
3.88%
3.42%
3.13%
2.51%
2.35%
2.07%
1.97%
1.82%
1.78%
0.57%
5.09%
0.00% 2.00% 4.00% 6.00% 8.00% 10.00% 12.00% 14.00% 16.00% 18.00% 20.00%
IT - Software
Pharmaceuticals
Refineries
FMCG
Gas Distribution
Non Ferrous Metals
Automobile
Crude Oil & Natural Gas
Capital Goods - Electrical Equipment
Telecomm-Service
Capital Goods-Non Electrical Equipment
Auto Ancillaries
Steel
Paints/Varnish
Chemicals
Mining & Mineral products
Diversified
Power Generation & Distribution
Cement
Cash Bank & Others( Non Interest Bearing Securities)

Debt Funds Hybrid FundsEquity Funds
Life Liquid Fund Life Income FundLife Short Term
Fixed Income FundWhole Life Short Term
Fixed Income Fund
Whole Life Income Fund
Future Income Pension Fund
Tata AIG Bond Fund Tata AIG Apex Investment Fund
Apex Pension Investment Fund
(10 yrs term)
Apex Pension Investment Fund
(15 yrs term)
Apex Pension Investment Fund
(20 yrs term)
Apex Pension Investment Fund SP
Apex Plus Investment Fund
Discontinuance Policy Fund
FundAssure, Investment Report, October 2011
Apex Supreme Investment Fund
Apex Supreme Investment Fund II

Debt Funds Hybrid FundsEquity Funds
Fund Performance
Last 6 Months 29-Apr-11 14.87 1666.56 4.40% 4.03%
Last 1 Year 29-Oct-10 14.38 1605.61 7.90% 7.98%
Last 2 Years 30-Oct-09 13.65 1539.04 6.65% 6.14%
Last 3 Years 31-Oct-08 12.77 1448.67 6.73% 6.17%
Last 4 Years 31-Oct-07 11.87 1344.93 6.95% 6.55%
Last 5 Years 31-Oct-06 11.04 1252.09 7.05% 6.73%
Since Inception 2-Mar-04 10.00 1103.15 5.90% 6.07%
Investment Style
Fund Details
Investment Objective :
Fund Manager : Mr. Saravana Kumar
NAV as on 31 Oct, 11 : `15.52
Benchmark :
Corpus : 29.02 Crs.
To provide safety of funds, liquidity and return on investments, in that order.
CRISIL Liquid Fund Index -100%
as on 31 Oct, 11 `
Credit Quality
High Mid LowInterest RateSensitivity
High
Mid
Low
Note : The investment income and prices may go down as well as up. “Since Inception” and "3-years" period returns are calculated as per CAGR.
PERIOD DATE NAV INDEX Change
NAV Change
Crisil LiquidFund Index
Rating Profile
Portfolio
CD/CP's 91.05
Oriental Bank of Commerce - 2012 CD P1+ 9.98
PNB 2012 - CD P1+ 9.97
ICICI Bank 2012 - CD P1+ 9.47
Canara Bank 2012 - CD P1+ 9.30
Bank of India 2012 - CD P1+ 9.16
Axis Bank 2012 - CD P1+ 9.15
State Bank of Travancore 2012 - CD P1+ 8.26
Aditya Birla Finance Ltd 2011 - CP P1+ 6.86
Vijaya Bank 2012 - CD P1+ 6.00
Corporation Bank 2012 - CD P1+ 4.13
State Bank of Patiala 2011 - CD P1+ 3.41
IDBI Bank 2011 - CD P1+ 3.40
State Bank of Hyderabad 2012 - CD P1+ 1.96
Unit Funds 3.45
HDFC Cash Management Fund - Savings Plan (Growth Option) 3.45
Cash Bank & Others 5.51
Total 100.00
Instrument Rating % of NAV
Maturity Profile
Asset Allocation
P1+
CD/CP's
0.00%
20.00%
40.00%
60.00%
80.00%
100.00%
120.00%
Less than 1 Year
91.05%
5.51%
91.05%
5.51%
Unit Funds
Unit Funds
Life Liquid Fund
FundAssure, Investment Report, October 2011ULIF 003 04/02/04 TLL 110
Cash Bank & Others
3.45%
Cash Bank & Others3.45%
Debt Funds Hybrid FundsEquity Funds
Fund Performance
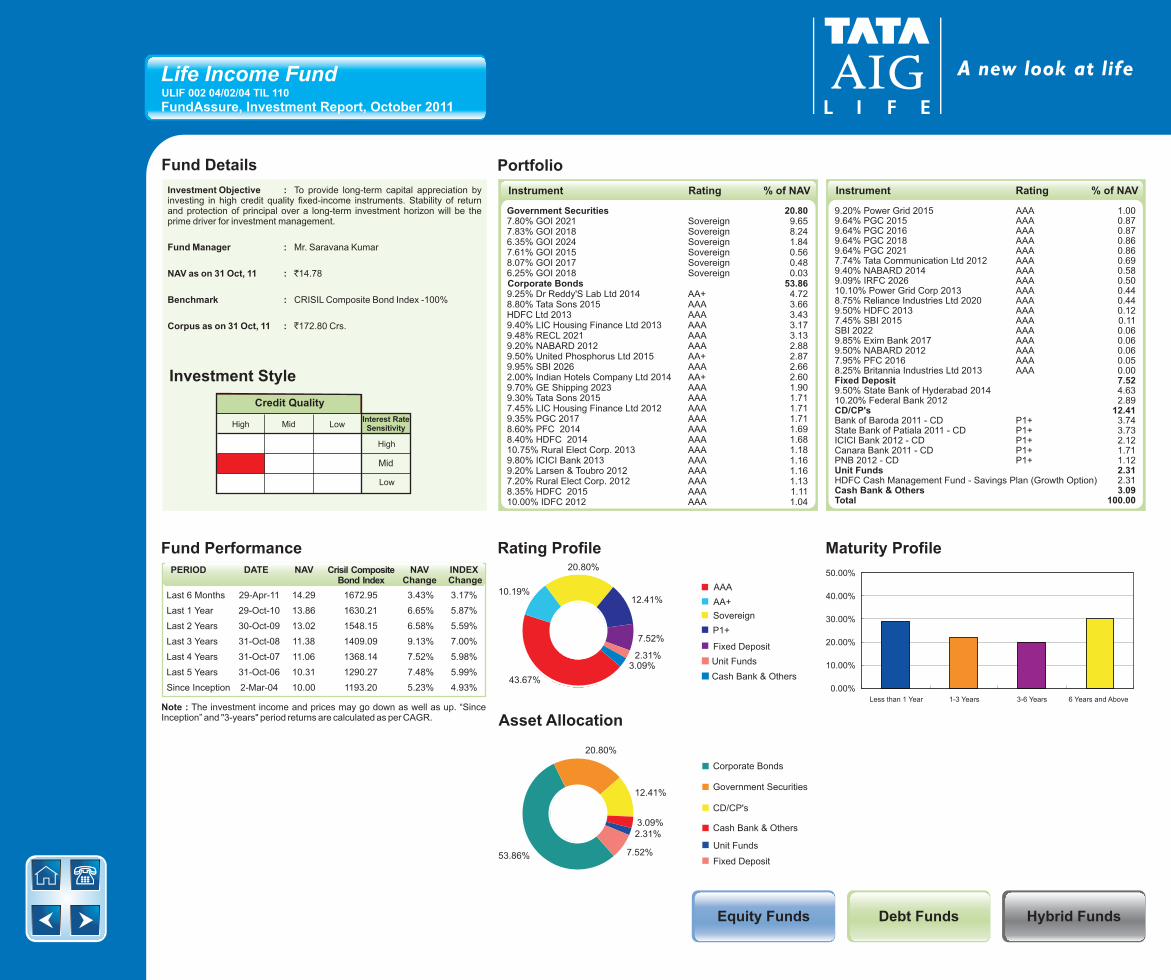
Last 6 Months 29-Apr-11 14.29 1672.95 3.43% 3.17%
Last 1 Year 29-Oct-10 13.86 1630.21 6.65% 5.87%
Last 2 Years 30-Oct-09 13.02 1548.15 6.58% 5.59%
Last 3 Years 31-Oct-08 11.38 1409.09 9.13% 7.00%
Last 4 Years 31-Oct-07 11.06 1368.14 7.52% 5.98%
Last 5 Years 31-Oct-06 10.31 1290.27 7.48% 5.99%
Since Inception 2-Mar-04 10.00 1193.20 5.23% 4.93%
Investment Style
Fund Details
Investment Objective :
Fund Manager : Mr. Saravana Kumar
NAV as on : `14.78
Benchmark :
Corpus : 172.80 Crs.
To provide long-term capital appreciation by investing in high credit quality fixed-income instruments. Stability of return and protection of principal over a long-term investment horizon will be the prime driver for investment management.
31 Oct, 11
CRISIL Composite Bond Index -100%
as on 31 Oct, 11 `
Credit Quality
High Mid LowInterest RateSensitivity
High
Mid
Low
Note : The investment income and prices may go down as well as up. “Since Inception” and "3-years" period returns are calculated as per CAGR.
PERIOD DATE NAV INDEX Change
NAV Change
Crisil CompositeBond Index
Rating Profile
Portfolio
Government Securities 20.807.80% GOI 2021 Sovereign 9.657.83% GOI 2018 Sovereign 8.246.35% GOI 2024 Sovereign 1.847.61% GOI 2015 Sovereign 0.568.07% GOI 2017 Sovereign 0.486.25% GOI 2018 Sovereign 0.03Corporate Bonds 53.869.25% Dr Reddy'S Lab Ltd 2014 AA+ 4.728.80% Tata Sons 2015 AAA 3.66HDFC Ltd 2013 AAA 3.439.40% LIC Housing Finance Ltd 2013 AAA 3.179.48% RECL 2021 AAA 3.139.20% NABARD 2012 AAA 2.889.50% United Phosphorus Ltd 2015 AA+ 2.879.95% SBI 2026 AAA 2.662.00% Indian Hotels Company Ltd 2014 AA+ 2.609.70% GE Shipping 2023 AAA 1.909.30% Tata Sons 2015 AAA 1.717.45% LIC Housing Finance Ltd 2012 AAA 1.719.35% PGC 2017 AAA 1.718.60% PFC 2014 AAA 1.698.40% HDFC 2014 AAA 1.6810.75% Rural Elect Corp. 2013 AAA 1.189.80% ICICI Bank 2013 AAA 1.169.20% Larsen & Toubro 2012 AAA 1.167.20% Rural Elect Corp. 2012 AAA 1.138.35% HDFC 2015 AAA 1.1110.00% IDFC 2012 AAA 1.04
Instrument Rating % of NAV
Maturity Profile
9.20% Power Grid 2015 AAA 1.009.64% PGC 2015 AAA 0.879.64% PGC 2016 AAA 0.879.64% PGC 2018 AAA 0.869.64% PGC 2021 AAA 0.867.74% Tata Communication Ltd 2012 AAA 0.699.40% NABARD 2014 AAA 0.589.09% IRFC 2026 AAA 0.5010.10% Power Grid Corp 2013 AAA 0.448.75% Reliance Industries Ltd 2020 AAA 0.449.50% HDFC 2013 AAA 0.127.45% SBI 2015 AAA 0.11SBI 2022 AAA 0.069.85% Exim Bank 2017 AAA 0.069.50% NABARD 2012 AAA 0.067.95% PFC 2016 AAA 0.058.25% Britannia Industries Ltd 2013 AAA 0.00Fixed Deposit 7.529.50% State Bank of Hyderabad 2014 4.6310.20% Federal Bank 2012 2.89CD/CP's 12.41Bank of Baroda 2011 - CD P1+ 3.74State Bank of Patiala 2011 - CD P1+ 3.73ICICI Bank 2012 - CD P1+ 2.12Canara Bank 2011 - CD P1+ 1.71PNB 2012 - CD P1+ 1.12Unit Funds 2.31HDFC Cash Management Fund - Savings Plan (Growth Option) 2.31Cash Bank & Others 3.09Total 100.00
Instrument Rating % of NAV
Asset Allocation
AAA
AA+
Sovereign
P1+
Fixed Deposit
Corporate Bonds
Government Securities
CD/CP's
Cash Bank & Others
Unit Funds
Unit Funds
3.09%2.31%
7.52%
12.41%
20.80%
10.19%
43.67% Cash Bank & Others
7.52%
2.31%
53.86%
20.80%
12.41%
3.09%
Fixed Deposit
0.00%
10.00%
20.00%
30.00%
40.00%
50.00%
Less than 1 Year 1-3 Years 3-6 Years 6 Years and Above
Life Income Fund
FundAssure, Investment Report, October 2011ULIF 002 04/02/04 TIL 110

Debt Funds Hybrid FundsEquity Funds
Fund Performance
Last 6 Months 29-Apr-11 13.38 1725.16 4.05% 4.05%
Last 1 Year 29-Oct-10 13.05 1675.18 6.69% 7.16%
Last 2 Years 30-Oct-09 12.47 1597.95 5.63% 5.99%
Last 3 Years 31-Oct-08 11.14 1449.61 7.71% 7.39%
Last 4 Years 31-Oct-07 10.58 1365.88 7.10% 7.07%
Last 5 Years 31-Oct-06 9.98 1271.06 6.88% 7.15%
Since Inception 1-Jul-06 10.00 1242.00 6.39% 7.15%
Investment Style
Fund Details
Investment Objective :
Fund Manager : Mr. Saravana Kumar
NAV as on : `13.92
Benchmark :
Corpus : 29.76 Crs.
The primary objective is to generate stable returns by investing in fixed income securities having maturities between 1 & 3 years.
31 Oct, 11
CRISIL Short Term Bond Index -100%
as on 31 Oct, 11 `
Credit Quality
High Mid LowInterest RateSensitivity
High
Mid
Low
Note : The investment income and prices may go down as well as up. “Since Inception” and "3-years" period returns are calculated as per CAGR.
PERIOD DATE NAV INDEX Change
NAV Change
Crisil Short Term Bond Index
Rating Profile
Portfolio
Corporate Bonds 61.892.00% Tata Motors Ltd 2014 AAA 7.64HDFC Ltd 2013 AAA 6.889.80% PFC 2012 AAA 6.737.55% National Housing Bank 2013 AAA 6.5110.70% Sundaram Finance 2014 AA+ 5.139.68% IRFC 2012 AAA 5.0510.40% ICICI SEC Prim 2013 AAA 3.408.40% LIC Housing Finance 2013 AAA 3.297.30% LIC Housing 2013 AAA 3.259.25% Dr Reddy'S Lab Ltd 2014 AA+ 3.037.76% LIC Housing 2012 AAA 2.978.25% Britannia Industries Ltd 2013 AAA 2.367.74% Tata Communication Ltd 2012 AAA 1.337.75% RECL 2012 AAA 1.329.50% HDFC 2013 AAA 1.017.40% Infrastructure 2012 AAA 0.997.90% RECL 2012 AAA 0.99Fixed Deposit 7.3610.00% State Bank of Travancore 2013 5.019.50% State Bank of Hyderabad 2014 2.35CD/CP's 7.56Oriental Bank of Commerce - 2012 CD P1+ 4.22Bank of Baroda 2011 - CD P1+ 3.34Unit Funds 3.36HDFC Cash Management Fund - Savings Plan (Growth Option) 3.36Cash Bank & Others 19.83Total 100.00
Instrument Rating % of NAV
Maturity Profile
Asset Allocation
AAA
AA+
P1+
Fixes Deposit
Unit Funds
Corporate Bonds
CD/CP's
Fixed Deposit
Unit Funds
3.36%
7.36%
7.56%
53.73%
3.36%
7.56%
61.89%
7.36%
19.83%
8.16%
Cash Bank & Others
19.83%
Cash Bank & Others
0.00%
20.00%
40.00%
60.00%
80.00%
100.00%
Less than 1 Year 1-3 Years
Life Short Term Fixed Income Fund
FundAssure, Investment Report, October 2011ULIF 008 01/07/06 TFL 110
Debt Funds Hybrid FundsEquity Funds
Fund Performance
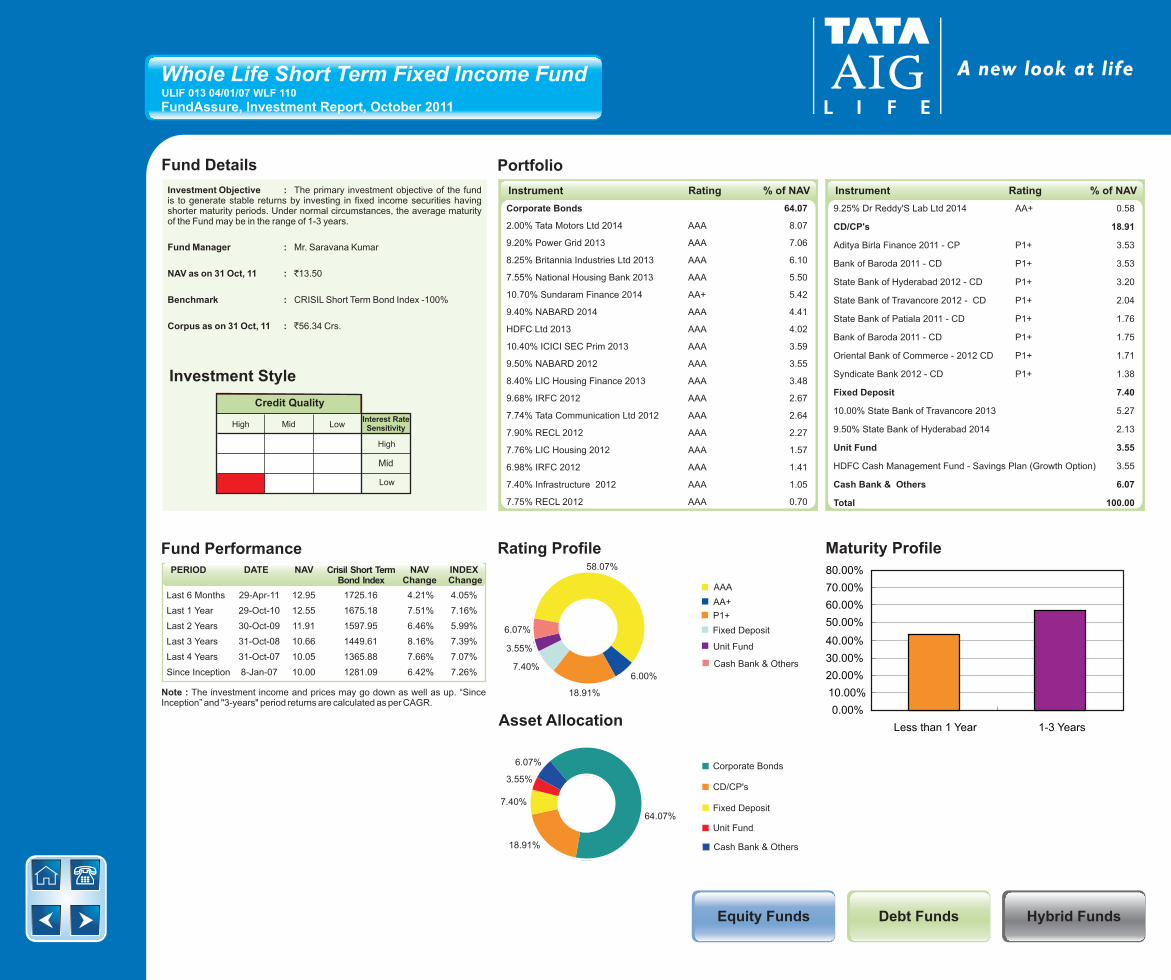
Last 6 Months 29-Apr-11 12.95 1725.16 4.21% 4.05%
Last 1 Year 29-Oct-10 12.55 1675.18 7.51% 7.16%
Last 2 Years 30-Oct-09 11.91 1597.95 6.46% 5.99%
Last 3 Years 31-Oct-08 10.66 1449.61 8.16% 7.39%
Last 4 Years 31-Oct-07 10.05 1365.88 7.66% 7.07%
Since Inception 8-Jan-07 10.00 1281.09 6.42% 7.26%
Investment Style
Fund Details
Investment Objective :
Fund Manager : Mr. Saravana Kumar
NAV as on : `13.50
Benchmark :
Corpus : 56.34 Crs.
The primary investment objective of the fund is to generate stable returns by investing in fixed income securities having shorter maturity periods. Under normal circumstances, the average maturity of the Fund may be in the range of 1-3 years.
31 Oct, 11
CRISIL Short Term Bond Index -100%
as on 31 Oct, 11 `
Credit Quality
High Mid LowInterest RateSensitivity
High
Mid
Low
Note : The investment income and prices may go down as well as up. “Since Inception” and "3-years" period returns are calculated as per CAGR.
PERIOD DATE NAV INDEX Change
NAV Change
Crisil Short TermBond Index
Rating Profile
Portfolio
Instrument Rating % of NAV
Maturity Profile
Asset Allocation
AAA
AA+
P1+
Fixed Deposit
Unit Fund
Corporate Bonds
CD/CP's
Fixed Deposit
Unit Fund
3.55%
7.40%
18.91%
6.00%
58.07%
6.07%
18.91%
64.07%
3.55%
7.40%
Cash Bank & Others
6.07%
Cash Bank & Others
0.00%
10.00%
20.00%
30.00%
40.00%
50.00%
60.00%
70.00%
80.00%
Less than 1 Year 1-3 Years
Instrument Rating % of NAV
Whole Life Short Term Fixed Income Fund
FundAssure, Investment Report, October 2011ULIF 013 04/01/07 WLF 110
Corporate Bonds 64.07
2.00% Tata Motors Ltd 2014 AAA 8.07
9.20% Power Grid 2013 AAA 7.06
8.25% Britannia Industries Ltd 2013 AAA 6.10
7.55% National Housing Bank 2013 AAA 5.50
10.70% Sundaram Finance 2014 AA+ 5.42
9.40% NABARD 2014 AAA 4.41
HDFC Ltd 2013 AAA 4.02
10.40% ICICI SEC Prim 2013 AAA 3.59
9.50% NABARD 2012 AAA 3.55
8.40% LIC Housing Finance 2013 AAA 3.48
9.68% IRFC 2012 AAA 2.67
7.74% Tata Communication Ltd 2012 AAA 2.64
7.90% RECL 2012 AAA 2.27
7.76% LIC Housing 2012 AAA 1.57
6.98% IRFC 2012 AAA 1.41
7.40% Infrastructure 2012 AAA 1.05
7.75% RECL 2012 AAA 0.70
9.25% Dr Reddy'S Lab Ltd 2014 AA+ 0.58
CD/CP's 18.91
Aditya Birla Finance 2011 - CP P1+ 3.53
Bank of Baroda 2011 - CD P1+ 3.53
State Bank of Hyderabad 2012 - CD P1+ 3.20
State Bank of Travancore 2012 - CD P1+ 2.04
State Bank of Patiala 2011 - CD P1+ 1.76
Bank of Baroda 2011 - CD P1+ 1.75
Oriental Bank of Commerce - 2012 CD P1+ 1.71
Syndicate Bank 2012 - CD P1+ 1.38
Fixed Deposit 7.40
10.00% State Bank of Travancore 2013 5.27
9.50% State Bank of Hyderabad 2014 2.13
Unit Fund 3.55
HDFC Cash Management Fund - Savings Plan (Growth Option) 3.55
Cash Bank & Others 6.07
Total 100.00
Debt Funds Hybrid FundsEquity Funds
Fund Performance
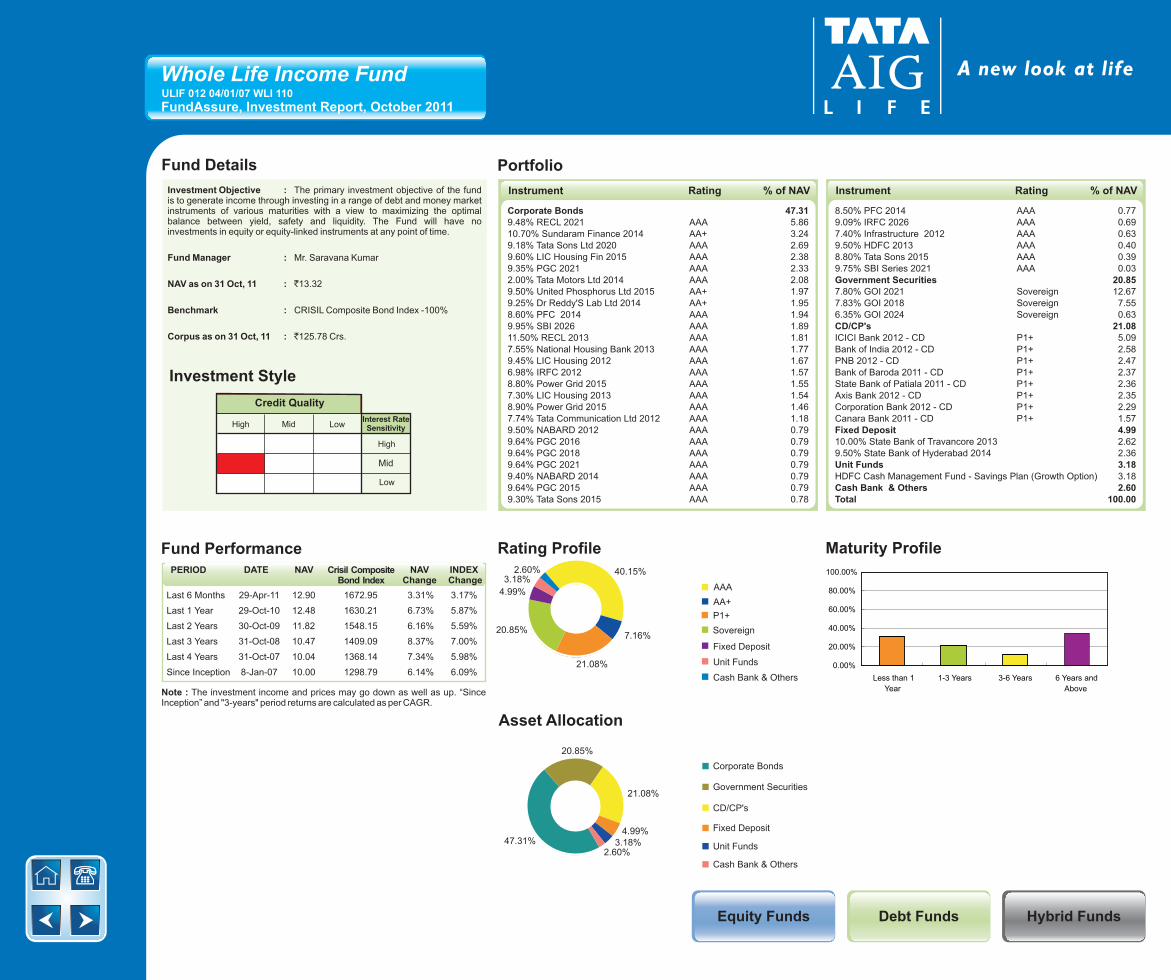
Last 6 Months 29-Apr-11 12.90 1672.95 3.31% 3.17%
Last 1 Year 29-Oct-10 12.48 1630.21 6.73% 5.87%
Last 2 Years 30-Oct-09 11.82 1548.15 6.16% 5.59%
Last 3 Years 31-Oct-08 10.47 1409.09 8.37% 7.00%
Last 4 Years 31-Oct-07 10.04 1368.14 7.34% 5.98%
Since Inception 8-Jan-07 10.00 1298.79 6.14% 6.09%
Investment Style
Fund Details
Investment Objective :
Fund Manager : Mr. Saravana Kumar
NAV as on : `13.32
Benchmark :
Corpus : 125.78 Crs.
The primary investment objective of the fund is to generate income through investing in a range of debt and money market instruments of various maturities with a view to maximizing the optimal balance between yield, safety and liquidity. The Fund will have no investments in equity or equity-linked instruments at any point of time.
31 Oct, 11
CRISIL Composite Bond Index -100%
as on 31 Oct, 11 `
Credit Quality
High Mid LowInterest RateSensitivity
High
Mid
Low
Note : The investment income and prices may go down as well as up. “Since Inception” and "3-years" period returns are calculated as per CAGR.
PERIOD DATE NAV INDEX Change
NAV Change
Crisil CompositeBond Index
Rating Profile
Portfolio
Corporate Bonds 47.319.48% RECL 2021 AAA 5.8610.70% Sundaram Finance 2014 AA+ 3.249.18% Tata Sons Ltd 2020 AAA 2.699.60% LIC Housing Fin 2015 AAA 2.389.35% PGC 2021 AAA 2.332.00% Tata Motors Ltd 2014 AAA 2.089.50% United Phosphorus Ltd 2015 AA+ 1.979.25% Dr Reddy'S Lab Ltd 2014 AA+ 1.958.60% PFC 2014 AAA 1.949.95% SBI 2026 AAA 1.8911.50% RECL 2013 AAA 1.817.55% National Housing Bank 2013 AAA 1.779.45% LIC Housing 2012 AAA 1.676.98% IRFC 2012 AAA 1.578.80% Power Grid 2015 AAA 1.557.30% LIC Housing 2013 AAA 1.548.90% Power Grid 2015 AAA 1.467.74% Tata Communication Ltd 2012 AAA 1.189.50% NABARD 2012 AAA 0.799.64% PGC 2016 AAA 0.799.64% PGC 2018 AAA 0.799.64% PGC 2021 AAA 0.799.40% NABARD 2014 AAA 0.799.64% PGC 2015 AAA 0.799.30% Tata Sons 2015 AAA 0.78
Instrument Rating % of NAV
Maturity Profile
8.50% PFC 2014 AAA 0.779.09% IRFC 2026 AAA 0.697.40% Infrastructure 2012 AAA 0.639.50% HDFC 2013 AAA 0.408.80% Tata Sons 2015 AAA 0.399.75% SBI Series 2021 AAA 0.03Government Securities 20.857.80% GOI 2021 Sovereign 12.677.83% GOI 2018 Sovereign 7.556.35% GOI 2024 Sovereign 0.63CD/CP's 21.08ICICI Bank 2012 - CD P1+ 5.09Bank of India 2012 - CD P1+ 2.58PNB 2012 - CD P1+ 2.47Bank of Baroda 2011 - CD P1+ 2.37State Bank of Patiala 2011 - CD P1+ 2.36Axis Bank 2012 - CD P1+ 2.35Corporation Bank 2012 - CD P1+ 2.29Canara Bank 2011 - CD P1+ 1.57Fixed Deposit 4.9910.00% State Bank of Travancore 2013 2.629.50% State Bank of Hyderabad 2014 2.36Unit Funds 3.18HDFC Cash Management Fund - Savings Plan (Growth Option) 3.18Cash Bank & Others 2.60Total 100.00
Instrument Rating % of NAV
Asset Allocation
AAA
AA+
P1+
Sovereign
Fixed Deposit
Corporate Bonds
Government Securities
CD/CP's
Fixed Deposit
Cash Bank & Others
Unit Funds
2.60%3.18%
4.99%
7.16%
40.15%
21.08%
20.85%
Cash Bank & Others
2.60%3.18%
21.08%
47.31%
20.85%
4.99%
Unit Funds
0.00%
20.00%
40.00%
60.00%
80.00%
100.00%
Less than 1
Year
1-3 Years 3-6 Years 6 Years and
Above
Whole Life Income Fund
FundAssure, Investment Report, October 2011ULIF 012 04/01/07 WLI 110
Debt Funds Hybrid FundsEquity Funds
Fund Performance
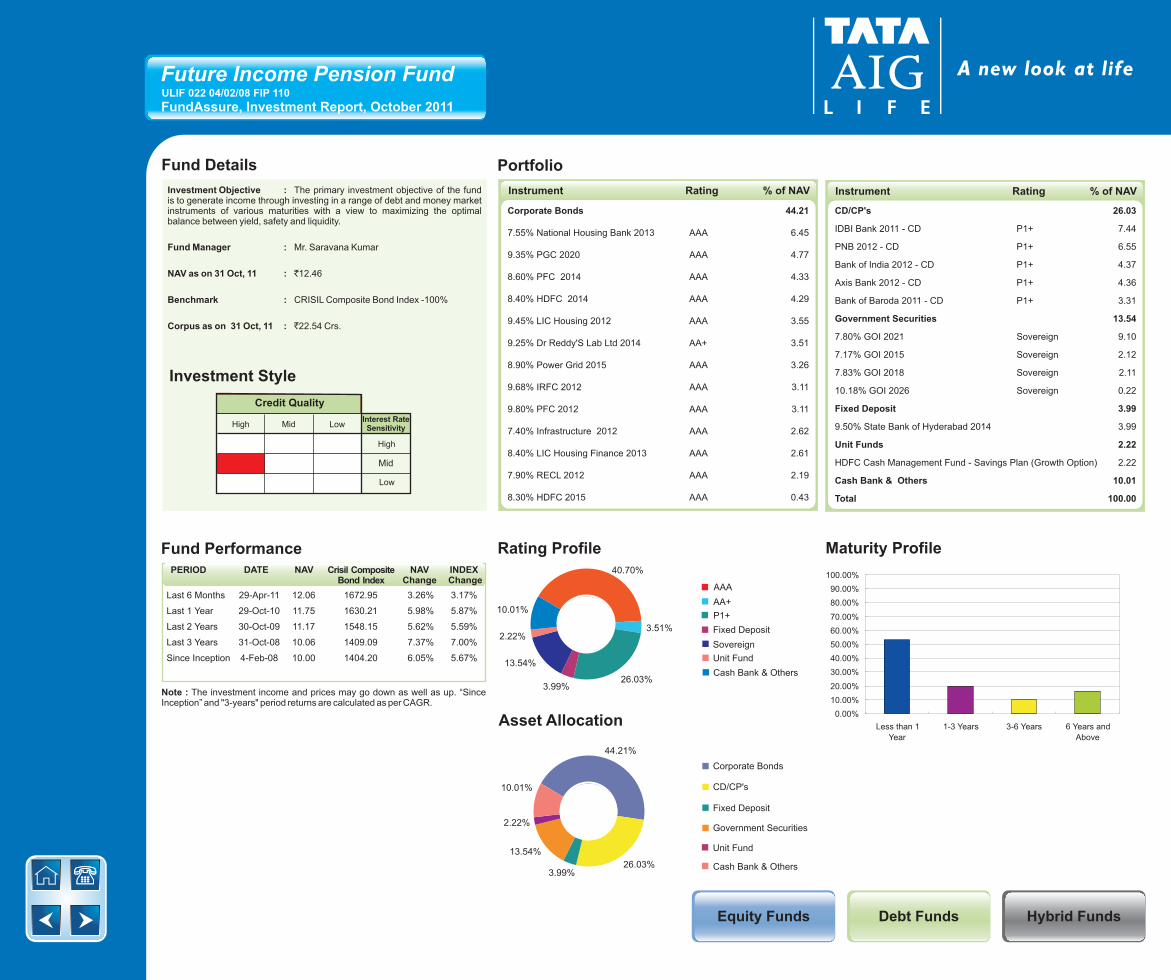
Last 6 Months 29-Apr-11 12.06 1672.95 3.26% 3.17%
Last 1 Year 29-Oct-10 11.75 1630.21 5.98% 5.87%
Last 2 Years 30-Oct-09 11.17 1548.15 5.62% 5.59%
Last 3 Years 31-Oct-08 10.06 1409.09 7.37% 7.00%
Since Inception 4-Feb-08 10.00 1404.20 6.05% 5.67%
Investment Style
Fund Details
Investment Objective :
Fund Manager : Mr. Saravana Kumar
NAV as on 31 Oct : `12.46
Benchmark :
Corpus : 22.54 Crs.
The primary investment objective of the fund is to generate income through investing in a range of debt and money market instruments of various maturities with a view to maximizing the optimal balance between yield, safety and liquidity.
, 11
CRISIL Composite Bond Index -100%
as on 31 Oct, 11 `
Credit Quality
High Mid LowInterest RateSensitivity
High
Mid
Low
Note : The investment income and prices may go down as well as up. “Since Inception” and "3-years" period returns are calculated as per CAGR.
PERIOD DATE NAV INDEX Change
NAV Change
Crisil CompositeBond Index
Rating Profile
Portfolio
Instrument Rating % of NAV
Maturity Profile
Asset Allocation
AAA
AA+
Fixed Deposit
Sovereign
Corporate Bonds
CD/CP's
Fixed Deposit
Government Securities
Unit Fund
Unit Fund
P1+10.01%
2.22%
40.70%
3.51%
13.54%
26.03%
10.01%
13.54%
2.22%
26.03%
44.21%
3.99%Cash Bank & Others
3.99%
Cash Bank & Others
Instrument Rating % of NAV
Future Income Pension Fund
FundAssure, Investment Report, October 2011ULIF 022 04/02/08 FIP 110
0.00%
10.00%
20.00%
30.00%
40.00%
50.00%
60.00%
70.00%
80.00%
90.00%
100.00%
Less than 1
Year
1-3 Years 3-6 Years 6 Years and
Above
Corporate Bonds 44.21
7.55% National Housing Bank 2013 AAA 6.45
9.35% PGC 2020 AAA 4.77
8.60% PFC 2014 AAA 4.33
8.40% HDFC 2014 AAA 4.29
9.45% LIC Housing 2012 AAA 3.55
9.25% Dr Reddy'S Lab Ltd 2014 AA+ 3.51
8.90% Power Grid 2015 AAA 3.26
9.68% IRFC 2012 AAA 3.11
9.80% PFC 2012 AAA 3.11
7.40% Infrastructure 2012 AAA 2.62
8.40% LIC Housing Finance 2013 AAA 2.61
7.90% RECL 2012 AAA 2.19
8.30% HDFC 2015 AAA 0.43
CD/CP's 26.03
IDBI Bank 2011 - CD P1+ 7.44
PNB 2012 - CD P1+ 6.55
Bank of India 2012 - CD P1+ 4.37
Axis Bank 2012 - CD P1+ 4.36
Bank of Baroda 2011 - CD P1+ 3.31
Government Securities 13.54
7.80% GOI 2021 Sovereign 9.10
7.17% GOI 2015 Sovereign 2.12
7.83% GOI 2018 Sovereign 2.11
10.18% GOI 2026 Sovereign 0.22
Fixed Deposit 3.99
9.50% State Bank of Hyderabad 2014 3.99
Unit Funds 2.22
HDFC Cash Management Fund - Savings Plan (Growth Option) 2.22
Cash Bank & Others 10.01
Total 100.00

Debt Funds Hybrid FundsEquity Funds
Fund Performance
Last 6 Months 29-Apr-11 11.40 1672.95 3.00% 3.17%
Last 1 Year 29-Oct-10 11.18 1630.21 5.02% 5.87%
Last 2 Years 30-Oct-09 10.68 1548.15 4.88% 5.59%
Since Inception 12-Jan-09 10.00 1503.68 5.91% 5.05%
Investment Style
Fund Details
Investment Objective :
Fund Manager : Mr. Saravana Kumar
NAV as on : `11.74
Benchmark :
Corpus : 13.87 Crs.
The objective of the scheme is to invest in Government Bonds and highly rated Fixed Income instruments. The primary objective of the Fund is to conserve capital while generating income by investing in short to medium term debt instruments of various maturities.
31 Oct, 11
CRISIL Composite Bond Index -100%
as on 31 Oct, 11 `
Credit Quality
High Mid LowInterest RateSensitivity
High
Mid
Low
Note : The investment income and prices may go down as well as up. “Since Inception” period returns are calculated as per CAGR.
PERIOD DATE NAV INDEX Change
NAV Change
Crisil CompositeBond Index
Rating Profile
Portfolio
Corporate Bonds 54.36
9.25% HDFC Ltd 2016 AAA 7.09
8.60% PFC 2014 AAA 7.03
7.55% National Housing Bank 2013 AAA 6.98
9.35% PGC 2020 AAA 4.93
8.90% Power Grid 2015 AAA 4.41
9.50% NABARD 2012 AAA 3.60
8.45% RECL 2015 AAA 3.48
9.25% Dr Reddy'S Lab Ltd 2014 AA+ 3.48
8.30% HDFC 2015 AAA 3.46
8.28% LIC Housing Fin 2015 AAA 3.46
6.98% IRFC 2012 AAA 2.86
9.50% HDFC 2013 AAA 2.16
9.45% LIC Housing 2012 AAA 0.72
7.90% RECL 2012 AAA 0.71
CD/CP's 10.55
IDBI Bank 2011 - CD P1+ 6.40
Instrument Rating % of NAV
Maturity Profile
Asset Allocation
AAA
AA+
P1+
Fixed Deposit
Sovereign
Unit Fund
Corporate Bonds
CD/CP's
Fixed Deposit
Government Securities
Unit Fund
3.61%
15.59%
50.89%
3.48%3.61%10.55%
12.29%
15.59%
3.61%
3.61%
54.36%
Instrument Rating % of NAV
10.55%
Cash Bank & Others
12.29% Cash Bank & Others
Tata AIG Bond Fund
FundAssure, Investment Report, October 2011ULIF 030 12/01/09 IBF 110
Corporation Bank 2012 - CD P1+ 4.15
Government Securities 15.59
7.17% GOI 2015 Sovereign 6.89
7.80% GOI 2021 Sovereign 5.38
7.49% GOI 2017 Sovereign 1.69
6.85% GOI 2012 Sovereign 0.72
12.40% GOI 2013 Sovereign 0.46
9.40% GOI 2012 Sovereign 0.24
10.70% GOI 2020 Sovereign 0.20
9.00% GOI 2013 Sovereign 0.02
Fixed Deposit 3.61
9.50% State Bank of Hyderabad 2014 3.61
Unit Funds 3.61
HDFC Cash Management Fund - Savings Plan (Growth Option) 3.61
Cash Bank & Others 12.29
Total 100.00
0.00%
10.00%
20.00%
30.00%
40.00%
50.00%
60.00%
70.00%
80.00%
90.00%
100.00%
Less than 1
Year
1-3 Years 3-6 Years 6 Years and
Above

Debt Funds Hybrid FundsEquity Funds
Fund Performance
Last 6 Months 29-Apr-11 10.03 -0.16%
Last 1 Year 29-Oct-10 10.05 -0.31%
Last 2 Years 30-Oct-09 10.06 -0.19%
Since Inception 18-Feb-09 10.00 0.07%
Investment Style
Fund Details
Investment Objective : The
Fund Manager : Mr. Saravana Kumar
NAV as on : `10.02
Benchmark :
Corpus : 13.55 Crs.
Objective is to provide capital protection with a high level of safety and liquidity through judicious investment in high quality short-term debt.
31 Oct, 11
-
as on 31 Oct, 11 `
Credit Quality
High Mid LowInterest RateSensitivity
High
Mid
Low
Note : The investment income and prices may go down as well as up. “Since Inception” period returns are calculated as per CAGR.
PERIOD DATE NAV NAV Change
Rating Profile
Portfolio
Cash Bank & Others 100.00
Total 100.00
Instrument Rating % of NAV
Maturity Profile
Asset Allocation
Cash Bank & Others
100.00%
Cash Bank & Others
100.00%
0.00%
20.00%
40.00%
60.00%
80.00%
100.00%
Less than 1 Year
Tata AIG Apex Investment Fund
FundAssure, Investment Report, October 2011ULIF 031 18/02/09 AIN 110

Debt Funds Hybrid FundsEquity Funds
Fund Performance
Last 6 Months 29-Apr-11 10.04 -0.15%
Last 1 Year 29-Oct-10 10.12 -1.00%
Since Inception 20-Jan-10 10.00 0.12%
Investment Style
Fund Details
Investment Objective :
Fund Manager : Mr. Saravana Kumar
NAV as on : `10.02
Benchmark :
Corpus : 0.546 Crs.
The investment objective for Apex Pension Investment Fund (10 Years) is to provide capital protection with a high level of safety and liquidity through judicious investment in high quality short-term debt. The strategy is to generate better returns with low level of risk through investment in fixed interest securities having short term maturity profile. The risk profile of the fund is very low and asset allocation will be upto 100% in Money Markets and Cash.
31 Oct, 11
-
as on 31 Oct, 11 `
Credit Quality
High Mid LowInterest RateSensitivity
High
Mid
Low
Note : The investment income and prices may go down as well as up. “Since Inception” period returns are calculated as per CAGR.
PERIOD DATE NAV NAV Change
Rating Profile
Portfolio
Maturity Profile
Asset Allocation
Apex Pension Investment Fund (10 yrs term)
FundAssure, Investment Report, October 2011
Cash Bank & Others 100.00
Total 100.00
Instrument Rating % of NAV
Cash Bank & Others
100.00%
Cash Bank & Others
100.00%
0.00%
20.00%
40.00%
60.00%
80.00%
100.00%
Less than 1 Year
ULIF 039 20/01/10 PI2 110

Debt Funds Hybrid FundsEquity Funds
ULIF 040 20/01/10 PI3 110
Fund Performance
Last 6 Months 29-Apr-11 10.03 -0.29%
Last 1 Year 29-Oct-10 10.09 -0.82%
Since Inception 20-Jan-10 10.00 0.03%
Investment Style
Fund Details
Investment Objective :
Fund Manager : Mr. Saravana Kumar
NAV as on : `10.01
Benchmark :
Corpus : 0.068 Crs.
The investment objective for Apex Pension Investment Fund (15 Years) is to provide capital protection with a high level of safety and liquidity through judicious investment in high quality short-term debt. The strategy is to generate better returns with low level of risk through investment in fixed interest securities having short term maturity profile. The risk profile of the fund is very low and asset allocation will be upto 100% in Money Markets and Cash.
31 Oct, 11
-
as on 31 Oct, 11 `
Credit Quality
High Mid LowInterest RateSensitivity
High
Mid
Low
Note : The investment income and prices may go down as well as up. “Since Inception” period returns are calculated as per CAGR.
PERIOD DATE NAV NAV Change
Rating Profile
Portfolio
Maturity Profile
Asset Allocation
Cash Bank & Others 100.00
Total 100.00
Instrument Rating % of NAV
Cash Bank & Others
100.00%
Cash Bank & Others
100.00%
0.00%
20.00%
40.00%
60.00%
80.00%
100.00%
Less than 1 Year
Apex Pension Investment Fund (15 yrs term)
FundAssure, Investment Report, October 2011

Debt Funds Hybrid FundsEquity Funds
Apex Pension Investment Fund (10 yrs term)ULIF 041 20/01/10 PI4 110
FundAssure, Investment Report, October 2011
Fund Performance
Last 6 Months 29-Apr-11 10.04 -0.30%
Last 1 Year 29-Oct-10 10.33 -3.17%
Since Inception 20-Jan-10 10.00 0.03%
Investment Style
Fund Details
Investment Objective :
Fund Manager : Mr. Saravana Kumar
NAV as on : `10.01
Benchmark :
Corpus : 0.038 Crs.
The investment objective for Apex Pension Investment Fund (20 Years) is to provide capital protection with a high level of safety and liquidity through judicious investment in high quality short-term debt. The strategy is to generate better returns with low level of risk through investment in fixed interest securities having short term maturity profile. The risk profile of the fund is very low and asset allocation will be upto 100% in Money Markets and Cash.
31 Oct, 11
-
as on 31 Oct, 11 `
Credit Quality
High Mid LowInterest RateSensitivity
High
Mid
Low
Note : The investment income and prices may go down as well as up. “Since Inception” period returns are calculated as per CAGR.
PERIOD DATE NAV NAV Change
Rating Profile
Portfolio
Maturity Profile
Asset Allocation
Cash Bank & Others 100.00
Total 100.00
Instrument Rating % of NAV
Cash Bank & Others
100.00%
Cash Bank & Others
100.00%
0.00%
20.00%
40.00%
60.00%
80.00%
100.00%
Less than 1 Year
Apex Pension Investment Fund (20 yrs term)

Debt Funds Hybrid FundsEquity Funds
Fund Performance
Last 6 Months 29-Apr-11 10.00 0.01%
Last 1 Year 29-Oct-10 10.00 0.02%
Since Inception 20-Jan-10 10.00 0.00%
Investment Style
Fund Details
Investment Objective :
Fund Manager : Mr. Saravana Kumar
NAV as on : `10.00
Benchmark :
Corpus :
The investment objective for Apex Pension Investment Fund is to provide capital protection with a high level of safety and liquidity through judicious investment in high quality short-term debt. The strategy is to generate better returns with low level of risk through investment in fixed interest securities having short term maturity profile. The risk profile of the fund is very low and asset allocation will be upto 100% in Money Markets and Cash.
31 Oct, 11
-
as on 31 Oct, 11 `0.00 Crs.
Credit Quality
High Mid LowInterest RateSensitivity
High
Mid
Low
Note : The investment income and prices may go down as well as up. “Since Inception” period returns are calculated as per CAGR.
PERIOD DATE NAV NAV Change
Rating Profile
Portfolio
Maturity Profile
Asset Allocation
Cash Bank & Others 100.00
Total 100.00
Instrument Rating % of NAV
Cash Bank & Others
100.00%
Cash Bank & Others
100.00%
0.00%
20.00%
40.00%
60.00%
80.00%
100.00%
Less than 1 Year
Apex Pension Investment Fund SP
FundAssure, Investment Report, October 2011ULIF 038 20/01/10 PI1 110

Debt Funds Hybrid FundsEquity Funds
Fund Performance
Last 1 Month 31-Dec-10 10.00 0.02%
Last 3 Months 29-Oct-10 10.00 0.02%
Last 6 Months 30-Jul-10 10.03 -0.25%
Last 1 Year 29-Jan-10 10.00 0.01%
Since Inception 20-Jan-10 10.00 0.00%
Investment Style
Fund Details
Investment Objective :
Fund Manager : Mr. Saravana Kumar
NAV as on : `10.02
Benchmark :
Corpus : 1.01 Crs.
The investment objective for Apex Plus Investment Fund is to provide capital protection with a high level of safety and liquidity through judicious investment in high quality short-term debt. The strategy is to generate better returns with low level of risk through investment in fixed interest securities having short term maturity profile. The risk profile of the fund is very low and asset allocation will be upto 100% in Money Markets and Cash.
31 Oct, 11
-
as on 31 Oct, 11 `
Credit Quality
High Mid LowInterest RateSensitivity
High
Mid
Low
Note : The investment income and prices may go down as well as up. “Since Inception” and "3-years" period returns are calculated as per CAGR.
PERIOD DATE NAV NAV Change
Rating Profile
Portfolio
Maturity Profile
Asset Allocation
Cash Bank & Others 100.00
Total 100.00
Instrument Rating % of NAV
Cash Bank & Others
100.00%
Cash Bank & Others
100.00%
0.00%
20.00%
40.00%
60.00%
80.00%
100.00%
Less than 1 Year
Fund Performance
Last 6 Months 29-Apr-11 10.04 -0.25%
Last 1 Year 29-Oct-10 10.12 -1.02%
Since Inception 1-Feb-10 10.00 0.10%
Note : The investment income and prices may go down as well as up. “Since Inception” period returns are calculated as per CAGR.
PERIOD DATE NAV NAV Change
Apex Plus Investment Fund
FundAssure, Investment Report, October 2011ULIF 046 01/02/10 AP1 110
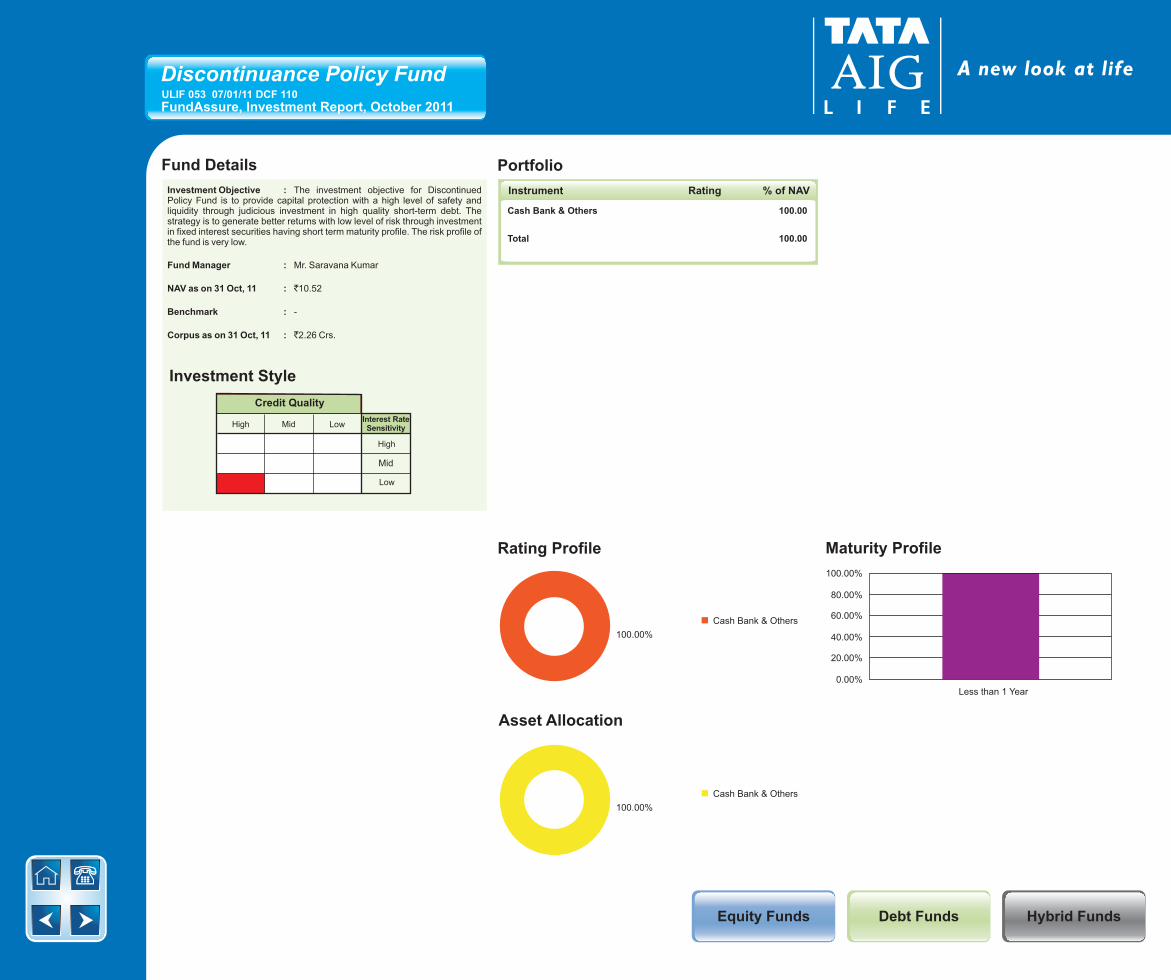
Debt Funds Hybrid FundsEquity Funds
Last 1 Month 31-Dec-10 10.00 0.02%
Last 3 Months 29-Oct-10 10.00 0.02%
Last 6 Months 30-Jul-10 10.03 -0.25%
Last 1 Year 29-Jan-10 10.00 0.01%
Since Inception 20-Jan-10 10.00 0.00%
Investment Style
Fund Details
Investment Objective :
Fund Manager : Mr. Saravana Kumar
NAV as on : `10.52
Benchmark :
Corpus : 2.26 Crs.
The investment objective for Discontinued Policy Fund is to provide capital protection with a high level of safety and liquidity through judicious investment in high quality short-term debt. The strategy is to generate better returns with low level of risk through investment in fixed interest securities having short term maturity profile. The risk profile of the fund is very low.
31 Oct, 11
-
as on 31 Oct, 11 `
Credit Quality
High Mid LowInterest RateSensitivity
High
Mid
Low
Rating Profile
Portfolio
Maturity Profile
Asset Allocation
Cash Bank & Others 100.00
Total 100.00
Instrument Rating % of NAV
Cash Bank & Others
100.00%
Cash Bank & Others
100.00%
0.00%
20.00%
40.00%
60.00%
80.00%
100.00%
Less than 1 Year
ULIF 053 07/01/11 DCF 110
Discontinuance Policy Fund
FundAssure, Investment Report, October 2011

Debt Funds Hybrid FundsEquity Funds
Last 1 Month 31-Dec-10 10.00 0.02%
Last 3 Months 29-Oct-10 10.00 0.02%
Last 6 Months 30-Jul-10 10.03 -0.25%
Last 1 Year 29-Jan-10 10.00 0.01%
Since Inception 20-Jan-10 10.00 0.00%
Investment Style
Fund Details
Investment Objective :
Fund Manager : Mr. Saravana Kumar
NAV as on : `9.99
Benchmark :
Corpus : 0.014 Crs.
The investment objective for Apex Supreme Investment Fund is to provide capital protection with a high level of safety and liquidity through judicious investment in high quality short-term debt. The strategy is to generate better returns with low level of risk through investment is fixed interest securities having short term maturity profile. The risk profile of the fund is very low and asset allocation will be no more than 100% in Money Markets and Cash.
31 Oct, 11
-
as on 31 Oct, 11 `
Credit Quality
High Mid LowInterest RateSensitivity
High
Mid
Low
Note : The investment income and prices may go down as well as up. “Since Inception” and "3-years" period returns are calculated as per CAGR.
Rating Profile
Portfolio
Maturity Profile
Asset Allocation
Cash Bank & Others 100.00
Total 100.00
Instrument Rating % of NAV
Cash Bank & Others
100.00%
Cash Bank & Others
100.00%
0.00%
20.00%
40.00%
60.00%
80.00%
100.00%
Less than 1 Year
Apex Supreme Investment Fund
FundAssure, Investment Report, October 2011ULIF 054 01/02/11 ASI 110

Debt Funds Hybrid FundsEquity Funds
Investment Style
Fund Details
Investment Objective :
Fund Manager : Mr. Saravana Kumar
NAV as on : `10.18
Benchmark :
Corpus : 0.91 Crs.
The investment objective for Apex Supreme Investment Fund II is to provide capital protection with a high level of safety and liquidity through judicious investment in high quality short-term debt. The strategy is to generate better returns with low level of risk through investment is fixed interest securities having short term maturity profile. The risk profile of the fund is very low and asset allocation will be up to 100% in Money Markets and Cash
31 Oct, 11
-
as on 31 Oct, 11 `
Credit Quality
High Mid LowInterest RateSensitivity
High
Mid
Low
Rating Profile
Portfolio
Maturity Profile
Asset Allocation
Cash Bank & Others 100.00
Total 100.00
Instrument Rating % of NAV
Cash Bank & Others
100.00%
Cash Bank & Others
100.00%
0.00%
20.00%
40.00%
60.00%
80.00%
100.00%
Less than 1 Year
Apex Supreme Investment Fund II
FundAssure, Investment Report, October 2011ULIF 056 01/07/11 SI2 110

Debt Funds Hybrid FundsEquity Funds
Life Aggressive Growth Fund
Life Stable Growth Fund
Whole Life Aggressive Growth Fund
Whole Life Stable Growth Fund
Growth Maximiser Fund
Life Growth Enabler Fund
Life Capital Guarantee Fund
Future Capital Guarantee
Pension Fund
Future Growth Pension Fund
Future Balanced Pension Fund
110% Capital Guarantee Fund
Tata AIG Aggressive Flexi Fund
Tata AIG Stable Flexi Fund
Tata AIG Apex Return Lock-in-Fund
Tata AIG Apex Return Lock-in-Fund II
Super 110% Capital Guarantee Fund
Tata AIG Apex PlusReturn Lock-in-Fund
Tata AIG Apex Pension Return Lock-in-Fund SP
Tata AIG Apex Pension Return Lock-in-Fund
(10 Year term)
Tata AIG Apex Pension Return Lock-in-Fund
(15 Year term)
Tata AIG Apex Pension Return Lock-in-Fund
(20 Year term)
Tata AIG Apex Plus Return Lock-in-Fund II
Tata AIG Apex Pension Return Lock-in-Fund II
Tata AIG Apex Pension Return Lock-in-Fund
II (10 Year term)
Tata AIG Apex Pension Return Lock-in-Fund
II (15 Year term)
Tata AIG Apex Pension Return Lock-in-Fund
II (20 Year term)
FundAssure, Investment Report, October 2011
Tata AIG Apex Supreme Return
Lock-in-Fund
Tata AIG Apex Supreme Return Lock-in-Fund II

Asset AllocationSector Allocation
61.17%
2.55%
30.12%
PortfolioFund Details
Equity
Corporate Bond
Government Securities
Unit Funds
CD/CP’s
Cash, Bank & Others
Instrument Industry % of NAV
Investment Style
Value Blend Growth Size
Large
Mid
Small
Debt Investment Style
Fund Performance
Last 6 Months 29-Apr-11 16.20 -5.48% -3.73%
Last 1 Year 29-Oct-10 16.90 -9.40% -5.50%
Last 2 Years 30-Oct-09 13.93 4.84% 5.55%
Last 3 Years 31-Oct-08 9.77 16.17% 16.65%
Last 4 Years 31-Oct-07 15.31 0.00% 0.27%
Last 5 Years 31-Oct-06 10.42 7.99% 6.28%
Since Inception 01-Jul-06 10.00 8.31% 8.66%
Note : The investment income and prices may go down as well as up. “SinceInception” and returns above “1 Year” are calculated as per CAGR.
PERIOD DATE NAV INDEX Change
NAV Change
Credit Quality
High Mid LowInterest RateSensitivity
High
Mid
Low
Equity Investment Style
Investment Objective :
Fund Manager : Mr. Saravana Kumar
NAV as on 31 Oct, 11 : `15.31
Benchmark :
Corpus : 315.73 Crs.
To maximize the return while investing in mix of Equity & Fixed Income Investments. The fund will maintain a medium to high risk profile. The Equity investments will be in a range of 50% - 80% of the fund.
BSE Sensex - 65%
as on 31 Oct, 11 `
CRISIL Composite Bond Index - 35%
Debt Funds Hybrid FundsEquity Funds
3.80%0.88%1.48%
Instrument Industry % of NAV
Equity 61.17
Infosys Ltd IT - Software 4.70
Reliance Industries Ltd Refineries 4.17
ITC Ltd Tobacco Products 4.16
ICICI Bank Ltd Banks 3.83
HDFC Bank Banks 3.34
Larsen And Toubro Ltd Capital Goods-Non Electrical Equipment 2.24
Bharti Airtel Ltd Telecomm-Service 2.23
Tata Consultancy Services Ltd IT - Software 2.12
State Bank of India Banks 1.99
Mahindra And Mahindra Ltd Automobile 1.78
Other Equity 30.60
CD/CP's 2.55
Corporation Bank 2012 - CD P1+ 1.52
Canara Bank 2011 - CD P1+ 0.78
IDBI Bank 2011 - CD P1+ 0.25
Government Securities 0.88
8.30% GOI 2040 Sovereign 0.88
Corporate Bonds 30.12
2.00% Tata Motors Ltd 2014 AAA 3.96
9.95% SBI 2026 AAA 3.52
7.30% LIC Housing 2013 AAA 2.15
8.40% LIC Housing Finance 2013 AAA 1.96
HDFC Ltd 2013 AAA 1.71
11.25% PFC 2018 AAA 1.70
9.25% HDFC Ltd 2016 AAA 1.62
10.25% HDFC 2012 AAA 1.59
9.80% PFC 2012 AAA 1.59
9.50% HDFC 2013 AAA 1.26
8.40% HDFC 2014 AAA 1.23
9.70% GE Shipping 2023 AAA 1.07
10.90% RECL 2013 AAA 1.03
7.65% RECL 2016 AAA 1.03
9.35% PGC 2022 AAA 0.92
9.57% IRFC 2021 AAA 0.79
0%.HDFC Ltd 2012 AAA 0.65
9.80% PFC 2012 AAA 0.63
6.90% PFC 2012 AAA 0.62
9.09% IRFC 2026 AAA 0.61
7.90% RECL 2012 AAA 0.25
9.18% Tata Sons Ltd 2020 AAA 0.21
Unit Funds 3.80
HDFC Cash Management Fund -
Savings Plan (Growth Option) 3.80
Cash Bank & Others 1.48
Total 100.00
Life Aggressive Growth Fund
FundAssure, Investment Report, October 2011ULIF 006 01/07/06 TAL 110
12.82%
8.28%
5.24%
4.17%
4.16%
2.88%
2.72%
2.29%
2.23%
2.08%
14.29%
3.80%
0.88%
30.12%
2.55%
1.48%
0.00% 10.00% 20.00% 30.00% 40.00%
Banks
IT - Software
Automobile
Refineries
Tobacco Products
Capital Goods-Non Electrical Equipment
Pharmaceuticals
Capital Goods - Electrical Equipment
Telecomm-Service
Crude Oil & Natural Gas
Others
Unit Funds
Government Securities
Corporate Bonds
CD/CP's
Cash Bank & Others
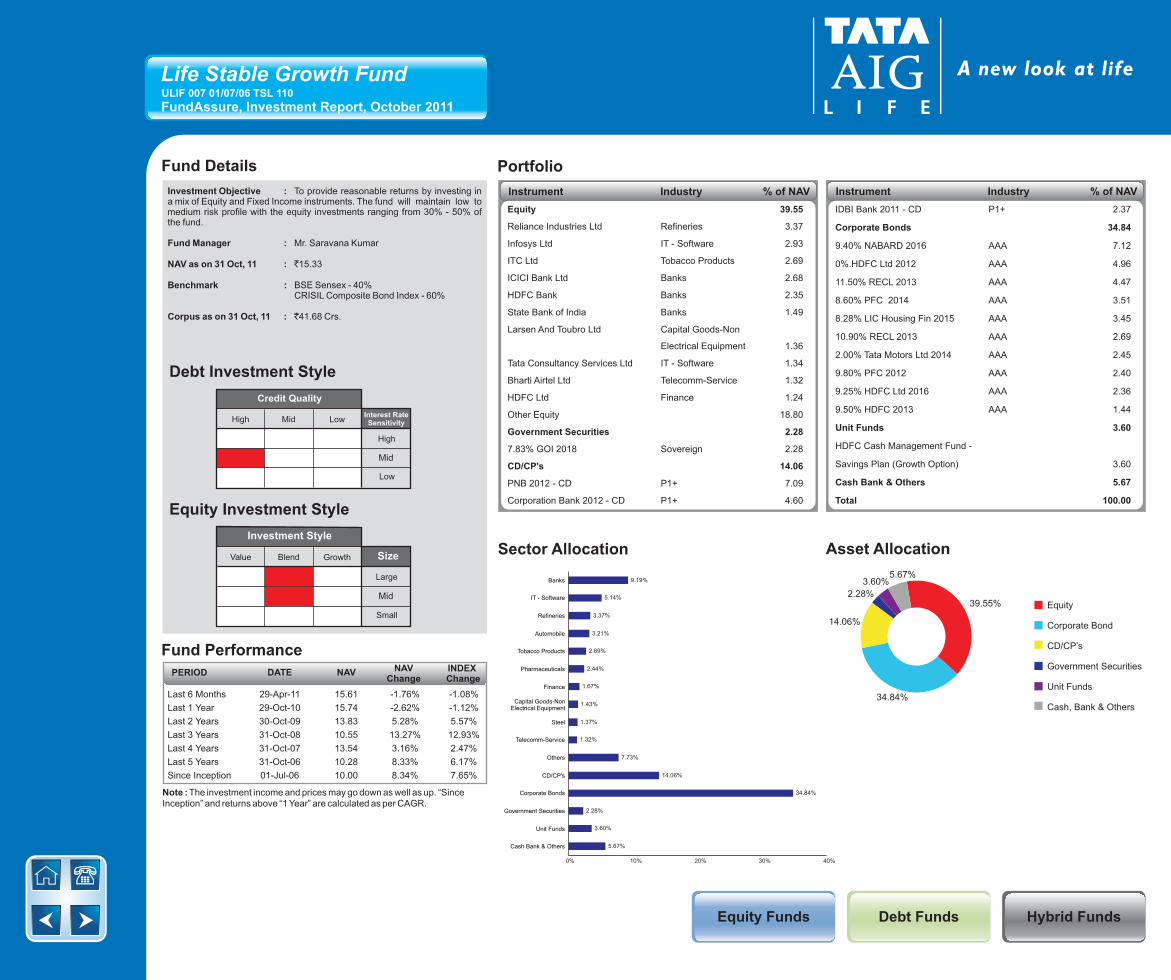
Asset AllocationSector Allocation
3.60%
14.06%
39.55%
PortfolioFund Details
Instrument Industry % of NAVInstrument Industry % of NAV
Investment Style
Value Blend Growth Size
Large
Mid
Small
Debt Investment Style
Fund Performance
Last 6 Months 29-Apr-11 15.61 -1.76% -1.08%
Last 1 Year 29-Oct-10 15.74 -2.62% -1.12%
Last 2 Years 30-Oct-09 13.83 5.28% 5.57%
Last 3 Years 31-Oct-08 10.55 13.27% 12.93%
Last 4 Years 31-Oct-07 13.54 3.16% 2.47%
Last 5 Years 31-Oct-06 10.28 8.33% 6.17%
Since Inception 01-Jul-06 10.00 8.34% 7.65%
Note : The investment income and prices may go down as well as up. “SinceInception” and returns above “1 Year” are calculated as per CAGR.
PERIOD DATE NAV INDEX Change
NAV Change
Credit Quality
High Mid LowInterest RateSensitivity
High
Mid
Low
Equity Investment Style
Investment Objective :
Fund Manager : Mr. Saravana Kumar
NAV as on 31 Oct, 11 : `15.33
Benchmark :
Corpus : 41.68 Crs.
To provide reasonable returns by investing in a mix of Equity and Fixed Income instruments. The fund will maintain low to medium risk profile with the equity investments ranging from 30% - 50% of the fund.
BSE Sensex - 40%
as on 31 Oct, 11 `
CRISIL Composite Bond Index - 60%
Equity 39.55
Reliance Industries Ltd Refineries 3.37
Infosys Ltd IT - Software 2.93
ITC Ltd Tobacco Products 2.69
ICICI Bank Ltd Banks 2.68
HDFC Bank Banks 2.35
State Bank of India Banks 1.49
Larsen And Toubro Ltd Capital Goods-Non
Electrical Equipment 1.36
Tata Consultancy Services Ltd IT - Software 1.34
Bharti Airtel Ltd Telecomm-Service 1.32
HDFC Ltd Finance 1.24
Other Equity 18.80
Government Securities 2.28
7.83% GOI 2018 Sovereign 2.28
CD/CP's 14.06
PNB 2012 - CD P1+ 7.09
Corporation Bank 2012 - CD P1+ 4.60
IDBI Bank 2011 - CD P1+ 2.37
Corporate Bonds 34.84
9.40% NABARD 2016 AAA 7.12
0%.HDFC Ltd 2012 AAA 4.96
11.50% RECL 2013 AAA 4.47
8.60% PFC 2014 AAA 3.51
8.28% LIC Housing Fin 2015 AAA 3.45
10.90% RECL 2013 AAA 2.69
2.00% Tata Motors Ltd 2014 AAA 2.45
9.80% PFC 2012 AAA 2.40
9.25% HDFC Ltd 2016 AAA 2.36
9.50% HDFC 2013 AAA 1.44
Unit Funds 3.60
HDFC Cash Management Fund -
Savings Plan (Growth Option) 3.60
Cash Bank & Others 5.67
Total 100.00
Debt Funds Hybrid FundsEquity Funds
2.28%
34.84%
Equity
Corporate Bond
CD/CP’s
Government Securities
Unit Funds
Cash, Bank & Others
5.67%
Life Stable Growth Fund
FundAssure, Investment Report, October 2011ULIF 007 01/07/06 TSL 110
9.19%
5.14%
3.37%
3.21%
2.69%
2.44%
1.67%
1.43%
1.37%
1.32%
7.73%
14.06%
34.84%
2.28%
3.60%
5.67%
0% 10% 20% 30% 40%
Banks
IT - Software
Refineries
Automobile
Tobacco Products
Pharmaceuticals
Finance
Capital Goods-Non Electrical Equipment
Steel
Telecomm-Service
Others
CD/CP's
Corporate Bonds
Government Securities
Unit Funds
Cash Bank & Others

Asset AllocationSector Allocation
7.94%
59.91%
24.95%
PortfolioFund Details
Investment Style
Value Blend Growth Size
Large
Mid
Small
Debt Investment Style
Fund Performance
Last 6 Months 29-Apr-11 15.03 -4.56% -3.67%
Last 1 Year 29-Oct-10 15.40 -6.84% -5.41%
Last 2 Years 30-Oct-09 12.60 6.70% 6.07%
Last 3 Years 31-Oct-08 8.89 17.29% 17.18%
Last 4 Years 31-Oct-07 13.14 2.22% 0.45%
Since Inception 08-Jan-07 10.00 7.79% 6.36%
Note : The investment income and prices may go down as well as up. “SinceInception” and returns above “1 Year” are calculated as per CAGR.
PERIOD DATE NAV INDEX Change
NAV Change
Credit Quality
High Mid LowInterest RateSensitivity
High
Mid
Low
Equity Investment Style
Investment Objective :
Fund Manager : Mr. Saravana Kumar
NAV as on 31 Oct, 11 : `14.35
Benchmark :
Corpus : 298.18 Crs.
The primary investment objective of the fund is to maximize the returns with medium to high risk.
Nifty - 65%
as on 31 Oct, 11 `
CRISIL Composite Bond Index -35%
Debt Funds Hybrid FundsEquity Funds
Equity
Corporate Bond
Government Securities
Unit Funds
CD/CP’s
Cash, Bank & Others
2.69%4.02%
0.48%
Instrument Industry % of NAVInstrument Industry % of NAV
Equity 59.91
Reliance Industries Ltd Refineries 4.86
Infosys Ltd IT - Software 4.54
ITC Ltd Tobacco Products 3.93
HDFC Bank Banks 3.86
ICICI Bank Ltd Banks 3.44
State Bank of India Banks 2.38
Tata Consultancy Services Ltd IT - Software 2.17
Larsen And Toubro Ltd Capital Goods-Non Electrical Equipment 2.01
Bharti Airtel Ltd Telecomm-Service 1.97
HDFC Ltd Finance 1.62
Other Equity 29.14
CD/CP's 2.69
Corporation Bank 2012 - CD P1+ 1.61
Canara Bank 2011 - CD P1+ 0.83
ICICI Bank 2012 - CD P1+ 0.13
Axis Bank 2012 - CD P1+ 0.13
Government Securities 0.48
7.83% GOI 2018 Sovereign 0.48
Corporate Bonds 24.95
8.40% LIC Housing Finance 2013 AAA 3.32
9.95% SBI 2026 AAA 2.71
2.00% Indian Hotels Company Ltd 2014 AA+ 2.64
11.50% RECL 2013 AAA 1.73
0%.HDFC Ltd 2012 AAA 1.39
8.80% Tata Sons 2015 AAA 1.30
8.70% PFC 2015 AAA 1.30
2.00% Tata Motors Ltd 2014 AAA 1.14
9.70% GE Shipping 2023 AAA 1.10
9.30% Tata Sons 2015 AAA 0.99
8.80% Power Grid 2015 AAA 0.98
9.57% IRFC 2021 AAA 0.84
9.20%.HDFC Ltd 2012 AAA 0.84
8.40% HDFC 2014 AAA 0.81
7.95% PFC 2016 AAA 0.79
8.50% PFC 2014 AAA 0.65
9.09% IRFC 2026 AAA 0.65
9.50% HDFC 2013 AAA 0.44
9.25% HDFC Ltd 2016 AAA 0.40
6.90% PFC 2012 AAA 0.33
9.18% Tata Sons Ltd 2020 AAA 0.26
10.90% RECL 2013 AAA 0.24
8.28% LIC Housing Fin 2015 AAA 0.10
Unit Funds 4.02
HDFC Cash Management Fund -
Savings Plan (Growth Option) 4.02
Cash Bank & Others 7.94
Total 100.00
Whole Life Aggressive Growth Fund
FundAssure, Investment Report, October 2011ULIF 010 04/01/07 WLA 110
13.92%
7.68%
4.86%
4.35%
3.93%
3.29%
2.62%
2.22%
2.01%
1.97%
13.05%
4.02%
2.69%
24.95%
0.48%
7.94%
0.00% 10.00% 20.00% 30.00%
Banks
IT - Software
Refineries
Automobile
Tobacco Products
Pharmaceuticals
Finance
Steel
Capital Goods-Non Electrical Equipment
Telecomm-Service
Others
Unit Funds
CD/CP's
Corporate Bonds
Government Securities
Cash Bank & Others

Asset AllocationSector Allocation
38.19%
13.89%
PortfolioFund Details
Instrument Industry % of NAVInstrument Industry % of NAV
Investment Style
Value Blend Growth Size
Large
Mid
Small
Debt Investment Style
Fund Performance
Last 6 Months 29-Apr-11 13.41 -1.53% -1.04%
Last 1 Year 29-Oct-10 13.40 -1.48% -1.07%
Last 2 Years 30-Oct-09 11.75 6.00% 5.88%
Last 3 Years 31-Oct-08 9.11 13.16% 13.27%
Last 4 Years 31-Oct-07 11.46 3.60% 2.58%
Since Inception 08-Jan-07 10.00 5.94% 6.25%
Note : The investment income and prices may go down as well as up. “SinceInception” and returns above “1 Year” are calculated as per CAGR.
PERIOD DATE NAV INDEX Change
NAV Change
Credit Quality
High Mid LowInterest RateSensitivity
High
Mid
Low
Equity Investment Style
Investment Objective :
Fund Manager : Mr. Saravana Kumar
NAV as on 31 Oct, 11 : `13.20
Benchmark :
Corpus : 63.29 Crs.
The primary investment objective of the fund is provide reasonable returns with low to medium risk.
Nifty - 40%
as on 31 Oct, 11 `
CRISIL Composite Bond Index - 60%
Equity 38.19
Infosys Ltd IT - Software 3.18
Reliance Industries Ltd Refineries 3.05
ICICI Bank Ltd Banks 2.57
ITC Ltd Tobacco Products 2.53
HDFC Bank Banks 2.48
State Bank of India Banks 1.51
Tata Consultancy Services Ltd IT - Software 1.41
HDFC Ltd Finance 1.31
Larsen And Toubro Ltd Capital Goods-Non Electrical Equipment 1.12
Sun Pharmaceutical Industries Ltd Pharmaceuticals 1.12
Other Equity 17.92
Government Securities 5.41
7.83% GOI 2018 Sovereign 4.50
7.17% GOI 2015 Sovereign 0.91
Corporate Bonds 33.16
9.95% SBI 2026 AAA 6.39
8.70% PFC 2015 AAA 3.84
0%.HDFC Ltd 2012 AAA 3.26
9.97% IL&FS 2016 AAA 3.19
9.35% PGC 2022 AAA 3.08
8.28% LIC Housing Fin 2015 AAA 3.03
6.98% IRFC 2012 AAA 2.50
11.50% RECL 2013 AAA 1.63
9.20% Power Grid 2015 AAA 1.56
9.25% HDFC Ltd 2016 AAA 1.55
9.35% PGC 2016 AAA 1.08
2.00% Tata Motors Ltd 2014 AAA 0.90
7.90% RECL 2012 AAA 0.62
9.25% Dr Reddy'S Lab Ltd 2014 AA+ 0.52
Unit Funds 3.95
HDFC Cash Management Fund -
Savings Plan (Growth Option) 3.95
CD/CP's 13.89
IDBI Bank 2011 - CD P1+ 4.68
PNB 2012 - CD P1+ 4.67
Corporation Bank 2012 - CD P1+ 4.55
Cash Bank & Others 5.41
Total 100.00
Debt Funds Hybrid FundsEquity Funds
33.16%
5.41%
5.41%
Equity
Corporate Bond
CD/CP’s
Unit Funds
Government Securities
Cash, Bank & Others3.95%
Whole Life Stable Growth Fund
FundAssure, Investment Report, October 2011ULIF 011 04/01/07 WLS 110
5.66%
3.39%
2.88%
2.82%
2.53%
1.84%
1.32%
1.28%
1.12%
6.75%
33.16%
3.95%
8.60%
5.41%
5.41%
13.89%
0% 5% 10% 15% 20% 25% 30% 35%
Banks
IT - Software
Refineries
Automobile
Pharmaceuticals
Tobacco Products
Finance
Steel
FMCG
Capital Goods-Non Electrical Equipment
Others
Corporate Bonds
Unit Funds
CD/CP's
Government Securities
Cash Bank & Others

Asset AllocationSector Allocation
62.98%
6.98%
21.15%
PortfolioFund Details
Instrument Industry % of NAV
Investment Style
Value Blend Growth Size
Large
Mid
Small
Debt Investment Style
Fund Performance
Last 6 Months 29-Apr-11 10.08 -4.55% -3.67%Last 1 Year 29-Oct-10 10.40 -7.51% -5.41%Last 2 Years 30-Oct-09 8.80 4.60% 6.07%Last 3 Years 31-Oct-08 6.38 14.65% 17.18%Last 4 Years 31-Oct-07 10.00 -0.95% 0.45%Since Inception 15-Oct-07 10.00 -0.95% 1.13%
Note : The investment income and prices may go down as well as up. “SinceInception” and returns above “1 Year” are calculated as per CAGR.
PERIOD DATE NAV INDEX Change
NAV Change
Credit Quality
High Mid LowInterest RateSensitivity
High
Mid
Low
Equity Investment Style
Investment Objective :
Fund Manager : Mr. Saravana Kumar
NAV as on 31 Oct, 11 : `9.62
Benchmark :
Corpus : 13.69 Crs.
The primary objective of the fund is to maximize the returns with medium to high risk.
Nifty - 65%
as on 31 Oct, 11 `
CRISIL Composite Bond Index - 35%
Equity 62.98
Reliance Industries Ltd Refineries 4.81
Infosys Ltd IT - Software 4.73
ITC Ltd Tobacco Products 4.21
HDFC Bank Banks 3.76
ICICI Bank Ltd Banks 3.74
Tata Consultancy Services Ltd IT - Software 2.24
HDFC Ltd Finance 2.14
State Bank of India Banks 2.09
Larsen And Toubro Ltd Capital Goods-Non Electrical Equipment 2.07
Mahindra And Mahindra Ltd Automobile 2.06
Other Equity 31.15
Corporate Bonds 21.15
8.30% HDFC 2015 AAA 10.51
8.28% LIC Housing Fin 2015 AAA 7.00
8.83% IRFC 2012 AAA 2.18
9.50% HDFC 2013 AAA 0.73
6.98% IRFC 2012 AAA 0.72
Government Securities 6.98
7.17% GOI 2015 Sovereign 6.98
Cash Bank & Others 8.88
Total 100.00
Debt Funds Hybrid FundsEquity Funds
Equity
Corporate Bond
Government Securities
Cash, Bank & Others
8.88%
Growth Maximiser Fund
FundAssure, Investment Report, October 2011ULIF 016 17/10/07 TGM 110
14.36%
7.78%
5.51%
5.49%
4.21%
3.45%
2.70%
2.58%
2.10%
2.09%
12.72%
21.15%
6.98%
8.88%
0.00% 5.00% 10.00% 15.00% 20.00% 25.00%
Banks
IT - Software
Automobile
Refineries
Tobacco Products
Pharmaceuticals
Steel
Finance
Power Generation & Distribution
Capital Goods-Non Electrical Equipment
Others
Corporate Bonds
Government Securities
Cash Bank & Others

Asset AllocationSector Allocation
34.99%
11.96%
PortfolioFund Details
Equity
Corporate Bonds
Cash, Bank & Others
Government Securities
Instrument Industry % of NAV
Investment Style
Value Blend Growth Size
Large
Mid
Small
Debt Investment Style
Fund Performance
Last 6 Months 29-Apr-11 11.45 -1.96% -1.04%
Last 1 Year 29-Oct-10 11.61 -3.36% -1.07%
Last 2 Years 30-Oct-09 10.36 4.11% 5.88%
Last 3 Years 31-Oct-08 8.51 9.69% 13.27%
Last 4 Years 31-Oct-07 10.00 2.93% 2.58%
Since Inception 15-Oct-07 10.00 2.90% 3.03%
Note : The investment income and prices may go down as well as up. “SinceInception” and returns above “1 Year” are calculated as per CAGR.
PERIOD DATE NAV INDEX Change
NAV Change
Credit Quality
High Mid LowInterest RateSensitivity
High
Mid
Low
Equity Investment Style
Investment Objective :
Fund Manager : Mr. Saravana Kumar
NAV as on : `11.22
Benchmark :
Corpus : 0.79 Crs.
The primary investment objective of the Fund is to provide reasonable returns with low to medium risk.
31 Oct, 11
Nifty - 40%
as on 31 Oct, 11 `
CRISIL Composite Bond Index - 60%
Equity 40.96
Reliance Industries Ltd Refineries 3.32
Infosys Ltd IT - Software 3.08
HDFC Bank Banks 2.78
ITC Ltd Tobacco Products 2.69
ICICI Bank Ltd Banks 2.35
Larsen And Toubro Ltd Capital Goods-Non Electrical Equipment 1.78
Tata Consultancy Services Ltd IT - Software 1.69
Mahindra And Mahindra Ltd Automobile 1.31
HDFC Ltd Finance 1.30
State Bank of India Banks 1.20
Other Equity 19.47
Corporate Bonds 12.09
8.30% HDFC 2015 AAA 12.09
Government Securities 11.96
7.83% GOI 2018 Sovereign 11.96
Cash Bank & Others 34.99
Total 100.00
Debt Funds Hybrid FundsEquity Funds
40.96%
12.09%
Life Growth Enabler Fund
FundAssure, Investment Report, October 2011ULIF 015 17/10/07 TGE 110
8.84%
5.79%
3.76%
3.63%
2.69%
2.18%
1.98%
1.78%
1.44%
1.22%
7.67%
11.96%
12.09%
34.99%
0.00% 10.00% 20.00% 30.00% 40.00%
Banks
IT - Software
Automobile
Refineries
Tobacco Products
Finance
Pharmaceuticals
Capital Goods-Non Electrical Equipment
Steel
FMCG
Others
Government Securities
Corporate Bonds
Cash Bank & Others

Asset AllocationSector Allocation
10.89%
48.26%
28.20%
PortfolioFund Details
Equity
Corporate Bonds
Government Securities
Cash, Bank & Others
Instrument Industry % of NAV
Investment Style
Value Blend Growth Size
Large
Mid
Small
Debt Investment Style
Fund Performance
Last 6 Months 29-Apr-11 12.18 0.82% 1.59%Last 1 Year 29-Oct-10 12.06 1.83% 3.27%Last 2 Years 30-Oct-09 11.42 3.69% 5.70%Last 3 Years 31-Oct-08 10.11 6.70% 9.35%Last 4 Years 31-Oct-07 10.00 5.27% 4.70%Since Inception 15-Oct-07 10.00 5.21% 4.93%
Note : The investment income and prices may go down as well as up. “SinceInception” and returns above “1 Year” are calculated as per CAGR.
PERIOD DATE NAV INDEX Change
NAV Change
Credit Quality
High Mid LowInterest RateSensitivity
High
Mid
Low
Equity Investment Style
Investment Objective :
Fund Manager : Mr. Saravana Kumar
NAV as on : `12.28
Benchmark :
Corpus : 5.93 Crs.
The key objective of the fund is to protect the capital by investing in high quality fixed income securities and at the same time provide access to the upside potential of equities by investing a maximum of 15% in equities and equity linked instruments.
31 Oct, 11
Nifty - 15%
as on 31 Oct, 11 `
CRISIL Composite Bond Index - 85%
Equity 12.63
Infosys Ltd IT - Software 1.21
Reliance Industries Ltd Refineries 1.04
HDFC Bank Banks 0.83
ITC Ltd Tobacco Products 0.79
ICICI Bank Ltd Banks 0.79
Larsen And Toubro Ltd Capital Goods-Non Electrical Equipment 0.48
State Bank of India Banks 0.42
Tata Consultancy Services Ltd IT - Software 0.38
Mahindra And Mahindra Ltd Automobile 0.36
Bharti Airtel Ltd Telecomm-Service 0.33
Other Equtiy 6.02
Corporate Bonds 28.20
9.45% LIC Housing 2012 AAA 6.74
7.90% RECL 2012 AAA 6.65
8.30% HDFC 2015 AAA 6.47
7.40% Infrastructure 2012 AAA 4.98
9.50% HDFC 2013 AAA 3.36
Government Securities 48.26
7.17% GOI 2015 Sovereign 40.26
7.83% GOI 2018 Sovereign 8.00
Cash Bank & Others 10.89
Total 100.00
Debt Funds Hybrid FundsEquity Funds
12.63%
Life Capital Guarantee Fund
FundAssure, Investment Report, October 2011ULIF 014 17/10/07 TCG 110
2.66%
1.94%
1.29%
1.03%
0.79%
0.66%
0.53%
0.48%
0.46%
0.39%
2.41%
48.26%
28.20%
10.89%
0.00% 10.00% 20.00% 30.00% 40.00% 50.00% 60.00%
Banks
IT - Software
Refineries
Automobile
Tobacco Products
Pharmaceuticals
Power Generation & Distribution
Capital Goods-Non Electrical Equipment
Steel
Capital Goods - Electrical Equipment
Others
Government Securities
Corporate Bonds
Cash Bank & Others

Asset AllocationSector Allocation
12.17%
16.08%
41.65%
PortfolioFund Details
Equity
Government Securities
Corporate Bonds
Cash, Bank & Others
Instrument Industry % of NAV
Investment Style
Value Blend Growth Size
Large
Mid
Small
Debt Investment Style
Fund Performance
Last 6 Months 29-Apr-11 11.80 1.06% 1.59%
Last 1 Year 29-Oct-10 11.71 1.77% 3.27%
Last 2 Years 30-Oct-09 11.05 3.84% 5.70%
Last 3 Years 31-Oct-08 10.20 5.32% 9.35%
Since Inception 04-Feb-08 10.00 4.81% 4.72%
Note : The investment income and prices may go down as well as up. “SinceInception” and returns above “1 Year” are calculated as per CAGR.
PERIOD DATE NAV INDEX Change
NAV Change
Credit Quality
High Mid LowInterest RateSensitivity
High
Mid
Low
Equity Investment Style
Investment Objective :
Fund Manager : Mr. Saravana Kumar
NAV as on : `11.92
Benchmark :
Corpus : 4.75 Crs.
The key objective of the fund is to protect the capital by investing in high quality fixed income securities and at the same time provide access to the upside potential of equities by investing a maximum of 15% in equities and equity linked instruments.
31 Oct, 11
Nifty - 15%
as on 31 Oct, 11 `
CRISIL Composite Bond Index - 85%
Equity 12.17
Infosys Ltd IT - Software 1.12
Reliance Industries Ltd Refineries 0.92
HDFC Bank Banks 0.77
ITC Ltd Tobacco Products 0.76
ICICI Bank Ltd Banks 0.73
State Bank of India Banks 0.48
Larsen And Toubro Ltd Capital Goods-Non Electrical Equipment 0.42
Mahindra And Mahindra Ltd Automobile 0.41
HDFC Ltd Finance 0.36
Tata Consultancy Services Ltd IT - Software 0.35
Other Equity 5.84
Government Securities 30.10
7.17% GOI 2015 Sovereign 22.10
7.83% GOI 2018 Sovereign 7.99
Corporate Bonds 41.65
9.80% PFC 2012 AAA 12.64
8.30% HDFC 2015 AAA 10.09
9.68% IRFC 2012 AAA 8.43
9.45% LIC Housing 2012 AAA 8.41
7.90% RECL 2012 AAA 2.07
Cash Bank & Others 16.08
Total 100.00
Debt Funds Hybrid FundsEquity Funds
30.10%
Future Capital Guarantee Pension Fund
FundAssure, Investment Report, October 2011ULIF 019 04/02/08 FCG 110
2.61%
1.78%
1.14%
1.07%
0.76%
0.67%
0.53%
0.48%
0.45%
0.42%
2.28%
30.10%
41.65%
16.08%
0.00% 10.00% 20.00% 30.00% 40.00% 50.00%
Banks
IT - Software
Refineries
Automobile
Tobacco Products
Pharmaceuticals
Power Generation & Distribution
Steel
Finance
Capital Goods-Non Electrical Equipment
Others
Government Securities
Corporate Bonds
Cash Bank & Others

Asset AllocationSector Allocation
11.71%32.67%
12.42%
PortfolioFund Details
Equity
Corporate Bonds
CD/CP’s
Government Securities
Cash, Bank & Others
Instrument Industry % of NAVInstrument Industry % of NAV
Investment Style
Value Blend Growth Size
Large
Mid
Small
Debt Investment Style
Fund Performance
Last 6 Months 29-Apr-11 12.40 -0.38% 0.01%
Last 1 Year 29-Oct-10 12.41 -0.43% 0.67%
Last 2 Years 30-Oct-09 11.15 5.24% 5.81%
Last 3 Years 31-Oct-08 9.12 10.63% 11.70%
Since Inception 04-Feb-08 10.00 5.81% 3.77%
Note : The investment income and prices may go down as well as up. “SinceInception” and returns above “1 Year” are calculated as per CAGR.
PERIOD DATE NAV INDEX Change
NAV Change
Credit Quality
High Mid LowInterest RateSensitivity
High
Mid
Low
Equity Investment Style
Investment Objective :
Fund Manager : Mr. Saravana Kumar
NAV as on : `12.35
Benchmark :
Corpus : 25.30 Crs.
The primary investment objective of the Fund is to maximize the returns with medium risk.
31 Oct, 11
Nifty - 30%
as on 31 Oct, 11 `
CRISIL Composite Bond Index - 70%
Debt Funds Hybrid FundsEquity Funds
Equity 26.33
Infosys Ltd IT - Software 2.27
Reliance Industries Ltd Refineries 2.25
HDFC Bank Banks 1.69
ITC Ltd Tobacco Products 1.69
ICICI Bank Ltd Banks 1.66
Tata Consultancy Services Ltd IT - Software 1.10
Larsen And Toubro Ltd Capital Goods-Non Electrical Equipment 0.98
State Bank of India Banks 0.83
Mahindra And Mahindra Ltd Automobile 0.82
HDFC Ltd Finance 0.82
Other Equity 12.22
CD/CP's 11.71
PNB 2012 - CD P1+ 7.78
Bank of Baroda 2011 - CD P1+ 3.93
Government Securities 12.42
7.17% GOI 2015 Sovereign 6.79
7.83% GOI 2018 Sovereign 5.63
Corporate Bonds 32.67
8.90% Power Grid 2015 AAA 6.77
10.00% IDFC 2012 AAA 5.93
8.28% LIC Housing Fin 2015 AAA 5.68
7.90% RECL 2012 AAA 3.89
8.40% HDFC 2014 AAA 3.82
9.25% HDFC Ltd 2016 AAA 3.11
8.30% HDFC 2015 AAA 2.27
9.50% HDFC 2013 AAA 1.18
Cash Bank & Others 16.86
Total 100.00
16.86%
26.33%
Future Growth Pension Fund
FundAssure, Investment Report, October 2011ULIF 021 04/02/08 FGP 110
5.72%
3.94%
2.44%
2.31%
1.81%
1.69%
1.22%
0.98%
0.92%
0.75%
4.56%
32.67%
12.42%
11.71%
16.86%
0.00% 10.00% 20.00% 30.00% 40.00%
Banks
IT - Software
Refineries
Automobile
Pharmaceuticals
Tobacco Products
Finance
Capital Goods-Non Electrical Equipment
Steel
Capital Goods - Electrical Equipment
Others
Corporate Bonds
Government Securities
CD/CP's
Cash Bank & Others

Asset AllocationSector Allocation
10.81%
29.39%
PortfolioFund Details
Equity
Government Securities
Corporate Bonds
CD/CP’s
Cash, Bank & Others
Instrument Industry % of NAVInstrument Industry % of NAV
Investment Style
Value Blend Growth Size
Large
Mid
Small
Debt Investment Style
Fund Performance
Last 6 Months 29-Apr-11 12.22 1.74% 2.12%
Last 1 Year 29-Oct-10 11.99 3.75% 4.14%
Last 2 Years 30-Oct-09 11.27 5.06% 5.66%
Last 3 Years 31-Oct-08 10.26 6.62% 8.56%
Since Inception 04-Feb-08 10.00 6.01% 5.04%
Note : The investment income and prices may go down as well as up. “SinceInception” and returns above “1 Year” are calculated as per CAGR.
PERIOD DATE NAV INDEX Change
NAV Change
Credit Quality
High Mid LowInterest RateSensitivity
High
Mid
Low
Equity Investment Style
Investment Objective :
Fund Manager : Mr. Saravana Kumar
NAV as on : `12.44
Benchmark :
Corpus : 12.33 Crs.
The primary investment objective of the Fund is to provide reasonable returns with low to medium risk.
31 Oct, 11
Nifty - 10%
as on 31 Oct, 11 `
CRISIL Composite Bond Index - 90%
Equity 8.64
Reliance Industries Ltd Refineries 0.71
Infosys Ltd IT - Software 0.70
HDFC Bank Banks 0.60
ITC Ltd Tobacco Products 0.56
ICICI Bank Ltd Banks 0.53
Larsen And Toubro Ltd Capital Goods-Non Electrical Equipment 0.34
Tata Consultancy Services Ltd IT - Software 0.32
State Bank of India Banks 0.27
Bharti Airtel Ltd Telecomm-Service 0.24
Oil & Natural Gas Corp Ltd Crude Oil & Natural Gas 0.23
Other Equity 4.15
CD/CP's 10.81
PNB 2012 - CD P1+ 6.78
Bank of Baroda 2011 - CD P1+ 4.03
Government Securities 29.39
7.17% GOI 2015 Sovereign 23.23
7.83% GOI 2018 Sovereign 6.16
Corporate Bonds 32.77
9.80% PFC 2012 AAA 5.68
10.00% IDFC 2012 AAA 5.68
7.90% RECL 2012 AAA 4.79
8.30% HDFC 2015 AAA 4.67
9.25% HDFC Ltd 2016 AAA 3.99
8.28% LIC Housing Fin 2015 AAA 3.89
9.95% SBI 2026 AAA 1.64
9.68% IRFC 2012 AAA 1.62
9.45% LIC Housing 2012 AAA 0.81
Cash Bank & Others 18.40
Total 100.00
Debt Funds Hybrid FundsEquity Funds
8.64%
18.40%
32.77%
Future Balanced Pension Fund
FundAssure, Investment Report, October 2011ULIF 018 04/02/08 FBP 110
1.90%
1.21%
0.81%
0.72%
0.56%
0.38%
0.37%
0.33%
0.32%
0.29%
1.74%
29.39%
10.81%
18.40%
32.77%
0.00% 10.00% 20.00% 30.00% 40.00%
Banks
IT - Software
Refineries
Automobile
Tobacco Products
Pharmaceuticals
Capital Goods-Non Electrical Equipment
Steel
Power Generation & Distribution
Crude Oil & Natural Gas
Others
Government Securities
Corporate Bonds
CD/CP's
Cash Bank & Others
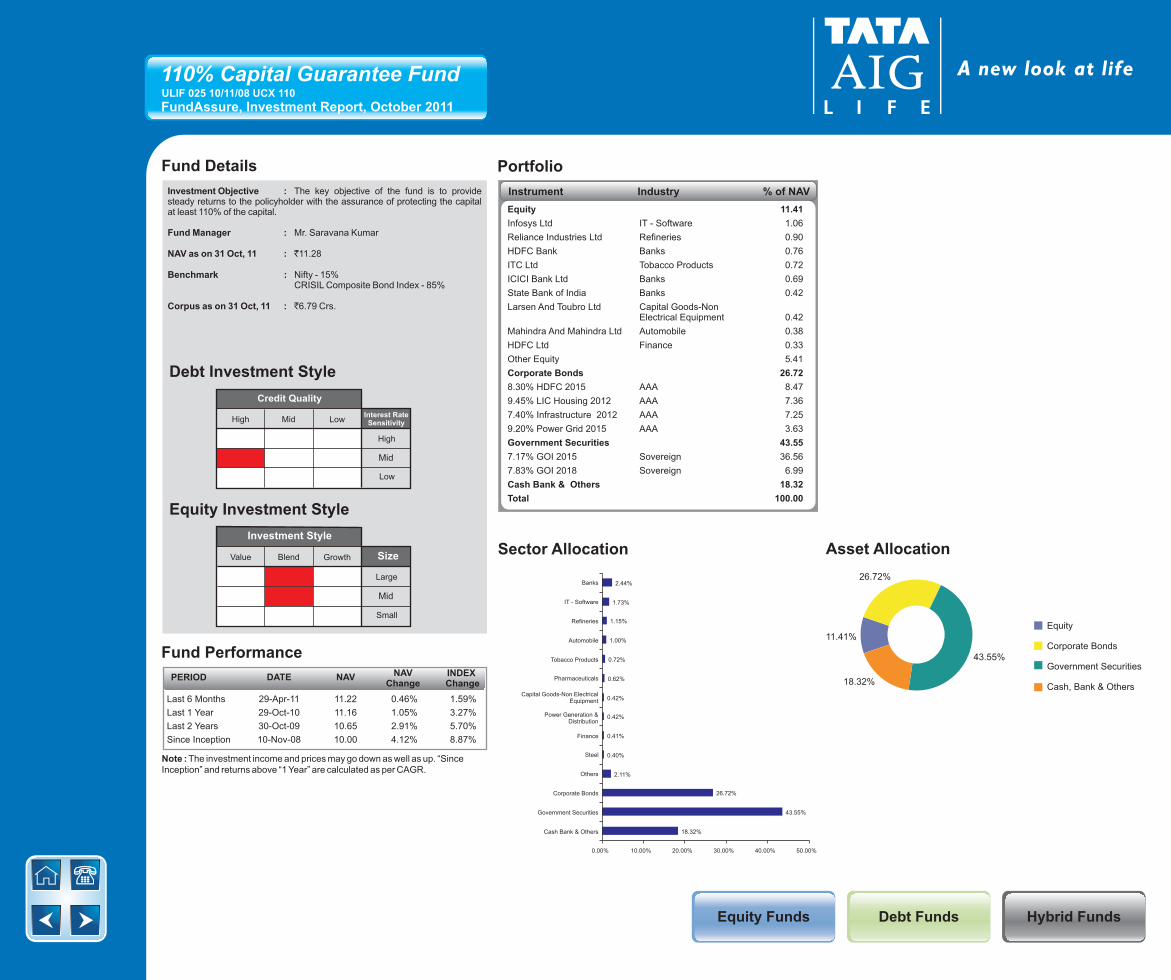
Asset AllocationSector Allocation
26.72%
11.41%
43.55%
PortfolioFund Details
Equity
Corporate Bonds
Government Securities
Cash, Bank & Others
Instrument Industry % of NAV
Investment Style
Value Blend Growth Size
Large
Mid
Small
Debt Investment Style
Fund Performance
Last 6 Months 29-Apr-11 11.22 0.46% 1.59%
Last 1 Year 29-Oct-10 11.16 1.05% 3.27%
Last 2 Years 30-Oct-09 10.65 2.91% 5.70%
Since Inception 10-Nov-08 10.00 4.12% 8.87%
Note : The investment income and prices may go down as well as up. “SinceInception” and returns above “1 Year” are calculated as per CAGR.
PERIOD DATE NAV INDEX Change
NAV Change
Credit Quality
High Mid LowInterest RateSensitivity
High
Mid
Low
Equity Investment Style
Investment Objective :
Fund Manager : Mr. Saravana Kumar
NAV as on : `11.28
Benchmark :
Corpus : 6.79 Crs.
The key objective of the fund is to provide steady returns to the policyholder with the assurance of protecting the capital at least 110% of the capital.
31 Oct, 11
Nifty - 15%
as on 31 Oct, 11 `
CRISIL Composite Bond Index - 85%
Equity 11.41
Infosys Ltd IT - Software 1.06
Reliance Industries Ltd Refineries 0.90
HDFC Bank Banks 0.76
ITC Ltd Tobacco Products 0.72
ICICI Bank Ltd Banks 0.69
State Bank of India Banks 0.42
Larsen And Toubro Ltd Capital Goods-Non Electrical Equipment 0.42
Mahindra And Mahindra Ltd Automobile 0.38
HDFC Ltd Finance 0.33
Other Equity 5.41
Corporate Bonds 26.72
8.30% HDFC 2015 AAA 8.47
9.45% LIC Housing 2012 AAA 7.36
7.40% Infrastructure 2012 AAA 7.25
9.20% Power Grid 2015 AAA 3.63
Government Securities 43.55
7.17% GOI 2015 Sovereign 36.56
7.83% GOI 2018 Sovereign 6.99
Cash Bank & Others 18.32
Total 100.00
Debt Funds Hybrid FundsEquity Funds
18.32%
110% Capital Guarantee Fund
FundAssure, Investment Report, October 2011ULIF 025 10/11/08 UCX 110
2.44%
1.73%
1.15%
1.00%
0.72%
0.62%
0.42%
0.42%
0.41%
0.40%
2.11%
26.72%
43.55%
18.32%
0.00% 10.00% 20.00% 30.00% 40.00% 50.00%
Banks
IT - Software
Refineries
Automobile
Tobacco Products
Pharmaceuticals
Capital Goods-Non Electrical Equipment
Power Generation & Distribution
Finance
Steel
Others
Corporate Bonds
Government Securities
Cash Bank & Others

Asset AllocationSector Allocation
PortfolioFund Details
Equity
Corporate Bonds
CD/CP’s
Government Securities
Cash Bank & Others
Instrument Industry % of NAV
Investment Style
Value Blend Growth Size
Large
Mid
Small
Debt Investment Style
Fund Performance
Last 6 Months 29-Apr-11 11.44 -0.24% -0.51%
Last 1 Year 29-Oct-10 11.39 0.20% -0.20%
Last 2 Years 30-Oct-09 10.17 5.97% 5.85%
Since Inception 12-Jan-09 10.00 4.84% 12.47%
Note : The investment income and prices may go down as well as up. “SinceInception” and returns above “1 Year” are calculated as per CAGR.
PERIOD DATE NAV INDEX Change
NAV Change
Credit Quality
High Mid LowInterest RateSensitivity
High
Mid
Low
Equity Investment Style
Investment Objective :
Fund Manager : Mr. Saravana Kumar
NAV as on : `11.42
Benchmark :
Corpus : 10.18Crs.
It is a Equity Oriented Balanced Fund which primarily invests in large cap equity stocks and equity linked instruments along with Government Bonds and highly rated Fixed Income Instruments, with an objective to maximize the returns with medium to high risk. The fund endeavors to offer long term capital appreciation along with the stable returns over a long period of time.
31 Oct, 11
Nifty - 35%
as on 31 Oct, 11 `
CRISIL Composite Bond Index - 65%
Equity 34.52
Infosys Ltd IT - Software 3.11
Reliance Industries Ltd Refineries 2.93
ICICI Bank Ltd Banks 2.29
ITC Ltd Tobacco Products 2.20
HDFC Bank Banks 2.17
Larsen And Toubro Ltd Capital Goods-Non Electrical Equipment 1.39
State Bank of India Banks 1.31
Tata Consultancy Services Ltd IT - Software 1.10
HDFC Ltd Finance 1.01
Bharti Airtel Ltd Telecomm-Service 0.96
Other Equity 16.06
Corporate Bonds 16.50
9.25% HDFC Ltd 2016 AAA 6.76
9.95% SBI 2026 AAA 4.96
8.28% LIC Housing Fin 2015 AAA 2.82
9.45% LIC Housing 2012 AAA 0.98
7.90% RECL 2012 AAA 0.97
Government Securities 18.76
7.17% GOI 2015 Sovereign 18.76
CD/CP's 11.65
PNB 2012 - CD P1+ 6.77
Bank of Baroda 2011 - CD P1+ 4.88
Cash Bank & Others 18.58
Total 100.00
Debt Funds Hybrid FundsEquity Funds
18.58%
11.65%
16.50%
34.52%
18.76%
Tata AIG Aggressive Flexi Fund
FundAssure, Investment Report, October 2011ULIF 028 12/01/09 IAF 110
7.28%
4.87%
3.24%
2.45%
2.37%
2.20%
1.40%
1.32%
1.22%
1.10%
7.07%
11.65%
16.50%
18.76%
18.58%
0.00% 5.00% 10.00% 15.00% 20.00%
Banks
IT - Software
Refineries
Automobile
Pharmaceuticals
Tobacco Products
Capital Goods-Non ElectricalEquipment
Steel
Finance
FMCG
Others
CD/CP's
Corporate Bonds
Government Securities
Cash Bank & Others

Asset AllocationSector Allocation
PortfolioFund Details
Equity
Corporate Bonds
CD/CP’s
Government Securities
Cash Bank & Others
Instrument Industry % of NAV
Investment Style
Value Blend Growth Size
Large
Mid
Small
Debt Investment Style
Fund Performance
Last 6 Months 29-Apr-11 11.33 1.50% 1.59%
Last 1 Year 29-Oct-10 11.13 3.33% 3.27%
Last 2 Years 30-Oct-09 10.36 5.38% 5.70%
Since Inception 12-Jan-09 10.00 5.12% 8.23%
Note : The investment income and prices may go down as well as up. “SinceInception” and returns above “1 Year” are calculated as per CAGR.
PERIOD DATE NAV INDEX Change
NAV Change
Credit Quality
High Mid LowInterest RateSensitivity
High
Mid
Low
Equity Investment Style
Investment Objective :
Fund Manager : Mr. Saravana Kumar
NAV as on : `11.50
Benchmark :
Corpus : 8.90 Crs.
It is a Debt Oriented Balanced Fund which primarily invests in Government Bonds and highly rated Fixed Income Instruments with some exposure to large cap equity stocks and equity linked instruments, with an objective to maximize the returns with low to medium risk. The fund endeavors to offer stable returns along with some capital appreciation over a long period of time.
31 Oct, 11
Nifty - 15%
as on 31 Oct, 11 `
CRISIL Composite Bond Index - 85%
Equity 13.99Infosys Ltd IT - Software 1.29ICICI Bank Ltd Banks 1.05ITC Ltd Tobacco Products 0.96Reliance Industries Ltd Refineries 0.94HDFC Bank Banks 0.88State Bank of India Banks 0.64Tata Consultancy Services Ltd IT - Software 0.50Larsen And Toubro Ltd Capital Goods-Non
Electrical Equipment 0.48Bharti Airtel Ltd Telecomm-Service 0.40HDFC Ltd Finance 0.39Other Equity 6.47Corporate Bonds 22.179.25% HDFC Ltd 2016 AAA 6.639.95% SBI 2026 AAA 5.688.60% PFC 2014 AAA 5.488.28% LIC Housing Fin 2015 AAA 2.159.45% LIC Housing 2012 AAA 1.127.90% RECL 2012 AAA 1.11Government Securities 21.477.17% GOI 2015 Sovereign 21.47CD/CP's 12.22PNB 2012 - CD P1+ 6.64Bank of Baroda 2011 - CD P1+ 5.58Cash Bank & Others 30.15Total 100.00
Debt Funds Hybrid FundsEquity Funds
30.15%
13.99%22.17%
12.22%
21.47%
Tata AIG Stable Flexi Fund
FundAssure, Investment Report, October 2011ULIF 029 12/01/09 ISF 110
3.14%
2.14%
1.06%
0.97%
0.96%
0.75%
0.61%
0.48%
0.47%
0.45%
2.98%
22.17%
12.22%
21.47%
30.15%
0.00% 5.00% 10.00% 15.00% 20.00% 25.00% 30.00% 35.00%
Banks
IT - Software
Refineries
Automobile
Tobacco Products
Pharmaceuticals
Finance
Capital Goods-Non Electrical Equipment
Steel
Crude Oil & Natural Gas
Others
Corporate Bonds
CD/CP's
Government Securities
Cash Bank & Others

Asset AllocationSector Allocation
PortfolioFund Details
Equity
Corporate Bonds
Unit Funds
Cash Bank & Others
Instrument Industry % of NAVInstrument Industry % of NAV
Investment Style
Value Blend Growth Size
Large
Mid
Small
Debt Investment Style
Fund Performance
Last 6 Months 29-Apr-11 11.94 -4.53%
Last 1 Year 29-Oct-10 12.39 -7.97%
Last 2 Years 30-Oct-09 10.30 5.19%
Since Inception 10-Jun-09 10.00 5.64%
PERIOD DATE NAV NAV Change
Credit Quality
High Mid LowInterest RateSensitivity
High
Mid
Low
Equity Investment Style
Investment Objective :
Fund Manager : Mr. Saravana Kumar
NAV as on 31 Oct, 11 : `11.40
The Highest Nav recordedon reset date is : 12.76
Benchmark :
Corpus : 360.72 Crs.
Objective is to use the participation in an actively managed well diversified equity portfolio of large cap companies to generate capital appreciation and use high credit quality debt instruments to lock-in that capital appreciation.
`
-
as on 31 Oct, 11 `
Equity 54.34Infosys Ltd IT - Software 4.55Reliance Industries Ltd Refineries 4.50ITC Ltd Tobacco Products 3.72HDFC Bank Banks 3.53ICICI Bank Ltd Banks 3.30Tata Consultancy Services Ltd IT - Software 2.01Larsen And Toubro Ltd Capital Goods-Non
Electrical Equipment 1.96State Bank of India Banks 1.80Bharti Airtel Ltd Telecomm-Service 1.74HDFC Ltd Finance 1.59
Corporate Bonds 42.4710.60% IRFC Ltd 2018 AAA 4.39National Housing Bank 2018 AAA 4.289.43% IRFC Ltd 2018 AAA 4.1511.25% PFC 2018 AAA 2.98NABARD -ZCB - 2019 AAA 2.85
Other Equity 25.64
9.07% RECL 2018 AAA 2.838.84% PGC 2019 AAA 2.657.60% HDFC 2017 AAA 2.538.90% Power Grid 2019 AAA 2.2610.75% Reliance Ind 2018 AAA 2.048.97% PFC 2018 AAA 1.619.95% SBI 2026 AAA 1.499.90% HDFC Ltd 2018 AAA 1.409.44% PFC 2021 AAA 1.379.35% PGC 2018 AAA 1.368.84% PGC 2018 AAA 1.338.84% PFC 2019 AAA 1.1811.00% PFC 2018 AAA 0.979.35% PGC 2019 AAA 0.81Unit Funds 1.66HDFC Cash Management Fund - Savings Plan (Growth Option) 1.66Cash Bank & Others 1.53Total 100.00
Debt Funds Hybrid FundsEquity Funds
The fund would be predominantly invested in equity at inception, wherein the dynamic asset allocation mechanism allocates the portfolio between equity and
debt. This dynamic asset allocation is based on the performance of equity markets and movements in interest rates. The equity allocation may be reallocated to
debt if the equity markets or interest rates fall , to safeguard the guarantee.
Over time, the asset mix will predominantly shift to debt to protect the guarantee. This dynamic asset allocation process will drive the returns generated by the
Apex Return Lock-in Fund. The dynamic asset allocation shifts the allocation of the fund from an equity bias to a debt bias, overtime. This would mean that the
Guaranteed NAV would not mimic the highest level of the equity market ,over the period the guarantee is applicable. Any unexpected and sharp falls in equity
market and/ or interest rates, during the period the guarantee is applicable, may trigger the allocation to completely move towards debt, to protect the highest
NAV achieved prior to the fall. Overall, it is an ideal fund for an investor who wants to take advantage of high returns in a positive market scenario while safe-
guarding the investment during any downturn.
* Actual Asset Mix % includes Cash & Money Market** Cash & Money Market includes current assets
42.47%
54.34%
1.66%
Note : The investment income and prices may go down as well as up. “SinceInception” and returns above “1 Year” are calculated as per CAGR.
Tata AIG Apex Return Lock-in-Fund
FundAssure, Investment Report, October 2011ULIF 032 18/02/09 ARL 110
1.53%
11.57%
7.11%
4.81%
4.63%
3.72%
2.97%
2.31%
2.23%
1.96%
1.96%
11.07%
42.47%
1.66%
1.53%
0.00% 5.00% 10.00% 15.00% 20.00% 25.00% 30.00% 35.00% 40.00% 45.00%
Banks
IT - Software
Refineries
Automobile
Tobacco Products
Pharmaceuticals
Steel
Finance
Capital Goods-Non ElectricalEquipment
Power Generation & Distribution
Others
Corporate Bonds
Unit Funds
Cash Bank & Others
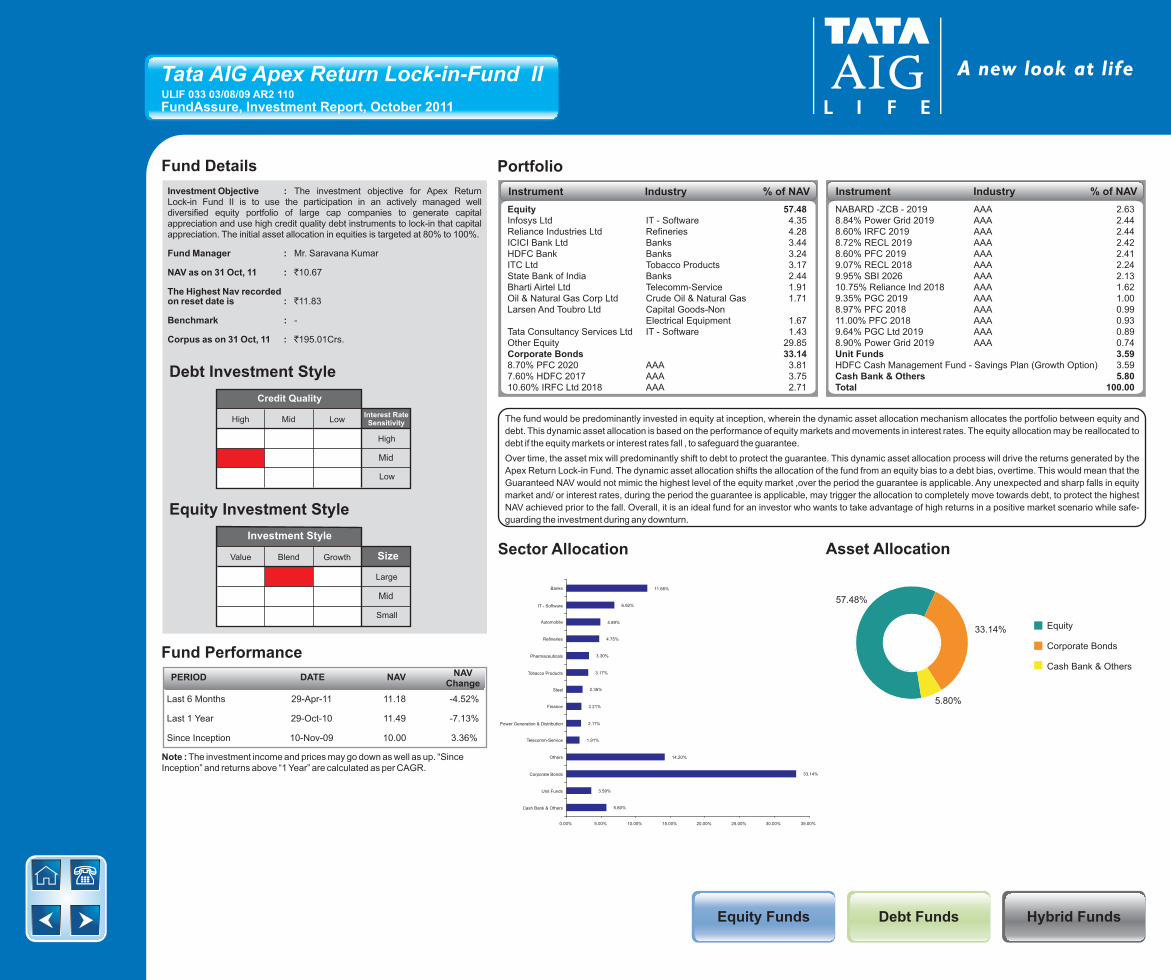
Debt Funds Hybrid FundsEquity Funds
Asset AllocationSector Allocation
PortfolioFund Details
Equity
Corporate Bonds
Cash Bank & Others
Instrument Industry % of NAVInstrument Industry % of NAV
Investment Style
Value Blend Growth Size
Large
Mid
Small
Debt Investment Style
Fund Performance
Last 6 Months 29-Apr-11 11.18 -4.52%
Last 1 Year 29-Oct-10 11.49 -7.13%
Since Inception 10-Nov-09 10.00 3.36%
PERIOD DATE NAV NAV Change
Credit Quality
High Mid LowInterest RateSensitivity
High
Mid
Low
Equity Investment Style
Investment Objective : The investment objective for Apex Return Lock-in Fund II is to use the participation in an actively managed well diversified equity portfolio of large cap companies to generate capital appreciation and use high credit quality debt instruments to lock-in that capital appreciation. The initial asset allocation in equities is targeted at 80% to 100%.
Fund Manager : Mr. Saravana Kumar
NAV as on 31 , 11 : `10.67
The Highest Nav recordedon reset date is : `11.83
Benchmark : -
Corpus as on 31 , 11 : `195.01Crs.
Oct
Oct
Equity 57.48Infosys Ltd IT - Software 4.35Reliance Industries Ltd Refineries 4.28ICICI Bank Ltd Banks 3.44HDFC Bank Banks 3.24ITC Ltd Tobacco Products 3.17State Bank of India Banks 2.44Bharti Airtel Ltd Telecomm-Service 1.91Oil & Natural Gas Corp Ltd Crude Oil & Natural Gas 1.71Larsen And Toubro Ltd Capital Goods-Non
Electrical Equipment 1.67Tata Consultancy Services Ltd IT - Software 1.43
Corporate Bonds 33.148.70% PFC 2020 AAA 3.817.60% HDFC 2017 AAA 3.7510.60% IRFC Ltd 2018 AAA 2.71
Other Equity 29.85
NABARD -ZCB - 2019 AAA 2.638.84% Power Grid 2019 AAA 2.448.60% IRFC 2019 AAA 2.448.72% RECL 2019 AAA 2.428.60% PFC 2019 AAA 2.419.07% RECL 2018 AAA 2.249.95% SBI 2026 AAA 2.1310.75% Reliance Ind 2018 AAA 1.629.35% PGC 2019 AAA 1.008.97% PFC 2018 AAA 0.9911.00% PFC 2018 AAA 0.939.64% PGC Ltd 2019 AAA 0.898.90% Power Grid 2019 AAA 0.74Unit Funds 3.59HDFC Cash Management Fund - Savings Plan (Growth Option) 3.59Cash Bank & Others 5.80Total 100.00
The fund would be predominantly invested in equity at inception, wherein the dynamic asset allocation mechanism allocates the portfolio between equity and
debt. This dynamic asset allocation is based on the performance of equity markets and movements in interest rates. The equity allocation may be reallocated to
debt if the equity markets or interest rates fall , to safeguard the guarantee.
Over time, the asset mix will predominantly shift to debt to protect the guarantee. This dynamic asset allocation process will drive the returns generated by the
Apex Return Lock-in Fund. The dynamic asset allocation shifts the allocation of the fund from an equity bias to a debt bias, overtime. This would mean that the
Guaranteed NAV would not mimic the highest level of the equity market ,over the period the guarantee is applicable. Any unexpected and sharp falls in equity
market and/ or interest rates, during the period the guarantee is applicable, may trigger the allocation to completely move towards debt, to protect the highest
NAV achieved prior to the fall. Overall, it is an ideal fund for an investor who wants to take advantage of high returns in a positive market scenario while safe-
guarding the investment during any downturn.
* Actual Asset Mix % includes Cash & Money Market** Cash & Money Market includes current assets
Note : The investment income and prices may go down as well as up. “SinceInception” and returns above “1 Year” are calculated as per CAGR.
57.48%
33.14%
5.80%
Tata AIG Apex Return Lock-in-Fund II
FundAssure, Investment Report, October 2011ULIF 033 03/08/09 AR2 110
11.66%
6.92%
4.89%
4.75%
3.30%
3.17%
2.36%
2.21%
2.11%
1.91%
14.20%
33.14%
3.59%
5.80%
0.00% 5.00% 10.00% 15.00% 20.00% 25.00% 30.00% 35.00%
Banks
IT - Software
Automobile
Refineries
Pharmaceuticals
Tobacco Products
Steel
Finance
Power Generation & Distribution
Telecomm-Service
Others
Corporate Bonds
Unit Funds
Cash Bank & Others

Debt Funds Hybrid FundsEquity Funds
Note : The investment income and prices may go down as well as up. “SinceInception” and returns above “1 Year” are calculated as per CAGR.
Asset AllocationRating Profile
PortfolioFund Details
Instrument Industry % of NAV
Investment Style
Value Blend Growth Size
Large
Mid
Small
Debt Investment Style
Fund Performance
Last 6 Months 29-Apr-11 10.46 2.63% 1.59%
Last 1 Year 29-Oct-10 10.24 4.82% 3.27%
Since Inception 23-Nov-09 10.00 3.73% 4.75%
PERIOD DATE NAV INDEX Change
NAV Change
Credit Quality
High Mid LowInterest RateSensitivity
High
Mid
Low
Equity Investment Style
Investment Objective : The key objective of the fund is to provide steady returns to the policyholder with the assurance of protecting the capital at atleast 110% of the capital.
Fund Manager : Mr. Saravana Kumar
NAV as on 31 , 11 : `10.73
Benchmark : Nifty - 15%CRISIL Composite Bond Index - 85%
Corpus as on 3 , 11 : `0.82 Crs.
Oct
1 Oct
Government Securities 46.43
7.17% GOI 2015 Sovereign 46.43
Cash Bank & Others 53.57
Total 100.00
Cash Bank & Others
Maturity Profile
46.43%
53.57%
Sovereign
Cash Bank & Others
Government Securities
53.57%
46.43%
Asset Mix
Equity Upto 15% 0%
Debt * Up to 100% 100%
Cash & Money Market ** Up to 100% 42%
* Actual Asset Mix % includes Cash & Money Market** Cash & Money Market includes current assets
Instrument Asset Mix as per F&U
Actual Asset Mix 0.00%
20.00%
40.00%
60.00%
80.00%
100.00%
Less than 1 Year 3-6 Years
Super 110% Capital Guarantee Fund
FundAssure, Investment Report, October 2011ULIF 036 23/11/09 UCS 110

Debt Funds Hybrid FundsEquity Funds
Asset AllocationSector Allocation
PortfolioFund Details
Equity
Corporate Bonds
Cash Bank & Others
Instrument Industry % of NAVInstrument Industry % of NAV
Investment Style
Value Blend Growth Size
Large
Mid
Small
Debt Investment Style
Credit Quality
High Mid LowInterest RateSensitivity
High
Mid
Low
Equity Investment Style
Investment Objective : The investment objective for Apex Plus Return Lock-in Fund is to use the participation in an actively managed well diversified equity portfolio of large cap companies to generate capital appreciation and use high credit quality debt instruments to lock-in that capital appreciation.
Fund Manager : Mr. Saravana Kumar
NAV as on 3 , 11 : `10.35
The Highest Nav recordedon reset date is : `11.80
Benchmark : -
Corpus as on 3 , 11 : `73.17Crs.
1 Oct
1 Oct
Equity 62.82
Infosys Ltd IT - Software 5.21
Reliance Industries Ltd Refineries 4.92
ITC Ltd Tobacco Products 4.66
ICICI Bank Ltd Banks 3.82
HDFC Bank Banks 3.68
Larsen And Toubro Ltd Capital Goods-Non
Electrical Equipment 2.41
State Bank of India Banks 2.24
Bharti Airtel Ltd Telecomm-Service 2.14
Tata Consultancy Services Ltd IT - Software 2.06
Mahindra And Mahindra Ltd Automobile 1.89
Other Equity 29.78
Corporate Bonds 34.24
9.48% RECL 2021 AAA 6.04
8.70% PFC 2020 AAA 5.91
9.64% PGC 2020 AAA 5.43
8.72% SAIL 2020 AAA 4.50
9.95% SBI 2026 AAA 4.14
8.80% PGC 2020 AAA 2.91
8.75% Reliance Industries Ltd 2020 AAA 2.58
8.90% HDFC 2020 AAA 1.43
8.93% NTPC 2021 AAA 1.30
Cash Bank & Others 2.94
Total 100.00
The fund would be predominantly invested in equity at inception, wherein the dynamic asset allocation mechanism allocates the portfolio between equity and
debt. This dynamic asset allocation is based on the performance of equity markets and movements in interest rates. The equity allocation may be reallocated to
debt if the equity markets or interest rates fall , to safeguard the guarantee.
Over time, the asset mix will predominantly shift to debt to protect the guarantee. This dynamic asset allocation process will drive the returns generated by the
Apex Return Lock-in Fund. The dynamic asset allocation shifts the allocation of the fund from an equity bias to a debt bias, overtime. This would mean that the
Guaranteed NAV would not mimic the highest level of the equity market ,over the period the guarantee is applicable. Any unexpected and sharp falls in equity
market and/ or interest rates, during the period the guarantee is applicable, may trigger the allocation to completely move towards debt, to protect the highest
NAV achieved prior to the fall. Overall, it is an ideal fund for an investor who wants to take advantage of high returns in a positive market scenario while safe-
guarding the investment during any downturn.
Fund Performance
Last 6 Months 29-Apr-11 10.91 -5.13%
Last 1 Year 29-Oct-10 11.40 -9.21%
Since Inception 10-May-10 10.00 2.38%
PERIOD DATE NAV NAV Change
Asset Mix
Equity Upto 100% 68%
Debt * 0% - 100% 32%
Cash & Money Market ** up to 100% 5%
* Actual Asset Mix % includes Cash & Money Market** Cash & Money Market includes current assets
Instrument Asset Mix as per F&U
Actual Asset Mix
62.82%
34.24%
2.94%
Note : The investment income and prices may go down as well as up. “SinceInception” and returns above “1 Year” are calculated as per CAGR.
Tata AIG Apex Plus Return Lock-in-Fund
FundAssure, Investment Report, September 2011ULIF 047 01/02/10 RA1 110
12.47%
8.23%
5.43%
5.31%
4.66%
3.66%
2.63%
2.45%
2.41%
2.14%
13.43%
34.24%
2.94%
0.00% 5.00% 10.00% 15.00% 20.00% 25.00% 30.00% 35.00% 40.00%
Banks
IT - Software
Refineries
Automobile
Tobacco Products
Pharmaceuticals
Steel
Finance
Capital Goods-Non Electrical Equipment
Telecomm-Service
Others
Corporate Bonds
Cash Bank & Others

Debt Funds Hybrid FundsEquity Funds
Asset AllocationSector Allocation
PortfolioFund Details
Equity
Corporate Bonds
Cash Bank & Others
Instrument Industry % of NAVInstrument Industry % of NAV
Investment Style
Value Blend Growth Size
Large
Mid
Small
Debt Investment Style
Credit Quality
High Mid LowInterest RateSensitivity
High
Mid
Low
Equity Investment Style
Investment Objective : The investment objective for Apex Pension Return Lock-in Fund is to use the participation in an actively managed well diversified equity portfolio of large cap companies to generate capital appreciation and use high credit quality debt instruments to lock-in that capital appreciation.
Fund Manager : Mr. Saravana Kumar
NAV as on 3 , 11 : `10.39
The Highest Nav recordedon reset date is : `11.75
Benchmark : -
Corpus as on 3 , 11 : `2.52 Crs.
1 Oct
1 Oct
Equity 62.10
Infosys Ltd IT - Software 5.43
Reliance Industries Ltd Refineries 4.88
ITC Ltd Tobacco Products 4.44
ICICI Bank Ltd Banks 3.70
HDFC Bank Banks 3.70
Larsen And Toubro Ltd Capital Goods-Non
Electrical Equipment 2.53
State Bank of India Banks 2.27
Bharti Airtel Ltd Telecomm-Service 2.02
HDFC Ltd Finance 1.91
Oil & Natural Gas Corp Ltd Crude Oil & Natural Gas 1.76
Corporate Bonds 26.22
8.70% PFC 2020 AAA 11.20
8.80% RECL 2020 AAA 7.50
8.93% NTPC 2021 AAA 3.78
8.75% Reliance Industries
Ltd 2020 AAA 3.74
Cash Bank & Others 11.67
Total 100.00
Other Equity 29.46
The fund would be predominantly invested in equity at inception, wherein the dynamic asset allocation mechanism allocates the portfolio between equity and
debt. This dynamic asset allocation is based on the performance of equity markets and movements in interest rates. The equity allocation may be reallocated to
debt if the equity markets or interest rates fall , to safeguard the guarantee.
Over time, the asset mix will predominantly shift to debt to protect the guarantee. This dynamic asset allocation process will drive the returns generated by the
Apex Return Lock-in Fund. The dynamic asset allocation shifts the allocation of the fund from an equity bias to a debt bias, overtime. This would mean that the
Guaranteed NAV would not mimic the highest level of the equity market ,over the period the guarantee is applicable. Any unexpected and sharp falls in equity
market and/ or interest rates, during the period the guarantee is applicable, may trigger the allocation to completely move towards debt, to protect the highest
NAV achieved prior to the fall. Overall, it is an ideal fund for an investor who wants to take advantage of high returns in a positive market scenario while safe-
guarding the investment during any downturn.
Fund Performance
Last 6 Months 29-Apr-11 10.93 -4.99%
Last 1 Year 29-Oct-10 11.37 -8.67%
Since Inception 10-May-10 10.00 2.60%
PERIOD DATE NAV NAV Change
Asset Mix
Equity Upto 100% 66%
Debt * 0% - 100% 34%
Cash & Money Market ** up to 100% 8%
* Actual Asset Mix % includes Cash & Money Market** Cash & Money Market includes current assets
Instrument Asset Mix as per F&U
Actual Asset Mix
62.10%
26.22%
11.67%
Note : The investment income and prices may go down as well as up. “SinceInception” and returns above “1 Year” are calculated as per CAGR.
Tata AIG Apex Pension Return Lock-in-Fund SP
FundAssure, Investment Report, October 2011ULIF 042 20/01/10 PR1 110
11.74%
8.19%
5.37%
5.33%
4.44%
3.67%
2.76%
2.53%
2.50%
2.40%
13.16%
26.22%
11.67%
0.00% 5.00% 10.00% 15.00% 20.00% 25.00% 30.00%
Banks
IT - Software
Refineries
Automobile
Tobacco Products
Pharmaceuticals
Steel
Capital Goods-Non
Electrical Equipment
Finance
Power Generation & Distribution
Others
Corporate Bonds
Cash Bank & Others

Debt Funds Hybrid FundsEquity Funds
Asset AllocationSector Allocation
PortfolioFund Details
Equity
Cash Bank & Others
Corporate Bonds
Instrument Industry % of NAVInstrument Industry % of NAV
Investment Style
Value Blend Growth Size
Large
Mid
Small
Debt Investment Style
Credit Quality
High Mid LowInterest RateSensitivity
High
Mid
Low
Equity Investment Style
Investment Objective : The investment objective for Apex Pension 10 Return Lock-in Fund is to use the participation in an actively managed well diversified equity portfolio of large cap companies to generate capital appreciation and use high credit quality debt instruments to lock-in that capital appreciation.
Fund Manager : Mr. Saravana Kumar
NAV as on 3 , 11 : `10.34
The Highest Nav recordedon reset date is : `11.82
Corpus as on 3 , 11 : `69.60 Crs.
1 Oct
1 Oct
Equity 63.31
Infosys Ltd IT - Software 5.37
Reliance Industries Ltd Refineries 5.17
ITC Ltd Tobacco Products 4.46
HDFC Bank Banks 4.22
ICICI Bank Ltd Banks 3.95
State Bank of India Banks 2.47
Larsen And Toubro Ltd Capital Goods-Non
Electrical Equipment 2.34
Tata Consultancy Services Ltd IT - Software 2.24
Bharti Airtel Ltd Telecomm-Service 2.14
Mahindra And Mahindra Ltd Automobile 1.87
Other Equity 29.08
Corporate Bonds 33.86
8.70% PFC 2020 AAA 6.21
9.48% RECL 2021 AAA 5.65
9.95% SBI 2026 AAA 5.08
8.72% SAIL 2020 AAA 4.73
8.80% PGC 2020 AAA 3.73
9.64% PGC Ltd 2019 AAA 3.57
8.75% Reliance Industries
Ltd 2020 AAA 2.84
8.93% NTPC 2021 AAA 1.09
8.90% HDFC 2020 AAA 0.68
9.35% PGC 2016 AAA 0.28
Cash Bank & Others 2.83
Total 100.00
The fund would be predominantly invested in equity at inception, wherein the dynamic asset allocation mechanism allocates the portfolio between equity and
debt. This dynamic asset allocation is based on the performance of equity markets and movements in interest rates. The equity allocation may be reallocated to
debt if the equity markets or interest rates fall , to safeguard the guarantee.
Over time, the asset mix will predominantly shift to debt to protect the guarantee. This dynamic asset allocation process will drive the returns generated by the
Apex Return Lock-in Fund. The dynamic asset allocation shifts the allocation of the fund from an equity bias to a debt bias, overtime. This would mean that the
Guaranteed NAV would not mimic the highest level of the equity market ,over the period the guarantee is applicable. Any unexpected and sharp falls in equity
market and/ or interest rates, during the period the guarantee is applicable, may trigger the allocation to completely move towards debt, to protect the highest
NAV achieved prior to the fall. Overall, it is an ideal fund for an investor who wants to take advantage of high returns in a positive market scenario while safe-
guarding the investment during any downturn.
Fund Performance
Last 6 Months 29-Apr-11 10.91 -5.27%
Last 1 Year 29-Oct-10 11.43 -9.54%
Since Inception 10-May-10 10.00 2.27%
PERIOD DATE NAV NAV Change
Asset Mix
Equity Upto 100% 70%
Debt * 0% - 100% 30%
Cash & Money Market ** up to 100% 5%
* Actual Asset Mix % includes Cash & Money Market** Cash & Money Market includes current assets
Instrument Asset Mix as per F&U
Actual Asset Mix
63.31%
33.86%
2.83%
Note : The investment income and prices may go down as well as up. “SinceInception” and returns above “1 Year” are calculated as per CAGR.
Tata AIG Apex Pension Return Lock-in-Fund (10 Year term)
FundAssure, Investment Report, October 2011ULIF 043 20/01/10 PR2 110
12.76%
8.38%
5.89%
5.21%
4.46%
3.29%
2.77%
2.34%
2.14%
1.88%
14.19%
33.86%
2.83%
0.00% 5.00% 10.00% 15.00% 20.00% 25.00% 30.00% 35.00% 40.00%
Banks
IT - Software
Refineries
Automobile
Tobacco Products
Pharmaceuticals
Steel
Capital Goods-Non Electrical Equipment
Telecomm-Service
Capital Goods - Electrical Equipment
Others
Corporate Bonds
Cash Bank & Others

Debt Funds Hybrid FundsEquity Funds
Asset AllocationSector Allocation
PortfolioFund Details
Equity
Government Securities
Corporate Bonds
Cash Bank & Others
Instrument Industry % of NAVInstrument Industry % of NAV
Investment Style
Value Blend Growth Size
Large
Mid
Small
Debt Investment Style
Credit Quality
High Mid LowInterest RateSensitivity
High
Mid
Low
Equity Investment Style
Investment Objective : The investment objective for Apex Pension 15 Return Lock-in Fund is to use the participation in an actively managed well diversified equity portfolio of large cap companies to generate capital appreciation and use high credit quality debt instruments to lock-in that capital appreciation.
Fund Manager : Mr. Saravana Kumar
NAV as on 3 , 11 : `10.20
The Highest Nav recordedon reset date is : `11.77
Corpus as on 3 , 11 : `12.67 Crs.
1 Oct
1 Oct
Equity 72.07
Infosys Ltd IT - Software 6.47
Reliance Industries Ltd Refineries 5.96
ITC Ltd Tobacco Products 5.21
HDFC Bank Banks 4.83
ICICI Bank Ltd Banks 4.41
Tata Consultancy Services Ltd IT - Software 3.02
Larsen And Toubro Ltd Capital Goods-Non
Electrical Equipment 2.73
State Bank of India Banks 2.56
Bharti Airtel Ltd Telecomm-Service 2.43
Mahindra And Mahindra Ltd Automobile 2.32
Corporate Bonds 6.89
9.35% PGC 2025 AAA 6.89
Government Securities 19.80
8.20% GOI 2023 Sovereign 11.86
7.95% GOI 2025 Sovereign 7.94
Cash Bank & Others 1.24
Total 100.00
Other Equity 32.13
The fund would be predominantly invested in equity at inception, wherein the dynamic asset allocation mechanism allocates the portfolio between equity and
debt. This dynamic asset allocation is based on the performance of equity markets and movements in interest rates. The equity allocation may be reallocated to
debt if the equity markets or interest rates fall , to safeguard the guarantee.
Over time, the asset mix will predominantly shift to debt to protect the guarantee. This dynamic asset allocation process will drive the returns generated by the
Apex Return Lock-in Fund. The dynamic asset allocation shifts the allocation of the fund from an equity bias to a debt bias, overtime. This would mean that the
Guaranteed NAV would not mimic the highest level of the equity market ,over the period the guarantee is applicable. Any unexpected and sharp falls in equity
market and/ or interest rates, during the period the guarantee is applicable, may trigger the allocation to completely move towards debt, to protect the highest
NAV achieved prior to the fall. Overall, it is an ideal fund for an investor who wants to take advantage of high returns in a positive market scenario while safe-
guarding the investment during any downturn.
Fund Performance
Last 6 Months 29-Apr-11 10.90 -6.39%
Last 1 Year 29-Oct-10 11.36 -10.20%
Since Inception 10-May-10 10.00 1.38%
PERIOD DATE NAV NAV Change
Asset Mix
Equity Upto 100% 76%
Debt * 0% - 100% 24%
Cash & Money Market ** up to 100% 1%
* Actual Asset Mix % includes Cash & Money Market** Cash & Money Market includes current assets
Instrument Asset Mix as per F&U
Actual Asset Mix
1.24%
19.80%
72.07%
Note : The investment income and prices may go down as well as up. “SinceInception” and returns above “1 Year” are calculated as per CAGR.
Tata AIG Apex Pension Return Lock-in-Fund (15 Year term)
FundAssure, Investment Report, October 2011ULIF 044 20/01/10 PR3 110
6.89%
14.53%
10.51%
6.66%
6.49%
5.21%
3.79%
3.18%
2.86%
2.73%
2.51%
13.60%
19.80%
6.89%
1.24%
0.00% 5.00% 10.00% 15.00% 20.00% 25.00%
Banks
IT - Software
Refineries
Automobile
Tobacco Products
Pharmaceuticals
Steel
Finance
Capital Goods-Non Electrical Equipment
Power Generation & Distribution
Others
Government Securities
Corporate Bonds
Cash Bank & Others

Debt Funds Hybrid FundsEquity Funds
Asset AllocationSector Allocation
PortfolioFund Details
Equity
Government Securities
Corporate Bonds
Cash Bank & Others
Instrument Industry % of NAVInstrument Industry % of NAV
Investment Style
Value Blend Growth Size
Large
Mid
Small
Debt Investment Style
Credit Quality
High Mid LowInterest RateSensitivity
High
Mid
Low
Equity Investment Style
Investment Objective : The investment objective for Apex Pension 20 Return Lock-in Fund is to use the participation in an actively managed well diversified equity portfolio of large cap companies to generate capital appreciation and use high credit quality debt instruments to lock-in that capital appreciation.
Fund Manager : Mr. Saravana Kumar
NAV as on 3 , 11 : `10.30
The Highest Nav recordedon reset date is : `11.78
Corpus as on 3 , 11 : `2.15 Crs.
1 Oct
1 Oct
Equity 75.56
Reliance Industries Ltd Refineries 6.34
Infosys Ltd IT - Software 6.03
ITC Ltd Tobacco Products 5.56
ICICI Bank Ltd Banks 4.99
HDFC Bank Banks 4.56
Larsen And Toubro Ltd Capital Goods-Non
Electrical Equipment 2.80
State Bank of India Banks 2.66
Tata Consultancy Services Ltd IT - Software 2.29
Bharti Airtel Ltd Telecomm-Service 2.28
Mahindra And Mahindra Ltd Automobile 2.26
Corporate Bonds 8.96
9.35% PGC 2030 AAA 8.96
Government Securities 8.72
8.28% GOI 2032 Sovereign 8.72
Cash Bank & Others 6.77
Total 100.00
Other Equity 35.79
The fund would be predominantly invested in equity at inception, wherein the dynamic asset allocation mechanism allocates the portfolio between equity and
debt. This dynamic asset allocation is based on the performance of equity markets and movements in interest rates. The equity allocation may be reallocated to
debt if the equity markets or interest rates fall , to safeguard the guarantee.
Over time, the asset mix will predominantly shift to debt to protect the guarantee. This dynamic asset allocation process will drive the returns generated by the
Apex Return Lock-in Fund. The dynamic asset allocation shifts the allocation of the fund from an equity bias to a debt bias, overtime. This would mean that the
Guaranteed NAV would not mimic the highest level of the equity market ,over the period the guarantee is applicable. Any unexpected and sharp falls in equity
market and/ or interest rates, during the period the guarantee is applicable, may trigger the allocation to completely move towards debt, to protect the highest
NAV achieved prior to the fall. Overall, it is an ideal fund for an investor who wants to take advantage of high returns in a positive market scenario while safe-
guarding the investment during any downturn.
Fund Performance
Last 6 Months 29-Apr-11 10.93 -5.76%
Last 1 Year 29-Oct-10 11.35 -9.28%
Since Inception 10-May-10 10.00 2.00%
PERIOD DATE NAV NAV Change
Asset Mix
Equity Upto 100% 81%
Debt * 0% - 100% 19%
Cash & Money Market ** up to 100% 8%
* Actual Asset Mix % includes Cash & Money Market** Cash & Money Market includes current assets
Instrument Asset Mix as per F&U
Actual Asset Mix
75.56%
8.72%
6.77%
Note : The investment income and prices may go down as well as up. “SinceInception” and returns above “1 Year” are calculated as per CAGR.
Tata AIG Apex Pension Return Lock-in-Fund (20Year term)
FundAssure, Investment Report, October 2011ULIF 045 20/01/10 PR4 110
8.96%
14.88%
9.44%
7.06%
6.33%
5.56%
4.25%
2.80%
2.76%
2.37%
2.31%
17.80%
8.72%
8.96%
6.77%
0.00% 2.00% 4.00% 6.00% 8.00% 10.00% 12.00% 14.00% 16.00% 18.00% 20.00%
Banks
IT - Software
Refineries
Automobile
Tobacco Products
Pharmaceuticals
Capital Goods-Non Electrical Equipment
Steel
Power Generation & Distribution
Capital Goods - Electrical Equipment
Others
Government Securities
Corporate Bonds
Cash Bank & Others

Debt Funds Hybrid FundsEquity Funds
Asset AllocationSector Allocation
PortfolioFund Details
Equity
Corporate Bonds
Cash Bank & Others
Instrument Industry % of NAVInstrument Industry % of NAV
Investment Style
Value Blend Growth Size
Large
Mid
Small
Debt Investment Style
Credit Quality
High Mid LowInterest RateSensitivity
High
Mid
Low
Equity Investment Style
Investment Objective : The investment objective for Apex Plus Return Lock-in Fund – II is to use the participation in an actively managed well diversified equity portfolio of large cap companies to generate capital appreciation and use high credit quality debt instruments to lock-in that capital appreciation.
Fund Manager : Mr. Saravana Kumar
NAV as on 3 , 11 : `9.30
The Highest Nav recordedon reset date is : `10.52
Corpus as on 3 , 11 : `15.63 Crs.
1 Oct
1 Oct
Equity 67.32
Reliance Industries Ltd Refineries 5.05
Infosys Ltd IT - Software 4.97
ICICI Bank Ltd Banks 3.75
ITC Ltd Tobacco Products 3.61
HDFC Bank Banks 3.53
State Bank of India Banks 2.68
Bharti Airtel Ltd Telecomm-Service 2.26
Tata Consultancy Services Ltd IT - Software 2.07
Larsen And Toubro Ltd Capital Goods-Non
Electrical Equipmt 2.03
HDFC Ltd Finance 1.89
Corporate Bonds 20.81
8.90% HDFC 2020 AAA 6.71
9.35% PGC 2016 AAA 6.25
8.80% RECL 2020 AAA 4.23
8.72% SAIL 2020 AAA 1.81
8.93% NTPC 2021 AAA 1.22
8.70% PFC 2020 AAA 0.60
Cash Bank & Others 11.87
Total 100.00
Other Equity 35.47
The fund would be predominantly invested in equity at inception, wherein the dynamic asset allocation mechanism allocates the portfolio between equity and
debt. This dynamic asset allocation is based on the performance of equity markets and movements in interest rates. The equity allocation may be reallocated to
debt if the equity markets or interest rates fall , to safeguard the guarantee.
Over time, the asset mix will predominantly shift to debt to protect the guarantee. This dynamic asset allocation process will drive the returns generated by the
Apex Return Lock-in Fund. The dynamic asset allocation shifts the allocation of the fund from an equity bias to a debt bias, overtime. This would mean that the
Guaranteed NAV would not mimic the highest level of the equity market ,over the period the guarantee is applicable. Any unexpected and sharp falls in equity
market and/ or interest rates, during the period the guarantee is applicable, may trigger the allocation to completely move towards debt, to protect the highest
NAV achieved prior to the fall. Overall, it is an ideal fund for an investor who wants to take advantage of high returns in a positive market scenario while safe-
guarding the investment during any downturn.
Asset Mix
Equity Upto 100% 70%
Debt * 0% - 100% 30%
Cash & Money Market ** up to 100% 8%
* Actual Asset Mix % includes Cash & Money Market** Cash & Money Market includes current assets
Instrument Asset Mix as per F&U
Actual Asset Mix
67.32%
20.81%
11.87%
Tata AIG Apex Plus Return Lock-in-Fund II
FundAssure, Investment Report, October 2011ULIF 052 01/07/10 RA2 110
Fund Performance
Last 6 Months 29-Apr-11 9.80 -5.12%
Last 1 Year 29-Oct-10 10.17 -8.56%
Since Inception 13-Sep-10 10.00 -6.24%
PERIOD DATE NAV NAV Change
Note : The investment income and prices may go down as well as up. “SinceInception” and returns above “1 Year” are calculated as per CAGR.
13.99%
8.70%
5.53%
5.44%
3.83%
3.61%
2.95%
2.85%
2.26%
2.03%
16.13%
20.81%
11.87%
0.00% 5.00% 10.00% 15.00% 20.00% 25.00%
Banks
IT - Software
Refineries
Automobile
Pharmaceuticals
Tobacco Products
Finance
Steel
Telecomm-Service
Capital Goods-Non
Electrical Equipment
Others
Corporate Bonds
Cash Bank & Others

Debt Funds Hybrid FundsEquity Funds
Asset AllocationSector Allocation
PortfolioFund Details
Equity
Corporate Bonds
Cash Bank & Others
Instrument Industry % of NAVInstrument Industry % of NAV
Investment Style
Value Blend Growth Size
Large
Mid
Small
Debt Investment Style
Credit Quality
High Mid LowInterest RateSensitivity
High
Mid
Low
Equity Investment Style
Investment Objective : The investment objective for Apex Pension Return Lock-in Fund – II is to use the participation in an actively managed well diversified equity portfolio of large cap companies to generate capital appreciation and use high credit quality debt instruments to lock-in that capital appreciation.
Fund Manager : Mr. Saravana Kumar
NAV as on 3 , 11 : `7.83
The Highest Nav recordedon reset date is : `10.51
Corpus as on 3 , 11 : `9.37 Crs.
1 Oct
1 Oct
Equity 64.44
Infosys Ltd IT - Software 5.51
Reliance Industries Ltd Refineries 5.04
HDFC Bank Banks 4.22
ITC Ltd Tobacco Products 4.22
ICICI Bank Ltd Banks 3.89
State Bank of India Banks 2.43
Larsen And Toubro Ltd Capital Goods-Non
Electrical Equipment 2.29
Tata Consultancy Services Ltd IT - Software 2.14
Mahindra And Mahindra Ltd Automobile 1.93
Bharti Airtel Ltd Telecomm-Service 1.88
Corporate Bonds 31.69
8.90% HDFC 2020 AAA 15.82
9.35% PGC 2016 AAA 6.23
8.70% PFC 2020 AAA 3.60
8.93% NTPC 2021 AAA 2.43
8.80% RECL 2020 AAA 2.41
8.72% SAIL 2020 AAA 1.20
Cash Bank & Others 3.86
Total 100.00
Other Equity 30.89
The fund would be predominantly invested in equity at inception, wherein the dynamic asset allocation mechanism allocates the portfolio between equity and
debt. This dynamic asset allocation is based on the performance of equity markets and movements in interest rates. The equity allocation may be reallocated to
debt if the equity markets or interest rates fall , to safeguard the guarantee.
Over time, the asset mix will predominantly shift to debt to protect the guarantee. This dynamic asset allocation process will drive the returns generated by the
Apex Return Lock-in Fund. The dynamic asset allocation shifts the allocation of the fund from an equity bias to a debt bias, overtime. This would mean that the
Guaranteed NAV would not mimic the highest level of the equity market ,over the period the guarantee is applicable. Any unexpected and sharp falls in equity
market and/ or interest rates, during the period the guarantee is applicable, may trigger the allocation to completely move towards debt, to protect the highest
NAV achieved prior to the fall. Overall, it is an ideal fund for an investor who wants to take advantage of high returns in a positive market scenario while safe-
guarding the investment during any downturn.
Asset Mix
Equity Upto 100% 69%
Debt * 0% - 100% 31%
Cash & Money Market ** up to 100% 8%
* Actual Asset Mix % includes Cash & Money Market** Cash & Money Market includes current assets
Instrument Asset Mix as per F&U
Actual Asset Mix
64.44%
31.69%
3.86%
Tata AIG Apex Pension Return Lock-in-Fund II SP
FundAssure, Investment Report, October 2011ULIF 048 01/07/10 PR5 110
Fund Performance
Last 6 Months 29-Apr-11 9.86 -4.99%
Last 1 Year 29-Oct-10 10.14 -7.54%
Since Inception 13-Sep-10 10.00 -5.57%
PERIOD DATE NAV NAV Change
Note : The investment income and prices may go down as well as up. “SinceInception” and returns above “1 Year” are calculated as per CAGR.
13.75%
9.11%
5.44%
4.90%
4.22%
3.21%
2.85%
2.45%
2.33%
2.29%
13.88%
31.69%
3.86%
0.00% 5.00% 10.00% 15.00% 20.00% 25.00% 30.00% 35.00%
Banks
IT - Software
Refineries
Automobile
Tobacco Products
Pharmaceuticals
Steel
FMCG
Finance
Capital Goods-Non Electrical Equipment
Others
Corporate Bonds
Cash Bank & Others

Asset AllocationSector Allocation
PortfolioFund Details
Equity
Corporate Bonds
Cash Bank & Others
Instrument Industry % of NAVInstrument Industry % of NAV
Investment Style
Value Blend Growth Size
Large
Mid
Small
Debt Investment Style
Credit Quality
High Mid LowInterest RateSensitivity
High
Mid
Low
Equity Investment Style
Investment Objective : The investment objective for Apex Pension 10 Return Lock-in Fund– II is to use the participation in an actively managed well diversified equity portfolio of large cap companies to generate capital appreciation and use high credit quality debt instruments to lock-in that capital appreciation.
Fund Manager : Mr. Saravana Kumar
NAV as on 3 , 11 : `9.41
The Highest Nav recordedon reset date is : `10.52
Corpus as on 3 , 11 : `12.38 Crs.
1 Oct
1 Oct
Equity 69.79
Infosys Ltd IT - Software 5.58
Reliance Industries Ltd Refineries 5.14
ITC Ltd Tobacco Products 4.30
HDFC Bank Banks 4.00
ICICI Bank Ltd Banks 3.99
State Bank Of India Banks 2.85
Tata Consultancy Services Ltd IT - Software 2.25
HDFC Ltd Finance 2.23
Bharti Airtel Ltd Telecomm-Service 2.21
Larsen And Toubro Ltd Capital Goods-Non
Electrical Equipment 2.17
Corporate Bonds 23.92
8.90% HDFC 2020 AAA 7.70
9.35% PGC 2016 AAA 6.31
8.80% RECL 2020 AAA 3.81
8.72% SAIL 2020 AAA 3.80
8.93% NTPC 2021 AAA 1.54
8.70% PFC 2020 AAA 0.76
Cash Bank & Others 6.29
Total 100.00
Other Equity 35.08
The fund would be predominantly invested in equity at inception, wherein the dynamic asset allocation mechanism allocates the portfolio between equity and
debt. This dynamic asset allocation is based on the performance of equity markets and movements in interest rates. The equity allocation may be reallocated to
debt if the equity markets or interest rates fall , to safeguard the guarantee.
Over time, the asset mix will predominantly shift to debt to protect the guarantee. This dynamic asset allocation process will drive the returns generated by the
Apex Return Lock-in Fund. The dynamic asset allocation shifts the allocation of the fund from an equity bias to a debt bias, overtime. This would mean that the
Guaranteed NAV would not mimic the highest level of the equity market ,over the period the guarantee is applicable. Any unexpected and sharp falls in equity
market and/ or interest rates, during the period the guarantee is applicable, may trigger the allocation to completely move towards debt, to protect the highest
NAV achieved prior to the fall. Overall, it is an ideal fund for an investor who wants to take advantage of high returns in a positive market scenario while safe-
guarding the investment during any downturn.
Debt Funds Hybrid FundsEquity Funds
Asset Mix
Equity Upto 100% 69%
Debt * 0% - 100% 31%
Cash & Money Market ** up to 100% 10%
* Actual Asset Mix % includes Cash & Money Market** Cash & Money Market includes current assets
Instrument Asset Mix as per F&U
Actual Asset Mix
23.92%
6.29%
Tata AIG Apex Pension Return Lock-in-Fund II (10 Year term)
FundAssure, Investment Report, October 2011ULIF 049 01/07/10 PR6 110
Fund Performance
Last 6 Months 29-Apr-11 9.80 -3.99%
Last 1 Year 29-Oct-10 10.15 -7.33%
Since Inception 13-Sep-10 10.00 -5.23%
PERIOD DATE NAV NAV Change
Note : The investment income and prices may go down as well as up. “SinceInception” and returns above “1 Year” are calculated as per CAGR.
66.79%14.91%
9.27%
5.71%
5.54%
4.30%
3.73%
3.52%
3.14%
2.23%
2.21%
15.22%
23.92%
6.29%
0.00% 5.00% 10.00% 15.00% 20.00% 25.00% 30.00%
Banks
IT - Software
Automobile
Refineries
Tobacco Products
Pharmaceuticals
Finance
Steel
Power Generation & Distribution
Telecomm-Service
Others
Corporate Bonds
Cash Bank & Others

Debt Funds Hybrid FundsEquity Funds
Asset AllocationSector Allocation
PortfolioFund Details
Equity
Government Securities
Cash Bank & Others
Instrument Industry % of NAVInstrument Industry % of NAV
Investment Style
Value Blend Growth Size
Large
Mid
Small
Debt Investment Style
Credit Quality
High Mid LowInterest RateSensitivity
High
Mid
Low
Equity Investment Style
Investment Objective : The investment objective for Apex Pension 15 Return Lock-in Fund– II is to use the participation in an actively managed well diversified equity portfolio of large cap companies to generate capital appreciation and use high credit quality debt instruments to lock-in that capital appreciation.
Fund Manager : Mr. Saravana Kumar
NAV as on 3 , 11 : `9.46
The Highest Nav recordedon reset date is : `10.51
Corpus as on 3 , 11 : `1.66 Crs.
1 Oct
1 Oct
Equity 75.27
Infosys Ltd IT - Software 5.38
Reliance Industries Ltd Refineries 5.29
ICICI Bank Ltd Banks 4.49
HDFC Bank Banks 4.43
ITC Ltd Tobacco Products 3.86
Tata Consultancy Services Ltd IT - Software 3.03
State Bank of India Banks 2.87
Bharti Airtel Ltd Telecomm-Service 2.36
Larsen And Toubro Ltd Capital Goods-Non
Electrical Equipment 2.13
Mahindra And Mahindra Ltd Automobile 2.09
Other Equity 39.34
Government Securities 23.30
6.90% GOI 2026 Sovereign 15.02
7.95% GOI 2025 Sovereign 8.27
Cash Bank & Others 1.43
Total 100.00
The fund would be predominantly invested in equity at inception, wherein the dynamic asset allocation mechanism allocates the portfolio between equity and
debt. This dynamic asset allocation is based on the performance of equity markets and movements in interest rates. The equity allocation may be reallocated to
debt if the equity markets or interest rates fall , to safeguard the guarantee.
Over time, the asset mix will predominantly shift to debt to protect the guarantee. This dynamic asset allocation process will drive the returns generated by the
Apex Return Lock-in Fund. The dynamic asset allocation shifts the allocation of the fund from an equity bias to a debt bias, overtime. This would mean that the
Guaranteed NAV would not mimic the highest level of the equity market ,over the period the guarantee is applicable. Any unexpected and sharp falls in equity
market and/ or interest rates, during the period the guarantee is applicable, may trigger the allocation to completely move towards debt, to protect the highest
NAV achieved prior to the fall. Overall, it is an ideal fund for an investor who wants to take advantage of high returns in a positive market scenario while safe-
guarding the investment during any downturn.
23.30%
75.27%
Asset Mix
Equity Upto 100% 73%
Debt * 0% - 100% 27%
Cash & Money Market ** up to 100% 6%
* Actual Asset Mix % includes Cash & Money Market** Cash & Money Market includes current assets
Instrument Asset Mix as per F&U
Actual Asset Mix
Tata AIG Apex Pension Return Lock-in-Fund II (15 Year term)
FundAssure, Investment Report, October 2011ULIF 050 01/07/10 PR7 110
1.43%
Fund Performance
Last 6 Months 29-Apr-11 9.84 -3.83%
Last 1 Year 29-Oct-10 10.14 -6.68%
Since Inception 13-Sep-10 10.00 -4.74%
PERIOD DATE NAV NAV Change
Note : The investment income and prices may go down as well as up. “SinceInception” and returns above “1 Year” are calculated as per CAGR.
16.18%
10.28%
5.74%
5.47%
4.22%
3.86%
3.68%
2.89%
2.73%
2.69%
17.53%
23.30%
1.43%
0.00% 5.00% 10.00% 15.00% 20.00% 25.00%
Banks
IT - Software
Refineries
Automobile
Pharmaceuticals
Tobacco Products
Finance
Steel
FMCG
Power Generation & Distribution
Others
Government Securities
Cash Bank & Others
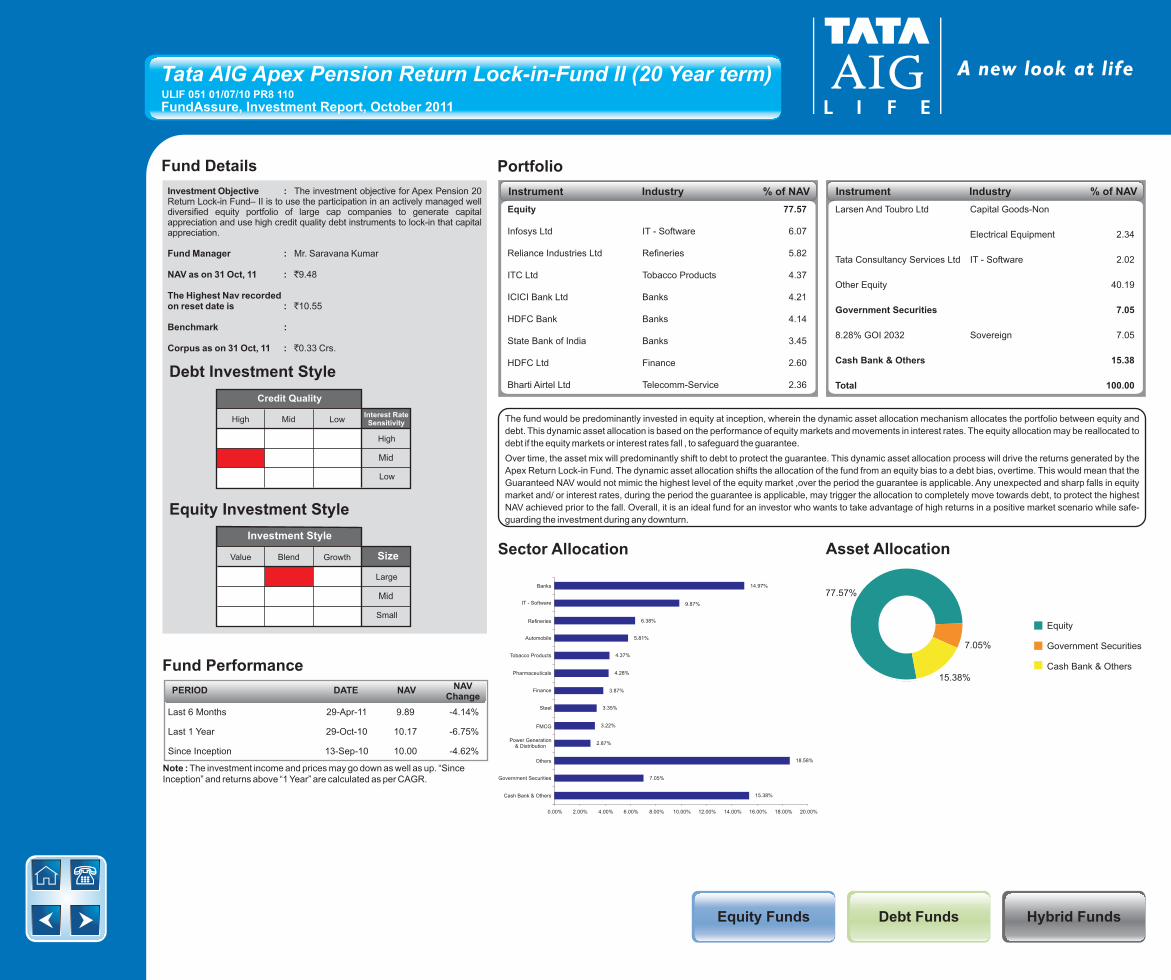
Debt Funds Hybrid FundsEquity Funds
Asset AllocationSector Allocation
PortfolioFund Details
Equity
Government Securities
Cash Bank & Others
Instrument Industry % of NAVInstrument Industry % of NAV
Investment Style
Value Blend Growth Size
Large
Mid
Small
Debt Investment Style
Credit Quality
High Mid LowInterest RateSensitivity
High
Mid
Low
Equity Investment Style
Investment Objective : The investment objective for Apex Pension 20 Return Lock-in Fund– II is to use the participation in an actively managed well diversified equity portfolio of large cap companies to generate capital appreciation and use high credit quality debt instruments to lock-in that capital appreciation.
Fund Manager : Mr. Saravana Kumar
NAV as on 3 , 11 : `9.48
The Highest Nav recordedon reset date is : `10.55
Benchmark :
Corpus as on 3 , 11 : `0.33 Crs.
1 Oct
1 Oct
Equity 77.57
Infosys Ltd IT - Software 6.07
Reliance Industries Ltd Refineries 5.82
ITC Ltd Tobacco Products 4.37
ICICI Bank Ltd Banks 4.21
HDFC Bank Banks 4.14
State Bank of India Banks 3.45
HDFC Ltd Finance 2.60
Bharti Airtel Ltd Telecomm-Service 2.36
Larsen And Toubro Ltd Capital Goods-Non
Electrical Equipment 2.34
Tata Consultancy Services Ltd IT - Software 2.02
Other Equity 40.19
Government Securities 7.05
8.28% GOI 2032 Sovereign 7.05
Cash Bank & Others 15.38
Total 100.00
The fund would be predominantly invested in equity at inception, wherein the dynamic asset allocation mechanism allocates the portfolio between equity and
debt. This dynamic asset allocation is based on the performance of equity markets and movements in interest rates. The equity allocation may be reallocated to
debt if the equity markets or interest rates fall , to safeguard the guarantee.
Over time, the asset mix will predominantly shift to debt to protect the guarantee. This dynamic asset allocation process will drive the returns generated by the
Apex Return Lock-in Fund. The dynamic asset allocation shifts the allocation of the fund from an equity bias to a debt bias, overtime. This would mean that the
Guaranteed NAV would not mimic the highest level of the equity market ,over the period the guarantee is applicable. Any unexpected and sharp falls in equity
market and/ or interest rates, during the period the guarantee is applicable, may trigger the allocation to completely move towards debt, to protect the highest
NAV achieved prior to the fall. Overall, it is an ideal fund for an investor who wants to take advantage of high returns in a positive market scenario while safe-
guarding the investment during any downturn.
Asset Mix
Equity Upto 100% 76%
Debt * 0% - 100% 24%
Cash & Money Market ** up to 100% 14%
* Actual Asset Mix % includes Cash & Money Market** Cash & Money Market includes current assets
Instrument Asset Mix as per F&U
Actual Asset Mix
15.38%
7.05%
77.57%
Tata AIG Apex Pension Return Lock-in-Fund II (20 Year term)
FundAssure, Investment Report, October 2011ULIF 051 01/07/10 PR8 110
Fund Performance
Last 6 Months 29-Apr-11 9.89 -4.14%
Last 1 Year 29-Oct-10 10.17 -6.75%
Since Inception 13-Sep-10 10.00 -4.62%
PERIOD DATE NAV NAV Change
Note : The investment income and prices may go down as well as up. “SinceInception” and returns above “1 Year” are calculated as per CAGR.
14.97%
9.87%
6.38%
5.81%
4.37%
4.28%
3.87%
3.35%
3.22%
2.87%
18.58%
7.05%
15.38%
0.00% 2.00% 4.00% 6.00% 8.00% 10.00% 12.00% 14.00% 16.00% 18.00% 20.00%
Banks
IT - Software
Refineries
Automobile
Tobacco Products
Pharmaceuticals
Finance
Steel
FMCG
Power Generation & Distribution
Others
Government Securities
Cash Bank & Others

Debt Funds Hybrid FundsEquity Funds
Asset AllocationSector Allocation
PortfolioFund Details
Equity
Corporate Bond
Cash Bank & Others
Instrument Industry % of NAVInstrument Industry % of NAV
Investment Style
Value Blend Growth Size
Large
Mid
Small
Debt Investment Style
Credit Quality
High Mid LowInterest RateSensitivity
High
Mid
Low
Equity Investment Style
Investment Objective : To use the participation in an actively managed well diversified equity portfolio of large cap companies to generate capital appreciation and use high credit quality debt instruments to lock-in that capital appreciation. The risk profile of the fund is medium. The initial asset allocation in equities is targeted at 70% to 100%.
Fund Manager : Mr. Saravana Kumar
NAV as on 3 , 11 : `9.65
Benchmark :
Corpus as on 3 , 11 : `17.58 Crs.
1 Oct
1 Oct
Equity 77.44
Infosys Ltd IT - Software 6.55
Reliance Industries Ltd Refineries 6.46
ITC Ltd Tobacco Products 4.85
ICICI Bank Ltd Banks 4.77
HDFC Bank Banks 4.67
Tata Consultancy Services Ltd IT - Software 3.17
State Bank of India Banks 2.71
Larsen And Toubro Ltd Capital Goods-Non
Electrical Equipment 2.61
Mahindra And Mahindra Ltd Automobile 2.46
Bharti Airtel Ltd Telecomm-Service 2.45
Other Equity 36.73
Corporate Bonds 18.27
9.48% RECL 2021 AAA 8.38
9.64% PGC 2020 AAA 5.65
9.64% PGC Ltd 2019 AAA 4.24
Cash Bank & Others 4.29
Total 100.00
The fund would be predominantly invested in equity at inception, wherein the dynamic asset allocation mechanism allocates the portfolio between equity and
debt. This dynamic asset allocation is based on the performance of equity markets and movements in interest rates. The equity allocation may be reallocated to
debt if the equity markets or interest rates fall , to safeguard the guarantee.
Over time, the asset mix will predominantly shift to debt to protect the guarantee. This dynamic asset allocation process will drive the returns generated by the
Apex Return Lock-in Fund. The dynamic asset allocation shifts the allocation of the fund from an equity bias to a debt bias, overtime. This would mean that the
Guaranteed NAV would not mimic the highest level of the equity market ,over the period the guarantee is applicable. Any unexpected and sharp falls in equity
market and/ or interest rates, during the period the guarantee is applicable, may trigger the allocation to completely move towards debt, to protect the highest
NAV achieved prior to the fall. Overall, it is an ideal fund for an investor who wants to take advantage of high returns in a positive market scenario while safe-
guarding the investment during any downturn.
Asset Mix
Equity Upto 100% 76%
Debt * 0% - 100% 24%
Cash & Money Market ** up to 100% 14%
* Actual Asset Mix % includes Cash & Money Market** Cash & Money Market includes current assets
Instrument Asset Mix as per F&U
Actual Asset Mix
18.27%
77.44%
4.29%
Apex Supreme Return Lock-in Fund
FundAssure, Investment Report, October 2011ULIF 055 01/02/11 ASR 110
15.37%
10.90%
8.00%
6.82%
4.85%
4.32%
3.23%
2.81%
2.61%
2.52%
16.01%
18.27%
4.29%
0.00% 2.00% 4.00% 6.00% 8.00% 10.00% 12.00% 14.00% 16.00% 18.00% 20.00%
Banks
IT - Software
Automobile
Refineries
Tobacco Products
Pharmaceuticals
Steel
Finance
Capital Goods-Non
Electrical Equipment
Capital Goods - Electrical Equipment
Others
Corporate Bonds
Cash Bank & Others

Debt Funds Hybrid FundsEquity Funds
Asset AllocationSector Allocation
PortfolioFund Details
Equity
Corporate Bond
Cash Bank & Others
Investment Style
Value Blend Growth Size
Large
Mid
Small
Debt Investment Style
Credit Quality
High Mid LowInterest RateSensitivity
High
Mid
Low
Equity Investment Style
Investment Objective : To use the participation in an actively managed well diversified equity portfolio of large cap companies to generate capital appreciation and use high credit quality debt instruments to lock-in that capital
Fund Manager : Mr. Saravana Kumar
NAV as on 3 , 11 : `10.46
Benchmark :
Corpus as on 3 , 11 : `10.99 Crs.
1 Oct
1 Oct
The fund would be predominantly invested in equity at inception, wherein the dynamic asset allocation mechanism allocates the portfolio between equity and
debt. This dynamic asset allocation is based on the performance of equity markets and movements in interest rates. The equity allocation may be reallocated to
debt if the equity markets or interest rates fall , to safeguard the guarantee.
Over time, the asset mix will predominantly shift to debt to protect the guarantee. This dynamic asset allocation process will drive the returns generated by the
Apex Return Lock-in Fund. The dynamic asset allocation shifts the allocation of the fund from an equity bias to a debt bias, overtime. This would mean that the
Guaranteed NAV would not mimic the highest level of the equity market ,over the period the guarantee is applicable. Any unexpected and sharp falls in equity
market and/ or interest rates, during the period the guarantee is applicable, may trigger the allocation to completely move towards debt, to protect the highest
NAV achieved prior to the fall. Overall, it is an ideal fund for an investor who wants to take advantage of high returns in a positive market scenario while safe-
guarding the investment during any downturn.
Asset Mix
Equity Upto 100% 76%
Debt * 0% - 100% 24%
Cash & Money Market ** up to 100% 14%
* Actual Asset Mix % includes Cash & Money Market** Cash & Money Market includes current assets
Instrument Asset Mix as per F&U
Actual Asset Mix
15.10%
84.90%
Apex Supreme Return Lock-in Fund II
FundAssure, Investment Report, October 2011
Other Equity27.62
Instrument Industry % of NAVInstrument Industry % of NAV
Equity 84.90
Infosys Ltd IT - Software 7.07
Reliance Industries Ltd Refineries 6.71
ITC Ltd Tobacco Products 5.43
ICICI Bank Ltd Banks 5.30
HDFC Bank Banks 5.13
Bharti Airtel Ltd Telecomm-Service 3.42
State Bank of India Banks 3.38
Larsen And Toubro Ltd Capital Goods-Non
Electrical Equipment 2.77
Mahindra And Mahindra Ltd Automobile 2.76
Tata Motors Ltd Automobile 2.71
Cash Bank & Others 15.10
Total 100.00
Other Equity 40.22
18.01%
9.62%
9.25%
7.08%
5.43%
4.80%
3.99%
3.42%
2.77%
2.77%
17.76%
15.10%
0.00% 2.00% 4.00% 6.00% 8.00% 10.00% 12.00% 14.00% 16.00% 18.00% 20.00%
Banks
IT - Software
Automobile
Refineries
Tobacco Products
Pharmaceuticals
Steel
Telecomm-Service
Capital Goods - Electrical Equipment
Capital Goods-Non Electrical Equipment
Others
Cash Bank & Others
ULIF 057 01/07/11 SR2 110

Debt Funds Hybrid FundsEquity Funds
Balanced Fund
Note : The investment income and prices may go down as well as up. “Since Inception” and returns above “1 Year” are calculated as per CAGR.
Last 6 Months 29-Apr-11 20.88 -3.41%
Last 1 Year 29-Oct-10 21.29 -5.24%
Last 2 Years 30-Oct-09 18.63 4.06%
Last 3 Years 31-Oct-08 14.46 11.73%
Last 4 Years 31-Oct-07 20.74 -0.69%
Last 5 Years 31-Oct-06 15.06 6.01%
Since Inception 2-Mar-04 10.00 9.58%
PERIOD DATE NAV NAV Change
Tax Benefit
Premiums paid under this plan are eligible for tax benefits under Section 80C of the Income Tax Act, 1961. Also any sum
received under this plan is exempt from tax under Section 10(10D) of the Income Tax Act, 1961 and are subject to
amendments made therein from time to time.
Nav as on 31 Oct, 11 : 20.17`
Fund Performance
Growth Fund
Note : The investment income and prices may go down as well as up. “Since Inception” and returns above “1 Year” are calculated as per CAGR.
Last 6 Months 29-Apr-11 25.62 -6.29%
Last 1 Year 29-Oct-10 26.65 -9.91%
Last 2 Years 30-Oct-09 22.43 3.47%
Last 3 Years 31-Oct-08 16.16 14.09%
Last 4 Years 31-Oct-07 27.85 -3.64%
Last 5 Years 31-Oct-06 18.27 5.62%
Since Inception 2-Mar-04 10.00 12.10%
PERIOD DATE NAV NAV Change
Nav as on : 24.0131 Oct, 11 `
FundAssure, Investment Report, October 2011

Debt Funds Hybrid FundsEquity Funds
Whole Life Mid Cap Equity
Top 50 Top 200 Aggressive Flexi
Stable Flexi
Bond Large Cap
Equity
Infrastructure Fund
Whole Life
Income
Whole Life Short-Term Fixed
Income
Whole Life Aggressive
Growth
Whole Life Stable Growth
Super Select Equity
Future Equity
Pension
Future Income Pension
Future Growth Pension
Future Balanced Pension
Super Select Equity
Pension
Super 110%
Capital Guarantee
Apex Plus
InvestmentFund Names
Tata AIG Life Invest Assure II +
Tata AIG Life Invest Assure Plus Advantage
Tata AIG Life Invest Assure Gold +
Tata AIG Life Invest Assure Future Plus
Tata AIG Life Invest Assure Flexi Plus
Tata AIG Life Invest Assure Optima Plus
Tata AIG Life UnitedcUjjwal Bhawishya Plus
Tata AIG Life Invest Assure Insta +
Tata AIG Life Invest Assure Apex Plus
Tata AIG Life Invest Assure Swarna Jeevan Plus
Tata AIG Life Lakshya Plus
Tata AIG Life Invest Assure Sampatti
Tata AIG Life Invest Assure Superstar
Tata AIG Life Invest Assure Health Plus
Tata AIG Life Apex Pension SP/10/15/20
Tata AIG Life Invest Assure Flexi
Tata AIG Life Invest Assure
Tata AIG Life Invest Assure Plus
Tata AIG Life Invest Assure II
Tata AIG Life Invest Assure Gold
Tata AIG Life Invest Assure Extra
Tata AIG Life Invest Assure Future
Tata AIG Life Invest Assure Care
Tata AIG Life Invest Assure Health
Tata AIG Invest Assure Optima
Tata AIG Life United Ujjwal Bhavishya
Tata AIG Life Invest Assure Insta
Tata AIG Life Invest Assure Swarna Jeevan
Tata AIG Life Invest Assure Apex
Tata AIG Life Jeevan Lakshya
Tata AIG Life Invest Assure Flexi Supreme
Tata AIG Life Lakshya Supreme
Tata AIG Life Invest Assure Plus Supreme
Tata AIG Life United Ujjwal Bhwaishya Supreme
Tata AIG Life Invest Assure Apex Supreme
Product & Fund MatrixFundAssure, Investment Report, October 2011

Debt Funds Hybrid FundsEquity Funds
Stable Growth
Apex Plus Return
Lock-in
Apex Pension
Investment 10/15/20
Apex Pension Return Lock-in 10/15/20
Equity Income Short Term Fixed
Income
Select Equity Fund
Capital Guarantee
Fund
Apex Investment
Apex Return Lock-in
Apex Supreme
Investment
Apex Supreme Return Lock-in
110% Capital
Guarantee Fund
Growth Maximizer
Fund
Growth Enabler
Fund
Future Capital
Guarantee Pension
Fund
Future Select Equity Fund
Fund NamesAggressive
Growth
Tata AIG Life Invest Assure II +
Tata AIG Life Invest Assure Plus Advantage
Tata AIG Life Invest Assure Gold +
Tata AIG Life Invest Assure Future Plus
Tata AIG Life Invest Assure Flexi Plus
Tata AIG Life Invest Assure Optima Plus
Tata AIG Life UnitedcUjjwal Bhawishya Plus
Tata AIG Life Invest Assure Insta +
Tata AIG Life Invest Assure Apex Plus
Tata AIG Life Invest Assure Swarna Jeevan Plus
Tata AIG Life Lakshya Plus
Tata AIG Life Invest Assure Sampatti
Tata AIG Life Invest Assure Superstar
Tata AIG Life Invest Assure Health Plus
Tata AIG Life Apex Pension SP/10/15/20
Tata AIG Life Invest Assure Flexi
Tata AIG Life Invest Assure
Tata AIG Life Invest Assure Plus
Tata AIG Life Invest Assure II
Tata AIG Life Invest Assure Gold
Tata AIG Life Invest Assure Extra
Tata AIG Life Invest Assure Future
Tata AIG Life Invest Assure Care
Tata AIG Life Invest Assure Health
Tata AIG Invest Assure Optima
Tata AIG Life United Ujjwal Bhavishya
Tata AIG Life Invest Assure Insta
Tata AIG Life Invest Assure Swarna Jeevan
Tata AIG Life Invest Assure Apex
Tata AIG Life Jeevan Lakshya
Tata AIG Life Invest Assure Flexi Supreme
Tata AIG Life Lakshya Supreme
Tata AIG Life Invest Assure Plus Supreme
Tata AIG Life United Ujjwal Bhwaishya Supreme
Tata AIG Life Invest Assure Apex Supreme
Product & Fund MatrixFundAssure, Investment Report, October 2011
Debt Funds
Unique Reference Number: L&C/Others/2011/Nov/044
Disclaimer
1. The fund is managed by Tata AIG Life Insurance Company Ltd. (hereinafter the "Company").
2. Past performance is not indicative of future performance. Returns are calculated on an absolute basis for a period of less than (or equal to) a year, with reinvestment of dividends (if any).
3. All investments made by the Company are subject to market risks. The Company does not guarantee any assured returns. The investment income and price may go down as
well as up depending on several factors influencing the market.
4. Every effort is made to ensure that all information contained in this publication is accurate at the date of publication, but no responsibility or liability in respect of any error or
omission is accepted by the Company.
5. Tax benefits are as per the Income Tax Act, 1961 and are subject to amendments made therein from time to time.
6. Please know the associated risks and the applicable charges from your Insurance agent or the intermediary or policy document of the Insurer.
7. Various funds offered under this contract are the names of funds and do not, in any way, indicate the quality of the plans, their future prospects & returns.
8. Premium paid in ULIPs are subject to Investment risks associated with capital markets & the NAV of the units may go up or down based on the performance of the fund and
factors influencing capital markets & the insured is responsible for his/her decision.
9. ULIP products are different from traditional Life Insurance products and are subject to risk factors.
10. Interest Rate Sensitivity Less than 3 year duration - Low 3 to10 years duration - Medium more than 10 years duration - High
11. Shading indicates the general representative nature of the portfolio to a particular style or cap".
12. Whilst every care has been taken in the preparation of this document, it is subject to correction and markets may not perform in a similar fashion based on factors influencing the
capital and debt markets; hence this review note does not individually confer any legal rights or duties.
Insurance is the subject matter of the solicitation
Registered and Corporate OfficeDelphi-B Wing, 2nd Floor, Orchard AvenueHiranandani Business Park, Powai, Mumbai - 400076
Tata AIG Life Insurance Company Ltd. (Reg. No. 110)
For any enquiries Call our 24-hour Helpline no's1-860-266-99661-800-119-966
Just SMS 'SERVICE' to 58888 or to get the summary of all short codes within 2 minutes, please send HELP to 5676799
Write to UsCustomer Services TeamTata AIG Life Peninsula Tower, 6th Floor,Peninsula Corporate Park, Ganpatrao Kadam Marg,Lower Parel, Mumbai 400 013.
Choose a convenient contact option from the following:
Hybrid FundsEquity Funds
Contact Us