fundamentals of reservoir surface energy as related to ... library/research/oil-gas/enhanced...
TRANSCRIPT

Fundamentals of reservoir surface energy as related to surface properties, wettability, capillary action, and oil
recovery from fractured reservoirs by spontaneous imbibition
DE-FC26-03NT15408
Semi-Annual Report 01/01/2007 – 06/30/2007
Norman R. Morrow, Principal Investigator
Yu Li Geoffrey Mason Douglas Ruth Evren Unsal
Siluni Wickramathilaka Shaochang Wo
Peigui Yin
August 2007
Submitted by: Chemical & Petroleum Engineering
University of Wyoming Dept. 3295, 1000 E. University Ave
Laramie, WY 82071

DE-FC26-03NT15408 Semi-Annual Report 01/01/2007 – 06/30/2007
2
Disclaimer
This report was prepared as an account of work sponsored by an agency of the United States Government. Neither the United States Government nor any agency thereof, nor any of their employees, makes any warranty, express or implied, or assumes any legal liability or responsibility for the accuracy, completeness, or usefulness of any information, apparatus, product, or process disclosed, or represents that its use would not infringe privately owned rights. Reference herein to any specific commercial product, process, or service by trade name, trademark, manufacturer, or otherwise does not necessarily constitute or imply its endorsement, recommendation, or favoring by the United States Government or any agency thereof. The views and opinions of authors expressed herein do not necessarily state or reflect those of the United States Government or any agency thereof.

DE-FC26-03NT15408 Semi-Annual Report 01/01/2007 – 06/30/2007
3
ABSTRACT The objective of this project is to increase oil recovery from fractured reservoirs through improved fundamental understanding of the process of spontaneous imbibition by which oil is displaced from the rock matrix into the fractures. Spontaneous imbibition is fundamentally dependent on the reservoir surface free energy but this has never been investigated for rocks. In this project, the surface free energy of rocks will be determined by using liquids that can be solidified within the rock pore space at selected saturations. Thin sections of the rock then provide a two-dimensional view of the rock minerals and the occupant phases. Saturations and oil/rock, water/rock, and oil/water surface areas will be determined by advanced petrographic analysis and the surface free energy which drives spontaneous imbibition will be determined as a function of increase in wetting phase saturation. The inherent loss in surface free energy resulting from capillary instabilities at the microscopic (pore level) scale will be distinguished from the decrease in surface free energy that drives spontaneous imbibition. A mathematical network/numerical model will be developed and tested against experimental results of recovery versus time over broad variation of key factors such as rock properties, fluid phase viscosities, sample size, shape and boundary conditions. Two fundamentally important, but not previously considered, parameters of spontaneous imbibition, the capillary pressure acting to oppose production of oil at the outflow face and the pressure in the non-wetting phase at the no-flow boundary versus time, will also be measured and modeled. Simulation and network models will also be tested against special case solutions provided by analytic models. In the second stage of the project, application of the fundamental concepts developed in the first stage of the project will be demonstrated. The fundamental ideas, measurements, and analytic/numerical modeling will be applied to mixed-wet rocks. Imbibition measurements will include novel sensitive pressure measurements designed to elucidate the basic mechanisms that determine induction time and drive the very slow rate of spontaneous imbibition commonly observed for mixed-wet rocks. In further demonstration of concepts, three approaches to improved oil recovery from fractured reservoirs will be tested; use of surfactants to promote imbibition in oil wet rocks by wettability alteration: manipulation of injection brine composition: reduction of the capillary back pressure which opposes production of oil at the fracture face.

DE-FC26-03NT15408 Semi-Annual Report 01/01/2007 – 06/30/2007
4
TABLE OF CONTENTS
INTRODUCTION .......................................................................................................................... 5
Objectives.................................................................................................................................... 5 Tasks............................................................................................................................................ 5
EXECUTIVE SUMMARY ............................................................................................................ 7 PROGRESS BY TASK - Budget Period 2 ..................................................................................... 7
Task 6. Rock preparation and Work of displacement and surface areas ................................... 7 Task 6 Introduction.................................................................................................................. 7 Task 6 Experimental................................................................................................................ 7 Task 6 Summary.................................................................................................................... 13
Task 7. Novel imbibition measurements on mixed-wet rock and network models.................... 13 Task 7 Discussion.................................................................................................................. 13
Task 8. Application of network/numerical model to mixed wet rocks. ..................................... 13 Task 8 Introduction................................................................................................................ 14 Task 8 Theoretical ................................................................................................................. 16 Task 8 Experimental.............................................................................................................. 20 Task 8 Results........................................................................................................................ 21 References ............................................................................................................................. 34
Task 9. Increased oil recovery by spontaneous imbibition. ...................................................... 35 Task 9 Discussion.................................................................................................................. 35
CONCLUSIONS........................................................................................................................... 35

DE-FC26-03NT15408 Semi-Annual Report 01/01/2007 – 06/30/2007
5
INTRODUCTION
Objectives The long-range objective of this project is to improve oil recovery from fractured reservoirs through improved fundamental understanding of the process of spontaneous imbibition by which oil is displaced from the rock matrix into the fractures. Spontaneous imbibition is fundamentally dependent on the surface energy. An initial objective is to determine the surface energy and relate the dissipation of surface energy to the mechanism of spontaneous imbibition. A parallel objective is to model the mechanism of spontaneous imbibition by a combination of network analysis and numerical modeling. Also fundamentally important, but not previously considered, parameters of spontaneous imbibition, the capillary pressure acting to oppose production of oil at the outflow face and the pressure in the non-wetting phase at the no-flow boundary (in effect within oil in the non-invaded zone of the rock matrix) versus time, will also be measured and compared with values predicted by the mathematical model. The next objective is to measure surface energy and related spontaneous imbibition phenomena for mixed-wettability rocks prepared by adsorption from crude oil. The dissipation of surface free energy must then be related to oil production at mixed-wet conditions. The final objective is to apply the results of the project to improved oil recovery from fractured reservoirs in three ways: reduction of the capillary force that opposes oil production at the fracture face; change in wettability towards increased water wetness; identification of conditions where choice of invading brine composition can give improved recovery.
TASKS
Budget period 1, July 1, 2003 through June 30, 2005 – Ideas and Concept development: Fundamentals of Spontaneous Imbibition
Task 1. Work of displacement and surface free energy. Obtain complementary sets of capillary pressure drainage and imbibition data and data on changes in rock/brine, rock/oil, and oil/brine interfacial areas with change in saturation for drainage and imbibition for at least two rock types (sandstone and carbonate). Determine free-energy/work-of-displacement efficiency parameters for drainage and imbibition for at least two rock types so that changes in rock/wetting phase/non-wetting phase surface areas can be closely estimated from capillary pressure measurements.
Task 2. Imbibition in simple laboratory and mathematical network models. Study imbibition in at least three simple tube networks that can be modeled analytically to establish and/or confirm fundamental aspects of the pore scale mechanism of dynamic spontaneous imbibition with special emphasis on determining how spontaneous imbibition is initiated and the key factors in how the saturation profile develops with time. Incorporate rules developed from laboratory measurements on relatively simple networks into the design of a computational network model. Use the network model to obtain an account of the mechanism by which imbibition is initiated, the saturation profile is developed, and the rate of spontaneous imbibition in terms of the dissipation of surface free energy that accompanies change in saturation.

DE-FC26-03NT15408 Semi-Annual Report 01/01/2007 – 06/30/2007
6
Task 3. Novel observations on fluid pressures during imbibition and the mechanism of non-wetting phase production at the imbibition face. Make novel observations on the imbibition mechanism including details of the mechanism of oil production at the outflow rock face and the change in the non-wetting phase pressure at the no-flow boundary of the core during the course of spontaneous imbibition for at least 16 distinct combinations of rock/ fluid properties.
Task 4. Network/numerical model and new imbibition data. Develop a numerical simulator specifically designed for spontaneous imbibition. Incorporate the network model to obtain a network/numerical model that includes matching the measured pressure in the non-wetting phase at the no-flow boundary, and the pressure that opposes production of oil at the open rock face. Imbibition data will be obtained for at least 10 rocks with over six-fold variation in permeability, and at least 6 orders of magnitude variation in viscosity ratio, and at least 10 variations in sample size, shape, and boundary conditions.
Task 5. Comparison with similarity solutions. Compare results given by simulation with special case analytic results given by similarity solutions for spontaneous imbibition for at least five distinct cases of rock and fluid properties. Budget Period 2, July 1, 2005 through June 30, 2008 - Demonstration of concept: Application to mixed wettability rocks and improved oil recovery from fractures reservoirs.
Task 6. Rock preparation and Work of displacement and surface areas Obtain a range of rock types and identify and obtain crude oils that induce stable mixed wettability. Prepare at least 25 rocks with mixed wettability through crude oil/brine/rock interactions. Determine work of displacement for drainage and imbibition and measure the variation in rock/brine, rock/oil, and oil/brine interfacial areas during the course of drainage and imbibition for at least two examples of mixed wettability.
Task 7. Novel imbibition measurements on mixed-wet rock and network models. Obtain, for at least six mixed-wet rocks, spontaneous imbibition data that includes measurements of the non-wetting phase pressure at the no-flow boundary, observations on the capillary pressure that resists production at the open rock face.
Task 8. Application of network/numerical model to mixed wet rocks. Use network models to relate dissipation of surface energy to rate of spontaneous imbibition and to account for the frequently observed induction time prior to the onset of spontaneous imbibition into mixed wettability rocks.
Task 9. Increased oil recovery by spontaneous imbibition. The mechanism of increased recovery from mixed wet rocks by use of surfactants that promote spontaneous imbibition by favorable wettability alteration will be investigated for at least four distinct examples of crude oil/brine/rock/surfactant combinations. The mechanism of increased recovery by manipulation of brine composition will be investigated for at least four crude oil/brine/rock combinations. Addition of very low concentration surfactants to the imbibing aqueous phase will be explored as a means of increasing the rate of oil recovery by reducing the capillary forces which resist

DE-FC26-03NT15408 Semi-Annual Report 01/01/2007 – 06/30/2007
7
production of oil at the fracture face. At least twelve combinations of rock and fluid properties including both very strongly wetted and mixed wet rocks will be tested.
EXECUTIVE SUMMARY
Spontaneous imbibition is of special importance to oil recovery from fractured reservoirs. Investigation of the surface energy forces which drive imbibition for mixed wet systems is now focused on the acting capillary pressures. The first reported measurements of the end pressures for mixed-wettability given by the tested crude oil/brine/rock combination show them to be about an order of magnitude lower than for very strongly water wet rocks. Measurements of distance of invasion versus volume imbibed for the mixed-wet rock shows that the invading brine advances as a front. The amount of brine imbibed is proportional to the distance advanced and the rate of advance is inversely proportional to the distance of advance. Analysis of the effect of sample shape on imbibition showed the optimum design for accuracy of investigation is radial flow into a core with a hole in its center. A new design of imbibition cell for this core shape that allows for end pressure measurement at the core center has been constructed and is currently being tested. Studies of imbibition into laboratory models that can be tested against analysis have been extended to parallel non-circular capillaries with cross flow. Cells that allow change in wetting through choice of fluid pairs are under construction. Testing of improved recovery by imbibition by reservoir cores which have been shown to respond to change in salinity by waterflooding is now in progress.
PROGRESS BY TASK - BUDGET PERIOD 2
Task 6. Rock preparation and work of displacement and surface areas
Task 6 Introduction The approach used in investigation of MXW cores is to obtain the end pressure, Pend for one-face-open cores during COUCSI and obtain the values of Pcf and Pcb separately from the measured Pend for cores with and without a low permeability core segment at the open end of the core. In the previous semi-annual report results for restricted imbibition were presented for very strongly water wet (VSWW), weakly water wet (WWW) given by aging a core 100% saturated with Cottonwood crude oil, and mixed wet, (MXW) given by aging with Cottonwood crude after establishing an initial water saturation. Results have been obtained under comparable conditions for unrestricted COUCSI.
Task 6 Experimental Data sets have been obtained for Berea sandstone. The cores were high permeability Berea sandstone (D=3.2 to3. 8 cm, L= 3.9 cm to 6.9cm, φ=21.6 % to22.6%, K=0.86 μm2 to1.094 μm2). Cottonwood crude oil was selected as a wettability alteration agent because it has been found to give moderate wettability alteration, so that cores still exhibited spontaneous imbibition. The density of Cottonwood crude oil is 0.8874 (20oC) and the viscosity is 24.1 Pa.s. The brine was 10,000 ppm NaCl (viscosity of 0.00102 Pa.s and density of 0.998 at 20oC). The interfacial tension between Cottonwood crude oil and the brine was 29.7 mN/m.

DE-FC26-03NT15408 Semi-Annual Report 01/01/2007 – 06/30/2007
8
Initial water saturation In tests that included an initial water saturation, Swi, it was established by flow of Viscous Mineral Oil (VMO) (commercially described as “Extra Heavy Oil”) which was then displaced by 3.8 cP mineral oil for the VSWW tests. For tests with crude oil, the viscous oil was displaced by 5 PV decalin to avoid destabilization of the crude oil followed by injection of 5 PV of crude oil through each end of the core. For tests that started with the core at an initial water saturation, it was established with low salinity brine so that the advance of the imbibition front of the invading brine along the core could be tracked from the change in electrical conductivity between electrodes spaced along the core. Aging Cores were aged with Cottonwood crude oil at 75oC for 10 days either with or without an initial water saturation. Results for Countercurrent Spontaneous Imbibition into One-End-Open Cores (i) Zero initial water saturation Core H8O, VSWW, Swi = 0%, 3.8 cP mineral oil The 1,094 md core with one end open was immersed in brine to begin COUCSI. Pend rose quickly for the first 60 seconds. It then remained constant at about 3.14 kPa until the front reached the end of the core (after 2.5 hours). The ratio of Qw/Vφ to xf/Lc (the average saturation behind the front) was 0.42 until the imbibition front reached the end of the core (Fig. 6-1). The rate of oil recovery then decayed and the end pressure (Pend) decreased and eventually dropped to zero about 9 hours after the start of imbibition.
0.0
0.2
0.4
0.6
0.8
1.0
0.000 5.000 10.000 15.000t (hours)
Qo/Vφ
xf/Lc
0
2
4
6
8
10
xf/Lc
Pend
Qo/Vφ
Pend
(kPa)
Fig. 6-1 Distance of advance, volume of produced oil and end pressure versus time for Core H8O (1,094 md) initially saturated with mineral oil (Swi=0).

DE-FC26-03NT15408 Semi-Annual Report 01/01/2007 – 06/30/2007
9
Core HC4a, WWW, Cottonwood crude oil, Swi =0 In the measurement of Pcf on Core HC4 (991 md) included in the previous semi-annual report, brine only penetrated about 1 cm into the core under restricted COUCSI conditions. The invaded end of HC4 was cut off, and the remaining part (5.2 cm long) of the core, which was still saturated with Cottonwood crude oil was designated HC4a. From rate of imbibition behavior this core was described as weakly water wet (WWW). After the core was immersed in brine, Pend rose to 0.3 kPa within 100 seconds. It then slowly reached about 0.4 kPa after 3 days. After 6.4 days, the front reached the end of the core and the end pressure was 0.43 kPa.. Thus, the end pressure was less than one seventh of that for the VSWW core H80, and the time taken for the front to traverse the core was over 60 times longer. Even so, the ratio of Qw/Vφ to xf/Lc was again constant at 0.415 throughout the frontal advance. This was very close to the value of 0.42 determined for the VSWW core. After the front reached the end of the core, the rate of oil recovery decayed. Pend decreased and eventually dropped to zero about 14 days after the start of imbibition.
Fig. 6-2 Distance of advance, volume of produced oil and end pressure versus time for Core HC4a (991 md) initially saturated and aged with Cottonwood crude oil(Swi=0). Core HC2a, WWW, Cottonwood crude oil, Swi =0 A 3.9 cm long core was cut from a longer core that had been completely saturated with Cottonwood crude oil and aged. After immersing the core in brine, Pend rose quickly to over 0.2 kPa and reached 0.38 kPa within 22 hours. It then slowly rose to 0.41 kPa after 3 days and remained close to constant until the front reached the end of the core (5 days after the start of imbibition). The ratio of Qw/Vφ to xf/Lc was 0.43 when the imbibition front reached the end of the core (Fig. 6-3). Then the rate of oil recovery decayed and the end pressure (Pend) decreased and eventually dropped to zero about 13 days after the start of imbibition. The results are closely comparable to those obtained for Core HC4a.
0.0
0.2
0.4
0.6
0.8
1.0
0 5 10 15
Qo/Vφ
xf/Lc
0
0.2
0.4
0.6
0.8
1
xf/Lc
Pend
Qo/Vφ
Pend
(kPa)
t (days)

DE-FC26-03NT15408 Semi-Annual Report 01/01/2007 – 06/30/2007
10
0.0
0.2
0.4
0.6
0.8
1.0
0 5 10 15 20
Qo/Vφ
xf/Lc
0
0.2
0.4
0.6
0.8
1
xf/Lc
Pend
Qo/Vφ
Pend
(kPa)
t (days)
(ii) Cores containing an initial water saturation Core HA1, VSWW, 3.8 cP mineral oil, Swi = 18.7% Core HA1 contained 3.8 cP mineral oil and had an initial water saturation of 18.7%. After the core was immersed in brine, Pend rose quickly for 700 seconds. It then remained constant at about 1.8 kPa until the front reached the end of the core (2.8 hours after the start of imbibition). The ratio of Qw/Vφ to xf/Lc was 0.296 when the imbibition front reached the end of the core (Fig.6-4). The rate of oil recovery decayed and the end pressure (Pend) decreased and eventually became zero about 38 hours after the start of imbibition. Core HA3 (894 md), VSWW, 3.8 cP mineral oil, Swi = 25.2% The initial water saturation was 25.2%. After the core was immersed in brine, Pend rose quickly to 1.5 kPa within 1000 seconds (Fig.6-5) and remained constant at about 1.57 kPa until the front reached the end of the core (3 hours after the start of imbibition). The ratio of Qw/Vφ to xf/Lc was 0.27 when the imbibition front reached the end of the core. Then the rate of oil recovery decayed and the end pressure (Pend) decreased and eventually dropped to zero about 12 hours after the start of imbibition. The results closely match the form of those shown in Fig. 6-4 for 18.7% Swi. Core HA3 with the higher initial water saturation had, as expected, the lower end pressure.
Fig. 6-3 Distance of advance, volume of produced oil and end pressure, versus time for Core HC4a (991 md) initially saturated and aged with Cottonwood (Swi=0).

DE-FC26-03NT15408 Semi-Annual Report 01/01/2007 – 06/30/2007
11
Fig. 6-4 Distance of advance, volume of produced oil and end pressure, versus time for Core HA1 (894 md). The core initially contained 0.38 cP mineral oil at 18.7% Swi.
0.0
0.2
0.4
0.6
0.8
1.0
0 0.2 0.4 0.6t (days)
Qo/Vφ
xf/Lc
0
2
4
6
8
10
xf/Lc
Pend
Qo/Vφ
Pend
(kPa)
Fig. 6-5 Distance of advance, volume of produced oil and end pressure, versus time for Core HA3 (894 md). The core initially contained 0.38 cP mineral oil at 18.7% Swi
Core HD3 (1,039 md), MXW, Cottonwood crude oil, Swi = 22.4% The core was aged in Cottonwood crude oil, at an initial water saturation of 22.4% to obtain a mixed wettability state. After the core was immersed in brine, Pend rose quickly within a few seconds and remained constant at about 0.24 kPa until the front reached the end of the core (2.5 days after the start of imbibition). The ratio of Qw/Vφ to xf/Lc was 0.16 when the imbibition front
0.0
0.2
0.4
0.6
0.8
1.0
0 0.2 0.4 0.6t (days)
Qo/Vφ
xf/Lc
0
2
4
6
8
10
xf/Lc
Pend
Qo/Vφ
Pend
(kPa)

DE-FC26-03NT15408 Semi-Annual Report 01/01/2007 – 06/30/2007
12
reached the end of the core (Fig.6-6). Then the rate of oil recovery decayed and the end pressure (Pend) decreased and eventually dropped to zero about 16 days after the start of imbibition.
0.0
0.2
0.4
0.6
0.8
1.0
0 10 20 30t (days)
Qo/Vφ
xf/Lc
0
0.1
0.2
0.3
0.4
0.5
xf/Lc
Pend
Qo/Vφ
Pend
(kPa)
Fig. 6-6 Distance of advance, volume of produced oil and end pressure, versus time for Core HA3
(894 md). The core initially contained Cottonwood crude oil at 22.4% Swi. Core H01 (1,046 md), MXW, Cottonwood crude oil, Swi = 25.2% The core was aged with Cottonwood crude oil at an initial water saturation of 25.2% to obtain an MWX state. When the core was immersed in brine, Pend rose almost immediately to about 0.24 kPa and remained constant until the front reached the end of the core (2.4 days after the start of imbibition). The ratio of Qw/Vφ to xf/Lc was 0.13 when the imbibition front reached the end of the core (Fig. 6-7). The rate of oil recovery decayed and the end pressure (Pend) decreased and eventually dropped to zero about 20 days after the start of imbibition. Results are closely comparable to those for Core HD3.
0.0
0.2
0.4
0.6
0.8
1.0
0 10 20 30t (days)
Qo/Vφ
xf/Lc
0
0.1
0.2
0.3
0.4
0.5
xf/Lc
Pend
Qo/Vφ
Pend
(kPa)
Fig. 6-7 Distance of advance, volume of produced oil and end pressure, versus time for Core HA3
(894 md). The core initially contained Cottonwood crude oil at 25.2% Swi

DE-FC26-03NT15408 Semi-Annual Report 01/01/2007 – 06/30/2007
13
Task 6 Summary Results are summarized in Table 6.1. Table 6-1 Results of Pend during COUCSI HIGH
K CORE
D
(cm)
Lc
(cm)
K
(μm2)
φ
(%)
Swi
%
1-Sro
%
ρo �μo
(Pa.s)
Pend
(kPa)
σ
mN/m
Pend/σ
(μm-1)
TYPE
PROBEOIL
H8O 3.796 6.864 1.094 22.1 0 0.5 0.783 0.0038 3.14 48.85 64 VSWW Mineral H2O 3.794 6.18 1.084 22.0 0 0.5 0.783 0.0038 3.12 48.85 64 VSWW Mineral HC4a 3.406 5.2 0.991 22.0 0 0.5 0.8874 0.0241 0.43 29.7 14 WWW Crude HC2a 3.43 3.895 1.054 22.2 0 0.5 0.8874 0.0241 0.41 29.7 13 WWW Crude HA1 3.3 6.594 0.894 21.6 18.7 0.58 0.783 0.0038 1.80 48.85 37 VSWW Mineral HA3 3.248 6.594 0.894 21.6 25.2 0.59 0.783 0.0038 1.57 48.85 32 VSWW Mineral HD3 3.23 6.476 1.039 22.6 22.4 0.61 0.8874 0.0241 0.24 29.7 8 MXW Crude HO1 3.67 6.438 1.046 22.2 25.2 0.60 0.8874 0.0241 0.24 29.7 8 MXW Crude
Task 7. Novel imbibition measurements on mixed-wet rock and network models.
Task 7 Discussion A problem in investigation of spontaneous imbibition in mixed wet rocks is that the rate and extent of oil recovery can be extremely low. A detailed mathematical analysis and tests against experiments show that the optimum geometric configuration is given by radial imbibition into a core that has a hole down the center. A novel design of radial imbibition cell has been designed and constructed which permits measurement of imbibition end pressure in the center hole. Initial tests were successful and only minor improvements are now needed. Details of the analysis and cell design and preliminary results will be presented in the next semi-annual report.
Task 8. Application of network/numerical model to mixed wet rocks. A model for co- and counter-current imbibition through independent capillaries has already been developed and experiments conducted to verify the theory (Unsal et. al, 2007). In this report, the work is extended to capillaries which are connected laterally and in which cross-flow can take place. The fundamental pore geometry is a rod in an angled round-bottomed slot with a gap between the rod and a capping glass plate. The surfaces of the slot, rod and plate form capillaries and interconnecting passages which have non-axisymmetric cross-sections. Depending on the gap size either (i) a large single meniscus, (ii) two menisci one on each side of the rod, or (iii) three menisci, one between the rod and the glass additional to the ones on each side can be formed. A viscous refined oil was applied to one end of the capillaries and co-current and counter-current spontaneous imbibition experiments were performed. The opposite end was left open to the atmosphere for co-current experiments. When the gap between the rod and the plate was large, the imbibing oil advanced into the tubes with the meniscus in the largest capillary always lagging behind the two menisci in the other two smaller capillaries. For counter-current imbibition experiments the open end was sealed and connected to a sensitive pressure transducer. In some experiments, the oil imbibed into the smaller capillaries and expelled air as a series of
DE-FC26-03NT15408 Semi-Annual Report 01/01/2007 – 06/30/2007
14
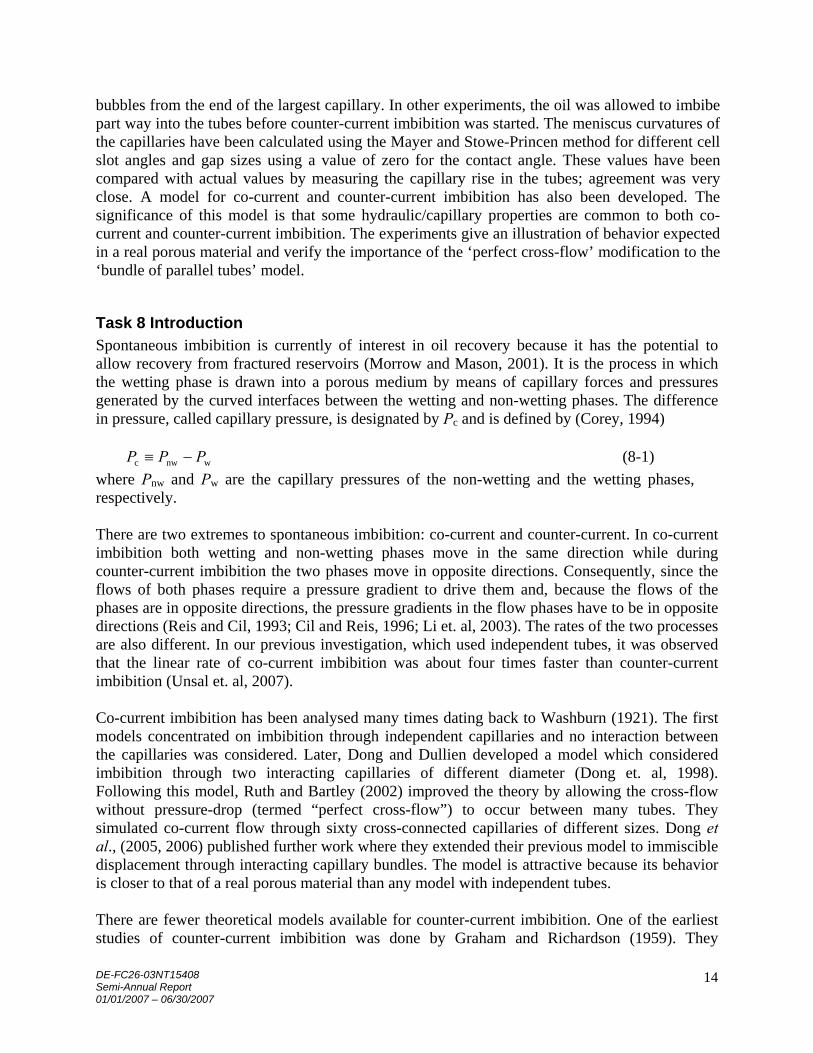
bubbles from the end of the largest capillary. In other experiments, the oil was allowed to imbibe part way into the tubes before counter-current imbibition was started. The meniscus curvatures of the capillaries have been calculated using the Mayer and Stowe-Princen method for different cell slot angles and gap sizes using a value of zero for the contact angle. These values have been compared with actual values by measuring the capillary rise in the tubes; agreement was very close. A model for co-current and counter-current imbibition has also been developed. The significance of this model is that some hydraulic/capillary properties are common to both co-current and counter-current imbibition. The experiments give an illustration of behavior expected in a real porous material and verify the importance of the ‘perfect cross-flow’ modification to the ‘bundle of parallel tubes’ model.
Task 8 Introduction Spontaneous imbibition is currently of interest in oil recovery because it has the potential to allow recovery from fractured reservoirs (Morrow and Mason, 2001). It is the process in which the wetting phase is drawn into a porous medium by means of capillary forces and pressures generated by the curved interfaces between the wetting and non-wetting phases. The difference in pressure, called capillary pressure, is designated by Pc and is defined by (Corey, 1994) wnwc PPP −≡ (8-1) where Pnw and Pw are the capillary pressures of the non-wetting and the wetting phases, respectively. There are two extremes to spontaneous imbibition: co-current and counter-current. In co-current imbibition both wetting and non-wetting phases move in the same direction while during counter-current imbibition the two phases move in opposite directions. Consequently, since the flows of both phases require a pressure gradient to drive them and, because the flows of the phases are in opposite directions, the pressure gradients in the flow phases have to be in opposite directions (Reis and Cil, 1993; Cil and Reis, 1996; Li et. al, 2003). The rates of the two processes are also different. In our previous investigation, which used independent tubes, it was observed that the linear rate of co-current imbibition was about four times faster than counter-current imbibition (Unsal et. al, 2007). Co-current imbibition has been analysed many times dating back to Washburn (1921). The first models concentrated on imbibition through independent capillaries and no interaction between the capillaries was considered. Later, Dong and Dullien developed a model which considered imbibition through two interacting capillaries of different diameter (Dong et. al, 1998). Following this model, Ruth and Bartley (2002) improved the theory by allowing the cross-flow without pressure-drop (termed “perfect cross-flow”) to occur between many tubes. They simulated co-current flow through sixty cross-connected capillaries of different sizes. Dong et al., (2005, 2006) published further work where they extended their previous model to immiscible displacement through interacting capillary bundles. The model is attractive because its behavior is closer to that of a real porous material than any model with independent tubes. There are fewer theoretical models available for counter-current imbibition. One of the earliest studies of counter-current imbibition was done by Graham and Richardson (1959). They
DE-FC26-03NT15408 Semi-Annual Report 01/01/2007 – 06/30/2007
15
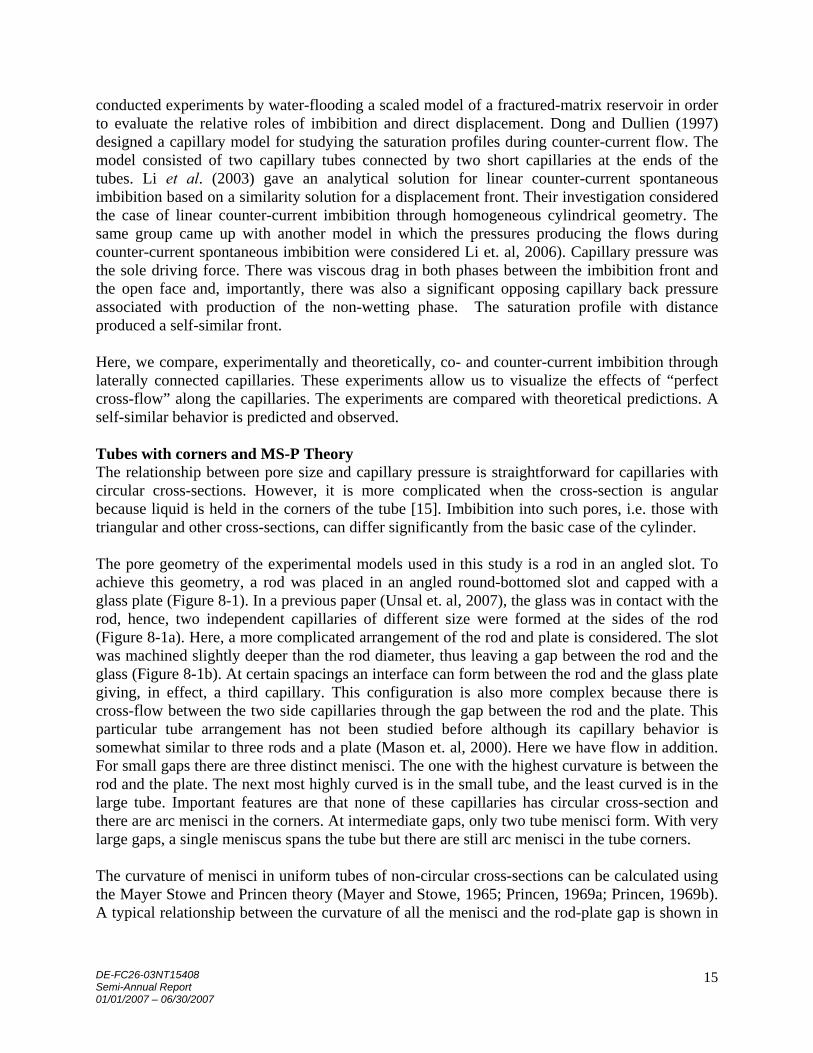
conducted experiments by water-flooding a scaled model of a fractured-matrix reservoir in order to evaluate the relative roles of imbibition and direct displacement. Dong and Dullien (1997) designed a capillary model for studying the saturation profiles during counter-current flow. The model consisted of two capillary tubes connected by two short capillaries at the ends of the tubes. Li et al. (2003) gave an analytical solution for linear counter-current spontaneous imbibition based on a similarity solution for a displacement front. Their investigation considered the case of linear counter-current imbibition through homogeneous cylindrical geometry. The same group came up with another model in which the pressures producing the flows during counter-current spontaneous imbibition were considered Li et. al, 2006). Capillary pressure was the sole driving force. There was viscous drag in both phases between the imbibition front and the open face and, importantly, there was also a significant opposing capillary back pressure associated with production of the non-wetting phase. The saturation profile with distance produced a self-similar front. Here, we compare, experimentally and theoretically, co- and counter-current imbibition through laterally connected capillaries. These experiments allow us to visualize the effects of “perfect cross-flow” along the capillaries. The experiments are compared with theoretical predictions. A self-similar behavior is predicted and observed. Tubes with corners and MS-P Theory The relationship between pore size and capillary pressure is straightforward for capillaries with circular cross-sections. However, it is more complicated when the cross-section is angular because liquid is held in the corners of the tube [15]. Imbibition into such pores, i.e. those with triangular and other cross-sections, can differ significantly from the basic case of the cylinder. The pore geometry of the experimental models used in this study is a rod in an angled slot. To achieve this geometry, a rod was placed in an angled round-bottomed slot and capped with a glass plate (Figure 8-1). In a previous paper (Unsal et. al, 2007), the glass was in contact with the rod, hence, two independent capillaries of different size were formed at the sides of the rod (Figure 8-1a). Here, a more complicated arrangement of the rod and plate is considered. The slot was machined slightly deeper than the rod diameter, thus leaving a gap between the rod and the glass (Figure 8-1b). At certain spacings an interface can form between the rod and the glass plate giving, in effect, a third capillary. This configuration is also more complex because there is cross-flow between the two side capillaries through the gap between the rod and the plate. This particular tube arrangement has not been studied before although its capillary behavior is somewhat similar to three rods and a plate (Mason et. al, 2000). Here we have flow in addition. For small gaps there are three distinct menisci. The one with the highest curvature is between the rod and the plate. The next most highly curved is in the small tube, and the least curved is in the large tube. Important features are that none of these capillaries has circular cross-section and there are arc menisci in the corners. At intermediate gaps, only two tube menisci form. With very large gaps, a single meniscus spans the tube but there are still arc menisci in the tube corners. The curvature of menisci in uniform tubes of non-circular cross-sections can be calculated using the Mayer Stowe and Princen theory (Mayer and Stowe, 1965; Princen, 1969a; Princen, 1969b). A typical relationship between the curvature of all the menisci and the rod-plate gap is shown in

DE-FC26-03NT15408 Semi-Annual Report 01/01/2007 – 06/30/2007
16
Figure 8-2. The analysis is applicable to all cell angles but experimentally we have here only used cells with slot angles (β) of 65º, 75º and 85º. Figure 2 shows that for small gaps (d/R < 0.15) there are three menisci; a potentially very highly curved one in the gap between the rod and the plate, a less highly curved one in the small tube and a meniscus in the large tube with about half of the curvature of the small tube meniscus. The lowest curvature indicated on Figure 8-2 is that of a cylindrical meniscus in the large tube and it approximates to the curvature at which a bubble would be expected to snap off in this tube (Ma et.al, 1996). For larger gaps (0.15<d/R<0.26), the distinct two-sided meniscus between the rod and the plate which separates the menisci in the large and small tube no longer exists. There is instead a single interface meniscus between the rod and the plate and the menisci in the large and small tubes share it. For large spacings between the rod and the plate (d/R>0.26), this interface disappears and, apart from the arc menisci in the corners, there is only a single meniscus in the tube. In past investigations (Mason and Morrow, 1985; Mason et. al, 2000; Unsal et. al, 2007), excellent agreement has been found between the prediction of the MS-P theory and experimental results. In this report, the analysis has been applied to the rod in an angled slot configuration with a gap between the glass and the rod.
Task 8 Theoretical Overview Experiments involving both co-current and counter-current imbibition have been conducted. The interfaces formed in the rod-slot model will be addressed by their interface curvature. Meniscus ‘a’ is in the larger capillary, ‘b’ is in the small capillary and ‘c’ is between the rod and the plate. During co-current flow, when there is perfect cross-flow, meniscus ‘c’ leads with meniscus ‘b’ behind it. Meniscus ‘a’ in the large capillary is the last. During counter-current imbibition, meniscus ‘b’ and ‘c’ imbibe again with ‘c’ leading ‘b’, and bubbles are expelled from the tube ‘a’. However, in some experiments, imbibition was started co-current and then changed to counter-current. Under these circumstances liquid imbibed in the ‘b’ and ‘c’ but flowed in the opposite direction in tube ‘a’. In order to conduct the experiment, an additional, relatively large capillary was needed. Its function was to act as a small constant pressure reservoir and it was typically only partly filled with oil. All of the experiments were video-taped so that the positions of all of the interfaces at any point of time could be determined. This experimental arrangement can be modeled as three capillary tubes with perfect lateral cross-flow between them (Figure 8-3). If there is perfect cross-flow then, at any distance x, the pressure is equal in the oil phase and in the air phase. If the air is assumed to be non-viscous then the pressure in the air is everywhere equal. For a range of distances, oil is present in some capillaries whilst there is air present in the others. This is the transition region (Dong et. al, 2005). Perfect Cross-Flow Between Capillaries Consider the three capillary tubes in Figure 8-4; there is perfect cross-flow between them. At any distance x, if the same phase is present in all tubes then the pressure is also the same at all tubes.

(8-2)
(8-5)
(8-3)
Gravity is ignored. The pressure in the unfilled tubes is constant because the fluid there (air) hassuch a small viscosity.
The zone closest to the imbibition face will be denoted by the subscript 1 (Figure 8-5). This zoneoccupies the area between the inlet and the interface in the largest tube. In this zone, the flow ofthe oil (qol) can be calculated by means of the equation
__ 1 (Poa - Padd + Pdead)qol - Ao1 -------Xa
where ,101 is the resistance to flow per unit length, Poa is the pressure in oil. Padd is the pressure inthe additional capillary (which will be negative) and Pdead is the dead-end pressure in the airwhich is zero for co-current imbibition and positive for counter-current imbibition. Theresistance to flow is given by
A = la6a4 + Ib6: + le6:01
JL JL JL
where a denotes the largest tube, b denotes the mid-size tube, and c denotes the smallest tube, fa,.fb and Ie are factors depending on the tube shape, and 6 is a tube dimension. The flow of gas inregion 1 is
qgl = 0 (8-4)
In the second zone (Figure 8-5), which occupies the region between the interface in the largesttube and the interface in the mid-size tube, the flow rates are given by
q = -A POb - Poa02 02
Xb - Xa
for oil and
q g2 = q 01 - q 02
for gas where
A = Ib6: + le6:02
JL JL
(8-6)
(8-7)
In the third zone (Figure 8-5), which occupies the region between the interface in the mid-sizetube and the interface in the smallest tube, the flow rates may be calculated from the equations
P -Pq = -A oe ob (8-8)03 03
Xc - xb
and
qg3 = qol -q03
where
A = le6e403JL
(8-9)
(8-10)
(8-11 )
(8-12)
The pressure values are well defined. If the air is at Pdead and the inlet pressure is Padd, then thepressures are simply given by the capillary pressures in the tubesPoa = -~a
DE-FC26-03NT15408
Semi-Annual Report01/01/2007 - 06/30/2007
17

and
Poc = -Pee
The advances of the interfaces are governed by the equations
Xa,n+1 - xa,n _ q 01 - q 02
tn+1 - tn Aa
Xb,n+1 - Xb,n q 02 - q 03
tn+1 - tn Ab
and
x -x qc,n+l c,n = ~tn+1 - tn Ac
where
Aa = ga5;
Ab = gb5~and
Ac = gc5~
Here ga, gb and gc are shape factor constants depending on the tube shapesindicate short adjacent resistances and times. Combining the equations
xa,n+l - xa,n = A (Pea + Padd - Pdead) A ~b - ~a
t 01 A 02 A ( )n+1 - tn a Xa a Xb - Xa
and
(8-13)
(8-14)
(8-15)
(8-16)
(8-17)
(8-18)
(8-19)
and nand n +1
(8-20)
(8-21 )
(8-22)
.~-;-"--
In the limit when the time step is very small Eqs. (8-20 - 8-22) become differential equations.Multiplying each equation by the denominator on the right hand side gives:
dXa 1 1 ( XaAaxa - = /(,OIPa -/(,02 PCb-Pea) ---~ (8-23)dt (Xb - x.)
dXb (Xb -Xa)Ab(Xb -X.)-=A02(Pcb -Pca)-A03(Pcc -Pcb)--- (8-24)
dt (Xc-Xb)
(8-25)
By analogy with imbibition in a porous material we expect a self-similar £font to form (Li et. aI,2003). If there is a self-similar £font then let
DE-FC26-03NT15408
Semi-Annual Report01/01/2007 - 06/30/2007
18

~-k (8-26)- ab
xb
and
!.l-k(8-27)
- beXc
where, for a self-similar front, kab and kbc will both be constant. Now, thexa/(xb -xJ and
(xb -xJ/(xc -xb) terms on the right hand side of Eq. (8-23) and (8-24) remain constant;
consequently the variables can be separated and Eqs. (8-23 - 8-25) integrated. When the initialconditions are xa = xb = Xc = 0 at t = 0 then
(8-28)
(8-29)
(8-30)
(8-33)
(8-32)
(8-31 )
Division ofEq. (8-28) by Eq. (8-29) shows that xa/xb is indeed a constant. Similarly division of
Eq. (8-29) by Eq. (8-30) shows that xb / Xc is also a constant. Therefore, one solution of Eqs. (823 - 8-25) is a self-similar front.
In experiments we can measure Xa, Xb and Xc as functions of t. Thus the gradients, G, of Eqs. (828 - 8-30) can be determined from the experiments. Also, because we know Xa, Xb and Xc theconstants kab and kbc can be determined. We thus have
G, = ~ [ ;t" (~, + p,•• - P,,,,) - ;t" (P" _P,,) k" ]~ O-~)
G _~[;to,(p,,-~,)_;t (P -P) k" ]b - Ab (1- kab) 03 cc cb (1- kbJ
G = 2A (Pee - ~b)c A 03 0 - k )c be
Note that in Eq. (8-33), Gc(1-kbc) should have the same value for co- and counter-currentimbibition because all of the remaining variables are independent of the direction of imbibition.
Interpretation of experiments using the theoryFrom recordings of both co- and counter-current imbibition we have measurements of Xa, Xb andXc as functions of time t. It is not possible to fill the experimental cell instantaneously and so Xa,
Xb and Xc are not exactly zero at t=0. However, if there is a self-similar front then plots of xa2, Xb2
and xc2 vs time relative to an arbitrary start should be straight lines which all pass through acommon point Xa = Xb = Xc = 0 which will give the actual zero of time. The lines will have
gradients Ga, ~ and Gc. For counter-current imbibition, the air is produced as bubbles, whichmeans that the capillary pressure is not constant. However, if we let imbibition start co-current
OE-FC26-03NT1540B
Semi-Annual Report01/01/2007 - 06/30/2007
19

------------------------------------------------------~--------
and run until the interfaces are about halfway along the tubes and then switch to counter-currentimbibition by sealing the end of the tube, then the capillary pressure in the large tube will remainconstant. Eqs. (8-28 - 8-30) should again give straight lines for these circumstances. Thegradients Ga, Go and Ge can be determined for the same cell during co-and counter-currentimbibition, and, if the relevant kab and kbe's are known then they will be related by Eqs. (8-31 8-33).
Application to counter-current imbibitionFor counter-current imbibition, the basic flow equations are the same for co-current imbibitionbut one driving pressure is different. There is an additional pressure at the end of the cell whichdrives the counter-current flow in the large tube and which acts equally on all of the othermenisci. This additional pressure is the dead-end pressure and is Pdead above atmosphericpressure. It has to be high enough to force the air flow back down the large capillary.
Again Eqs. (8-28) to (8-30) apply but the behavior of 'tube a' is more complicated. The pressuregoverning the behavior in this tube is generated by the interaction of Pea with the dead-endpressure Pdead and the pressure produced by the interface in the additional capillary. Becausethere is no net flow in the tube assembly, the volumetric flow of fluid going forward must equalthe volumetric flow of air going in the opposite direction. This means that the dead-end pressurerises until it can reverse the flow in 'tube a' (the one that produces the lowest capillary pressure).As the interface in 'tube a' moves in reverse, it still generates a capillary pressure of Pea.Eventually the interface in 'tube a' reaches the end of the tube and a bubble starts to form. Thepressure across the bubble interface varies with the bubble size and makes the behavior
complicated. However, plots of x~, x~ and x~ versus (t-to) should be straight lines in the period
before bubbles form. Also, from Eq. (8-30), Ge(1-keb) should have the same value for both coand counter-current imbibition.
Task 8 Experimental
A detailed description of the apparatus used to observe co- and counter-current imbibition hasbeen given previously (Unsal et. aI, 2007). The cells are composed of an aluminum block, a rodand a glass plate. The rod is placed in an angled slot which was precisely machined into the topsurface of the block and capped by the glass plate. Previously the rod was in contact with theglass forming two independent capillaries, one on each side of the rod. In the present work, a gapwas left between the rod and the plate so that there was cross-flow between the capillaries, andthis markedly changed the behavior.
Experiments were conducted for eight model pore systems using a perfectly-wetting oil as thewetting phase and air as the non-wetting phase. With the model pore system vertical, thecapillary rise in each tube was measured and, knowing the interfacial tension, the curvature ofthe menisci in each of the three tubes was obtained. Next, with the pore system horizontal, bothco-current and counter-current imbibition experiments were carried out on all eight cells.
Fluids
In the capillary rise experiments iso-octane was used because it had a low viscosity and thusreached equilibrium quickly. For both co-current and counter-current experiments, a viscousliquid paraffin was used to displace air. The properties of both liquids are given in Table 8-1.
DE-FC26-03NT1540B
Semi-Annual Report01/01/2007 - 06/30/2007
20

DE-FC26-03NT15408 Semi-Annual Report 01/01/2007 – 06/30/2007
21
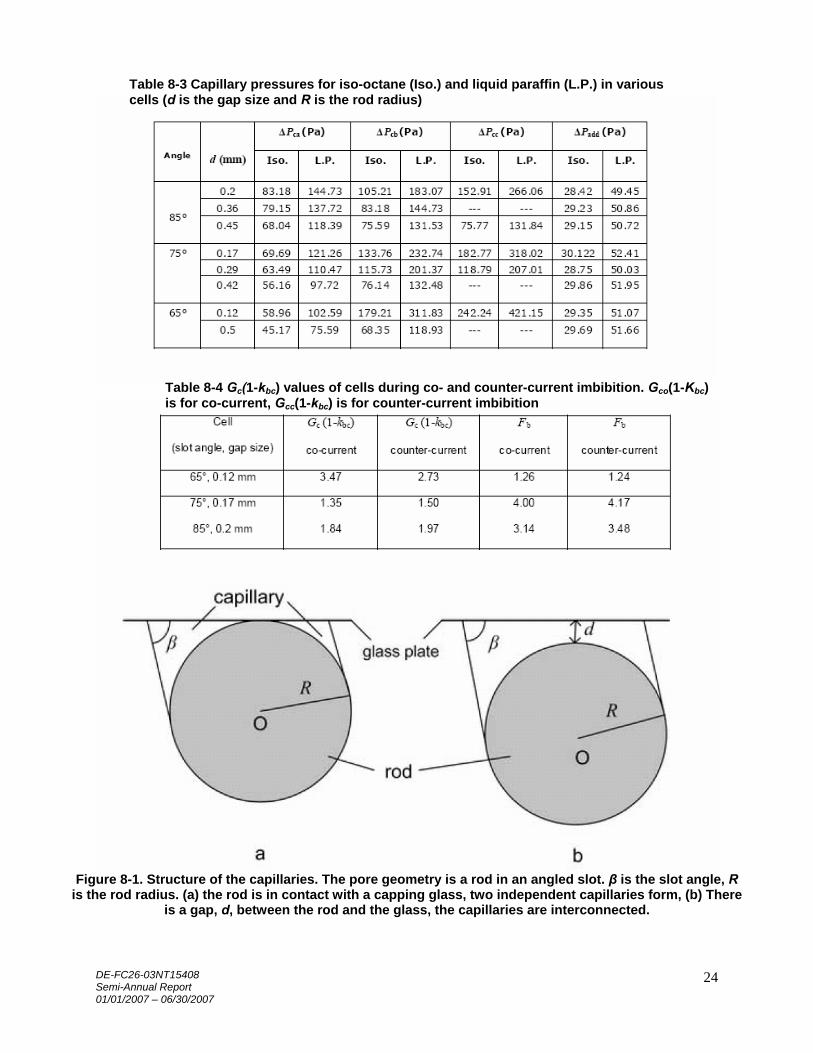
Meniscus curvatures When the rod touches the plate the system is basically a rod-in-an-angled-corner and two menisci form, one on each side of the rod. However, when there is a gap, the number of individual interfaces varies with the gap size (Figure 8-2). There is a potential for up to three distinct interface structures, one in each side ‘tube’ and a third one between the rod and the plate. The displacement curvatures for all of the menisci in the cells were measured by the capillary rise method. Measured curvatures in these static experiments are shown in Table 8-2. The capillary pressures are also calculated using the measured curvatures and listed in Table 8-3. The rod radius was 1.58 mm. Normalized curvatures were also calculated using MS-P theory and compared with the capillary rise results (Figures 8-6 - 8-8). In all cases, agreement is excellent.
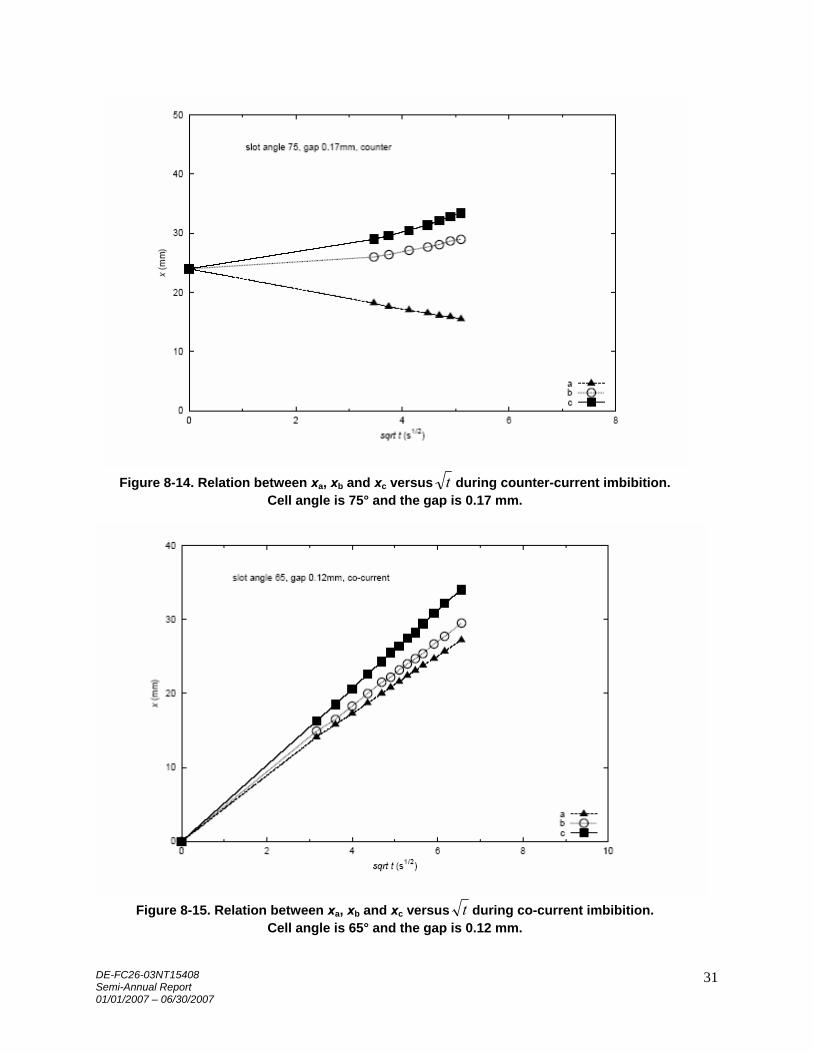
Task 8 Results Co-current and counter-current imbibition when no bubbles form Incorporating the gap between the rod and the plate makes a significant difference to the co-current imbibition behavior. When the capillaries are independent of each other, the meniscus in the larger capillary is always ahead of the one in the smaller capillary [1]. When there is a gap between the rod and a plate, the capillaries are interconnected so that cross-flow between them can occur. Now the meniscus in the smaller capillary leads the imbibition process. Single frames from an experiment involving co-current flow are shown in Figures 8-9 – 8-10. The menisci have been drawn over for clarity. For the counter-current imbibition experiments, the oil was allowed to imbibe co-currently until the interfaces were about a third of the way along the cell. Then the end was sealed. Subsequently, the air pressure in the dead end built up and counter-current imbibition commenced. The purpose of conducting the experiment in this way was to prevent bubbles being formed at the entrance to the large tube. In these circumstances, Eqs. (8-28 – 8-30) apply to both co-current and counter-current imbibition. In order to show the negative distance moved by the interface in the largest tube, it is better to plot the distance versus the square root of time. Eqs. (8-28 – 8-30) indicate that co-current and counter-current imbibition should both give straight line plots for xa, xb and xc against 0tt − . Because of the way the experiments are performed, it is not possible to know the exact time at which xa, xb and xc are all zero. Consequently this time has to be found by extrapolating the distance versus time results backwards to find the time when xa, xb and xc are all zero in co-current imbibition. An extrapolation process has also been applied to the counter-current imbibition. However, this time extrapolation lines did not go through the origin, giving not only the time but also the position when xa, xb and xc all have the same value. Figure 8-11 – 8-16 show the plots for co-current and counter-current imbibition from cells in which 3 distinct menisci were observed. The fact that all of the experimental results fall so close to straight lines confirms that self-similar fronts are formed as predicted by Eqs. (8-28 – 8-30). The slight changes in gradient are probably caused by the arc menisci in the corners reaching the end of the tubes. If the gradients in Figures 11-18 are ga, gb and gc then

DE-FC26-03NT15408 Semi-Annual Report 01/01/2007 – 06/30/2007
22
2aa gG = , 2
bb gG = and 2cc gG = (8-34)
Eq. (33) indicates that Gc(1-kbc) [=Fc]) should have the same value for both co-and counter-current imbibition for each cell because λo3, Ac and (Pcc-Pcb) are the same for both co-and counter-current imbibition. Similarly from Eq. (8-32)
bab
bc
bccbcc3o
bb )1(
)1()(2 Fk
kk
PPA
G =−⎥⎦
⎤⎢⎣
⎡−
−+ λ (8-35)
should also have the same value for co-and counter-current imbibition. Table 8-4 shows these factors for all of the cells. They are in reasonable agreement, confirming Eqs. (8-28 – 8-30). The Gc(1-kbc) values are also listed in Table 8-4 for both co- and counter-current imbibition. Counter-current flow when bubbles are formed If the end of the cell is sealed when the oil is introduced, then in the counter- current imbibition, initially but for a very short time, all the interfaces advance but with the largest tube leading. However, as the air at the end of the cell is compressed, the large interface is pushed back by this increasing pressure. Eventually a bubble is blown from the large capillary tube. Immediately after the complete bubble snaps off, an interface forms sealing the tube. This interface then advances a short way into the large capillary. During all this bubble-blowing period, the smaller tube and the interface between the rod and the plate continue to imbibe oil. Single frames from an experiment involving bubble snap-off during a counter-current flow are shown in Figure 8-17. At the beginning, before the oil is introduced into the capillaries, the differential pressure transducer shows a constant value of around 0 Pa. After the oil is introduced, the meniscus in the additional capillary creates an additional capillary pressure (the capillary pressure introduced by the reservoir that was added to the system) between the atmosphere and the fluid which, in effect, shifts the zero indicated pressure of the transducer. This pressure is equal to the Padd and if this value is subtracted from the zero initial pressure, we obtain the ‘absolute base pressure’. The pressure produced by the additional capillary can be obtained from the capillary rise experiments (see Table 8-3). As the oil is applied to the capillaries and starts to imbibe, the pressure rises to the first positive peak. As the length of large tube filled with oil decreases, the pressure drops slightly. It then drops more rapidly as the bubble forms. Eventually the bubble snaps off. Once the snap-off is completed, the air pressure increases almost back up to the initial value and stays almost constant until the next bubble starts to form. After the snap-off the meniscus in the large tube appears to invade the tube for some distance but close observation shows that most of the liquid comes from the arc menisci. As the imbibition rate slows down, the time taken for bubble formation gets longer. A slight decrease in the snap-off pressure was observed with later bubbles, probably because of the fall in rate of formation. The data plot for the transducer readings (Pdead) of the cell with a slot angle of 75º is given in Figure 8-18. The negative peaks correspond to a bubble forming. The bubble snaps off at the point ‘A’. Immediately after the snap-off, the pressure rises again as the arc menisci retreat into the corners and the main meniscus advances in the larger tube. Little additional imbibition takes place at this point; it is just a rearrangement of fluid. There is a slowing as sequential bubbles are formed. This is because the meniscus advance in the smaller capillary slows with time.

DE-FC26-03NT15408 Semi-Annual Report 01/01/2007 – 06/30/2007
23
The behavior of the cells when bubbles are formed during counter-current imbibition is quite complex. Consequently the analysis and full report of the experiments will be left for a subsequent report.
Table 8-1 Properties of liquid paraffin and iso-octane
Table 8-2 The displacement curvature in cells with different d/R ratios, where d is the gap size and R is the rod radius. The a, b, and c values are the heights of each meniscus minus the height of the reference point.
DE-FC26-03NT15408 Semi-Annual Report 01/01/2007 – 06/30/2007
24
Table 8-3 Capillary pressures for iso-octane (Iso.) and liquid paraffin (L.P.) in various cells (d is the gap size and R is the rod radius)
Table 8-4 Gc(1-kbc) values of cells during co- and counter-current imbibition. Gco(1-Kbc) is for co-current, Gcc(1-kbc) is for counter-current imbibition
Figure 8-1. Structure of the capillaries. The pore geometry is a rod in an angled slot. β is the slot angle, R is the rod radius. (a) the rod is in contact with a capping glass, two independent capillaries form, (b) There
is a gap, d, between the rod and the glass, the capillaries are interconnected.

DE-FC26-03NT15408 Semi-Annual Report 01/01/2007 – 06/30/2007
25
Figure 8-2. Meniscus curatures normalized with respect to rod radius as a function of gap size for a rod in an angled slot such as that shown in Figure 8-1b. Slot angle β is 85°, d is the size of the gap between the rod and the plat, R, is the rod radius. The white areas show the tube
space, black shows the wetting pahse, and the gray shows the nonwetting phase, for each arc meniscus configuration.
Figure 8-3. The positions of the oil/air meniscus in the capillaries at a point of time in the process of oil displacing air.

DE-FC26-03NT15408 Semi-Annual Report 01/01/2007 – 06/30/2007
26
Figure 8-4. Perfect cross-flow model
Figure 8-5. Cross-sectional areas of capillaries

DE-FC26-03NT15408 Semi-Annual Report 01/01/2007 – 06/30/2007
27
Figure 8-6. Comparison of measured and MS-P curvatures at different d/R ratios.
Slot angle is 85°
Figure 8-7. Comparison of measured and MS-P curvatures at different d/R ratios.
Slot angle is 75°

DE-FC26-03NT15408 Semi-Annual Report 01/01/2007 – 06/30/2007
28
Figure 8-8. Comparison of measured and MS-P curvatures at different d/R ratios.
Slot angle is 65°
Figure 8-9. Single frames taken at different times during an experiment involving co-current imbibition, slot angle is 75°, gap size is 0.42 mm. In frames (a) which was taken very shortly
after imbibition commenced, the interface in the large tube leads that in the small tube. This is because the cross-flow is not yet sufficient to be ‘perfect’. As the flows reduce and the area
for cross-flow increases, the system behaves much more like perfect cross-flow.

DE-FC26-03NT15408 Semi-Annual Report 01/01/2007 – 06/30/2007
29
Figure 8-10. Menisci structures in different cells showing the effect of increasing gap size (a)
Slot angle is 75°, gap is 0.17 mm, (b) Slot angle is 75°, gap is 0.29 mm, (c) Slot angle is 75°, gap is 0.42 mm.
Figure 8-11. Relation between xa, xb and xc versus t during co-current imbibition.
Cell angle is 85° and the gap is 0.2 mm.

DE-FC26-03NT15408 Semi-Annual Report 01/01/2007 – 06/30/2007
30
Figure 8-12. Relation between xa, xb and xc versus t during counter-current imbibition.
Cell angle is 85° and the gap is 0.2 mm.
Figure 8-13. Relation between xa, xb and xc versus t during co-current imbibition.
Cell angle is 75° and the gap is 0.17 mm.
DE-FC26-03NT15408 Semi-Annual Report 01/01/2007 – 06/30/2007
31
Figure 8-14. Relation between xa, xb and xc versus t during counter-current imbibition.
Cell angle is 75° and the gap is 0.17 mm.
Figure 8-15. Relation between xa, xb and xc versus t during co-current imbibition.
Cell angle is 65° and the gap is 0.12 mm.

DE-FC26-03NT15408 Semi-Annual Report 01/01/2007 – 06/30/2007
32
Figure 8-16. Relation between xa, xb and xc versus t during counter-current imbibition.
Cell angle is 65° and the gap is 0.12 mm.

DE-FC26-03NT15408 Semi-Annual Report 01/01/2007 – 06/30/2007
33
Figure 8-17. Counter-current imbibition. A bubble is emerging from the large tube. After snap-off, the meniscus invades the tube for some distance. However, much of this fluid comes from
rearrangement of the arc menisci. Slot angle is 75° and the gap is 0.17 mm.

DE-FC26-03NT15408 Semi-Annual Report 01/01/2007 – 06/30/2007
34
Figure 8-18. Pressure (Pdead) recordings in the cell during counter-current flow.
Slot angle is 75° and the gap is 0.29 mm.
References Buckley, S.E., M.C. Leverett, Trans AIME. 146 (1942) 107. Cil, M., J.C. Reis, J. Petroleum and Engineering. 16 (1996) 61. Corey, A.T., Mechanics of Immiscible Fluids in Porous Media. Water Resources Publications, Colorado, 1994. Dong, M., F.A.L. Dullien, Transport in Porous Media. 27 (1997) 185. Dong, M., F.A.L. Dullien, J. Zhou, Transport in Porous Media. 31 (1998) 213. Dong, M., F.A.L. Dullien, L. Dai, D. Li, Transport. Porous Media. 59 (2005), 1. Dong, M., F.A.L. Dullien, L. Dai, D. Li, Transport Porous Media. 63 (2006) 289. Graham, J.W., J.G. Richardson, Petroleum Transactions. AIME, 216 (1959) 377. Li, Y., N.R. Morrow, D. Ruth, J. Petroleum Science and Engineering. 39 (2003) 309. Li, Y., D. Ruth, G. Mason, N.R. Morrow, J. Petroleum Science and Engineering. (2006) 52, 1 – 4, 87. Ma, S., G. Mason, N.R. Morrow, Colloids and Surfaces A: Physicochemical and Engineering Aspects. 117 (1996) 273. Mason, G., N.R. Morrow, J. Colloid and Interface Science. 109 (1985) 46. Mason, G., N.R. Morrow, T.J. Walsh, Studies in Surface Science and Catalysis. 128 (2000) 495. Mayer, R.P., R.A. Stowe, J. Colloid Interface Science. 20 (1965) 893. Morrow, N.R., G. Mason, Current Opinion in Colloid and Interface Science. 6 (2001) 321. Princen, H.M., J. Colloid and Interface Science. 30 (1969a) 69. Princen, H.M., J. Colloid and Interface Science. 30 (1969b) 359.

DE-FC26-03NT15408 Semi-Annual Report 01/01/2007 – 06/30/2007
35
Reis, J.C., M. Cil, J. Petroleum Science and Engineering. 10 (1993) 97. Washburn, E.W., The Physical Review. 17 (1921), 273. Ruth, D., J. Bartley, Proc. 2002 International Symposium of the Society of Core Analysts, Monterey, California, SCA2002-05. (2003) 12. Unsal, E., G. Mason, N.R. Morrow, D.W. Ruth, J. Colloid Interface Science. 306 (2007) 105.
Task 9. Increased oil recovery by spontaneous imbibition.
Task 9 Discussion Reservoir cores which show significant response in oil recovery to low salinity injection have been identified. These rocks are now being used to investigate the effect salinity on rate and extent of recovery by spontaneous imbibition. Experiments are now being set up in which the imbibition end pressures will be measured. The imbibing fluid will then be switched to a surfactant solution to determine if reduction in interfacial tension results in enhanced rate of recovery by reducing the external bubble pressure. Surfactants are now being characterized for application to improved oil recovery by wettability alteration.
CONCLUSIONS
Task 6 • End pressure data for imbibition into mixed wet and weakly water wet behavior are reported
for the first time. Results for duplicate tests were closely reproduced. • End pressures for the investigated MXW state were one seventh of the end pressures for
strongly water wet conditions at comparable initial water saturation to the MXW core and one thirteenth of the end pressure for strongly water wet cores initially saturated with mineral oil.
• For VSWW states, both with and without an initial water saturation, the invading brine
advanced as a front with constant saturation behind the front. The amount of brine imbibed was proportional to the distance of advance. The rate of advance decreased as the square root of time.
Task 7 • The optimum design for investigation of spontaneous imbibition is shown by analysis to be
radial flow from outside into a core with a hole in the center. • A new design of imbibition cell has been constructed which optimizes the accuracy of the
experiment and allows imbibition end pressure measurements.

DE-FC26-03NT15408 Semi-Annual Report 01/01/2007 – 06/30/2007
36
Task 8. • An interacting capillary model, which is based on pressure equilibration among the
capillaries with non-circular cross-sections has been used to analyze a series of experiments.
• The model predicts a behavior that differs from that of the classic ‘bundle of independent
cylindrical tubes’ model. • The model also predicts that imbibition will give a self-similar front thus making it akin
to the classic analysis of Buckley-Leverett (1942). • The equations do not have analytical solutions. The model is part way between network
models, which are complex and which only give simulation solutions, and the independent tube model which gives analytic solutions.
• Analysis for both co- and counter-current imbibition has been made for non-circular
tubes. Task 9 • Reservoir cores which show significant response to injection of low salinity brine have been
identified.