fundamentals of ionized gases volume 1183 (basic topics in plasma physics) || complex plasmas,...
TRANSCRIPT
359
6
Complex Plasmas, Including Atmospheric Plasmas
6.1
Single Cluster or Particle in an Ionized Gas
6.1.1
Characteristics of a Complex Plasma
According to its definition, a complex plasma is an ionized gas with small particlesin it [1–5]. The characteristic feature of this system is that particles are sinks forelectrons and ions, and hence the presence of particles in a plasma may changeits properties. There are various types of complex plasma. Atmospheric air is anaerosol plasma, and aerosol particles (or aerosols) in air may be of various types andof various sizes in the range 0.01�100 μm. In particular, water aerosols are found ataltitudes of a few kilometers and are responsible for electric processes in the atmo-sphere [6, 7]; below we consider this problem in detail. Tropospheric aerosol parti-cles are formed near the Earth’s surface as a result of natural processes and humanactivity. These aerosols are made up of SO2, NH3, NOx , and mineral salts and othercompounds that result from natural processes on the Earth’s surface and may reachhigh altitudes. The smallest aerosols, Aitken particles [8, 9] of sizes 10�100 nm arepresent at high altitudes above clouds. Scattering of sunlight by Aitken particlesdetermines the blue color of the sky, and Aitken particles are partially responsiblefor interaction of solar radiation with the Earth’s atmosphere [6, 7]. The numberdensity of Aitken particles at optimal altitudes is 102�104 cm�3 [10, 11], and theypartake in atmospheric chemical reactions at high altitudes.
Let us consider the atmospheric plasma from another standpoint. The basis ofthis plasma is the solar wind – a flux of plasma that is emitted by the Sun’s coro-na [12, 13]. Encountering dust generated by a cold condensed system, the solarwind forms a dusty plasma, and the number density of charged particles in thisplasma exceeds by several orders of magnitude that in the solar wind. In this waythe dusty plasma of Saturn’s rings is formed, and the dusty plasma of comet tailsresults from the same processes. Magnetic fields are of importance for the prop-erties of dusty plasmas in the solar system. The long lifetime of trapped ions nearcharged dust particles leads to an increased number density of ions, which forcomet tails is 103–104 cm�3 [13–15] and exceeds that in the solar wind, whereas the
Fundamentals of Ionized Gases, First Edition. Boris M. Smirnov.© 2012 WILEY-VCH Verlag GmbH & Co. KGaA. Published 2012 by WILEY-VCH Verlag GmbH & Co. KGaA.
360 6 Complex Plasmas, Including Atmospheric Plasmas
electron temperature Te � 104 K [13, 15–17] corresponds to that of the solar wind.In this manner other types of dusty plasma are formed in the solar system [18–22].In particular, interaction of the solar wind, a flux of plasma emitted by the Sun’scorona [12, 13], with dust from the rings of Jupiter and Saturn leads to formationof a specific dusty plasma [23–26]. A similar type of dusty plasma corresponds tocomet tails [27, 28], and the properties of this plasma are determined by interactionof comet dust with the solar wind [29]. A laboratory dusty plasma is formed in atrap, usually near the cathode of radio-frequency discharge or inside striations ofglow discharge. A strong impetus for study of the laboratory dusty plasma was thediscovery of ordered structures formed by particles of identical size in a trap [30–33]. This fact testifies to the self-consistency of a dusty plasma as a physical system.This allowed the laboratory dusty plasma to be considered as a specific physicalobject [34–38]. A detailed study of the laboratory dusty plasma paves the way forapplications of this plasma [4, 39].
A cluster plasma is an ionized gas containing nanosized clusters [40–42]. Thisplasma differs from a dusty plasma not only by particle sizes, but also by the pro-cesses which occur this system. Indeed, clusters may grow or evaporate in a clusterplasma, that is, the nucleation and evaporation processes are of importance for acluster plasma. Below we will be guided by a cluster plasma consisting of a buffergas (e.g., argon) and a metal vapor with a low concentration of metal atoms. Thisplasma may be used for transport of heatproof metals and as a light source. Weconsider below some aspects of complex plasmas.
We mostly consider the behavior of an individual nanocluster or microparticlein ionized gas. We use the liquid drop model for a cluster [43] to identify it as aspherical liquid drop that is cut out from a bulk system. Within the framework ofthis model, the principal property of a cluster as a physical object due to magicnumbers [44–51] is lost, so nanoclusters and microparticles become identical. Thismodel corresponds to averaging a cluster property under consideration of nearbysizes, which simplifies the analysis a certain cluster property. Therefore, we consid-er now the behavior of individual clusters or particles in a gas. In this context, thebehavior of a probe in an ionized gas [52–56] and satellites in the atmosphere [57]has an analogy with the properties of individual nanoclusters and microparticles.
6.1.2
Transport Parameters of Clusters
In considering transport phenomena involving large clusters, it is convenient touse for a cluster the liquid drop model, according to which the cluster is cut out ofa bulk system and has spherical shape. Then the number densities of atoms in thecluster and the bulk liquid are identical, and the number of cluster atoms n and thecluster radius r0 are connected by (2.16), n D (r0/rW)3, where rW is the Wigner–Seitz radius [58, 59], which is given by (2.17) and its values are represented inTable 2.2. For large clusters r0 � a0, where a0 is a typical atomic size, the diffusioncross section of atom–cluster collisions is given by (2.18), σ� D πr2
0 . We have twolimiting cases for cluster transport in a gas depending on the relation between the

6.1 Single Cluster or Particle in an Ionized Gas 361
cluster radius r0 and the mean free path λ for atoms in a gas, and the mobility anddiffusion coefficient of clusters in gas for these cases are given by (2.19), (4.113),and (4.114).
The relaxation character of a cluster in a gas is connected to the large clustermass compared with the mass of an atom, and hence equilibrium of clusters witha gas results from many collisions with atoms of a gas. In particular, for a rarenessgas (2.19) represents the motion equation for a cluster in the form
dwd tD �νw ,
where w is the cluster velocity with respect to the gas in which it is located and ν isthe rate of relaxation. If the relaxation rate for gas atoms is determined by the rateof collisions with other atoms, that is, atom relaxation is determined by a singlecollision, many collisions are required for a cluster to change its velocity because ofthe large cluster mass. Hence, the rate of cluster relaxation decreases with increas-ing cluster size. In particular, within the framework of the liquid cluster model, forthe relaxation rate of a large cluster we have [60, 61]
ν D 8p
2πmT3nma
� Nar20 D
8Nar2W
p2πmT
3ma� n�1/3 , (6.1)
where m is the mass of a gas atom, ma is the mass of a cluster atom, and n is thenumber of cluster atoms.
Long relaxation of the cluster velocity if the cluster velocity differs from the meangas velocity is determined by the large cluster mass. This takes place in gas flowswith clusters where the gas velocity varies. In particular, we consider the spreadcase when clusters are in a gas flow in a tube of variable cross section as shownin Figure 6.1. Then the gas flow leaves the tube through an orifice and acquires avelocity cs of the order of the sound velocity near the orifice. Clusters in this flowdo not influence the character of this laminar flow, but in the case
�0
csν � 1
the drift velocity of clusters near the orifice is low compared with the flow velocitycs. In particular, in the case of a cylindrical tube and a conic exit, as shown in
Figure 6.1 The geometry of a cylindrical tube with a conic exit through which a gas with clusters
flows. R0 is the radius of the cylindrical tube, �0 is the orifice radius, and α is the conic angle.
362 6 Complex Plasmas, Including Atmospheric Plasmas
Figure 6.1, the drift velocity of clusters w near the orifice is [60, 61]
w D 2.68cs(ντ)2/3 , τ D �0
3cs tan α, (6.2)
where the relaxation rate ν is given by (6.1), τ is the time for variation of the flowvelocity, and α is the conic angle.
We consider also falling of a cluster or a particle under the action of their weight.Taking the case of a dense gas (6.5) and equalizing the weight to the resistive forcethat is given by the Stokes formula, we obtain the free-fall velocity w for a sphericalparticle of radius r0:
w D 2�gr20
9η, (6.3)
where g is the free-fall acceleration and η is the gas viscosity. In particular, for awater particle in air at atmospheric pressure and temperature T D 300 K, thisformula may be represented in the form
w D 0.0118r2
0
a2, (6.4)
where the velocity of the falling particle is given in centimeters per second anda D 1 μm. This formula holds true at small values of the Reynolds number Re Dv r/v � 1, where v D η/�g is the kinematic viscosity of the gas, and �g is the gasdensity. In the case of water drops in air this criterion is r0 � 30 μm.
6.1.3
Charging of Particles in a Dense Ionized Gas
When a cluster is in an ionized gas, electrons and ions may attach to its surface,which leads to cluster charging and also produces a sink for electrons and ions ofan ionized gas. In considering the process of cluster charging in an ionized gas,we will model clusters by a macroscopic spherical liquid drop (Section 2.1.3), soits radius is large compared with the distance of interaction between the clustersurface and atomic particles, and both large nanoclusters and microparticles areidentical in this consideration. Since a cluster is charged, a self-consistent field isformed near it that influences the equilibrium cluster charge and the distributionof electrons and ions near the cluster. We consider below charging processes foran isolated cluster in an ionized gas that determine the cluster charge and the self-consistent field near it.
For a dense buffer gas, when the criterion
r0 � λ (6.5)
holds true (λ is the mean free path of ions in a gas), we have the following expres-sion for the ion flux JC(R) toward the cluster, which is the total number of positive

6.1 Single Cluster or Particle in an Ionized Gas 363
ions crossing a sphere of a radius R around a cluster per unit time:
JC D 4πR2��DC
dNCdR
C KCE NC�
, (6.6)
where we ignore the cluster field screening by a surrounding plasma, so the electricfield strength acting on an ion from the charged cluster is E D Z e/R2, NC(R) isthe current number density of positive ions with electron charge e, DC and KC arethe diffusion coefficient and the mobility of positive ions, and�jZ je is the negativecluster charge. The first term in this expression corresponds to diffusive motion,the second term relates to ion drift.
If outside the cluster there is no recombination involving positive ions, (6.6) maybe considered as the equation for the ion number density in this region. Assumingthat a positive ion transfers its charge to the cluster as a result of contact with thecluster surface, we have the boundary condition N(r0) D 0. Another boundary con-dition far from the cluster is N(1) D N0, (N0 is the equilibrium number density ofatomic ions in an ionized gas). The latter means that attachment of electrons andions to clusters does not violate the ionization balance in this plasma. Assumingthe electric field of the cluster to be relatively small, we use the Einstein relationKC D eDC/T between the ion mobility KC and diffusion coefficient DC, where Tis the ion temperature. This leads to the following equation for the number densityNC(R) of positive ions:
JC D �4πR2DCe�
dNCdR
� Z e2NCT R2
�.
Solution of this equation with the boundary condition NC(r0) D 0 gives
NC(R) D JC4πDC
rZr0
dR 0
(R 0)2 exp�
Z e2
T R 0 �Z e2
T R
�
D JCT4πDCZ e2
�exp
�Z e2
Tr0� Z e2
T R
�� 1
�.
Applying the boundary condition NC(1) D N0 far from the cluster leads to theFuks formula [62] for the total rate of ion attachment to the cluster surface:
JC D 4πDCN0Z e2
T˚exp
�Z e2/(Tr0)
� � 1� . (6.7)
In the limiting case Z ! 0, the Fuks formula (6.7) is transformed into the Smolu-chowski formula for the diffusive flux J0 of neutral atomic particles to the surfaceof an absorbed sphere of radius r0 [63]:
J0 D 4πDCN0r0 . (6.8)
We now consider the case of different signs of the particle and ion, in particu-lar, the positive ion current goes to a negatively charged particle. Then replacing

364 6 Complex Plasmas, Including Atmospheric Plasmas
Z ! �Z in the Fuks formula (6.7), we obtain for the rate of attachment of posi-tively charged ions (electrons) to a negatively charged cluster
J� D � 4πD�N0Z e2
T �h1 � exp
� Z e2
Tr0
i . (6.9)
In the limit Z e2/(r0T ) � 1 this formula is transformed into the Langevin formu-la [64]:
J� D 4πZ e2D�T
D 4πZ eK�N0 . (6.10)
Let us find the charge Z of a cluster in an ionized gas with positive ions andelectrons as charged atomic particles. Equalizing the rates of attachment of positiveions and electrons to the cluster surface, we obtain the following expression for theequilibrium cluster charge:
Z D r0Te2 ln
DCNCD�N�
D r0Te2 ln
KCNCK�N�
, (6.11)
where NC, and N� are the number densities of positive ions and electrons farfrom the cluster. In a quasineutral plasma, NC D N�, the currents of positive ionsand electrons given by (6.7) and (6.9) are equal. For the cluster equilibrium chargethis yields
Z D r0Te2
lnDCD�D r0T
e2ln
KCK�
. (6.12)
We also consider the case of a nonequilibrium plasma consisting of electrons andpositive ions if Te � Ti. Then (6.11) takes the form
Z D � r0Te
e2ln
Ke
Ki,
where Ke and Ki are the mobilities of electrons and ions in a buffer gas. Note that ina gas discharge plasma the electron distribution function differs from the Maxwellone, and the electron temperature is not a characteristic of a Maxwell distributionof electrons, but it is introduced as Te D eDe/Ke.
In deriving the Fuks formula, we assume the electric field of the cluster E DZ e/r2
0 is weak near the cluster surface, which gives
eE λ � Z e2
r20
λ � T .
Since Z e2/r0 � T , this condition gives λ � r0, which is the criterion for a denseionized gas. In addition, the Fuks formula (6.7) is valid under the criterion
r0 � e2
T. (6.13)

6.1 Single Cluster or Particle in an Ionized Gas 365
Because in this case the average cluster charge jZ j is large, in spite of the stepwisecharacter of attachment of electrons and ions to the cluster surface, this processmay be considered as a continuous one.
Below we find the rate of charge relaxation to the average charge and the particlecharge distribution function in the stationary case assuming a typical cluster chargeto be large. We assume that the plasma consists of positive and negative ions withsimilar diffusion coefficients DC and D� in a buffer gas. Introducing the meandiffusion coefficient of ions D D (DC C D�)/2 and the difference ΔD D jDC �D�j, which is relatively small, ΔD � D , we reduce (6.12) for the average particlecharge to the form
Z0 D r0Te2� ΔD
D.
The equation of cluster charging has a simple form in this case,
dZd tD e( J� � JC) D Z0 � Z
τ,
and the time τ for establishment of the equilibrium cluster charge is given by
1τD 4πN0e2D
TD 2πΣ , (6.14)
where Σ D N0e(KCC K�) D 2N0e2D/T is the conductivity coefficient of the ion-ized gas. The solution of the charging equation in this case at the initial conditionZ(0) D 0 has the form
Z D Z0(1� e�t/τ) ,
and as is seen, a typical time for establishment of the equilibrium cluster chargedoes not depend on the cluster radius.
6.1.4
The Charge Distribution Function for Clusters
We now find the charge distribution function for clusters f (Z ) taking into accountthat as a result of ion attachment, the charge varies by one unit. This leads to thefollowing kinetic equation for the charge distribution function:
f (Z )[ JC(Z )C J�(Z )] D f (Z � 1) JC(Z � 1)C f (Z C 1) J�(Z C 1) ,
where JC(Z ) is the rate (the probability per unit time) for the cluster charge tochange from Z to Z C 1 as a result of attachment of positive ions to a clusterand, correspondingly, J�(Z ) is the rate for the cluster charge to change from Z toZ�1 due to attachment of negative ions to a cluster. It is convenient to reduce (6.7)and (6.9) for charging rates to the form
JC(Z ) D 4πDCN0r0Z xexp(Z x )� 1
, J�(Z ) D 4πD�N0r0Z x1� exp(�Z x )
, x D e2
r0T.

366 6 Complex Plasmas, Including Atmospheric Plasmas
Substituting these expressions into the above kinetic equation for the charge dis-tribution function of clusters, we reduce the kinetic equation to the form�
DC C D� exp(Z x )�
Z xexp(Z x ) � 1
f (Z ) D DC(Z � 1)xexp[(Z � 1)x ] � 1
f (Z � 1)
C D�(Z C 1)xexp[(Z C 1)x ] � 1
f (Z C 1) . (6.15)
This kinetic equation may be used for determination of the charge distributionfunction for clusters. We consider first the case when along with criterion (6.5), thecriterion x � 1 holds true, which is inverse with respect to criterion (6.13). In thiscase clusters are mostly neutral, and a small number of clusters have charge Z D˙1, whereas the probability for a cluster having charge jZ j � 2 is exponentiallysmall. Indeed, from the kinetic equation (6.15) it follows that
f (2)f (1)D DC(e2x � 1)
2(DC C D�e2x )(ex � 1)D DC
2D�e�x ,
where f (Z ) with Z � 2 is exponentially small. The same conclusion relates toZ � �2. This allows us to restrict our attention to neutral and singly charged ions.We have f (0) 1, and from (6.14) we have
f (1)f (0) f (1) D DC(ex � 1)
(DC C D�ex )xD DC
D�x,
f (�1)f (0)
f (�1) D D�(ex � 1)(D� C DCex )x
D D�DCx
.
From this we find for the average charge of particles
Z D f1 � f�1 DD2
C � D2�DCD�x
.
In the case DC � D� D ΔD � DC, this formula gives Z D 2ΔD/(D x )� 1.We now consider the case when criterion (6.5) holds true along with criteri-
on (6.13). It is convenient to introduce a new variable z D x Z , and because Zis a whole number and x � 1, this variable is taken to be continuous. Then werepresent the kinetic equation (6.15) in the form
� f (z)[DCF(z)C D�F(z)ez ]C f (z � x )DCF(z � x )
C f (z C x )D�F(z C x )ezCx D 0 ,
where
F(z) D zez � 1
.
Expanding this equation over the small parameter x � 1 and accounting for thefirst two expansion terms, we reduce the kinetic equation to the form
ddz
��DCD�� ez
�f (z)F(z)
�� x
2d2
dz2
��DCD�C ez
�f (z)F(z)
�D 0 . (6.16)
6.1 Single Cluster or Particle in an Ionized Gas 367
We first consider the case DC D D� when the average cluster charge is zero andthe distribution function is an even function of z and the kinetic equation for thecharge distribution function for clusters takes the form
ddz
[z f (z)]C x2
d2
dz2
�ez C 1ez � 1
z f (z)�D 0 .
For small values of z that determine the normalization of the charge distributionfunction, this kinetic equation takes the form
d[z f (z)]dz
C xd2 f (z)
dz2 D 0 .
Solving this equation taking into account the symmetry of the charge distributionfunction f (z) D f (�z) and the boundary condition f (1) D 0, we obtain
f (z) D C exp�� z2
2x
�.
Returning to the cluster charge Z as a variable for the distribution function andnormalizing the distribution function, we obtain
f (Z ) Dr
x2π
exp��Z2x
2
�.
In the general case, when D� ¤ DC, we obtain for the charge distribution func-tion for clusters
f (Z ) Dr
2πx
exp�� (Z � Z0)2x
2
�, (6.17)
where Z0 is the average cluster charge, and since x � 1, a typical particle chargeZ � 1.
6.1.5
Charging of Clusters or Particles in a Rare Ionized Gas
We now consider the kinetic regime of cluster charging where criterion r0 � λis fulfilled and the problem of cluster charging is reduced to pairwise collisions ofelectrons and ions with the cluster. Assuming that each contact of a colliding ionor electron with the cluster surface leads to transfer of its charge to the cluster, wefind the cross sections of collisions where the distance of closest approach rmin ofcolliding particles does not exceed the cluster radius r0. The cross section of ioncontact with the cluster surface, if the cluster charge Z has the same sign as that ofcolliding ion, in the classical case is
σ D πr20
�1� Z e2
r0ε
�, ε � Z e2
r0.
368 6 Complex Plasmas, Including Atmospheric Plasmas
In the case of different signs of charges for the colliding ion and cluster, this crosssection is
σ D πr20
�1C jZ je
2
r0ε
�, ε � 0 .
For a Maxwell distribution function for ions this gives for the rate constant forcluster charging when each contact leads to charge transfer and the same sign ofcluster and ion charges
k D hv σi D k0
1Zx
t d t exp(�t)
1� xt
D k0e�x , t D ε
T,
x D jZ je2
r0T, k0 D
s8Tπmi
πr20 , (6.18)
where mi is the ion mass, k0 is the rate constant for ion collision with a neutralcluster when this collision leads to their contact, and T is the ion temperature. Fordifferent signs of charges of colliding particles the rate constant for their contactaveraged over the Maxwell distribution function for ions is given by
k D k0
1Z0
t d t exp(�t)
1C xt
D k0(1C x ) . (6.19)
One can combine these formulas for the rates of cluster charging by introducingthe probability � that the ion transfers its charge to the cluster as a result of theircontact [65]:
J> D � k0Ni � (1C x ) , J< D � k0Ni � exp(�x ) . (6.20)
Here Ni is the number density of ions and the rates J> and J< relate to differentand identical signs of ion and cluster charges.
Let us find on the basis of these rates the equilibrium cluster charge in a nonequi-librium plasma consisting of electrons and ions with different electron Te and ionTi temperatures. Then equalizing the rates of attachment of electrons and ions tothe cluster surface, we obtain for the equilibrium cluster charge Z D �jZ j of aquasineutral plasma
jZ j D r0Te
e2ln
"smiTe
me Ti
�1C jZ je
2
r0Ti
��1#
,
where me and mi are the electron and ion masses. Let us rewrite this formula interms of the reduced cluster charge x D jZ je2/(r0Te) D jZ je2/(rW n1/3Te) (rW isthe Wigner–Seitz radius):
x D"
ln
s�miTe
meTi
�� ln
�1C x
Te
Ti
�#, jZ j D x
r0Te
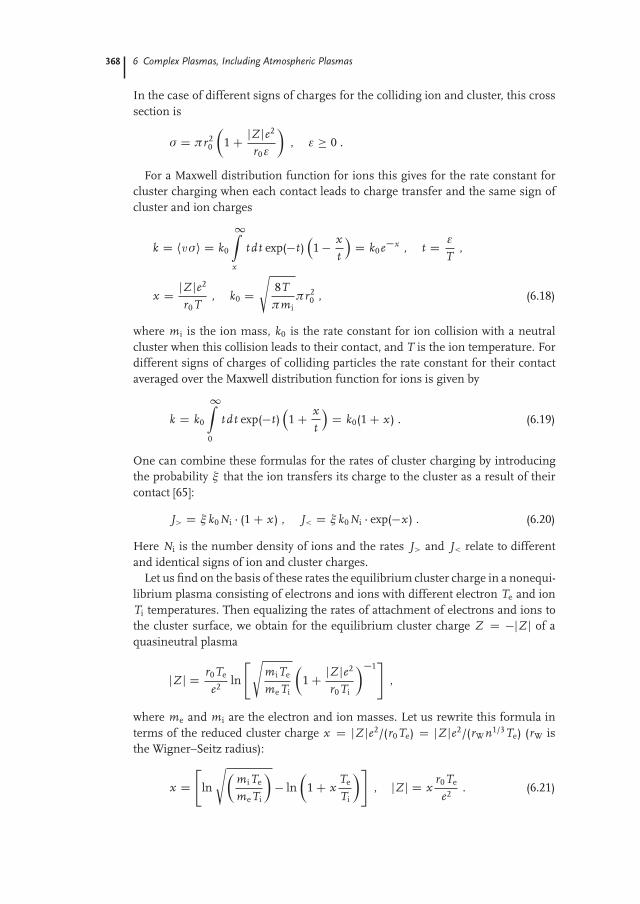
e2. (6.21)
6.1 Single Cluster or Particle in an Ionized Gas 369
In particular, for an argon plasma and temperatures Te D 2 eV and Ti D 400 K ofelectrons and ions, this formula gives x D 2.6, which leads to the particle chargeZ D �4 103 e for the particle radius r0 D 1 μm.
Formula (6.21) holds true in the limit jZ j � 1 if a change of cluster charge byone leads to a small variation of the electron and ion fluxes. In particular, in thecase of identical electron and ion temperatures (Ti D Te), this formula gives
x D ln�
11C x
rmi
me
�. (6.22)
Table 6.1 gives the solution of this equation for a quasineutral ionized inert gas(and nitrogen) with positive atomic ions (and NC
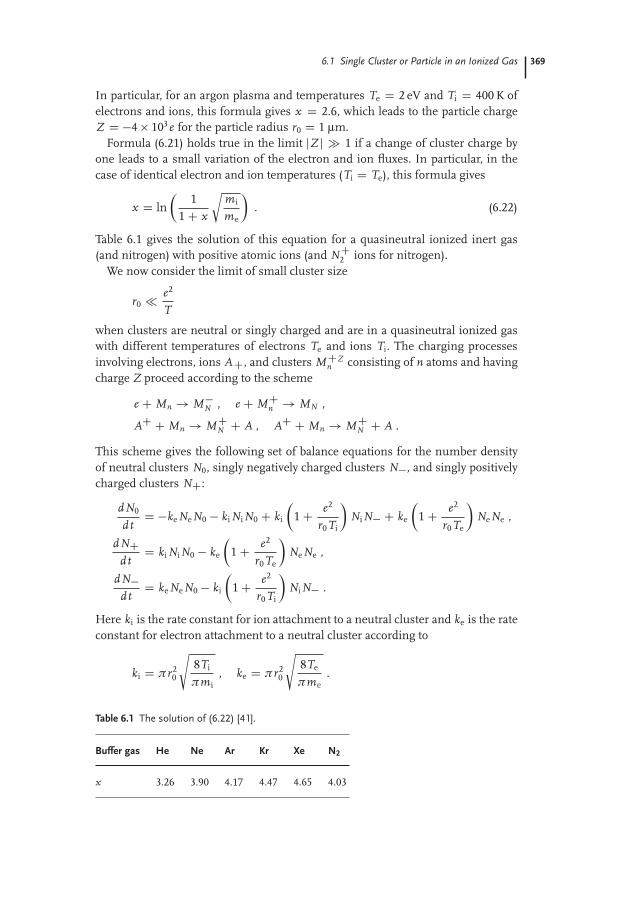
2 ions for nitrogen).We now consider the limit of small cluster size
r0 � e2
T
when clusters are neutral or singly charged and are in a quasineutral ionized gaswith different temperatures of electrons Te and ions Ti. The charging processesinvolving electrons, ions AC, and clusters MCZ
n consisting of n atoms and havingcharge Z proceed according to the scheme
e C Mn ! M�N , e C MC
n ! MN ,
AC C Mn ! MCN C A , AC C Mn ! MC
N C A .
This scheme gives the following set of balance equations for the number densityof neutral clusters N0, singly negatively charged clusters N�, and singly positivelycharged clusters NC:
dN0
d tD �ke NeN0 � ki NiN0 C ki
�1C e2
r0Ti
�NiN� C ke
�1C e2
r0Te
�NeNe ,
dNCd tD ki NiN0 � ke
�1C e2
r0Te
�Ne Ne ,
dN�d tD ke Ne N0 � ki
�1C e2
r0Ti
�NiN� .
Here ki is the rate constant for ion attachment to a neutral cluster and ke is the rateconstant for electron attachment to a neutral cluster according to
ki D πr20
s8Ti
πmi, ke D πr2
0
s8Te
πme.
Table 6.1 The solution of (6.22) [41].
Buffer gas He Ne Ar Kr Xe N2
x 3.26 3.90 4.17 4.47 4.65 4.03

370 6 Complex Plasmas, Including Atmospheric Plasmas
Correspondingly, the rate constants for neutralization of a singly negatively chargedcluster in collisions with ions k�1,0 and the rate constants for neutralization of asingly positively charged cluster in collisions with electrons kC1,0 are given by
k�1,0 D ki
�1C e2
r0Ti
�, kC1,0 D ke
�1C e2
r0Te
�.
The rate constant for electron attachment to a negatively charged cluster containsan additional factor, exp(�e2/(r0Te)), and the rate constant for ion attachment to apositively charged cluster contains the factor exp(�e2/(r0T )), and therefore theseprocesses are weak. Next, the ratios of the number densities of neutral N0, nega-tively charged N� and positively charged NC clusters are equal depending on theplasma parameters:
N�N0D ke Ne
kiNi
1C e2
r0Ti
,NCN0D kiNi
ke Ne
1C e2
r0 Te
,
NCN�D�
ke Ne
ki Ni
�2
1C e2
r0 Te
1C e2
r0Ti
.
6.1.6
Ionization Equilibrium for Large Dielectric Clusters
The character of the ionization equilibrium for a dielectric cluster in an ionizedgas is determined by the properties of the cluster surface. Each dielectric particleor cluster has on its surface traps for electrons that we call active centers. Electronsare captured by these centers, and this leads to the formation of negative ions at cer-tain points on the cluster surface. The ionization equilibrium of a dielectric clusterin a plasma corresponds to the equilibrium of these bound negative ions and freeplasma electrons. Although bound electrons can transfer between neighboring ac-tive centers, this process proceeds slowly. The ionization equilibrium in this caseresults from detachment of bound negative ions on the cluster surface by electronimpact and the capture of electrons by active centers of the cluster surface.
Thus, metal and dielectric clusters are characterized by different charging pro-cesses in ionized gases. In the case of a metal cluster, valence electrons are locatedover the entire cluster volume, whereas they form negative ions on the surface ofdielectric clusters. Ionization of metal clusters at high temperatures results fromcollision of internal electrons that leads to the formation of fast electrons whichare capable of leaving the cluster surface. This thermoemission process and attach-ment of plasma electrons to the cluster surface determine the ionization balance forclusters which have a positive charge at high temperatures and a negative chargeat low temperatures. The electron binding energy for a large metal cluster tends tothe work function of a bulk metal. Dielectric clusters are negatively charged sincetheir ionization potential greatly exceeds their electron affinity.
Let us consider the diffusion regime of charging of dielectric clusters if the meanfree path of ions and electrons in a buffer gas is small compared with the cluster
6.1 Single Cluster or Particle in an Ionized Gas 371
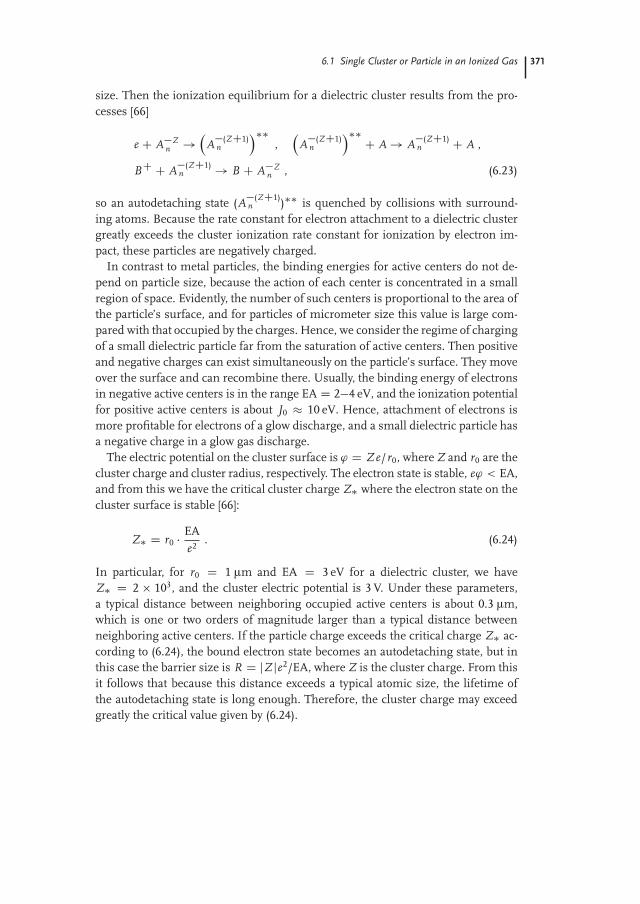
size. Then the ionization equilibrium for a dielectric cluster results from the pro-cesses [66]
e C A�Zn !
A�(ZC1)
n
��,
A�(ZC1)
n
�� C A! A�(ZC1)n C A ,
BC C A�(ZC1)n ! B C A�Z
n , (6.23)
so an autodetaching state (A�(ZC1)n )�� is quenched by collisions with surround-
ing atoms. Because the rate constant for electron attachment to a dielectric clustergreatly exceeds the cluster ionization rate constant for ionization by electron im-pact, these particles are negatively charged.
In contrast to metal particles, the binding energies for active centers do not de-pend on particle size, because the action of each center is concentrated in a smallregion of space. Evidently, the number of such centers is proportional to the area ofthe particle’s surface, and for particles of micrometer size this value is large com-pared with that occupied by the charges. Hence, we consider the regime of chargingof a small dielectric particle far from the saturation of active centers. Then positiveand negative charges can exist simultaneously on the particle’s surface. They moveover the surface and can recombine there. Usually, the binding energy of electronsin negative active centers is in the range EA D 2�4 eV, and the ionization potentialfor positive active centers is about J0 10 eV. Hence, attachment of electrons ismore profitable for electrons of a glow discharge, and a small dielectric particle hasa negative charge in a glow gas discharge.
The electric potential on the cluster surface is ' D Z e/r0, where Z and r0 are thecluster charge and cluster radius, respectively. The electron state is stable, e' < EA,and from this we have the critical cluster charge Z� where the electron state on thecluster surface is stable [66]:
Z� D r0 � EAe2
. (6.24)
In particular, for r0 D 1 μm and EA D 3 eV for a dielectric cluster, we haveZ� D 2 103, and the cluster electric potential is 3 V. Under these parameters,a typical distance between neighboring occupied active centers is about 0.3 μm,which is one or two orders of magnitude larger than a typical distance betweenneighboring active centers. If the particle charge exceeds the critical charge Z� ac-cording to (6.24), the bound electron state becomes an autodetaching state, but inthis case the barrier size is R D jZ je2/EA, where Z is the cluster charge. From thisit follows that because this distance exceeds a typical atomic size, the lifetime ofthe autodetaching state is long enough. Therefore, the cluster charge may exceedgreatly the critical value given by (6.24).

372 6 Complex Plasmas, Including Atmospheric Plasmas
6.2
Particle Fields in an Ionized Gas
6.2.1
Self-Consistent Particle Field in a Rare Ionized Gas
If a micrometer-sized particle is inserted in an ionized gas, it creates a large field insome region, so the particle potential energy U(R) in this region exceeds a thermalenergy of electrons and ions. Since ions provide the main contribution to screeningof the particle field, we define the dimension l of the particle field as
jU(l)j � Ti , (6.25)
where Ti is the ion temperature. We now consider a rareness gas when this dimen-sion is small compared with the mean free path of ions λ in this gas:
l � λ . (6.26)
We assume that the presence of particles in a gas does not influence the ionizationbalance in the gas, and the number density of electrons and ions far from the par-ticle is equal to the equilibrium number density N0 that is realized in the absenceof particles. Next, the number density of electrons in the particle field is lower thanthat far from the particle, whereas near the particle the ion number density ex-ceeds the equilibrium one N0 remarkably. Hence, we ignore below the influenceof electrons on particle field screening. In addition, the screening of the particlefield influences weakly the particle charge, which follows from the equality of theelectron and ion fluxes to the particle surface, and these fluxes originate far fromthe particle where its field does not act.
In considering the distribution of free ions in the particle field, we use the er-godic theorem [67–69]: the probability dPi for a particle to be in a distance rangebetween R and R C dR from the particle is proportional to the time d t duringwhich an ion is found in this region. We have from the ion motion equation [70]
d t D dRvRD dR
vp
1 � �2/R2 � U(R)/ε,
where vR (R) is the normal component of the ion velocity in the particle field ata distance R from the particle center, v is the ion velocity far from the particle,ε D miv2/2 is the ion energy far from the particle, and � is the impact parameterfor ion motion with respect to the particle. From this within the framework ofstatistical mechanics [71–73] we have that the probability of ion location in a givenregion is proportional to a time of ion location in this region (dPi � d t) and isproportional to the number density of ions Ni(R) � dPi . From this we have for thenumber density of ions
Ni(R) D C
R�d�dPi
4πR2dRD N0
�(R)Z0
�d�q1 � �2
R2 � U(R)ε
, (6.27)
6.2 Particle Fields in an Ionized Gas 373
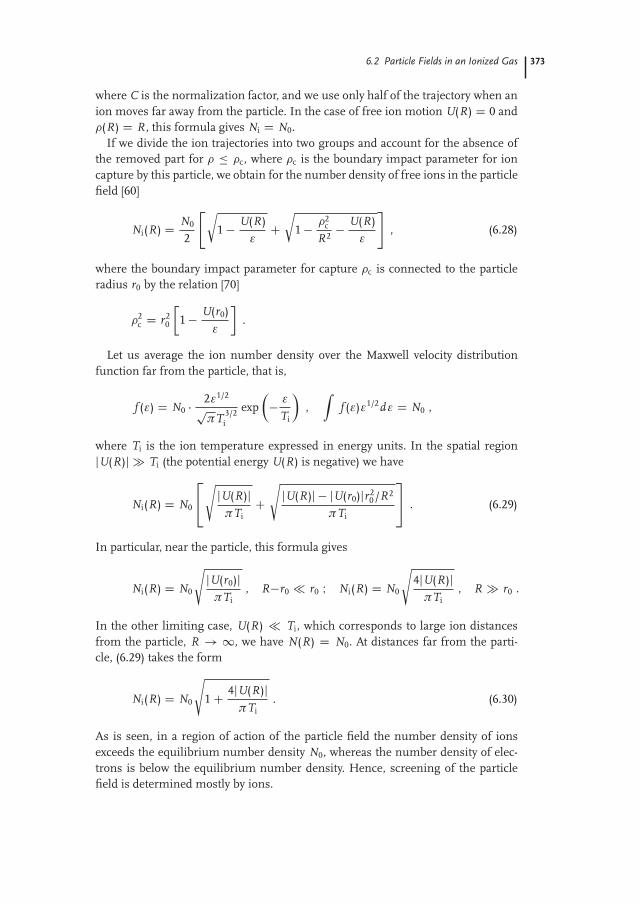
where C is the normalization factor, and we use only half of the trajectory when anion moves far away from the particle. In the case of free ion motion U(R) D 0 and�(R) D R , this formula gives Ni D N0.
If we divide the ion trajectories into two groups and account for the absence ofthe removed part for � � �c, where �c is the boundary impact parameter for ioncapture by this particle, we obtain for the number density of free ions in the particlefield [60]
Ni(R) D N0
2
"r1 � U(R)
εCr
1� �2c
R2 �U(R)
ε
#, (6.28)
where the boundary impact parameter for capture �c is connected to the particleradius r0 by the relation [70]
�2c D r2
0
�1� U(r0)
ε
�.
Let us average the ion number density over the Maxwell velocity distributionfunction far from the particle, that is,
f (ε) D N0 � 2ε1/2
pπT 3/2
i
exp�� ε
Ti
�,
Zf (ε)ε1/2dε D N0 ,
where Ti is the ion temperature expressed in energy units. In the spatial regionjU(R)j � Ti (the potential energy U(R) is negative) we have
Ni(R) D N0
24s jU(R)jπTi
CsjU(R)j � jU(r0)jr2
0/R2
πTi
35 . (6.29)
In particular, near the particle, this formula gives
Ni(R) D N0
sjU(r0)j
πTi, R�r0 � r0 I Ni(R) D N0
s4jU(R)j
πTi, R � r0 .
In the other limiting case, U(R) � Ti, which corresponds to large ion distancesfrom the particle, R ! 1, we have N(R) D N0. At distances far from the parti-cle, (6.29) takes the form
Ni(R) D N0
s1C 4jU(R)j
πTi. (6.30)
As is seen, in a region of action of the particle field the number density of ionsexceeds the equilibrium number density N0, whereas the number density of elec-trons is below the equilibrium number density. Hence, screening of the particlefield is determined mostly by ions.
374 6 Complex Plasmas, Including Atmospheric Plasmas
We now consider a nonequilibrium plasma when the electron and ion tempera-tures (Te and Ti) are different. Moreover, the energy distribution function for elec-trons differs from the Maxwell one, and its form is essential for the particle charge.Nevertheless, we introduce the electron temperature such that a real energy distri-bution of electrons provides the same flux of electrons on the particle surface and,correspondingly, the same particle charge, as takes place for the Maxwell electrondistribution with a given electron temperature. Screening of the particle field isdetermined by ions and therefore is independent of the electron distribution func-tion. Next, by analogy with (6.21) and (6.22), the particle charge in this case is givenby [37, 41]
jZ j D r0Te
2e2 ln�
Te mi
Time
�. (6.31)
Let us introduce the Coulomb field size R0:
jU(R0)j D jZ je2
R0D Ti , R0 � r0 ,
where
R0 D jZ je2
TiD r0 X , X D Te
2Tiln�
Te mi
Ti me
�, jZ j D TiR0
e2 . (6.32)
Let us apply this to a typical gas discharge plasma in argon with Te D 1 eV andTi D 400 K and where the particle radius is r0 D 1 μm. According to the aboveformulas, for this plasma we have jZ j D 5 103, X D 210, and R0 D 210 μm.The criterion for a rare plasma, if this plasma does not screen the particle field, isN0R3
0 � 1, which gives for these parameters N0 � 5 108 cm�3. As is seen, attypical number densities of electrons and ions in gas discharge this criterion is notfulfilled.
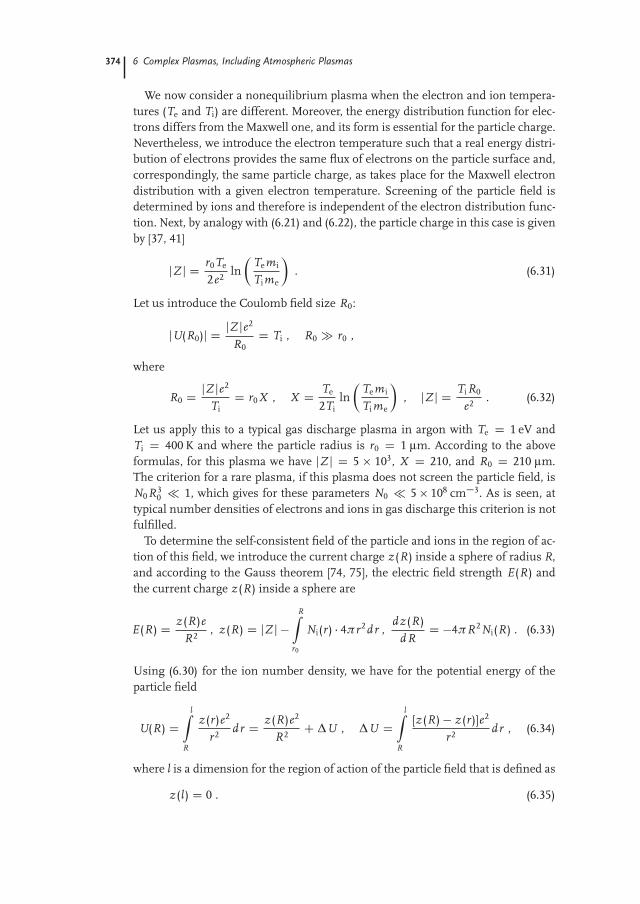
To determine the self-consistent field of the particle and ions in the region of ac-tion of this field, we introduce the current charge z(R) inside a sphere of radius R,and according to the Gauss theorem [74, 75], the electric field strength E(R) andthe current charge z(R) inside a sphere are
E(R) D z(R)eR2
, z(R) D jZ j �RZ
r0
Ni(r) � 4πr2dr ,dz(R)
dRD �4πR2Ni(R) . (6.33)
Using (6.30) for the ion number density, we have for the potential energy of theparticle field
U(R) DlZ
R
z(r)e2
r2 dr D z(R)e2
R2 C ΔU , ΔU DlZ
R
[z(R) � z(r)]e2
r2 dr , (6.34)
where l is a dimension for the region of action of the particle field that is defined as
z(l) D 0 . (6.35)
6.2 Particle Fields in an Ionized Gas 375
Let us restrict ourselves to the first expansion term for the potential energy of theparticle field U(R) D z(R)e2/R , which for the current charge gives
z D0@pjZ j � 8
pπ
5N0R5/2
se2
Ti
1A2
D jZ j"
1 ��
Rl
�5/2#2
(6.36)
and for the dimension of the self-consistent field gives
l D 0.66
N 2/50
� jZ jTi
e2
�1/5
D 0.66jZ j2/5
N 2/50 R1/5
0
. (6.37)
In particular, with the parameters in the above example (Te D 1 eV, Ti D 400 K,the particle radius is r0 D 1 μm) and for the number density of electrons and ionsN0 D 1010 cm�3 of an argon plasma, we find from this formula l D 43 μm, andfor N0 D 109 m�3 we obtain l D 108 μm. All these values are less than the size ofthe Coulomb particle field.
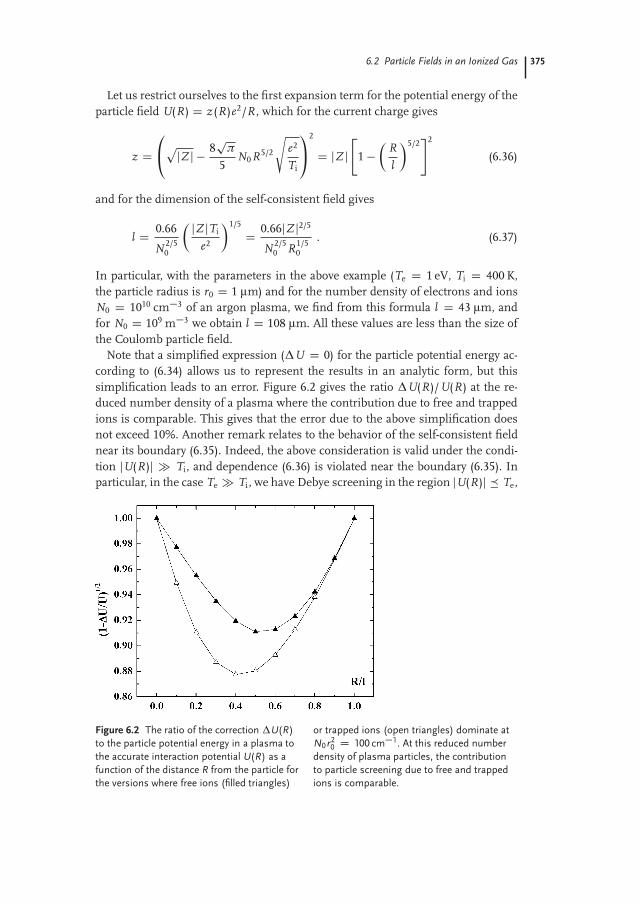
Note that a simplified expression (ΔU D 0) for the particle potential energy ac-cording to (6.34) allows us to represent the results in an analytic form, but thissimplification leads to an error. Figure 6.2 gives the ratio ΔU(R)/U(R) at the re-duced number density of a plasma where the contribution due to free and trappedions is comparable. This gives that the error due to the above simplification doesnot exceed 10%. Another remark relates to the behavior of the self-consistent fieldnear its boundary (6.35). Indeed, the above consideration is valid under the condi-tion jU(R)j � Ti, and dependence (6.36) is violated near the boundary (6.35). Inparticular, in the case Te � Ti, we have Debye screening in the region jU(R)j � Te,
Figure 6.2 The ratio of the correction ΔU(R)
to the particle potential energy in a plasma to
the accurate interaction potential U(R) as a
function of the distance R from the particle for
the versions where free ions (filled triangles)
or trapped ions (open triangles) dominate at
N0 r20 D 100 cm�1. At this reduced number
density of plasma particles, the contribution
to particle screening due to free and trapped
ions is comparable.
376 6 Complex Plasmas, Including Atmospheric Plasmas
which is
jU(R)j D z0e2
Rexp
�� R
rD
�,
where the Debye–Hückel radius rD is given by (1.9), and z0 follows from combiningthis formula and (6.36) in an intermediate region.
The criterion for gas rareness has the form
NaR0σ� � 1 ,
where σ� is the diffusion cross section of ion–atom scattering, which is assumedto be independent of the collision velocity. Because this ion scattering proceedsthrough the resonant charge exchange process, where an ion and an atom movealong straight trajectories, we have σ� D 2σres [179], so the criterion for gasrareness takes the form
2Na R0σres � 1 . (6.38)
In this case the electron and ion currents originate at distances of approximatelyλ from the particle where interaction of ions with the particle field is negligible.In particular, for the above example we have the cross section of resonant chargeexchange involving an argon atom and its ion to be σres D 83 Å2 at a collisionenergy of 0.01 eV [76]. Criterion (6.38) for argon pressure p takes the form
p � 1 Torr .
We now consider one more aspect of ion–cluster interactions. If a cluster or aparticle is moving in a rareness gas with a low velocity w compared with a thermalvelocity of atoms, the frictional force F is determined by atom scattering by thisparticle, and on the basis of (6.1) we have for this force
F D Naσ�vT � mw , vT D 43
r8Tπm
, (6.39)
where Na is the number density of gas particles, m is the mass of these atoms, thediffusion cross section of atom–particle scattering is σ� D πr2
0 (r0 is the particleradius), and the velocity vT is of the order of the average atom velocity. We nowconsider this problem from another standpoint: if a flux of ions passes through anionized gas containing particles. Then the frictional force for ions due to particles,the drag force [4]), by analogy with (6.39) is given by
F D Npσ�vT � mw , (6.40)
where Np is the number density of gas atoms and m is the ion mass. If an ion is notcaptured by the particle, it is scattered elastically, and the diffusion cross section ofthis scattering is σ� π l2 because of strong ion interaction with a self-consistentparticle field at distances R from its center, R < l . From this it follows that althoughthe number density of particles Np in an ionized gas is small, the large radius ofaction of its field (l � r0) may compensate for this smallness, and interaction ofions with particles may be of importance for their braking in an ionized gas.
6.2 Particle Fields in an Ionized Gas 377
6.2.2
Trapped Ions of Low-Density Plasma in a Particle Field
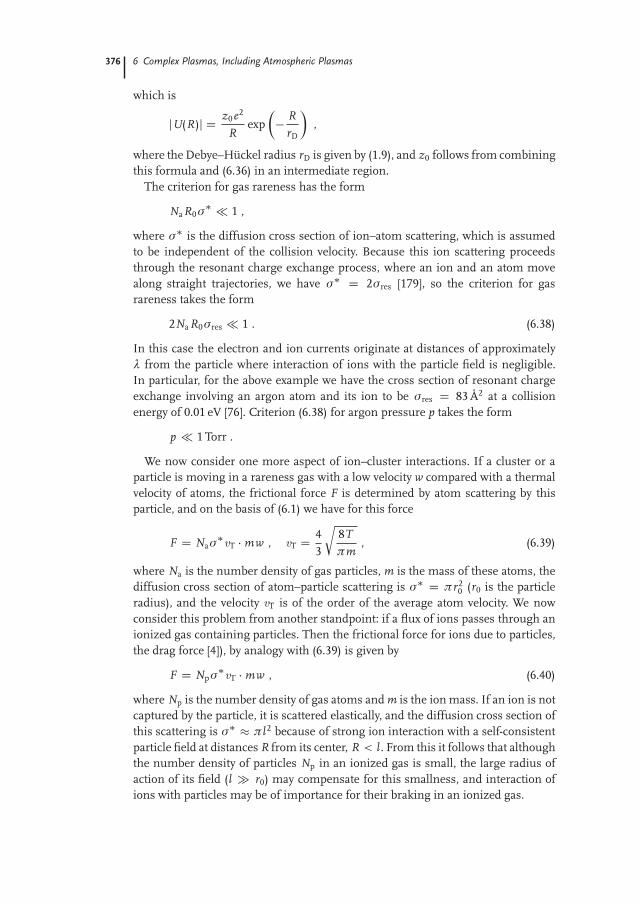
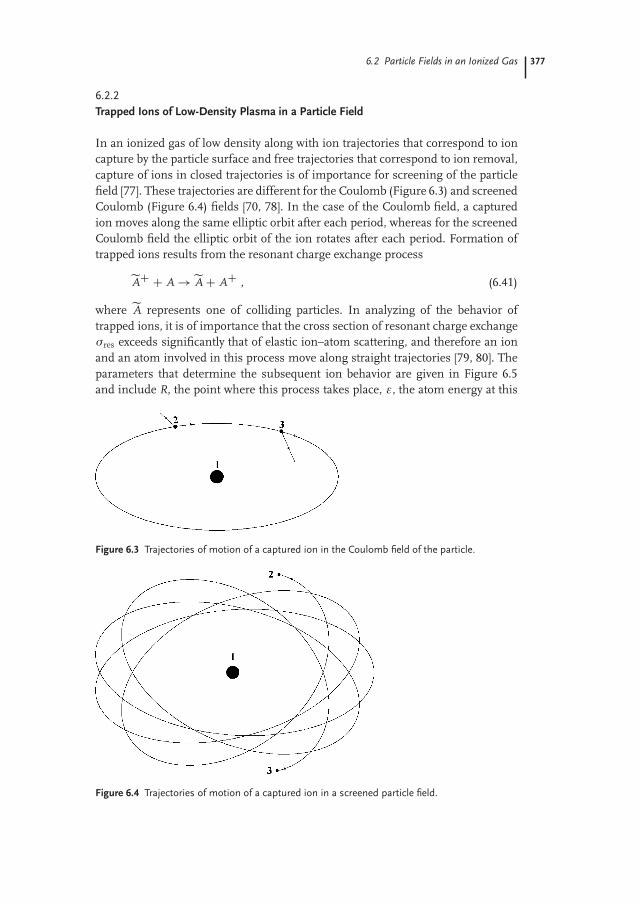
In an ionized gas of low density along with ion trajectories that correspond to ioncapture by the particle surface and free trajectories that correspond to ion removal,capture of ions in closed trajectories is of importance for screening of the particlefield [77]. These trajectories are different for the Coulomb (Figure 6.3) and screenedCoulomb (Figure 6.4) fields [70, 78]. In the case of the Coulomb field, a capturedion moves along the same elliptic orbit after each period, whereas for the screenedCoulomb field the elliptic orbit of the ion rotates after each period. Formation oftrapped ions results from the resonant charge exchange process
eAC C A! eAC AC , (6.41)
where eA represents one of colliding particles. In analyzing of the behavior oftrapped ions, it is of importance that the cross section of resonant charge exchangeσres exceeds significantly that of elastic ion–atom scattering, and therefore an ionand an atom involved in this process move along straight trajectories [79, 80]. Theparameters that determine the subsequent ion behavior are given in Figure 6.5and include R, the point where this process takes place, ε, the atom energy at this
Figure 6.3 Trajectories of motion of a captured ion in the Coulomb field of the particle.
Figure 6.4 Trajectories of motion of a captured ion in a screened particle field.
378 6 Complex Plasmas, Including Atmospheric Plasmas
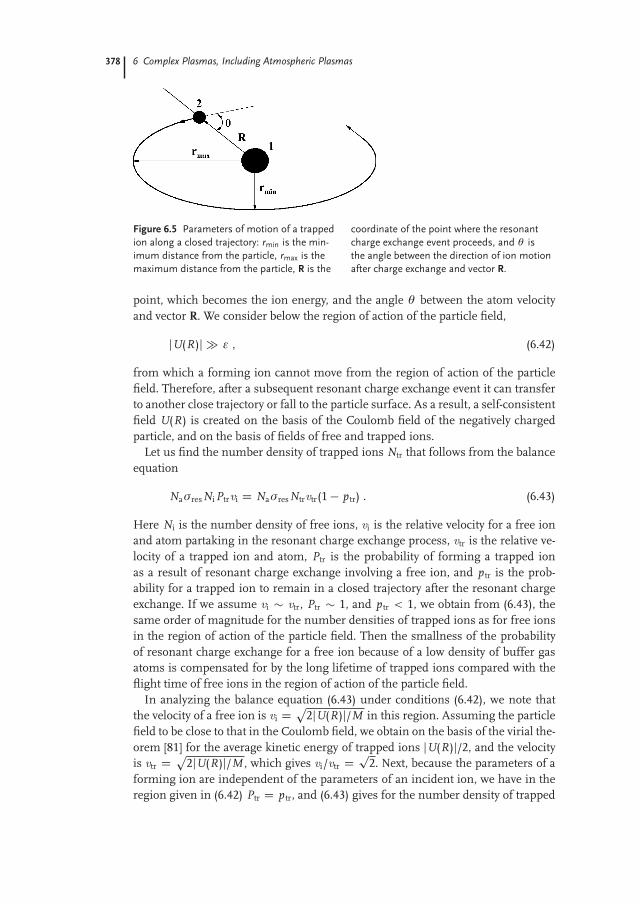
Figure 6.5 Parameters of motion of a trapped
ion along a closed trajectory: rmin is the min-
imum distance from the particle, rmax is the
maximum distance from the particle, R is the
coordinate of the point where the resonant
charge exchange event proceeds, and θ is
the angle between the direction of ion motion
after charge exchange and vector R.
point, which becomes the ion energy, and the angle θ between the atom velocityand vector R. We consider below the region of action of the particle field,
jU(R)j � ε , (6.42)
from which a forming ion cannot move from the region of action of the particlefield. Therefore, after a subsequent resonant charge exchange event it can transferto another close trajectory or fall to the particle surface. As a result, a self-consistentfield U(R) is created on the basis of the Coulomb field of the negatively chargedparticle, and on the basis of fields of free and trapped ions.
Let us find the number density of trapped ions Ntr that follows from the balanceequation
NaσresNiPtrvi D NaσresNtrvtr(1� p tr) . (6.43)
Here Ni is the number density of free ions, vi is the relative velocity for a free ionand atom partaking in the resonant charge exchange process, vtr is the relative ve-locity of a trapped ion and atom, Ptr is the probability of forming a trapped ionas a result of resonant charge exchange involving a free ion, and p tr is the prob-ability for a trapped ion to remain in a closed trajectory after the resonant chargeexchange. If we assume vi � vtr, Ptr � 1, and p tr < 1, we obtain from (6.43), thesame order of magnitude for the number densities of trapped ions as for free ionsin the region of action of the particle field. Then the smallness of the probabilityof resonant charge exchange for a free ion because of a low density of buffer gasatoms is compensated for by the long lifetime of trapped ions compared with theflight time of free ions in the region of action of the particle field.
In analyzing the balance equation (6.43) under conditions (6.42), we note thatthe velocity of a free ion is vi D
p2jU(R)j/M in this region. Assuming the particle
field to be close to that in the Coulomb field, we obtain on the basis of the virial the-orem [81] for the average kinetic energy of trapped ions jU(R)j/2, and the velocityis vtr D
p2jU(R)j/M , which gives vi/vtr D
p2. Next, because the parameters of a
forming ion are independent of the parameters of an incident ion, we have in theregion given in (6.42) Ptr D p tr, and (6.43) gives for the number density of trapped

6.2 Particle Fields in an Ionized Gas 379
ions
Ntr(R) D Ni(R) � Ptrp
2(1� Ptr)
.
Using the conservation laws for the energy and orbital momentum of a capturedion, we find that ion capture in a closed orbit is possible at R � pr0R0, and theprobability Ptr of ion capture in a closed orbit is
Ptr(R , ε) D p tr(R , ε) Dcos θ0Z0
d cos θ D cos θ0 Dr
1� r0R0
R2 , R �p
r0R0 ,
where θ0 is the boundary angle in Figure 6.5 at which rmin D r0. This gives for thenumber density of trapped ions in the region given in (6.42)
Ntr(R) D Ni(R)R2p
2r0R0
r1 � r0R0
R2
1C
r1� r0R0
R2
!, R �
pR0r0 .
One can include in this formula the probability for an ion to be removed from theparticle field if the interaction potential is relatively small. The probability Ptr ofcapture in a closed orbit is zero at the boundary of the region of the action of theparticle field, R D l , and we account for this fact by an additional factor 1 � R/ l .As a result, we obtain for the number density of trapped ions [82]
Ntr(R) D Ni(R)R2p
2r0R0
r1 � r0R0
R2
1C
r1� r0R0
R2
!��
1� lR
�,
R �p
R0r0 . (6.44)
We now analyze the screening of the particle field if it is created by trapped ions.Using like for free ions the current charge z(R) inside a sphere of radius R, replac-ing in (6.33) the number density of free ions by that of trapped ions, and repeatingthe operation in deduction (6.36), we obtain for the current charge z(R)
z(R) D24pjZ j � 16
pπ
9N0R5/2
r0R0
se2
Ti
�1� R
l
�Φ (R)
352
D jZ j"
1��
Rl
�9/2#2
, (6.45)
where
Φ (R) D 12
r1 � r0R0
R2
1C
r1� r0R0
R2
!, l D 1.05
� jZ jr0p
R0
N0Φ (9l/11)
�2/9
.
We assume a weak dependence, Φ (R), and take it at a distance where the integrandhas a maximum. One can find a small correction to the result by expansion over

380 6 Complex Plasmas, Including Atmospheric Plasmas
a small parameter 1 � Φ (R). Using the last formula for the above example of anargon dusty plasma (Te D 1 eV, Ti D 400 K, r0 D 1 μm), we obtain l D 36 μmfor the number density of electrons and ions N0 D 1010 cm�3, and l D 59 μm forN0 D 109 cm�3. Comparing these values with those in Section 6.2.1 for screeningby free ions, we conclude that trapped ions dominate in screening the particle fieldif the number densities of plasma electrons and ions is below N0 D 1010 cm�3.
We also can use these formulas for the criterion for plasma rareness if plasmaions do not screen the particle field. As for free ions, this criterion has the formN0 � N�, where l(N�) D R0. For the parameters in the example under considera-tion (Te D 1 eV, Ti D 400 K), we have from this
N0r20 � 0.03 cm�1 ,
which corresponds to N� D 3 106 cm�3 for particle radius r0 D 1 μm.In considering the case where trapped ions dominate in shielding of the parti-
cle field, we also give the expressions for the number density of free and trappedions in the particle field according to (6.30) and (6.44). Using a simplified formula,U(R) D z(R)e2/R , for the potential energy of the particle field and (6.45) for thecurrent charge z(R), we obtain for the number density of free Ni(R) and trappedNtr(R) ions at distance R from the particle [82]
Ni(R) D N0
vuut1C 4R0
πR
"1�
�Rl
�9/2#2
,
Ntr(R) D Ni(R) � 2R2p
2r0R0
Φ (R)�
1� Rl
�. (6.46)
In the case (6.36) where free ions dominate in screening of the particle field, wehave the following expressions for the number density of free and trapped ions onthe basis of (6.30) and (6.36) [82]:
Ni(R) D N0
vuut1C 4R0
πR
"1�
�Rl
�5/2#2
,
Ntr(R) D Ni(R) � 2R2p
2r0R0
Φ (R)�
1� Rl
�. (6.47)
On the basis of these limiting cases one can give a general algorithm for determi-nation of the parameters of a self-consistent field accounting for screening by bothfree and trapped ions. Indeed, the screening charges due to free Q i and trappedQ tr ions are given by the relations
Q i DlZ
r0
4πNi(R)R2dR , Q tr DlZ
pr0R0
4πNtr(R)R2dR ,
6.2 Particle Fields in an Ionized Gas 381
and according to the definition of the dimension l of the particle field region wehave
Q D Q i C Q tr D jZ j . (6.48)
Using this relation as the equation for l, we introduce the part of the screeningcharge � that is created by trapped ions as
� D Q tr
Q i C Q tr. (6.49)
In evaluating these parameters of the particle field screening we use (6.46) or (6.47)for the number densities of free and trapped ions. Note that in the range of compe-tition of these screening channels, the difference in the results for these versionsis not remarkable. In particular, for the above example of the argon dusty plas-ma (Te D 1 eV, Ti D 400 K, r0 D 1 μm) at N0 D 1010 cm�3 the contribution oftrapped ions to the particle screening is � D 0.40 and � D 0.43, respectively, if weuse (6.46) or (6.47) for the number densities of free and trapped ions, and the size lof the particle field is 30 μm and 31 μm, respectively, for these cases.
The above formulas exhibit the scaling law according to which the parametersof the length dimension are proportional the particle radius, and the dependenceon the number density of electrons and ions N0 far from the particle is throughN0r2
0 . In particular, free and trapped ions give the same contribution to the screen-ing charge if N0r2
0 D 70 cm�1, which means that at r0 D 1 μm the correspond-ing number density of the plasma is N0 D 7 109 cm�3 and at r0 D 10 μm thisnumber density is N0 D 7 107 cm�3. Next, trapped ions disappear at N0r2
0 D103 cm�1, which corresponds to N0 D 1 1011 cm�3 for r0 D 1 μm, and the num-ber density is N0 D 1 109 cm�3 for r0 D 10 μm. From the last value it followsthat trapped ions are not important for electric probes in a plasma at r0 10 μmbut are significant for a rare dusty plasma in the solar system.
Figure 6.6 shows the dependence of the part of the screening charge � (6.49) thatis created by trapped ions on the reduced number density N0r2
0 of a surroundingplasma, and Figure 6.7 gives the dependence of the reduced size of the particle fieldon this parameter. Figure 6.8 shows the reduced number densities of free Nir2
0 andtrapped Ntrr2
0 ions as a function of the reduced distance R/r0 from the particle.These number densities correspond to the reduced number density of a surround-ing plasma N0r2
0 D 100 cm�1 at which the contribution from trapped ions to theparticle screening is approximately 40%. Comparing the results of the two cases inFigures 6.6 and 6.7 where the number densities of ions are determined by (6.46)or (6.47), one can estimate the accuracy of the above operations as approximately10%.
We note one more aspect of this phenomenon. We consider the case R0 � r0,which allows us to divide the ion trajectories from which an ion attaches to the par-ticle or goes into the surrounding plasma. Next, the nearest elliptic ion orbit is farfrom the particle. All this according to (6.32) is possible only for a nonequilibriumplasma where Te � Ti, as is realized in a gas discharge plasma containing dust

382 6 Complex Plasmas, Including Atmospheric Plasmas
Figure 6.6 The part of the screening charge
owing to trapped ions as a function of the
reduced number density of ions for a parti-
cle in an ionized argon with Te D 1 eV and
Ti D 400 K. Open circles correspond to the
case when free ions dominate, and closed
circles relate to the case when trapped ions
dominate.
Figure 6.7 The reduced size of the particle
field in an ionized argon as a function of the
reduced number density of electrons with
Te D 1 eV and Ti D 400 K. Open triangles cor-
respond to the case when free ions dominate,
and closed triangles relate to the case when
trapped ions dominate.
particles. In an equilibrium plasma (Te D Ti) we have R0/r0 � X 5�6, and theabove effects are mixed. Thus, trapped ions are of importance for a rare plasma butnot for a dense plasma.

6.2 Particle Fields in an Ionized Gas 383
Figure 6.8 The number densities of free
(squares) and trapped (circles) ions near a
particle in a rare ionized gas as a function
of the reduced number density of electrons
and ions of a plasma with Te D 1 eV and
Ti D 400 K. Open symbols correspond to
the case when free ions dominate, and closed
symbols relate to the case when trapped ions
dominate.
6.2.3
Interaction of Dust Particles with the Solar Wind
In analyzing the equilibrium between a particle and surrounding rare ionized gasas a result of attachment of electrons and ions to the particle, we find that trappedions are of importance for a low number density of plasma electrons and ions.This occurs in a dusty plasma in the solar system [83–85] that is formed as a resultof interaction of the solar wind with dust in comet tails and the rings of Saturn,Jupiter, and Uranus. The basis of these dusty plasmas is the solar wind [12, 13, 86],which is a plasma flux from the solar corona. The solar wind consists mostly ofelectrons and protons and is propagated from the Sun in all directions more orless uniformly. The solar wind accounts for the loss of approximately 2 10�14
times the mass of the Sun per year. This plasma flux varies as 1/R2 with increasingdistance R from the Sun. On the basis of the average parameters of the solar windon the Earth level, we have that the number densities of electrons and protonsare about 7 cm�3, the electron temperature is 2 105 K, the proton temperature is5 104 K, and the flux velocity is 4 107 cm/s (this velocity corresponds to a protonkinetic energy of about 1 keV). When the solar wind encounters dust particles, aspecific dusty plasma is formed [4, 83, 84].
As a demonstration of a cosmic dusty plasma, we consider below two examplesof a cosmic plasma containing dust particles. The first example relates to the ringsof Saturn (see Figure 6.9 [87]). In particular, the E and F rings of Saturn contain iceparticles of size ranging from 0.5 to 10 μm [88, 89] and a typical number densityof ice particles is 30 cm�3 [88]. The sources of the ice particles are the neighbor-ing satellites: Enceladus for the E ring [24, 90], and Prometheus and Pandora forthe F ring [91]. Simultaneous measurements within the framework of the Cassini

384 6 Complex Plasmas, Including Atmospheric Plasmas
Figure 6.9 The rings of Saturn contain dust particles from its satellites and are supported by the
action of its magnetic field and the solar wind [87].
project provided evidence for the dust parameters [92, 93] and plasma parame-ters [26, 94] from Saturn’s E ring. The solar wind also influences transport of dustparticles from Enceladus [24, 90, 95]. The number density of the plasma that re-sults from the interaction of the magnetic field of Saturn and the solar wind isN0 D 30�100 cm�3, the electron temperature is 10–100 eV [96], and the magneticfield influences significantly the properties of this plasma. Ions of various types ex-ist in a ring plasma, and basic types of ions are OHC and H2OC with temperaturesof the order of 103 K.
Let us analyze the parameters of a cosmic dusty plasma on the basis of the aboveanalysis. Taking for definiteness r0 D 1 μm and Te D Ti D 30 eV, we obtainfrom (6.22) x D 2.5, which corresponds to the particle charge jZ j D 5 104. Next,taking the number density of particles Np D 30 cm�3 [88], we obtain NpR2
0 10�5 cm�1, which is small compared with N 1/3
p , that is, scattering of electrons andions of the solar wind by each particle proceeds independently. Note that we ob-tain an overestimated value for the particle charge because the total number den-sity of particle charge NpjZ j � 106 cm�3 exceeds significantly the observed valueN0 � 102 cm�3 [96]. Moreover, from the observed number density of electronsand ions it follows that jZ j � 3, and the negative charge of this plasma is con-nected to particles, whereas ions are located in the space between particles andNi � 102 cm�3. But this is large compared with the number density of fast elec-trons and protons in the solar wind on the Saturn level, which is approximately0.1 cm�3.
Let us consider the problem regarding this plasma from another standpoint. For-mation of a dusty plasma of the solar system results from interaction of the solarwind with an interplanetary dust. As a result of mixing, a dusty plasma is formed,and the number density of charged particles in this plasma exceeds that in the solarwind by several orders of magnitude. Above, we verified this for the dusty plasmaof the rings of Saturn, and the same can be done for other types of dusty plasmaoccurring in the solar system. In particular, in the case of comets [27, 28], comettails result from the interaction of the solar wind with comet dust and comet ions(see Figure 6.10 [97]). Although the magnetic properties of comets are importantfor the properties of this plasma [29], processes in the field of charged particles
6.2 Particle Fields in an Ionized Gas 385
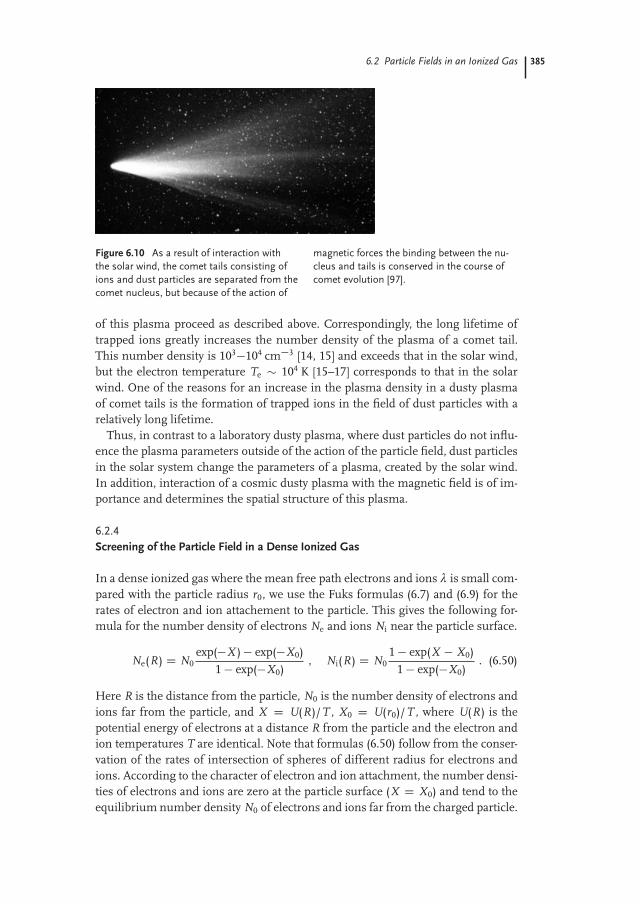
Figure 6.10 As a result of interaction with
the solar wind, the comet tails consisting of
ions and dust particles are separated from the
comet nucleus, but because of the action of
magnetic forces the binding between the nu-
cleus and tails is conserved in the course of
comet evolution [97].
of this plasma proceed as described above. Correspondingly, the long lifetime oftrapped ions greatly increases the number density of the plasma of a comet tail.This number density is 103�104 cm�3 [14, 15] and exceeds that in the solar wind,but the electron temperature Te � 104 K [15–17] corresponds to that in the solarwind. One of the reasons for an increase in the plasma density in a dusty plasmaof comet tails is the formation of trapped ions in the field of dust particles with arelatively long lifetime.
Thus, in contrast to a laboratory dusty plasma, where dust particles do not influ-ence the plasma parameters outside of the action of the particle field, dust particlesin the solar system change the parameters of a plasma, created by the solar wind.In addition, interaction of a cosmic dusty plasma with the magnetic field is of im-portance and determines the spatial structure of this plasma.
6.2.4
Screening of the Particle Field in a Dense Ionized Gas
In a dense ionized gas where the mean free path electrons and ions λ is small com-pared with the particle radius r0, we use the Fuks formulas (6.7) and (6.9) for therates of electron and ion attachement to the particle. This gives the following for-mula for the number density of electrons Ne and ions Ni near the particle surface.
Ne(R) D N0exp(�X )� exp(�X0)
1� exp(�X0), Ni(R) D N0
1� exp(X � X0)1� exp(�X0)
. (6.50)
Here R is the distance from the particle, N0 is the number density of electrons andions far from the particle, and X D U(R)/T , X0 D U(r0)/T , where U(R) is thepotential energy of electrons at a distance R from the particle and the electron andion temperatures T are identical. Note that formulas (6.50) follow from the conser-vation of the rates of intersection of spheres of different radius for electrons andions. According to the character of electron and ion attachment, the number densi-ties of electrons and ions are zero at the particle surface (X D X0) and tend to theequilibrium number density N0 of electrons and ions far from the charged particle.
386 6 Complex Plasmas, Including Atmospheric Plasmas
For the difference between the ion and electron number densities, formulas (6.50)give
ΔN � Ni(R)� Ne(R) D N0 � 1� exp(X � X0)C exp(�X0) � exp(�X0)1 � exp(�X0)
.
(6.51)
This quantity is symmetric with respect to transformation X ! X0 � X and has amaximum at X D X0/2, where this quantity is
ΔN D N0 � 1� exp(�X0/2)1C exp(�X0/2)
.
In addition from equality of electron and ion attachment rates we have X0 Dln(D�/DC).
The electric potential '(R) D U(R)/e that is created by the particle follows fromthe Poisson equation:
Δ' � 1R
d2(R')dR2 D 4πeΔN . (6.52)
If X D U(R)/T � 1, we have ΔN D N0 X and the Poisson equation has the form
1R
d2(R')dR2 D '
r2D
, rD Ds
T4πZ N0e2 .
Its solution is
'(R) D C eR
exp�� R
rD
�, (6.53)
and in the Fuks approach C D Z . One can see that the Fuks approach U(R) DZ e2/R is valid for weak shielding of the particle charge by surrounding electronsand ions, which leads to the criterion
N0r30 � 1 . (6.54)
In a general case we use expressions (6.51) for the difference ΔN between thenumber densities of electrons and ions, and the Poisson equation (6.52) has theform
1R
d2[R X(R)]dR2 D ΔN
N0r2D
,
where X � X0 and X0 D ln(D�/DC). From this one can formulate the generalcharacter of variation of the particle potential '(R) and the number density differ-ence ΔN for ions and electrons on approaching the particle from infinity. At largedistances from the particle surface, the particle potential and the number densitydifference drop exponentially with distance from the particle because of the Debyescreening. At the particle surface the number density difference ΔN is zero and
6.2 Particle Fields in an Ionized Gas 387
has a maximum at some distance from the particle, whereas the particle electricpotential '(R) drops monotonically with distance from the particle. The connec-tion between these quantities is determined by the Poisson equation (6.52).
Let us consider this connection from another standpoint. According to the Gausstheorem, the particle electric field strength is
E D Z(R)eR2
,
and the electric potential at distance R from the particle is
'(R) D1Z
R
Z(r)r2 dr .
This gives the following connection between the reduced particle electric potentialand the number density difference:
X D 1r2
D
1ZR
�1R� 1
r
�ΔNN0
r2dr . (6.55)
In reality, this equation is identical to the Poisson equation (6.52). In particular, atsmall values of X where ΔN D N0 X the solution of this equation is given by (6.53),as well as by the Poisson equation (6.52). In addition, multiplication of (6.55) by Rand its double differentiation leads to the Poisson equation (6.52), that is, (6.52)and (6.55) are equivalent.
We thus have that the particle charge in a dense ionized gas and the screening ofthis charge near the particle are determined by the Fuks approach, which is valid athigh plasma density (6.5). As the number density of electrons and ions increasesand criterion (6.5) is violated, the general concept of the Fuks approach for electronand ion fluxes is conserved and is expressed by (6.50). These formulas are valid atdistances from the charged particle where screening of the particle charge is weak,and hence the range of these distances is shortened as the number densities ofelectrons and ions increase. Nevertheless, (6.50) and (6.51) may be used for eval-uation of both the particle charge and its screening by surrounding electrons andions if the above formulas are used in the right-hand side of (6.55). In this case theparticle charge and screening parameters are determined by competition betweentwo dimension parameters, the particle radius r0 and the Debye–Hückel radius rD,and the Fuks limit corresponding to the criterion
rD � r0 . (6.56)
The inverse ratio is valid in the positive column of gas discharge of not low pres-sure if the effective particle radius is taken as the radius of curvature for walls.The conditions were given above to generalize the Fuks approach, and they may beused in the course of numerical solutions of the above equations. Unfortunately,in contemporary evaluations (e.g., [98–102]) all these conditions are not fulfilled.
388 6 Complex Plasmas, Including Atmospheric Plasmas
6.2.5
Influence of Particles on the Properties of Ionized Gases
The above analysis shows that if a micrometer-sized particle is inserted in a plas-ma, it acquires a negative charge owing to attachment of electrons and ions to itssurface, and the Coulomb field of this particle is screened by plasma electrons andions. This screening has a nature other than the Debye screening in a plasma dueto attachment of electrons and ions to the particle surface. Hence, plasma electronsand ions determine both the establishment of the equilibrium particle charge andshielding of the particle field by the plasma electrons and ions. We now consideranother aspect of interaction of particles with a plasma. Indeed, particles are sinksfor electrons and ions, and their presence in a plasma may influence the plasmaparameters.
We compare the rate of attachment of electrons and ions to the walls νw in agas discharge tube and to particles νp in a plasma. We make this comparison foran argon plasma in the positive column of glow discharge (see Figure 6.11), andthis plasma is inside a cylindrical tube of radius R0 into which particles of radiusr0 and number density Np are inserted. We have for the flux of electrons and ionsto the tube surface in the case of the Schottky regime [103] of the positive columnj D �Da@N/@R D 1.25Da N0/R0, where N is the number density of electrons andions near the walls, N0 is their number density at the axis, and Da is the coeffi-cient of ambipolar diffusion. From this we obtain for the rate of electron and ionattachment to the walls per unit tube length
νw D 2.5πDa N0 D 2.5πTe
TiDiN0 ,
where the attachment rate νw is the number of attaching electrons and ions perunit tube length and unit time, Di is the diffusion coefficient of ions, and Te andTi are the electron and ion temperatures.
In determining the rate νp of electron and ion attachment to particles we use fordefiniteness the case of a rare gas when the rate constant k for ion attachment to anegatively charged particle is given by (2.101) and the particle charge is determinedby (6.21). Then we have for the total rate νp of electron and ion attachment toparticles per unit tube length
νp D kNiNpπR20 D
2p
2πjZ je2r0pmi Ti
� πR20 Nik Np ,
where Ni is the current number density of ions, Z is the particle charge, and mi isthe ion mass. Averaging the number density of ions over the tube cross section, we

6.2 Particle Fields in an Ionized Gas 389
obtain from this
νp D 6.8
sTi
mi
jZ je2
Tir0R2
0 N0Np .
From this we find for the ratio of the attachment rates
νp
νwD 0.87
Di
sTi
mi
jZ je2r0
TeR2
0 Np D �Sp
Sw, � D 0.14
Di
sTi
mi
jZ je2r0
TeR0 ,
(6.57)
where Sp D 4πr20 Np � πR2
0 is the total area of the particle surface per unit tubelength, and Sw D 2πR0 is the wall area per unit tube length. Since jZ je2/r0 Te � 1,we have � � R0/λ � 1, where λ is the mean free path of ions in an ionized gas.Thus, the particle surface is more effective than the tube walls for recombinationof electrons and ions.
νp
νwD �
Sp
SwD 2πr2
0 R0Np� .
As a demonstration of these results, we consider an example of an argon plasmawith ion temperature Ti D 400 K and a gas discharge tube of radius R0 D 1 cm.We find the reduced electric field strength in the absence of particles [60], E/N D
Figure 6.11 Dust particles in the positive column of gas discharge (a) and fluxes of electrons
and ions to the walls and particle surface (b). As a result, electrons and ions recombine on the
particle surfaces as well as on the surface of the gas discharge tube.
390 6 Complex Plasmas, Including Atmospheric Plasmas
13 Td, using the values of the first Townsend coefficient and the electron drift veloc-ity [104]. If attachment of electrons and ions to particles gives the same contributionto plasma destruction as that due to attachment of electrons and ions to particles,the reduced electric field strength of the positive column becomes E/N D 16 Td.
Taking the particle radius as r0 D 1 μm and the electron temperature as Te D1 eV, we obtain in the case of a rare ionized gas according to (6.21) jZ je2/r0Te D 2.6and Z D �1.8 103 e. Next, for p D 10 Torr we have the number density of argonatoms Na D 2.4 1017 cm�3, the diffusion coefficient for atomic argon ions at thispressure is Di D 5.2 cm2/s, and
pTi/mi D 2.9 104 cm/s. We obtain � D 780,
which is the efficiency of attachment of electrons and ions to particles with respectto their attachment to the walls of the gas discharge tube. In addition, we obtainthe number density of particles Np D 1/(2πr4
0 R0� ) D 2.0 104 cm�3 at which therates of plasma destruction as a result of attachment to particles and walls are equal,so if these particles form a crystal with close-packed particles that corresponds tothe face-centered cubic or hexagonal structure, the distance between nearest par-ticles is 0.4 mm. If the mass density of particles corresponds to a glass, we obtainfrom this for the mass density � of particles in space �p D 1.8 10�7 g/cm3. Forcomparison, we have the mass density of argon atoms under the above conditions,Na D 1.6 10�5 g/cm3. As seen in this example, the particles influence the pro-cesses in this gas discharge plasma if the mass density of particles is less than thatof gas atoms by two orders of magnitude.
6.2.6
Particle Structures in Dusty Plasma
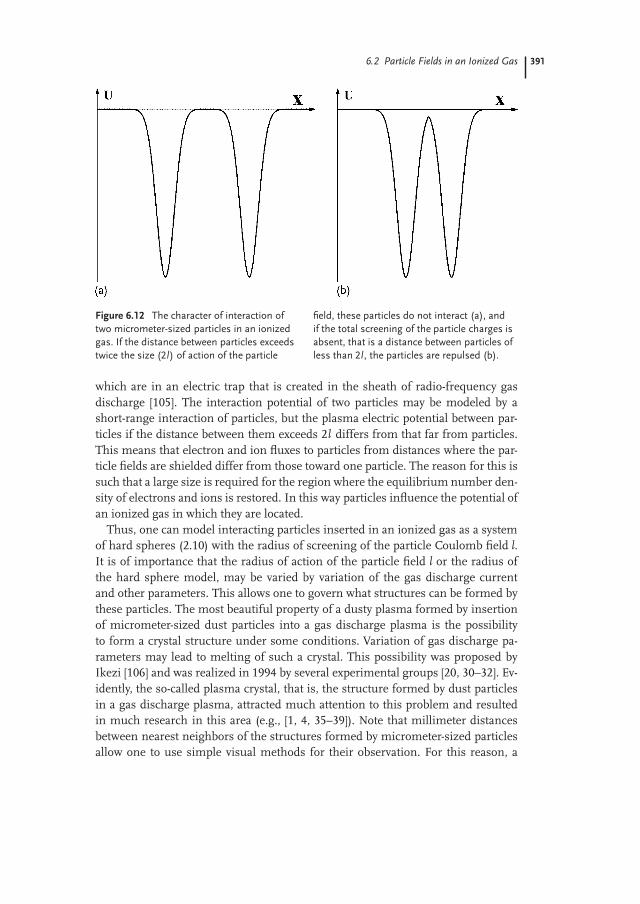
We have that a micrometer-sized particle in an ionized gas is surrounded by an ioncoat, and ions screen the particle charge that is established due to attachment ofelectrons and ions to the particle surface. Electrons of a rare ionized gas give a smallcontribution to the particle field shielding. We characterize the region of action ofthe particle field by size l, the values of which are given in Figure 6.7. The characterof interaction of two particles in an ionized gas is represented in Figure 6.12. Atlarge distances between two particles (Figure 6.12) the particles do not interact andthey are independent particles. In contrast, at small separations (Figure 6.12b) theparticles are repulsed owing to interaction of the partially screened charges. Fromthis it follows that under the given conditions the number density of particles inan ionized gas is restricted. Next, interaction of particles in an ionized gas has ashort-range character because at separations R > 2l two particles do not interact.If this separation is below 2l , the charges of the particles are partially screened, andthe particles are strongly repulsed. Note that screening of two interacting particlesdiffers from that for individual particles, and hence it is not correct to apply to theparticle screened charges that relate to individual particles.
One can confirm the general character of particle interaction in an ionized gasgiven in Figure 6.12 and based on measurements of interaction of two particles
6.2 Particle Fields in an Ionized Gas 391
Figure 6.12 The character of interaction of
two micrometer-sized particles in an ionized
gas. If the distance between particles exceeds
twice the size (2l) of action of the particle
field, these particles do not interact (a), and
if the total screening of the particle charges is
absent, that is a distance between particles of
less than 2l, the particles are repulsed (b).
which are in an electric trap that is created in the sheath of radio-frequency gasdischarge [105]. The interaction potential of two particles may be modeled by ashort-range interaction of particles, but the plasma electric potential between par-ticles if the distance between them exceeds 2l differs from that far from particles.This means that electron and ion fluxes to particles from distances where the par-ticle fields are shielded differ from those toward one particle. The reason for this issuch that a large size is required for the region where the equilibrium number den-sity of electrons and ions is restored. In this way particles influence the potential ofan ionized gas in which they are located.
Thus, one can model interacting particles inserted in an ionized gas as a systemof hard spheres (2.10) with the radius of screening of the particle Coulomb field l.It is of importance that the radius of action of the particle field l or the radius ofthe hard sphere model, may be varied by variation of the gas discharge currentand other parameters. This allows one to govern what structures can be formed bythese particles. The most beautiful property of a dusty plasma formed by insertionof micrometer-sized dust particles into a gas discharge plasma is the possibilityto form a crystal structure under some conditions. Variation of gas discharge pa-rameters may lead to melting of such a crystal. This possibility was proposed byIkezi [106] and was realized in 1994 by several experimental groups [20, 30–32]. Ev-idently, the so-called plasma crystal, that is, the structure formed by dust particlesin a gas discharge plasma, attracted much attention to this problem and resultedin much research in this area (e.g., [1, 4, 35–39]). Note that millimeter distancesbetween nearest neighbors of the structures formed by micrometer-sized particlesallow one to use simple visual methods for their observation. For this reason, a
392 6 Complex Plasmas, Including Atmospheric Plasmas
dusty plasma is a convenient model for the analysis of both the formation anddestruction of ordered structures and various hydrodynamic effects.
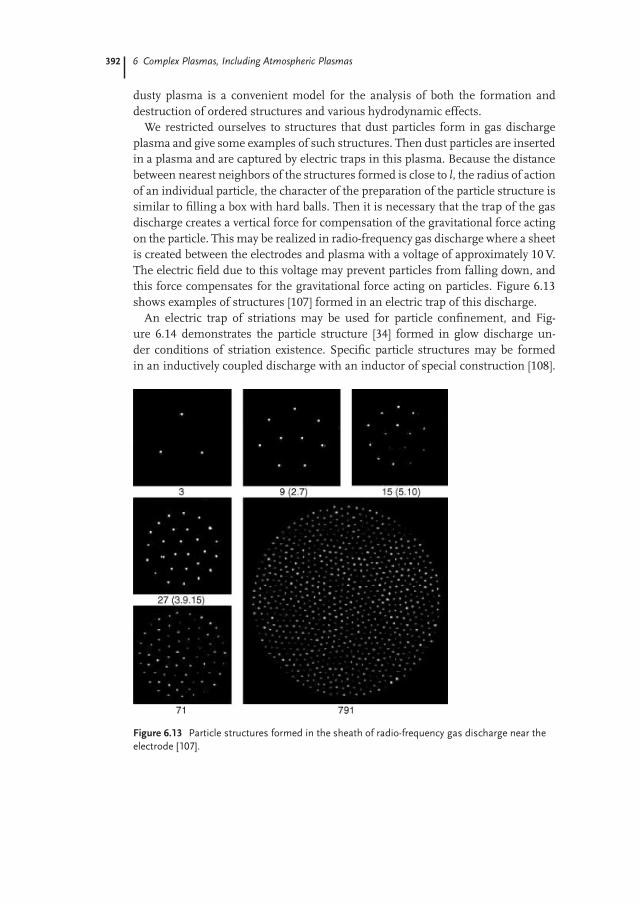
We restricted ourselves to structures that dust particles form in gas dischargeplasma and give some examples of such structures. Then dust particles are insertedin a plasma and are captured by electric traps in this plasma. Because the distancebetween nearest neighbors of the structures formed is close to l, the radius of actionof an individual particle, the character of the preparation of the particle structure issimilar to filling a box with hard balls. Then it is necessary that the trap of the gasdischarge creates a vertical force for compensation of the gravitational force actingon the particle. This may be realized in radio-frequency gas discharge where a sheetis created between the electrodes and plasma with a voltage of approximately 10 V.The electric field due to this voltage may prevent particles from falling down, andthis force compensates for the gravitational force acting on particles. Figure 6.13shows examples of structures [107] formed in an electric trap of this discharge.
An electric trap of striations may be used for particle confinement, and Fig-ure 6.14 demonstrates the particle structure [34] formed in glow discharge un-der conditions of striation existence. Specific particle structures may be formedin an inductively coupled discharge with an inductor of special construction [108].
Figure 6.13 Particle structures formed in the sheath of radio-frequency gas discharge near the
electrode [107].

6.2 Particle Fields in an Ionized Gas 393
Figure 6.14 A particle structure formed in striations of glow discharge [34].
Figure 6.15 Structures of particles formed in an inductively coupled discharge with an inductor
of special construction [108].
This construction provides forces on the boundary of a radio-frequency plasma di-rected upward, which leads to specific structures of dust particles injected in thisplasma. Some structures of this type are represented in Figure 6.15. Along withelectric forces, thermophoretic forces due to temperature gradients may be usedfor equalizing the gravitational force. A complex structure of particles formed instratified glow discharge is represented in Figure 6.16 [109]. Thus, there are vari-ous possibilities to have a trap in a gas discharge plasma that allows one to obtainsome structures of particles. These structures are a convenient model for study ofthe solid–liquid phase transition and some hydrodynamic effects in gas and liquidflows [110].
We note that fluxes of electrons and ions to the particle surface determine boththe particle charge and screening of the particle Coulomb field by plasma ions.
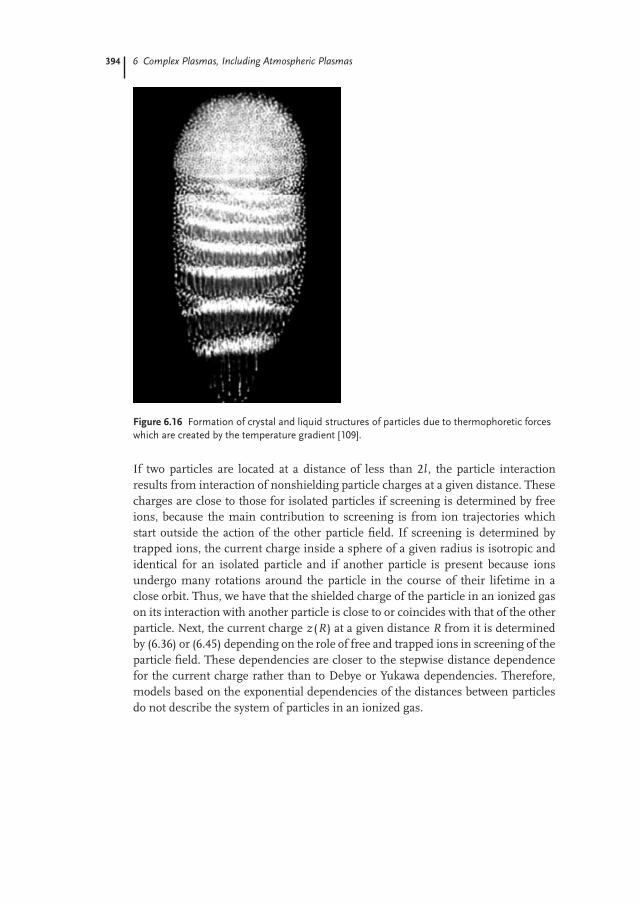
394 6 Complex Plasmas, Including Atmospheric Plasmas
Figure 6.16 Formation of crystal and liquid structures of particles due to thermophoretic forces
which are created by the temperature gradient [109].
If two particles are located at a distance of less than 2l , the particle interactionresults from interaction of nonshielding particle charges at a given distance. Thesecharges are close to those for isolated particles if screening is determined by freeions, because the main contribution to screening is from ion trajectories whichstart outside the action of the other particle field. If screening is determined bytrapped ions, the current charge inside a sphere of a given radius is isotropic andidentical for an isolated particle and if another particle is present because ionsundergo many rotations around the particle in the course of their lifetime in aclose orbit. Thus, we have that the shielded charge of the particle in an ionized gason its interaction with another particle is close to or coincides with that of the otherparticle. Next, the current charge z(R) at a given distance R from it is determinedby (6.36) or (6.45) depending on the role of free and trapped ions in screening of theparticle field. These dependencies are closer to the stepwise distance dependencefor the current charge rather than to Debye or Yukawa dependencies. Therefore,models based on the exponential dependencies of the distances between particlesdo not describe the system of particles in an ionized gas.

6.3 Cluster Plasma 395
6.3
Cluster Plasma
6.3.1
Ionization Equilibrium for Metal Clusters in a Cluster Plasma
A cluster plasma is an ionized gas containing clusters [40, 41, 111], and the num-ber density of clusters is small compared with the number density of atoms andmolecules. Clusters in a cluster plasma may grow and evaporate during evolutionof the cluster plasma. We will be guided by a cluster plasma consisting of a buffergas and metal clusters. Hence, this cluster plasma includes both metal clusters andmetal atoms, and the total number density of metal atoms is small compared withthat of gas atoms. Under these conditions, metal clusters and metal atoms are ofimportance for cluster processes, and a buffer gas has the role of a stabilizationcomponent. Below we analyze several such systems which may be used for gener-ation of metal clusters.
There are various methods to generate metal clusters in a cluster plasma. Inall cases, metal atoms are injected in a gas or gas flow, and then metal clustersare formed from these atoms. Metal atoms may be injected in a gas as a result ofevaporation of metal atoms from a metal surface and erosion of a metal surface bylaser radiation or the ion (electron) beam of a gas discharge. The effective methodof creation of a cluster plasma is based on injection of some metal compounds in aflow of a dense plasma, where these compounds are destroyed, and metal atoms arejoined in metal clusters under appropriate conditions. This scenario uses a largebinding energy of atoms in clusters as it takes place for most metals.
If we deal with a cluster plasma including metal clusters, a positive charge ofthis plasma is connected with metal clusters since their ionization potential is low-er than that for buffer gas atoms. We consider below the ionization equilibriuminvolving metal clusters that is realized according to the scheme
MCZC1n C e $ MCZ
n . (6.58)
Here M is a metal atom and M Zn is a metal cluster consisting of n atoms and having
charge Z. By analogy with the Saha formula, we have for the probability PZ (n) fora cluster consisting of n atoms to have charge Z
PZ (n)Ne
PZC1(n)D 2
�meTe
2π„2
�3/2
exp�� IZ (n)
Te
�, (6.59)
where Te is the electron temperature, me is the electron mass, Ne is the electronnumber density, and IZ (n) is the ionization potential of the cluster consisting of natoms and having charge Z.
Note that the ionization equilibrium (6.58) in an ionized gas results from step-wise ionization of charged clusters in collisions with electrons and three body re-combination of charged clusters and electrons. But because the number density ofthe internal electrons of a metal cluster greatly exceeds that of the plasma electrons,
396 6 Complex Plasmas, Including Atmospheric Plasmas
a third particle in the recombination process may be a bound electron. Under equi-librium between internal and plasma electrons, the Saha formula (6.59) is valid,but the electron release process is connected to internal electrons.
The equilibrium (6.58) between free electrons and bound electrons in a metalcluster corresponds to a long mean free path of electrons in a gas compared withthe cluster radius in accordance with criterion (6.5) and the ionization potentialIZ (n) of a large cluster for n � 1. In this case removal of an electron from thecluster surface outside the region of action of the cluster Coulomb field requiresthat this interaction is overcome, which gives
IZ (n) D Z e2
r0C I0(n) , (6.60)
where I0(n) is the ionization potential of a neutral cluster consisting of n atoms.This relation allows one to transform the Saha formula (6.59) to the form
PZ
PZ�1D A exp
�� Z e2
r0Te
�, A D 2
Ne
�me Te
2π„2
�3/2
exp�� I0
Te
�. (6.61)
From this formula we find the Saha formula (6.59) is reduced to the Gauss formfor a large cluster charge Z � 1:
PZ (n) D PZ (n) exp
"� (Z � Z )2
2Δ2
#,
Z D r0Te
e2
(ln
"2
Ne
�me Te
2π„2
�3/2#� I0(n)
Te
), Δ2 D r0Te
e2. (6.62)
One can use a rough model for the cluster ionization potential assuming it to be amonotonic function of the number n of cluster atoms. We represent the ionizationpotential I0(n) of a neutral metal as
I0(n) D W C constn1/3 ,
where W is the metal work function, that is, the electron binding energy for amacroscopic cluster. Including in the consideration the atomic ionization potentialI0(1) D I and transferring to the ionization potential of a charged cluster accordingto (6.60), we have in this model for the cluster ionization potential
IZ (n) D Z e2
r0C W C I � W
n1/3 . (6.63)
Evidently, within the framework of this model we have for the binding energy of anegatively charged cluster
I�1(n) D W C EA� Wn1/3 , (6.64)
where EA is the electron affinity of an atom.
6.3 Cluster Plasma 397
From the above formulas, we have that clusters that are found in thermodynamicequilibrium with an ionized gas may be positively and negatively charged. In par-ticular, according to the Saha formula we have for the ratio of the number densitiesfor singly positively charged NC and singly negatively charged N� clusters
NCN�D �2 exp
�� Δ
Te n1/3
�, � D 2
Ne
�me Te
2π„2
�3/2
exp��W
Te
�,
Δ D I0(1)C EA � 2W . (6.65)
For example, in the case of copper we have I0(1) D 7.73 eV, EA D 1.23 eV, andW D 4.4 eV, which gives Δ D 0.16 eV, and the ratio Δ/(Te n1/3) is small forlarge clusters and high electron temperatures. Hence, the sign of the mean clustercharge is determined by the sign of the function ln � (Te). This is a monotonic func-tion of the electron temperature, so at high electron temperatures clusters are pos-itively charged, and at low electron temperatures they have mean negative charge.The transition electron temperature T� is determined by the equation � (T�) D 1.In particular, in the case of copper and for large clusters it is T� D 2380 K forNe D 1 1011 cm�3, T� D 2640 K for Ne D 1 1012 cm�3, and T� D 2970 Kfor Ne D 1 1013 cm�3. As is seen, the temperature T� of zero cluster chargeincreases with increasing number density of plasma electrons.
Thus, a metal cluster is positively charged at high temperatures and negativelycharged at low temperatures. As a demonstration of this fact, Figure 6.17 givesthe average charge of tungsten clusters in a plasma as a function of the clustertemperature, and also the cluster temperature T� at which this cluster becomesneutral on average, that is, � (T�) D 1. Table 6.2 contains the parameters in (6.65)for some parameters of a cluster and plasma. In addition, according for (6.62), thecluster charge is proportional to n1/3, and Table 6.2 contains the proportionalityfactor for the parameters considered.
6.3.2
Conversion of an Atomic Vapor into a Gas of Clusters
Being guided by a cluster plasma consisting of a buffer gas and addition of metalin the form of metal clusters, we consider the first stage of formation of a clusterplasma from a supersaturated atomic metal vapor. This allows one to ignore theprocesses of cluster evaporation, whereas the vapor condensation consists in theformation of nuclei of condensation, and cluster growth results from atom attach-ment to nuclei of condensation. In the case of metal vapor condensation the nucleiof condensation are diatomic metal molecules which are formed in the three bodyprocess. One can assume in the next stage of the growth process that the energyexcess in atom attachment to metal molecules is transferred into oscillation de-grees of freedom, and then this energy is transferred to the buffer gas atoms incollisions. Therefore, we have the following scheme for the cluster growth process
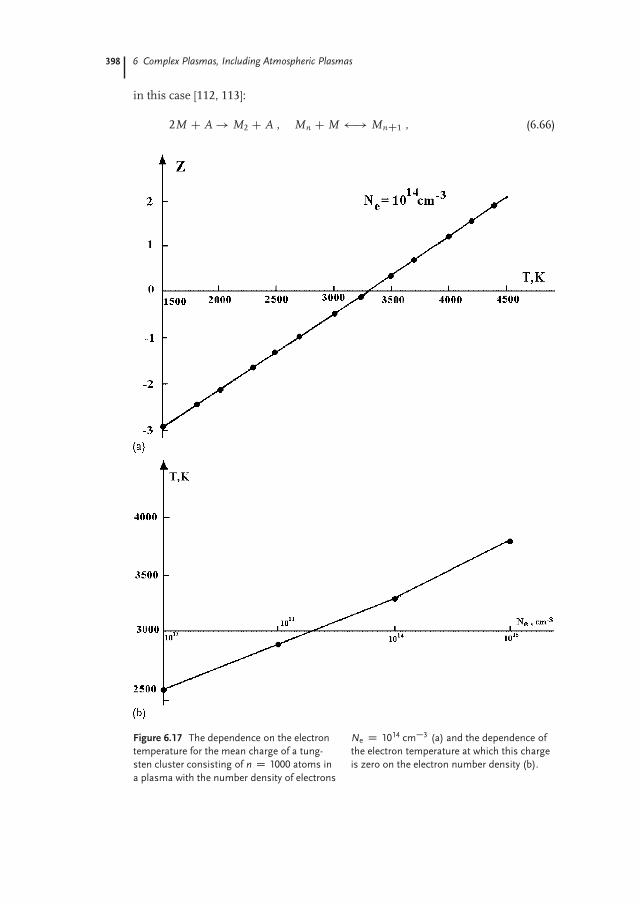
398 6 Complex Plasmas, Including Atmospheric Plasmas
in this case [112, 113]:
2M C A! M2 C A , Mn C M ! MnC1 , (6.66)
Figure 6.17 The dependence on the electron
temperature for the mean charge of a tung-
sten cluster consisting of n D 1000 atoms in
a plasma with the number density of electrons
Ne D 1014 cm�3 (a) and the dependence of
the electron temperature at which this charge
is zero on the electron number density (b).
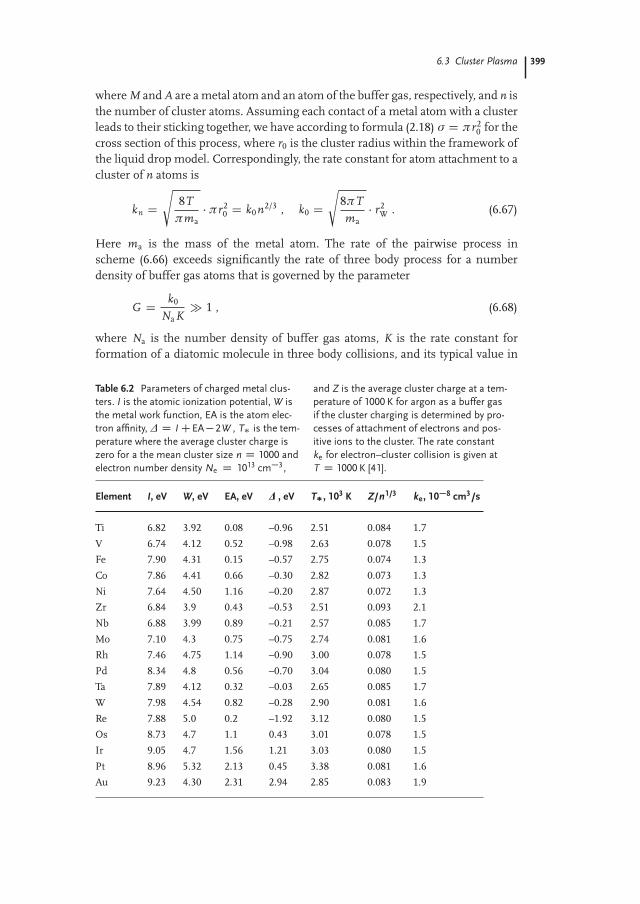
6.3 Cluster Plasma 399
where M and A are a metal atom and an atom of the buffer gas, respectively, and n isthe number of cluster atoms. Assuming each contact of a metal atom with a clusterleads to their sticking together, we have according to formula (2.18) σ D πr2
0 for thecross section of this process, where r0 is the cluster radius within the framework ofthe liquid drop model. Correspondingly, the rate constant for atom attachment to acluster of n atoms is
kn Ds
8Tπma
� πr20 D k0n2/3 , k0 D
s8πTma� r2
W . (6.67)
Here ma is the mass of the metal atom. The rate of the pairwise process inscheme (6.66) exceeds significantly the rate of three body process for a numberdensity of buffer gas atoms that is governed by the parameter
G D k0
NaK� 1 , (6.68)
where Na is the number density of buffer gas atoms, K is the rate constant forformation of a diatomic molecule in three body collisions, and its typical value in
Table 6.2 Parameters of charged metal clus-
ters. I is the atomic ionization potential, W is
the metal work function, EA is the atom elec-
tron affinity, Δ D I CEA � 2W , T� is the tem-
perature where the average cluster charge is
zero for a the mean cluster size n D 1000 and
electron number density Ne D 1013 cm�3,
and Z is the average cluster charge at a tem-
perature of 1000 K for argon as a buffer gas
if the cluster charging is determined by pro-
cesses of attachment of electrons and pos-
itive ions to the cluster. The rate constant
ke for electron–cluster collision is given at
T D 1000 K [41].
Element I, eV W, eV EA, eV Δ, eV T�, 103 K Z/n1/3 ke, 10�8 cm3/s
Ti 6.82 3.92 0.08 –0.96 2.51 0.084 1.7
V 6.74 4.12 0.52 –0.98 2.63 0.078 1.5Fe 7.90 4.31 0.15 –0.57 2.75 0.074 1.3
Co 7.86 4.41 0.66 –0.30 2.82 0.073 1.3
Ni 7.64 4.50 1.16 –0.20 2.87 0.072 1.3Zr 6.84 3.9 0.43 –0.53 2.51 0.093 2.1
Nb 6.88 3.99 0.89 –0.21 2.57 0.085 1.7
Mo 7.10 4.3 0.75 –0.75 2.74 0.081 1.6Rh 7.46 4.75 1.14 –0.90 3.00 0.078 1.5
Pd 8.34 4.8 0.56 –0.70 3.04 0.080 1.5Ta 7.89 4.12 0.32 –0.03 2.65 0.085 1.7
W 7.98 4.54 0.82 –0.28 2.90 0.081 1.6
Re 7.88 5.0 0.2 –1.92 3.12 0.080 1.5Os 8.73 4.7 1.1 0.43 3.01 0.078 1.5
Ir 9.05 4.7 1.56 1.21 3.03 0.080 1.5
Pt 8.96 5.32 2.13 0.45 3.38 0.081 1.6Au 9.23 4.30 2.31 2.94 2.85 0.083 1.9
400 6 Complex Plasmas, Including Atmospheric Plasmas
this case is K � 10�32 cm6/s, whereas a typical rate constant for the attachmentprocess is k0 � 3 10�11 cm3/s for metal atoms in a buffer gas. Below we considerthe regime G � 1 of cluster growth that takes place at Na � 3 1021 cm�3,
The number density Nm of free metal atoms, the number density Ncl of clusters,the number density Nb of bound atoms in clusters, and the number of clusteratoms n are given by the following set of balance equations according to scheme(6.68):
dNb
d tD � dNm
d tDZ
Nmk0n2/3 f n dn C K N 2mNa ,
dNcl
d tD K N 2
mNa , (6.69)
where f n is the size distribution function for clusters and is introduced such thatf n dn is the number density of clusters with a size range between n and n C dn,
and this distribution function is normalized by the condition
Ncl DZ
f n dn , Nb DZ
n f n dn .
Because the ratio of the first and second terms on the right-hand side of the firstbalance equation (6.69) is of the order of G n2/3, and since a typical number n ofcluster atoms and the cluster parameter G are large, one can ignore the secondterm in the first equation of the balance equations (6.69).
The set of balance equations (6.69) must be supplemented with the equation forcluster growth
dnd tD k0n2/3Nm , (6.70)
and the boundary condition Nb(τ) D Nm for this model Nm D const, where τ isthe time for conversion of an atomic vapor into a gas of clusters.
The solution of the last equation gives for a cluster size nmax(t) at time t after thethis process has begun
nmax(t) D�
Nmk0 t3
�3
.
Correspondingly, the maximum cluster size nmax(τ) at the end of the growth pro-cess is
nmax(τ) D�
Nmk0τ3
�3
. (6.71)
Next, according to the nature of this process, the value f n dn is proportional tothe time range d t of formation of diatomic molecules which are the condensationnuclei for the clusters. This leads to the following size distribution function forclusters:
f n D Cn2/3 , n < nmax(t) , (6.72)
6.3 Cluster Plasma 401
where C is the normalization constant and f n D 0 if n > nmax(t).We have the following relations for the number density of clusters Ncl and the
total number density of bound atoms Nb:
Ncl DZ
f n dn , Nb DZ
n f n dn .
Using (6.72) for the size distribution function for clusters, we get for these param-eters
Ncl D 3C n1/3max , Nb D 3
4C n4/3
max .
On the basis of the average cluster size n D Nb/Ncl, we obtain
n D nmax
4. (6.73)
Thus, within the framework of the model we have at the end of the process fromthe second balance equation of set (6.69)
Nb D Nm D nmax
4Ncl D nmax
4K N 2
mNaτ .
From this and (6.71) we find for the maximum cluster size nmax at the end of thisprocess and the duration τ of the cluster growth process [112, 114]
nmax D 1.2G3/4 , τ D 3.2G1/4
Nmk0. (6.74)
These formulas describe cluster parameters at the end of the cluster growth pro-cess. Because G � 1, a typical cluster size is large, n � 1, and the reduced nucle-ation time τ is large compared with a typical time of (k0Nm)�1 for attachment ofone atom.
6.3.3
Cluster Growth in Coagulation and Coalescence
Figure 6.18 shows the mechanisms of clusters growth [111]. Figure 6.18a corre-sponds to the above case of conversion of a gas or vapor consisting of free atomsinto a gas of clusters when the vapor pressure exceeds the saturated vapor pressure.Figure 6.18b corresponds to the coagulation mechanism due to joining of clustersthat proceeds according to the scheme
Mn�m C Mm ! Mn , (6.75)
and is an important process for the Earth’s atmosphere [115]. Note that although abuffer gas does not partake in the coagulation process, it plays a stabilization role.As is seen, the coagulation process proceeds at a small number density N of free
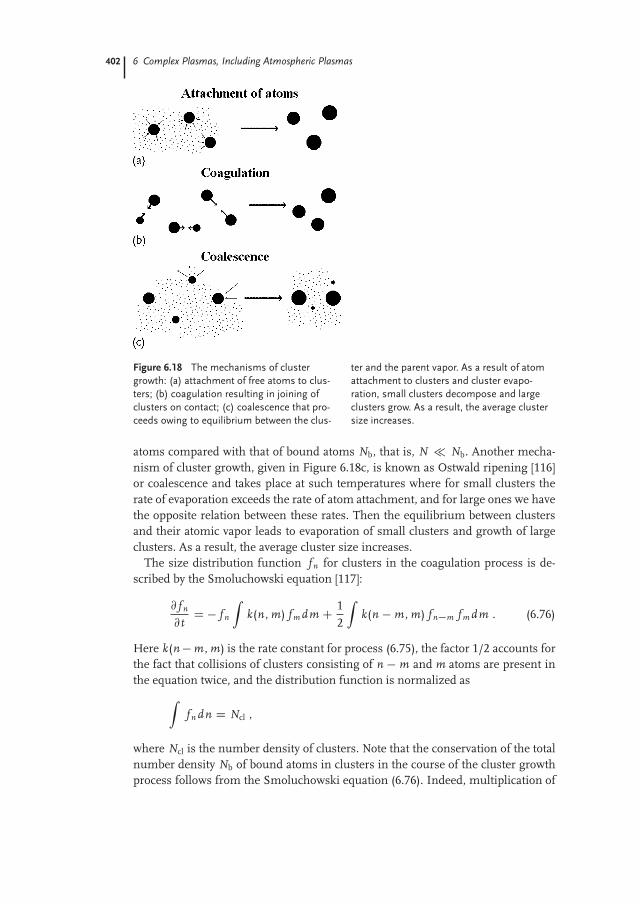
402 6 Complex Plasmas, Including Atmospheric Plasmas
Figure 6.18 The mechanisms of cluster
growth: (a) attachment of free atoms to clus-
ters; (b) coagulation resulting in joining of
clusters on contact; (c) coalescence that pro-
ceeds owing to equilibrium between the clus-
ter and the parent vapor. As a result of atom
attachment to clusters and cluster evapo-
ration, small clusters decompose and large
clusters grow. As a result, the average cluster
size increases.
atoms compared with that of bound atoms Nb, that is, N � Nb. Another mecha-nism of cluster growth, given in Figure 6.18c, is known as Ostwald ripening [116]or coalescence and takes place at such temperatures where for small clusters therate of evaporation exceeds the rate of atom attachment, and for large ones we havethe opposite relation between these rates. Then the equilibrium between clustersand their atomic vapor leads to evaporation of small clusters and growth of largeclusters. As a result, the average cluster size increases.
The size distribution function f n for clusters in the coagulation process is de-scribed by the Smoluchowski equation [117]:
@ f n
@tD � f n
Zk(n, m) f m dm C 1
2
Zk(n � m , m) f n�m f m dm . (6.76)
Here k(n�m , m) is the rate constant for process (6.75), the factor 1/2 accounts forthe fact that collisions of clusters consisting of n � m and m atoms are present inthe equation twice, and the distribution function is normalized asZ
f n dn D Ncl ,
where Ncl is the number density of clusters. Note that the conservation of the totalnumber density Nb of bound atoms in clusters in the course of the cluster growthprocess follows from the Smoluchowski equation (6.76). Indeed, multiplication of
6.3 Cluster Plasma 403
the the Smoluchowski equation (6.76) by n and integration over dn gives
dNb
d tD �
Znk(n, m) f n dn f m dm C 1
2
Znk(n � m , m) f n�m f m dndm ,
where the number density of bound atoms is Nb DR1
0 n f n dn and in the secondintegral we have n > m. Changing n � m for n on the right-hand side of this rela-tion, we find the terms to mutually cancel, and dNb/d t D 0. Hence, according tothe Smoluchowski equation, the number density Nb of bound atoms is conservedin this process.
We now determine the rate constant for association kas of two liquid clusters ofradii r1 and r2 in the case of a dense gas if criterion (4.110) holds true. The rate ofassociation of a test cluster (the first cluster) in a gas of clusters of the second kindis given by the Smoluchowski formula (6.8), so the rate constant for associationkas D J0/N0 is given by
kas D 4πD(r1 C r2) D 4π(D1 C D2)(r1 C r2) ,
where we account for the diffusion coefficient D that is responsible for approach oftwo clusters as D D D1 C D2. Using (4.110) for the diffusion coefficient of a largecluster, we find
kas D 2T3η
�2C (r1 � r2)2
r1r2
� 4T
3η, (6.77)
where we ignore the second term in parentheses compared with the first one.As is seen, the rate constant for cluster association in a dense buffer gas is inde-
pendent of both the size and the material of particles. It is convenient in this caseto use a dimensionless time τ D Nbkas t in the Smoluchowski equation (6.76) andto introduce the concentration of clusters of a given size cn D f n Nb, where Nb isthe total number density of bound atoms in clusters. The normalization conditionfor the cluster concentration has the formX
n
ncn D 1 ,
and the Smoluchowski equation (6.76) in terms of cluster concentrations takes theform
@cn
@τD �cn
1Z0
cm dm C 12
nZ0
cn�m cm dm . (6.78)
This equation has a simple automodel solution,
cn D 4
n2 exp��2n
n
�, n D τ , (6.79)
that holds true at long times when the solution is independent of the initial con-ditions. This expression satisfies the normalization condition
R10 ncn dn D 1 and
404 6 Complex Plasmas, Including Atmospheric Plasmas
means that the form of the distribution function is conserved in the course of par-ticle evolution, but the average particle size varies in time as
n D ks Nb t , (6.80)
and we assume the total number density of bound atoms to be conserved in time.This version of coagulation is valid in a dense buffer gas, in particular, for particle
growth in an aerosol plasma with micrometer-sized aerosol particles. In the caseof nanosized clusters, the case of a gas rareness (4.109) is realized. Assuming eachcontact of two colliding clusters leads to their joining, we have the cross sectionof the association process for large clusters, that is, consisting of many atoms, asσ D π(r1 C r2)2, where r1 and r2 are the radii of colliding clusters. This leads toa size-dependent expression for the rate constant for cluster joining, which for theliquid drop model of colliding atoms gives
k(n, m) D k0(n1/3 C m1/3)2
rn C m
nm, k0 D r2
W
s8T πma
, (6.81)
where rW is the Wigner–Seitz radius and ma is the mass of a cluster atom. Thisleads to a nonlinear dependence of the average cluster size on time that has theform [118, 119]
n D 6.3(Nb k0 t)1.2 . (6.82)
Since we used the assumption n � 1, this formula is valid under the condition
k0Nb t � 1 .
The coalescence mechanism of cluster growth or Ostwald ripening [116] resultsfrom an equilibrium between clusters and their atomic vapor through processes ofatom attachment to the cluster surface and cluster vaporization. This mechanismis realized at high temperatures where the pressure of an atomic vapor is highenough. Let the critical cluster size be such that the rates of the attachment andevaporation processes are identical for this size. Then clusters of larger size willgrow, whereas clusters of smaller size will evaporate. As a result, the average clustersize will increase.
A strict theory of coalescence [120–124] was elaborated for the case of graingrowth in solid solutions. In this case atoms evaporated from the grain surfacepropagate inside the solid and attach to another grain. As a result, the number ofsmall grains decreases, the number of large grains increases, and the average grainsize increases in time. This process is restricted by slow diffusion of atoms insidethe solid. In the case of a cluster plasma with small clusters according to (4.109),the processes of atom attachment to the cluster surface involving free atoms pro-ceeds fast by analogy with growth of drops in a supersaturated vapor [125, 126].Hence, in this case the coalescence process results from equilibrium between gasof clusters and an atomic vapor [41, 43], and other parameters determine the rateof the coalescence process.
6.3 Cluster Plasma 405
We now consider the general character of coalescence in a cluster plasma as-suming this plasma to consist of a rareness buffer gas in accordance with criteri-on (4.109), an atomic (metal) vapor, and a gas of (metal) clusters. The rate constantfor attachment of an atom to a cluster consisting of n � 1 atoms is given by (6.67)
kn D k0 n2/3 ,
and the rate of atom evaporation from the cluster surface is determined by theprinciple of detailed balance and is
νn D k0n2/3 Nsat(T ) exp ε0 � εn
T
,
where Nsat(T ) is the number density of atoms for the saturated vapor pressure at agiven temperature and ε0� εn is the difference between the atom binding energiesfor a bulk particle and a cluster consisting of n atoms. Taking the atom bindingenergy in a cluster as the sum of the volume and surface parts [127], we obtainthe difference given above for the atom binding energies due to the surface clusterenergies in the form
ε0 � εn D Δεn1/3 ,
and then the critical cluster size ncr for which the rates of atom attachment to acluster and cluster evaporation become identical follows from the relation [40]
Nm D Nsat(T ) exp
Δε
Tn1/3cr
!, (6.83)
where Nm is the equilibrium number density of free atoms. On the basis of theabove rates of cluster growth and evaporation which proceed step by step as a re-sult of addition of one atom to or release of one atom from a cluster, we have thekinetic equation for the size distribution function for clusters f n in the linear ap-proximation as a flux of atoms in a space of cluster sizes [40]:
@ f n
@tD �@ j n
@n, j n D k0 n2/3 f n
�Nm � Nsat(T ) exp
�Δε
Tn1/3
��. (6.84)
The kinetic equation (6.84) describes evolution of the size distribution functionfor the coagulation character of cluster growth. We note the characteristics of thisprocess. The cluster system may be divided into two groups with sizes above andbelow the critical size (6.83), and clusters of one group cannot transfer to othergroup [40]. Therefore, cluster growth in the coalescence process is accompanied byan increase of the cluster critical radius that almost conserves the ratio between thenumbers of clusters for the first and second groups. Next, the rate of cluster growthaccording to (6.84) depends on the parameter
a D ΔεTn1/3 . (6.85)
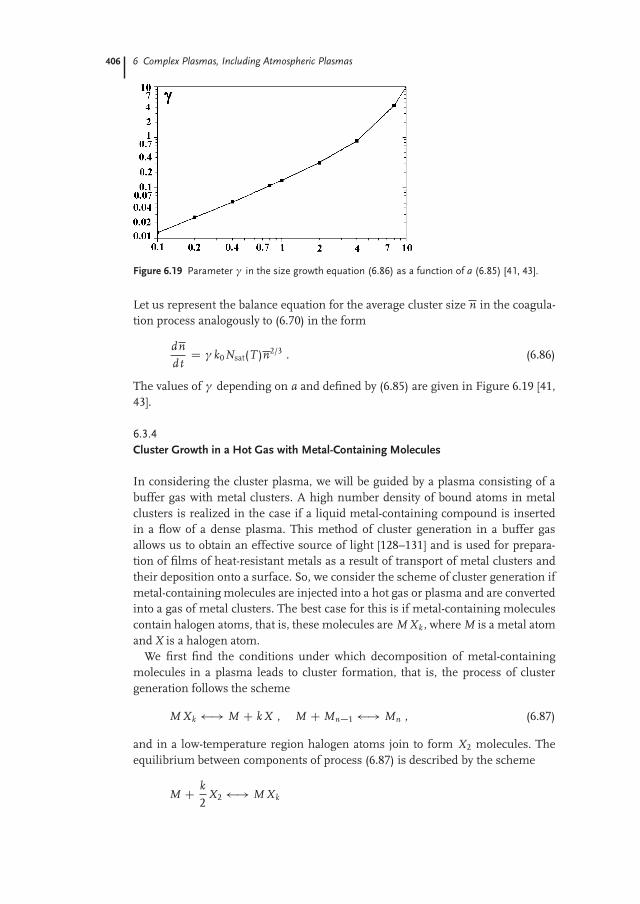
406 6 Complex Plasmas, Including Atmospheric Plasmas
Figure 6.19 Parameter γ in the size growth equation (6.86) as a function of a (6.85) [41, 43].
Let us represent the balance equation for the average cluster size n in the coagula-tion process analogously to (6.70) in the form
dnd tD γ k0Nsat(T )n2/3 . (6.86)
The values of γ depending on a and defined by (6.85) are given in Figure 6.19 [41,43].
6.3.4
Cluster Growth in a Hot Gas with Metal-Containing Molecules
In considering the cluster plasma, we will be guided by a plasma consisting of abuffer gas with metal clusters. A high number density of bound atoms in metalclusters is realized in the case if a liquid metal-containing compound is insertedin a flow of a dense plasma. This method of cluster generation in a buffer gasallows us to obtain an effective source of light [128–131] and is used for prepara-tion of films of heat-resistant metals as a result of transport of metal clusters andtheir deposition onto a surface. So, we consider the scheme of cluster generation ifmetal-containing molecules are injected into a hot gas or plasma and are convertedinto a gas of metal clusters. The best case for this is if metal-containing moleculescontain halogen atoms, that is, these molecules are M Xk , where M is a metal atomand X is a halogen atom.
We first find the conditions under which decomposition of metal-containingmolecules in a plasma leads to cluster formation, that is, the process of clustergeneration follows the scheme
M Xk ! M C k X , M C Mn�1 ! Mn , (6.87)
and in a low-temperature region halogen atoms join to form X2 molecules. Theequilibrium between components of process (6.87) is described by the scheme
M C k2
X2 ! M Xk
6.3 Cluster Plasma 407
and the possibility for the compound M Xk to decay into metal clusters and halogenmolecules is determined roughly by the criterion [41]
ε X < εM ,
where ε X is the binding energy per halogen atom in molecule M Xk and εM is thebinding energy per atom for bulk metal.
From the chemical equilibrium for molecules M Xk it follows that this com-pound decomposes into atoms at temperatures of the order
T1 D ε X
ln(N0/[X ]), (6.88)
where [X ] is the total number density of free and bound halogen atoms, and N0 isof the order of a typical atomic value. In turn, metal clusters are transformed intoatomic vapor at temperatures of the order
T2 D εM
ln(N0/[M ]), (6.89)
where [M ] is the total number density of free and bound metal atoms. Evidently,clusters remain stable in the temperature range [132, 133]
T1 < T < T2 . (6.90)
Because of the halogen excess, [X ] � [M ], the possibility of the existence of clus-ters and gas molecules in the system under consideration corresponds to the crite-rion
ε X < εM < kε X . (6.91)
One can see that these criteria are compatible if the gaseous compound of a heat-resistant metal contains several halogen atoms. The data related to this analysis aregiven in Table 6.3. This table gives the values of ε X and εM that are obtained on thebasis of the Gibbs thermodynamic potential for the compounds under considera-tion, and the values that follow from the enthalpy values for these compounds aregiven in parentheses. The temperatures T1 and T2 follow from (6.88) and (6.89),and the temperature T3 coincides with T2 and results from the saturated vaporpressure of the metal as a function of temperature. The data in Table 6.3 relateto a total number density of halogen atoms of 1 1016 cm�3 and a total numberdensity of metal atoms that is four or six times less depending on the type of metal-containing molecules. If criteria (6.90) are fulfilled, clusters of this metal exist inthe temperature range T1 < T < T2, and such cases are marked in the last columnin Table 6.3 by a plus sign.
We now analyze the character of evolution of a plasma flow with inserted metal-containing molecules in the center of the flow. Then we take argon as a buffergas at a pressure of 1 atm, and metal-containing molecules M Xk are injected intothe central part of the flow of radius 1 mm such that the concentration of metal

408 6 Complex Plasmas, Including Atmospheric Plasmas
atoms after total destruction of metal-containing molecules is 10% with respect toargon atoms. We compare typical times of various processes which are responsi-ble for evolution of this system. As a result of decomposition of metal-containingmolecules, metal atoms are formed and they are transformed into clusters accord-ing to scheme (6.66). For simplicity, we assume the binding energies of each halo-gen atom in the initial molecule M Xk and forming radicals to be identical andequal to ε X . We take the following rates of decay of molecules and radicals in colli-sions with buffer gas atoms:
νd D Nakgas exp� ε X
T
. (6.92)
Here Na is the number density of buffer gas atoms, T is a current temperature ofbuffer gas atoms, and kgas is the gas-kinetic rate constant for collisions of moleculesand radicals with atoms of a buffer gas, that is, kgas D vT σgas, where vT is thethermal velocity of argon atoms, and the gas kinetic cross section of collision isσgas D 3 10�15 cm2. We assume the rate νd to be independent of the number ofhalogen atoms k in the molecule or radicals.
Let us apply this scheme to metal-containing molecules MoF6, WF6, IrF6, andWCl6 at the temperature T� in the center of a flow that is given by Nm/Nsat(T�) 10 for MoF6 and WF6, and Nm/Nsat(T�) 1000 for IrF6 and WCl6, where Nm
is the total number density of metal atoms in metal-containing molecules, Nsat isthe number density of metal toms at the saturated vapor pressure for the indicatedtemperature, and T� � ε X . Under the above assumption, the time for decompo-
Table 6.3 Parameters of some compounds of heat-resistant metals [41].
Compound ε X εM T1, 103 K T2, 103 K T3, 103 K Cluster existence
HfCl4 (4.2) 6.0 (6.4) (2.4) 3.0 (3.2) 3.15 CHfF4 (6.3) 6.0 (6.4) (3.5) 3.0 (3.2) 3.15 –
ThCl4 (4.7) 5.8 (6.2) (2.6) 3.0 (3.1) 3.12 CThF4 6.2 (6.5) 5.8 (6.2) 3.5 (3.6) 3.0 (3.1) 3.12 –TiBr4 3.0 (3.2) 4.4 (4.9) 1.7 (1.8) 2.2 (2.5) 2.28 CTiCl4 3.5 (3.8) 4.4 (4.9) 2.0 (2.1) 2.2 (2.5) 2.28 CUCl4 3.8 (4.1) 5.1 (5.5) 2.1 (2.3) 2.6 (2.8) 2.73 CUF4 5.7 (5.9) 5.1 (5.5) 3.2 (3.3) 2.6 (2.8) 2.73 –
ZrCl4 4.3 (4.8) 5.9 (6.3) 2.4 (2.7) 3.0 (3.2) 3.08 CZrF4 6.5 (6.9) 5.9 (6.3) 3.6 (3.9) 3.0 (3.2) 3.08 –
IrF6 2.2 (2.5) 6.4 (6.9) 1.2 (1.4) 3.2 (3.5) 3.15 CMoF6 3.9 (4.2) 6.3 (6.8) 2.2 (2.4) 3.2 (3.4) 3.19 CUCl6 3.0 (3.3) 5.1 (5.5) 1.7 (1.8) 2.6 (2.8) 2.73 CUF6 4.7 (5.0) 5.1 (5.5) 2.6 (2.8) 2.6 (2.8) 2.73 –
WCl6 (3.0) 8.4 (8.8) (1.7) 4.2 (4.4) 4.04 CWF6 4.5 (4.9) 8.4 (8.8) 2.5 (2.7) 4.2 (4.4) 4.04 C

6.3 Cluster Plasma 409
sition of metal-containing molecules is
τchem D 6νd(T )
D 6Nakgas exp
�� ε XT
� . (6.93)
We compare this time with the time for conversion of free metal atoms into metalclusters in the case of prompt decomposition of metal-containing molecules thatis given by (6.74). Since this time is short compared with the time for flow drift inan aggregation tube, the coagulation mechanism may determine the subsequentcluster growth, and the average cluster size is given by (6.80) or by (6.82).
Table 6.4 contains some results for this regime of cluster generation to representthe real character of the cluster generation process. We assume metal-containingmolecules to be injected into a cylinder of radius �0 D 1 mm in the flow center,and this radius is small compared with the tube radius; the argon pressure is p D1 atm, and the concentration of metal-containing molecules is cM D 1% in thecentral part with respect to argon atoms. For definiteness we take the flow velocityw D 300 cm/s and the tube length l D 30 cm, that is, the time for the flow beinglocated inside the tube is 0.1 s.
Let us give some comments regarding the data in Table 6.4. Here � is the densityof metal-containing compounds at room temperature, Tm and Tb are their meltingand boiling temperatures, respectively, ε X is the binding energy per halogen atomin this compound, εM is the binding energy per metal atom in the bulk metal, thetemperatures T1 and T2 are given by (6.88) and (6.89), cM δT is the temperatureincrease resulting from process (6.87) if the extracted energy is consumed on heat-ing of the buffer gas, T� is the temperature at the tube center, which is chosen asindicated above, and Na is the number density of argon atoms at a pressure of 1atm, so the total number density of metal atoms (free and bound) is Nm D 0.01Na.
To estimate the character of consumption of metal-containing compound, wegive in Table 6.4 the rate dM/d t of the compound flux, that is, the compound massinserted in the argon flux, and the rate of deposition d l/d t, that is, the rate offilm growth d l/d t if the flux of metal clusters is deposited on a substratum. Thesevalues are given by formulas
dMdtD π�2w Nmmc ,
d ld tD 4r3
W
3m�2
dMdt
,
where Mc and m are the masses of a metal-contained molecule and a metal atom,respectively.
We now determine the kinetic parameters of this system under the above con-ditions. The time τchem for destruction of a metal-containing molecule followsfrom (6.93), and a typical time for heat transport is given by
τheat D �20
4�,
where � is the thermal diffusivity coefficient of argon. As is seen, usually heattransport proceeds faster than release of free metal atoms, and heating of argon due
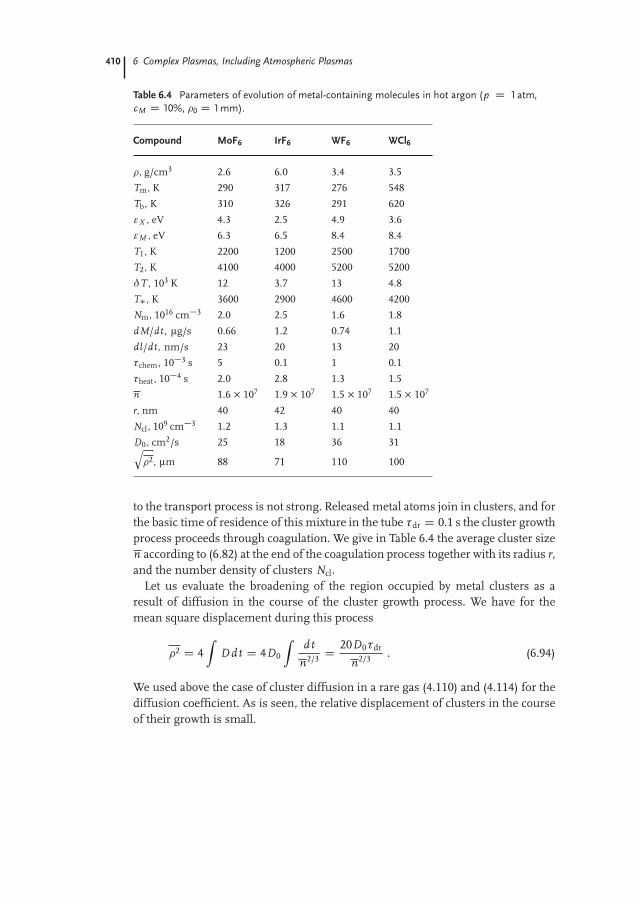
410 6 Complex Plasmas, Including Atmospheric Plasmas
Table 6.4 Parameters of evolution of metal-containing molecules in hot argon (p D 1 atm,
cM D 10%, �0 D 1 mm).
Compound MoF6 IrF6 WF6 WCl6
�, g/cm3 2.6 6.0 3.4 3.5Tm, K 290 317 276 548
Tb, K 310 326 291 620
ε X , eV 4.3 2.5 4.9 3.6εM , eV 6.3 6.5 8.4 8.4
T1, K 2200 1200 2500 1700T2, K 4100 4000 5200 5200
δT , 103 K 12 3.7 13 4.8
T�, K 3600 2900 4600 4200Nm, 1016 cm�3 2.0 2.5 1.6 1.8
dM/dt, μg/s 0.66 1.2 0.74 1.1
dl/dt, nm/s 23 20 13 20τchem, 10�3 s 5 0.1 1 0.1
τheat, 10�4 s 2.0 2.8 1.3 1.5n 1.6 � 107 1.9 � 107 1.5 � 107 1.5 � 107
r, nm 40 42 40 40
Ncl, 109 cm�3 1.2 1.3 1.1 1.1D0, cm2/s 25 18 36 31q
�2, μm 88 71 110 100
to the transport process is not strong. Released metal atoms join in clusters, and forthe basic time of residence of this mixture in the tube τdr D 0.1 s the cluster growthprocess proceeds through coagulation. We give in Table 6.4 the average cluster sizen according to (6.82) at the end of the coagulation process together with its radius r,and the number density of clusters Ncl.
Let us evaluate the broadening of the region occupied by metal clusters as aresult of diffusion in the course of the cluster growth process. We have for themean square displacement during this process
�2 D 4Z
D dt D 4D0
Zd t
n2/3 D20D0τdr
n2/3 . (6.94)
We used above the case of cluster diffusion in a rare gas (4.110) and (4.114) for thediffusion coefficient. As is seen, the relative displacement of clusters in the courseof their growth is small.
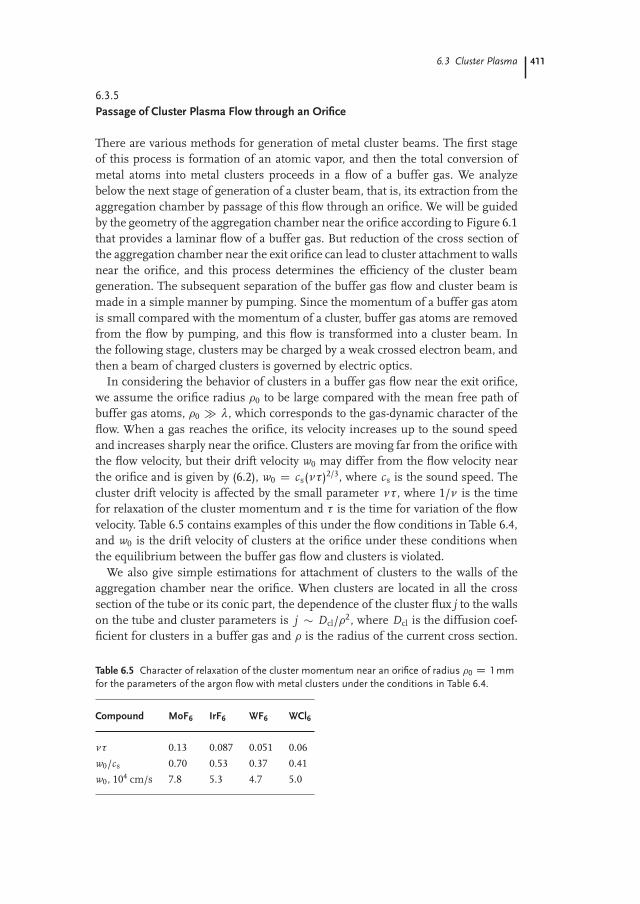
6.3 Cluster Plasma 411
6.3.5
Passage of Cluster Plasma Flow through an Orifice
There are various methods for generation of metal cluster beams. The first stageof this process is formation of an atomic vapor, and then the total conversion ofmetal atoms into metal clusters proceeds in a flow of a buffer gas. We analyzebelow the next stage of generation of a cluster beam, that is, its extraction from theaggregation chamber by passage of this flow through an orifice. We will be guidedby the geometry of the aggregation chamber near the orifice according to Figure 6.1that provides a laminar flow of a buffer gas. But reduction of the cross section ofthe aggregation chamber near the exit orifice can lead to cluster attachment to wallsnear the orifice, and this process determines the efficiency of the cluster beamgeneration. The subsequent separation of the buffer gas flow and cluster beam ismade in a simple manner by pumping. Since the momentum of a buffer gas atomis small compared with the momentum of a cluster, buffer gas atoms are removedfrom the flow by pumping, and this flow is transformed into a cluster beam. Inthe following stage, clusters may be charged by a weak crossed electron beam, andthen a beam of charged clusters is governed by electric optics.
In considering the behavior of clusters in a buffer gas flow near the exit orifice,we assume the orifice radius �0 to be large compared with the mean free path ofbuffer gas atoms, �0 � λ, which corresponds to the gas-dynamic character of theflow. When a gas reaches the orifice, its velocity increases up to the sound speedand increases sharply near the orifice. Clusters are moving far from the orifice withthe flow velocity, but their drift velocity w0 may differ from the flow velocity nearthe orifice and is given by (6.2), w0 D cs(ντ)2/3, where cs is the sound speed. Thecluster drift velocity is affected by the small parameter ντ, where 1/ν is the timefor relaxation of the cluster momentum and τ is the time for variation of the flowvelocity. Table 6.5 contains examples of this under the flow conditions in Table 6.4,and w0 is the drift velocity of clusters at the orifice under these conditions whenthe equilibrium between the buffer gas flow and clusters is violated.
We also give simple estimations for attachment of clusters to the walls of theaggregation chamber near the orifice. When clusters are located in all the crosssection of the tube or its conic part, the dependence of the cluster flux j to the wallson the tube and cluster parameters is j � Dcl/�2, where Dcl is the diffusion coef-ficient for clusters in a buffer gas and � is the radius of the current cross section.
Table 6.5 Character of relaxation of the cluster momentum near an orifice of radius �0 D 1 mm
for the parameters of the argon flow with metal clusters under the conditions in Table 6.4.
Compound MoF6 IrF6 WF6 WCl6
ντ 0.13 0.087 0.051 0.06
w0/cs 0.70 0.53 0.37 0.41w0, 104 cm/s 7.8 5.3 4.7 5.0
412 6 Complex Plasmas, Including Atmospheric Plasmas
For the portion of clusters � which attach to the walls near the orifice this gives
� � Dcl
w0�0 tan α,
where w0 is the drift velocity of clusters near the orifice, �0 is the orifice radius,and α is the cone angle (Figure 6.1). If we use (4.114) for the diffusion coefficientand (6.2) for the drift velocity of clusters, we obtain the following dependence forthe potion of attachment clusters on a typical cluster size n, the number density Na
of buffer gas atoms, and the orifice radius:
� � 1
n4/9N 5/3a �
5/30
.
From this it follows that attachment of clusters to the walls near the orifice becomesimportant at low pressures of the buffer gas, a small radius of the orifice, and notlarge cluster sizes.
Let us consider one more plasma effect that can influence transport of clusters tothe walls. If a plasma consists of electrons and positive ions, clusters are negativelycharged because of the higher mobility of electrons. As this plasma relaxes in thecourse of its drift toward the orifice, electrons and ions go to the walls. As a result,this plasma becomes charged, and its charge may be connected with clusters. Thischarge creates an electric field that accelerates attachment of clusters to the walls.This effect may be of importance for a certain cluster plasma [60].
6.4
Plasma Processes in the Earth’s Atmosphere
6.4.1
Processes in Atmospheric Plasmas
In the foregoing discussion, we examined general principles and concepts relatingto plasmas. We shall now apply general plasma principles and concepts to atmo-spheric plasmas, the properties of which depend strongly on the altitude above theEarth’s surface and have specifics for each altitude. Plasmas in the upper atmo-sphere are generated by the absorption of solar radiation that ionizes oxygen atomsand nitrogen molecules. Plasmas in the lower layers of the atmosphere have prop-erties depending on transport processes of charged and excited atoms, and also onthe heat balance of these low-lying atmospheric layers.
Atmospheric plasmas can be used to illustrate the elementary collision process-es that can occur in a weakly ionized plasma. Table 6.6 contains a list of basicatmospheric plasma processes, and we will be referring to this in the analysis ofatmospheric phenomena. These processes are an explicit illustration of the datain Tables 2.16–2.19. We can use photoprocesses as the first example. Processes 1–3 in Table 6.6 are responsible for formation of charged particles in the upper at-mosphere, and process 4 is associated with the production of atomic oxygen. The

6.4 Plasma Processes in the Earth’s Atmosphere 413
process that is the inverse of process 5 gives the main contribution to glow in thenight sky, and processes 7–10 determine auroral radiation.
As an introduction to the study of atmospheric plasmas, we consider generalproperties of the Earth’s atmosphere. The heat balance of the Earth is represent-ed in Table 6.7. The source of the Earth’s heat balance is solar radiation. Solarradiation can be approximated by radiation of a blackbody with an effective tem-perature of 5800 K, corresponding to a radiation flux of 6.4 kW/cm2 from its sur-face, mostly in the visible region of the spectrum. But in contrast to a blackbody,solar radiation contains a remarkable flux in UV and vacuum UV (VUV) spec-tra that is responsible for ionization processes in the Earth’s atmosphere. Theradiative flux is 0.137 W/cm2 at the distance of the Earth from the Sun, whichtranslates to 1.74 1014 kW of solar power reaching the Earth’s atmosphere. Thesame amount of power then emanates from the Earth in the form of emissionfrom the Earth’s surface and atmosphere as infrared radiation, and reflection bythe Earth’s surface and atmosphere. The surface of the Earth receives and returns2.5 1014 kW of power, whereas the Earth including its atmosphere receives andreturns 2.69 1014 kW of power. If the Earth is regarded as an ideal blackbody,the emitted infrared radiation corresponds to an effective surface temperature of291 K. Absorption of solar UV radiation by molecules and atoms of the Earth’satmosphere determines ionization and chemical processes in upper atmospherelayers. The optical density of the Earth’s atmosphere for this radiation is high, andtherefore radiation of short wavelengths is absorbed at high altitudes. Figure 6.20shows the altitudes at which solar radiation of a given wavelength is absorbed [134].
The Earth’s atmosphere at sea level consists mostly of molecular nitrogen(78%), molecular oxygen (21%), and argon (about 1%); the total number densi-ty of molecules and atoms is 2.7 1019 cm�3 (at a pressure of 1 atm). The numberdensity of molecules decreases with increasing altitude h as given by the barometric
Figure 6.20 The boundary altitudes for absorption of solar UV radiation of a given wave-
length [134].
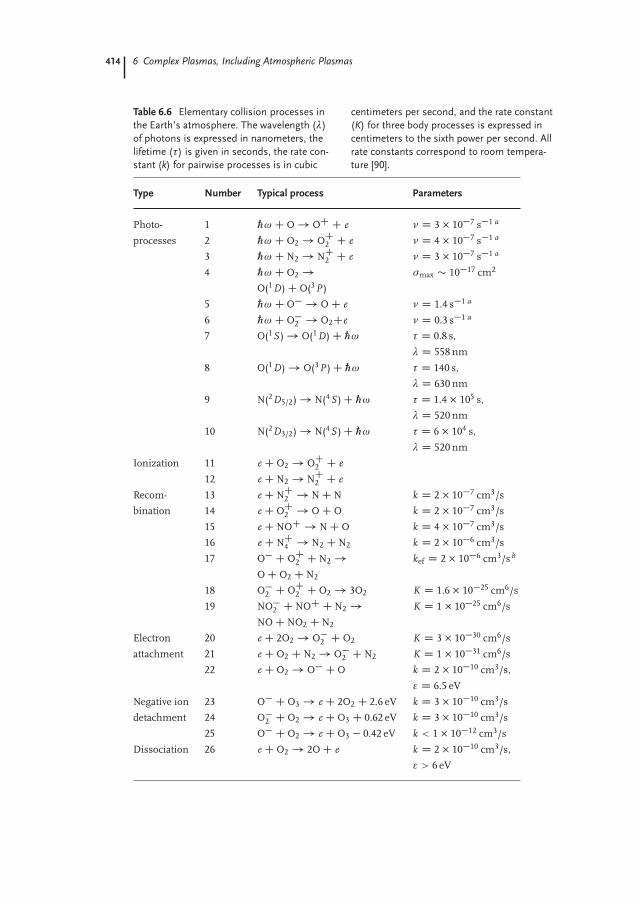
414 6 Complex Plasmas, Including Atmospheric Plasmas
Table 6.6 Elementary collision processes in
the Earth’s atmosphere. The wavelength (λ)
of photons is expressed in nanometers, the
lifetime (τ) is given in seconds, the rate con-
stant (k) for pairwise processes is in cubic
centimeters per second, and the rate constant
(K) for three body processes is expressed in
centimeters to the sixth power per second. All
rate constants correspond to room tempera-
ture [90].
Type Number Typical process Parameters
Photo- 1 „ω C O ! OC C e ν D 3 � 10�7 s�1 a
processes 2 „ω C O2 ! OC2 C e ν D 4 � 10�7 s�1 a
3 „ω C N2 ! NC2 C e ν D 3 � 10�7 s�1 a
4 „ω C O2 ! σmax � 10�17 cm2
O(1D) C O(3P )
5 „ω C O� ! O C e ν D 1.4 s�1 a
6 „ω C O�2 ! O2Ce ν D 0.3 s�1 a
7 O(1S ) ! O(1D) C „ω τ D 0.8 s,
λ D 558 nm
8 O(1D) ! O(3P ) C „ω τ D 140 s,λ D 630 nm
9 N(2D5/2) ! N(4S ) C „ω τ D 1.4 � 105 s,λ D 520 nm
10 N(2D3/2) ! N(4S ) C „ω τ D 6 � 104 s,
λ D 520 nmIonization 11 e C O2 ! OC
2 C e
12 e C N2 ! NC2 C e
Recom- 13 e C NC2 ! N C N k D 2 � 10�7 cm3/s
bination 14 e C OC2 ! O C O k D 2 � 10�7 cm3/s
15 e C NOC ! N C O k D 4 � 10�7 cm3/s16 e C NC
4 ! N2 C N2 k D 2 � 10�6 cm3/s
17 O� C OC2 C N2 ! kef D 2 � 10�6 cm3/s b
O C O2 C N2
18 O�2 C OC
2 C O2 ! 3O2 K D 1.6 � 10�25 cm6/s
19 NO�2 C NOC C N2 ! K D 1 � 10�25 cm6/s
NO C NO2 C N2
Electron 20 e C 2O2 ! O�2 C O2 K D 3 � 10�30 cm6/s
attachment 21 e C O2 C N2 ! O�2 C N2 K D 1 � 10�31 cm6/s
22 e C O2 ! O� C O k D 2 � 10�10 cm3/s,
ε D 6.5 eV
Negative ion 23 O� C O3 ! e C 2O2 C 2.6 eV k D 3 � 10�10 cm3/sdetachment 24 O�
2 C O2 ! e C O3 C 0.62 eV k D 3 � 10�10 cm3/s
25 O� C O2 ! e C O3 � 0.42 eV k < 1 � 10�12 cm3/s
Dissociation 26 e C O2 ! 2O C e k D 2 � 10�10 cm3/s,ε > 6 eV
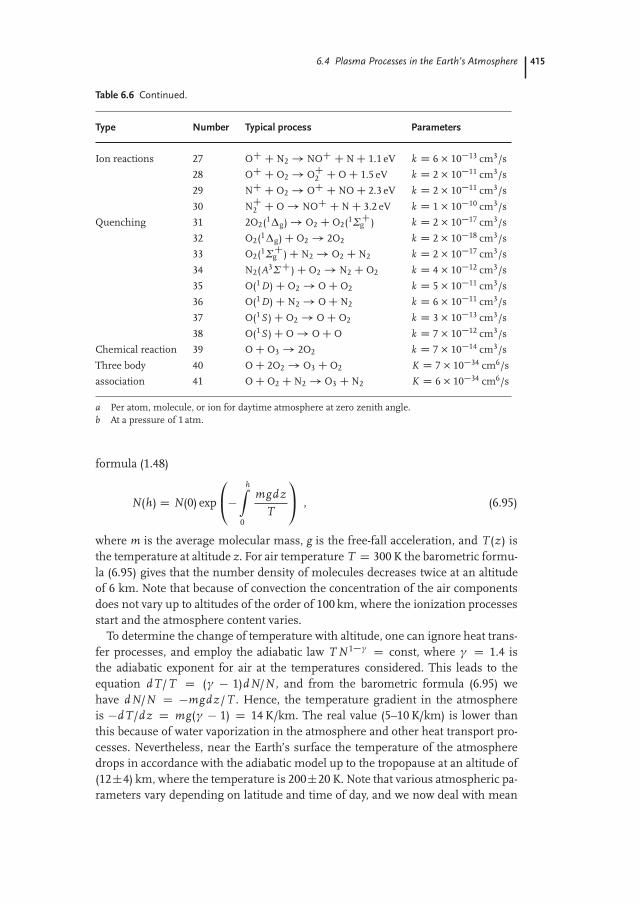
6.4 Plasma Processes in the Earth’s Atmosphere 415
Table 6.6 Continued.
Type Number Typical process Parameters
Ion reactions 27 OC C N2 ! NOC C N C 1.1 eV k D 6 � 10�13 cm3/s28 OC C O2 ! OC
2 C O C 1.5 eV k D 2 � 10�11 cm3/s
29 NC C O2 ! OC C NO C 2.3 eV k D 2 � 10�11 cm3/s
30 NC2 C O ! NOC C N C 3.2 eV k D 1 � 10�10 cm3/s
Quenching 31 2O2(1Δg) ! O2 C O2(1Σ Cg ) k D 2 � 10�17 cm3/s
32 O2(1Δg) C O2 ! 2O2 k D 2 � 10�18 cm3/s33 O2(1Σ C
g ) C N2 ! O2 C N2 k D 2 � 10�17 cm3/s
34 N2(A3Σ C) C O2 ! N2 C O2 k D 4 � 10�12 cm3/s
35 O(1D) C O2 ! O C O2 k D 5 � 10�11 cm3/s36 O(1D) C N2 ! O C N2 k D 6 � 10�11 cm3/s
37 O(1S ) C O2 ! O C O2 k D 3 � 10�13 cm3/s
38 O(1S ) C O ! O C O k D 7 � 10�12 cm3/sChemical reaction 39 O C O3 ! 2O2 k D 7 � 10�14 cm3/s
Three body 40 O C 2O2 ! O3 C O2 K D 7 � 10�34 cm6/sassociation 41 O C O2 C N2 ! O3 C N2 K D 6 � 10�34 cm6/s
a Per atom, molecule, or ion for daytime atmosphere at zero zenith angle.b At a pressure of 1 atm.
formula (1.48)
N(h) D N(0) exp
0@� hZ0
mgdzT
1A , (6.95)
where m is the average molecular mass, g is the free-fall acceleration, and T(z) isthe temperature at altitude z. For air temperature T D 300 K the barometric formu-la (6.95) gives that the number density of molecules decreases twice at an altitudeof 6 km. Note that because of convection the concentration of the air componentsdoes not vary up to altitudes of the order of 100 km, where the ionization processesstart and the atmosphere content varies.
To determine the change of temperature with altitude, one can ignore heat trans-fer processes, and employ the adiabatic law T N 1�γ D const, where γ D 1.4 isthe adiabatic exponent for air at the temperatures considered. This leads to theequation dT/T D (γ � 1)dN/N , and from the barometric formula (6.95) wehave dN/N D �mgdz/T . Hence, the temperature gradient in the atmosphereis �dT/dz D mg(γ � 1) D 14 K/km. The real value (5–10 K/km) is lower thanthis because of water vaporization in the atmosphere and other heat transport pro-cesses. Nevertheless, near the Earth’s surface the temperature of the atmospheredrops in accordance with the adiabatic model up to the tropopause at an altitude of(12˙4) km, where the temperature is 200˙20 K. Note that various atmospheric pa-rameters vary depending on latitude and time of day, and we now deal with mean
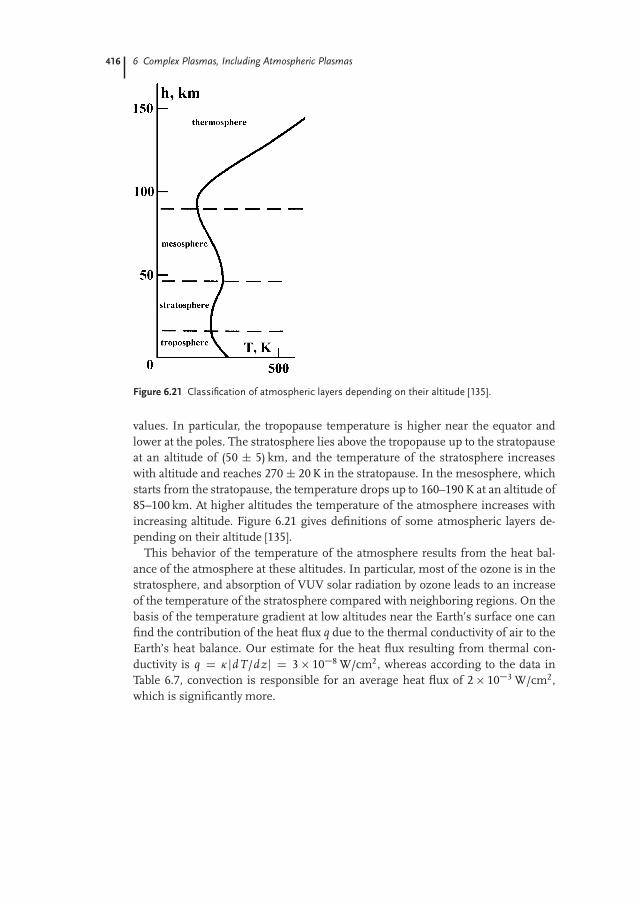
416 6 Complex Plasmas, Including Atmospheric Plasmas
Figure 6.21 Classification of atmospheric layers depending on their altitude [135].
values. In particular, the tropopause temperature is higher near the equator andlower at the poles. The stratosphere lies above the tropopause up to the stratopauseat an altitude of (50 ˙ 5) km, and the temperature of the stratosphere increaseswith altitude and reaches 270˙ 20 K in the stratopause. In the mesosphere, whichstarts from the stratopause, the temperature drops up to 160–190 K at an altitude of85–100 km. At higher altitudes the temperature of the atmosphere increases withincreasing altitude. Figure 6.21 gives definitions of some atmospheric layers de-pending on their altitude [135].
This behavior of the temperature of the atmosphere results from the heat bal-ance of the atmosphere at these altitudes. In particular, most of the ozone is in thestratosphere, and absorption of VUV solar radiation by ozone leads to an increaseof the temperature of the stratosphere compared with neighboring regions. On thebasis of the temperature gradient at low altitudes near the Earth’s surface one canfind the contribution of the heat flux q due to the thermal conductivity of air to theEarth’s heat balance. Our estimate for the heat flux resulting from thermal con-ductivity is q D �jdT/dzj D 3 10�8 W/cm2, whereas according to the data inTable 6.7, convection is responsible for an average heat flux of 2 10�3 W/cm2,which is significantly more.
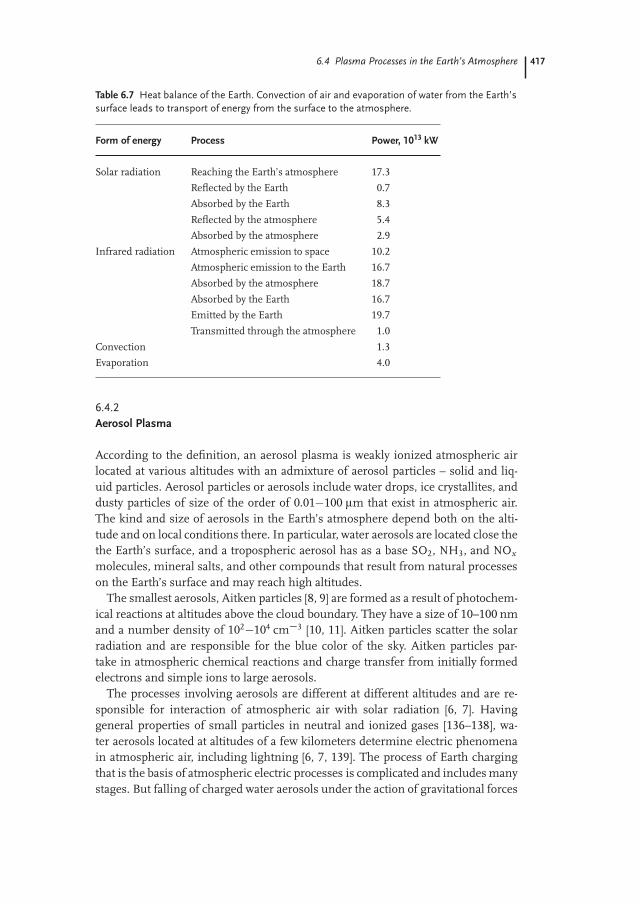
6.4 Plasma Processes in the Earth’s Atmosphere 417
Table 6.7 Heat balance of the Earth. Convection of air and evaporation of water from the Earth’s
surface leads to transport of energy from the surface to the atmosphere.
Form of energy Process Power, 1013 kW
Solar radiation Reaching the Earth’s atmosphere 17.3Reflected by the Earth 0.7
Absorbed by the Earth 8.3
Reflected by the atmosphere 5.4Absorbed by the atmosphere 2.9
Infrared radiation Atmospheric emission to space 10.2Atmospheric emission to the Earth 16.7
Absorbed by the atmosphere 18.7
Absorbed by the Earth 16.7Emitted by the Earth 19.7
Transmitted through the atmosphere 1.0
Convection 1.3Evaporation 4.0
6.4.2
Aerosol Plasma
According to the definition, an aerosol plasma is weakly ionized atmospheric airlocated at various altitudes with an admixture of aerosol particles – solid and liq-uid particles. Aerosol particles or aerosols include water drops, ice crystallites, anddusty particles of size of the order of 0.01�100 μm that exist in atmospheric air.The kind and size of aerosols in the Earth’s atmosphere depend both on the alti-tude and on local conditions there. In particular, water aerosols are located close thethe Earth’s surface, and a tropospheric aerosol has as a base SO2, NH3, and NOx
molecules, mineral salts, and other compounds that result from natural processeson the Earth’s surface and may reach high altitudes.
The smallest aerosols, Aitken particles [8, 9] are formed as a result of photochem-ical reactions at altitudes above the cloud boundary. They have a size of 10–100 nmand a number density of 102�104 cm�3 [10, 11]. Aitken particles scatter the solarradiation and are responsible for the blue color of the sky. Aitken particles par-take in atmospheric chemical reactions and charge transfer from initially formedelectrons and simple ions to large aerosols.
The processes involving aerosols are different at different altitudes and are re-sponsible for interaction of atmospheric air with solar radiation [6, 7]. Havinggeneral properties of small particles in neutral and ionized gases [136–138], wa-ter aerosols located at altitudes of a few kilometers determine electric phenomenain atmospheric air, including lightning [6, 7, 139]. The process of Earth chargingthat is the basis of atmospheric electric processes is complicated and includes manystages. But falling of charged water aerosols under the action of gravitational forces
418 6 Complex Plasmas, Including Atmospheric Plasmas
is the only way to create an electric current that charges the Earth’s surface. In turn,the Earth’s electric field is of importance for charging of aerosols, and such pro-cesses will be considered below. Aerosol particles in the Earth’s atmosphere maybe formed by natural processes and as a result of human activity [140].
When solid clusters join as a result of contact between them in atmospheric air,porous structures can be formed in which solid clusters conserve their individuali-ty. These structures are fractal aggregates if their joining takes place in the absenceof external fields. This name results from the dependence of the matter density infractal aggregates on their size. The specifics of growth of fractal aggregates in abuffer gas are connected to the diffusion character of their motion. This can leadto a nonlinear dependence of the nucleation rate on the aggregate number den-sity. Because of the micrometer size of fractal aggregates, they interact effectivelywith external fields. Even small electric fields can cause an effective interaction be-tween fractal aggregates through the interaction of induced charges. As a result ofnucleation in an external electric field, so-called fractal fibers are formed that areelongated fractal structures.
6.4.3
The Ionosphere as a Mirror for Electromagnetic Waves
The history of exploration of the Earth’s ionosphere starts from Marconi’s exper-iment in 1901 when he tried to establish radio contact between two continents.The transmitter had been set up in Europe on the Cornwall peninsula in England,and the receiver was located in Canada, on the Newfoundland peninsula. Fromthe standpoint of wave propagation theory, this experiment seemed to be hopeless.According to the laws of geometrical optics, radio waves should propagate at suchdistances with rectilinear beams, and radio connection for these distances seemedto be precluded by the spherical form of the Earth’s surface. The experiment led to asurprising result: the signal was detected by the receiver and its intensity exceededestimates by many orders of magnitude.
The only explanation for this discrepancy was the existence of a radio mirror inthe Earth’s atmosphere that reflects radio waves. The radio mirror model assumesthat waves follow rectilinear paths and repeatedly reflect between the surface of theEarth and this upper-atmosphere radio mirror. In 1902, O. Heaviside and A. Ken-nelly assumed that the role of this radio mirror is played by an ionized layer inthe atmosphere. This was confirmed in 1924–1925 by an experiment conducted bya group of English physicists from Cambridge University ([180, 181]). Placing thereceiver at a distance of 400 m from the transmitter, they determined by measure-ment of the time delay for the reflected signal to arrive that the reflector is at analtitude of 100–120 km. This reflecting layer, which was referred to earlier as theHeaviside layer, is now called the E layer (based on the designation of the electricfield vector for radio waves). Subsequently, the existence of ionized gas was discov-ered at other altitudes. The part of the atmosphere that contains ionized gases iscalled the ionosphere [141].
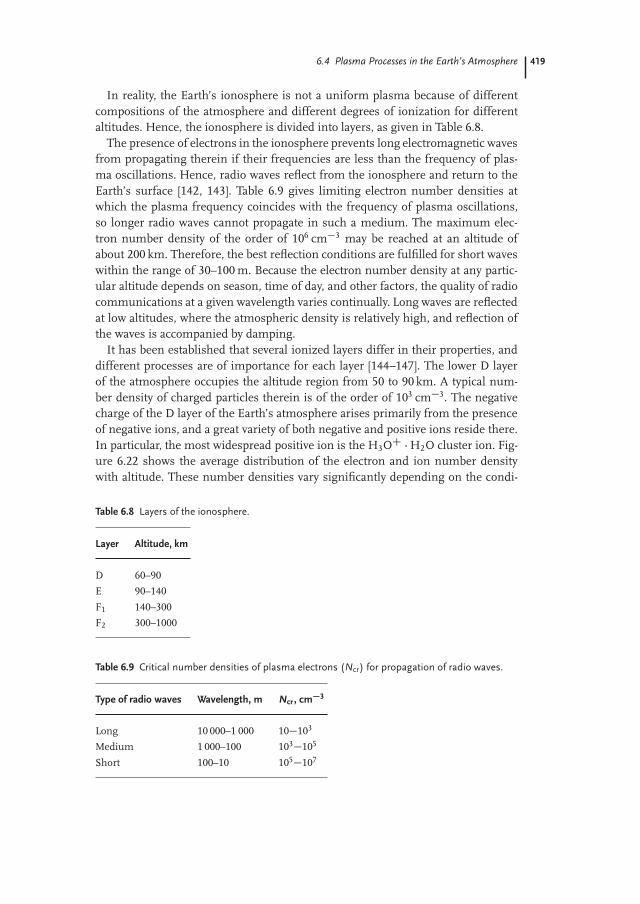
6.4 Plasma Processes in the Earth’s Atmosphere 419
In reality, the Earth’s ionosphere is not a uniform plasma because of differentcompositions of the atmosphere and different degrees of ionization for differentaltitudes. Hence, the ionosphere is divided into layers, as given in Table 6.8.
The presence of electrons in the ionosphere prevents long electromagnetic wavesfrom propagating therein if their frequencies are less than the frequency of plas-ma oscillations. Hence, radio waves reflect from the ionosphere and return to theEarth’s surface [142, 143]. Table 6.9 gives limiting electron number densities atwhich the plasma frequency coincides with the frequency of plasma oscillations,so longer radio waves cannot propagate in such a medium. The maximum elec-tron number density of the order of 106 cm�3 may be reached at an altitude ofabout 200 km. Therefore, the best reflection conditions are fulfilled for short waveswithin the range of 30–100 m. Because the electron number density at any partic-ular altitude depends on season, time of day, and other factors, the quality of radiocommunications at a given wavelength varies continually. Long waves are reflectedat low altitudes, where the atmospheric density is relatively high, and reflection ofthe waves is accompanied by damping.
It has been established that several ionized layers differ in their properties, anddifferent processes are of importance for each layer [144–147]. The lower D layerof the atmosphere occupies the altitude region from 50 to 90 km. A typical num-ber density of charged particles therein is of the order of 103 cm�3. The negativecharge of the D layer of the Earth’s atmosphere arises primarily from the presenceof negative ions, and a great variety of both negative and positive ions reside there.In particular, the most widespread positive ion is the H3OC �H2O cluster ion. Fig-ure 6.22 shows the average distribution of the electron and ion number densitywith altitude. These number densities vary significantly depending on the condi-
Table 6.8 Layers of the ionosphere.
Layer Altitude, km
D 60–90E 90–140
F1 140–300F2 300–1000
Table 6.9 Critical number densities of plasma electrons (Ncr) for propagation of radio waves.
Type of radio waves Wavelength, m Ncr, cm�3
Long 10 000–1 000 10�103
Medium 1 000–100 103�105
Short 100–10 105�107
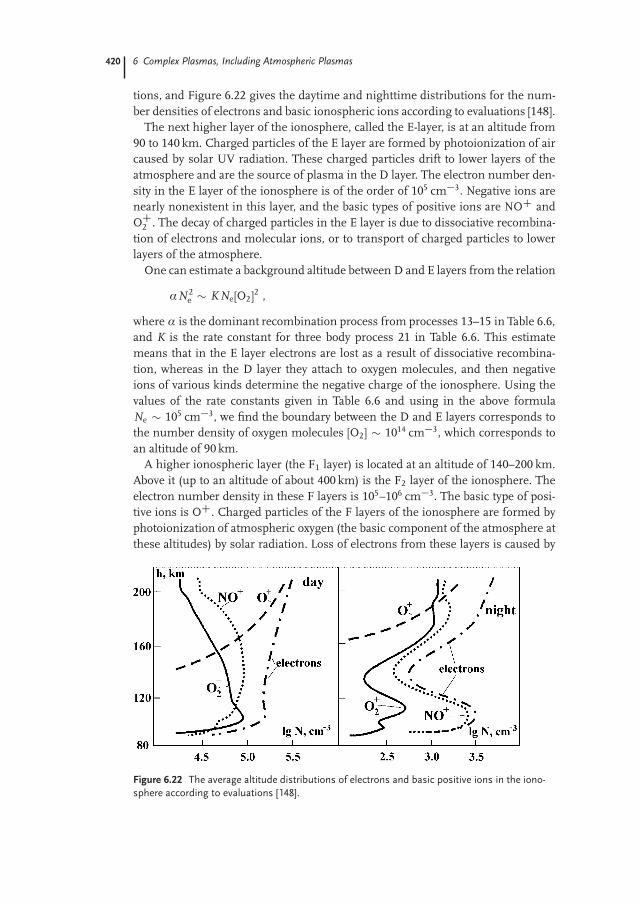
420 6 Complex Plasmas, Including Atmospheric Plasmas
tions, and Figure 6.22 gives the daytime and nighttime distributions for the num-ber densities of electrons and basic ionospheric ions according to evaluations [148].
The next higher layer of the ionosphere, called the E-layer, is at an altitude from90 to 140 km. Charged particles of the E layer are formed by photoionization of aircaused by solar UV radiation. These charged particles drift to lower layers of theatmosphere and are the source of plasma in the D layer. The electron number den-sity in the E layer of the ionosphere is of the order of 105 cm�3. Negative ions arenearly nonexistent in this layer, and the basic types of positive ions are NOC andOC
2 . The decay of charged particles in the E layer is due to dissociative recombina-tion of electrons and molecular ions, or to transport of charged particles to lowerlayers of the atmosphere.
One can estimate a background altitude between D and E layers from the relation
αN 2e � K Ne[O2]2 ,
where α is the dominant recombination process from processes 13–15 in Table 6.6,and K is the rate constant for three body process 21 in Table 6.6. This estimatemeans that in the E layer electrons are lost as a result of dissociative recombina-tion, whereas in the D layer they attach to oxygen molecules, and then negativeions of various kinds determine the negative charge of the ionosphere. Using thevalues of the rate constants given in Table 6.6 and using in the above formulaNe � 105 cm�3, we find the boundary between the D and E layers corresponds tothe number density of oxygen molecules [O2] � 1014 cm�3, which corresponds toan altitude of 90 km.
A higher ionospheric layer (the F1 layer) is located at an altitude of 140–200 km.Above it (up to an altitude of about 400 km) is the F2 layer of the ionosphere. Theelectron number density in these F layers is 105–106 cm�3. The basic type of posi-tive ions is OC. Charged particles of the F layers of the ionosphere are formed byphotoionization of atmospheric oxygen (the basic component of the atmosphere atthese altitudes) by solar radiation. Loss of electrons from these layers is caused by
Figure 6.22 The average altitude distributions of electrons and basic positive ions in the iono-
sphere according to evaluations [148].
6.4 Plasma Processes in the Earth’s Atmosphere 421
photorecombination of electrons and oxygen ions, photoattachment of electrons tooxygen atoms, and by transport of electrons to lower atmospheric layers.
The E and F layers of the ionosphere, as layers with a high number density ofelectrons, are responsible for reflection of radio signals, so these layers are the radiomirror of the atmosphere for radio waves. But their role is broader than this func-tion. The altitudes at which they occur are the most convenient for operation ofartificial satellites. Also, the interesting physical phenomenon, the aurora, occursat these altitudes. An aurora occurs when a flow of solar protons penetrates theatmosphere. Charge exchange of these protons and their deceleration takes placein the E and F layers of the atmosphere. The subsequent chain of elementary pro-cesses leads to formation of excited atoms whose radiation is observed from theEarth as an aurora.
One of the characteristics of auroras is that their radiation is created by forbid-den transitions of atoms and ions that cannot be modelled in the laboratory. Inparticular, processes 7–10 in Table 6.6 usually give the principal contributions tothe radiation of auroras. Under laboratory conditions, these excited states of atomsand ions are quenched by collisions with air molecules. The probabilities for an ex-cited atom to radiate and to be quenched are equal at a number density of quench-ing particles given by (k τ)�1, where τ is the radiative lifetime of the excited atom,and k is the rate constant for collision quenching. The excited oxygen atom O(1S )is quenched in the upper atmosphere mainly by atomic oxygen (process 38 in Ta-ble 6.6), and the threshold number density of oxygen atoms is 2 1011 cm�3. Inthe case of O(1D) the main quenching mechanism in the ionosphere is process36 in Table 6.6. This gives the threshold number density of nitrogen molecules as108 cm�3. If the number density of quenching particles is lower than the valuesgiven above, radiation of the corresponding excited atoms may be significant.
6.4.4
Atomic Oxygen in the Upper Atmosphere
Atomic oxygen is one of the basic components of the upper atmosphere, so we shallexamine those processes that determine its relative abundance in the atmosphere.The formation of atomic oxygen results from photodissociation of molecular oxy-gen (process 4 in Table 6.6) by solar radiation in the spectral range from 132 to176 nm (corresponding to the photon energy range from 6 to 10.3 eV). This absorp-tion range is called the Schumann–Runge continuum and is characterized by crosssections of 10�19�10�17 cm2. The Schumann–Runge continuum is the determin-ing factor in the generation of atomic oxygen at altitudes higher than 120 km. Atlower altitudes, up to h 80 km, the generation of atomic oxygen is accomplishedmostly by dissociation of oxygen molecules due to the weak Herzberg continuumin the wavelengths range from 140 to 175 nm, where the absorption cross sectionis less than 2 10�24 cm2.
The recombination rate of two oxygen atoms in three body collisions decreases asthe altitude increases, and hence the concentration of atomic oxygen increases. Thenumber density of atomic oxygen becomes equal to the number density of molecu-

422 6 Complex Plasmas, Including Atmospheric Plasmas
lar oxygen at altitudes from 100 to 120 km, and the number density of atomic oxy-gen is compared with that of molecular nitrogen at altitudes from 150 to 200 km.For comparison, we note that the average total number densities of nitrogen andoxygen molecules range from 7 1012 to 3 109 cm�3, and the number density ofatomic oxygen is in the range from 6 1011 to 4 109 cm�3 as the altitude variesfrom 100 up to 200 km. Thus, atomic oxygen is one of the basic components of theupper atmosphere at high altitudes.
To analyze the absorption of short-wave solar radiation as a result of photodisso-ciation of molecular oxygen, we write the balance equation for the intensity Iω ofsolar radiation of a given frequency in the atmosphere in the form
d Iω
dhD �Iω σω [O2] , (6.96)
where h is the altitude, [O2] is the number density of molecular oxygen, and σω
is the photodissociation cross section. We assume that incident solar radiation isperpendicular to the Earth’s surface, and the number density of molecular oxygenvaries according to the barometric formula (6.95), [O2] D N0 exp(�h/L), whereL D T/mg 10 km. Then the solution of (6.96) is
Iω(h) D Iω(1) exp�� exp
�� h � h0
L
��, (6.97)
where Iω(1) is the intensity of solar radiation above the atmosphere, and the alti-tude h0 is determined by the relation σω L[O2](h0) D 1. Formula (6.97) shows thatthe principal portion of the solar radiation of this part of the spectrum is absorbednear h0. Because the photodissociation cross section is in the range of σω � 10�19–10�17 cm2, this absorption takes place at altitudes where [O2] � 1011–1013 cm�3.
It is instructive to compare the decay time for the photodissociation of molecularoxygen and a typical time for transport of molecular oxygen to the altitudes at whichabsorption occurs. A typical dissociation time is
τdis ��
14
Zd Iω σω
„ω
��1
� 2 106 s ,
where the factor 1/4 results from averaging the radiation flux over the entire surfaceof the Earth, and „ω D 6�10 eV is the photon energy. The drift velocity of an atomor molecule as a result of its own weight is, according to the Einstein relation (4.38),
w D D mgT� g
�N σg
rmT
��1
� 3 1013 cm�2 s�1
N, (6.98)
where we use the estimate (4.53) for the diffusion coefficient D of oxygen atomsand σ σg 3 10�15 cm2 is of the order of the gas-kinetic cross section for at-mospheric molecules and atoms. In this expression, N is the total number densityof atoms and molecules at a given altitude of the atmosphere. Assuming molecularnitrogen to be the primary component of the atmosphere at altitudes of maximum
6.4 Plasma Processes in the Earth’s Atmosphere 423
photodissociation, we have [O2] D N/4, where the concentration of molecular oxy-gen is [O2] � 1011 cm�3, and a typical transport time is τdr � L/w � 104 s. Thisgives the inequality τdr � τdis, so the photodissociation process does not disruptthe barometric distribution of molecular oxygen at altitudes where photoabsorptionof solar radiation takes place.
To estimate the number density of atomic oxygen, we can compare the flux w [O]of oxygen atoms and the rate of their formation, which is of the order of the fluxof solar photons causing photodissociation. This flux is I � 3 1012 cm�2 s�1 atoptimal altitudes. The number density of atomic oxygen is
[O] � Iw� 0.1N (6.99)
at altitudes where it is formed, and (6.98) has been used for the atom drift velocity.From this it follows that the concentration of atomic oxygen (approximately 10%)does not vary with altitude until the mechanisms for loss of atomic oxygen becomeweak. Decay of atomic oxygen is determined by the three body process for recom-bination of atomic oxygen 2O C M ! O2 C M, where M is N2, O, or O2. Themaximum number density of atomic oxygen [O]max is observed at altitudes wherea typical time for the three body association process is equal to the time for atomictransport to lower layers, that is,
w [O]max
L� K [O]2max N .
Because the value of the three body rate constant is K � 10�33 cm6/s, we obtain[O]max � 1013 cm�3. Part of the atomic oxygen penetrating to lower layers in theatmosphere is transformed into ozone by processes 40 and 41 in Table 6.6. Thus,the photodissociation process in the upper atmosphere leads to a high ozone con-centration (up to 10�4) at altitudes from 40 to 80 km.
6.4.5
Ions in the Upper Atmosphere
Ions in the upper atmosphere such as NC2 , OC
2 , OC, and NC are formed by pho-toionization of the corresponding neutral species (see Figure 6.22) The spectrumof solar radiation in the VUV range that is responsible for ionization of atmo-spheric atomic particles is created by the solar corona. Hence, the intensity ofthis radiation can vary over a wide range. The average flux of photons with thewavelength below 100 nm is about 2.4 1010 cm�2 s�1. This part of the spec-trum causes Lyman-series transitions of atomic hydrogen, including the Rydbergspectrum and the continuum. The contribution in the spectral range from 84 to103 nm averages about 1.3 1010 cm�2 s�1. Among the more notable process-es are the CIII transition at 99.1 nm (9 108 cm�2 s�1), the CIII transition at97.7 nm (4.4 109 cm�2 s�1), the OV transition at 63 nm (1.3 109 cm�2 s�1), theHeI transition at 58.4 nm (1.3 109 cm�2 s�1), and the Lyman HeII transition at30.4 nm (7.7 109 cm�2 s�1). The maximum rate constant for the generation of
424 6 Complex Plasmas, Including Atmospheric Plasmas
electrons as a result of photoionization processes occurs at an altitude of about160 km and is 4 1015 cm�3 s�1.
One can obtain rough estimates of the number density of charged particles atmedium altitudes, where the photoionization rate constant is a maximum. Thephotoionization cross section is σion � 10�18�10�17 cm2, so the number densityof molecules is Nm � (σionL)�1 � 1011�1012 cm�3 at altitudes where photoion-ization occurs. The number density of molecular ions Ni at these altitudes followsfrom the balance equation αNeNi � Iion/L, where α is the dissociative recombi-nation coefficient for processes 13–15 in Table 6.6 and Iion � 2 1010 cm�2 s�1 isthe flux of photons whose absorption leads to photoionization. From this it followsthat
Ni �r
Iion
αL� 5 105 cm�3 . (6.100)
This corresponds to the maximum number density of ions in the atmosphere. Thenumber density of molecular ions in the lower layers of the atmosphere followsfrom the balance equation
w Ni
L� αN 2
i .
This gives the number density relation NiNm � 1015 cm�6, where Nm is the num-ber density of nitrogen molecules.
A typical time for establishment of the equilibrium for molecular ions that fol-lows from the estimate (6.100) is τrec � (αNe)�1 � 20 s, whereas a typical iondrift time for these altitudes is τdr � 104 s. Therefore, local equilibrium for molec-ular ions results from the competing ionization and recombination processes. Be-cause of the short time for establishment of this equilibrium, the number densityof charged particles for daytime and for nighttime atmospheres is different. Theabove estimate refers to the daytime atmosphere. The ion number density of thenighttime atmosphere follows from the relation αNi t � 1, where t is the dura-tion of the night. This gives the estimate Ni � 102�103 cm�3 for the nighttimeatmosphere.
Atomic ions formed as a result of the photoionization process participate in theion–molecule reactions listed as processes 27–30 in Table 6.6. A typical time forthese processes is τ � (kN )�1 � 0.01�10 s, and is small compared with a typicalrecombination time. This explains why ions in the ionosphere are molecular ions(see Figure 6.22). In addition, it shows the origin of NOC molecular ions. Theseions cannot result from photoionization because of the small number density ofNO molecules.
Atomic ions are removed from high altitudes because of a short transport time.One can estimate the maximum number density of atomic oxygen ions by com-paring a typical drift time L/w and the characteristic time for the ion–moleculereactions listed in Table 6.6 and estimated as by (k[N2])�1. Assuming the basic com-ponent of the atmosphere at these altitudes to be atomic oxygen, we find that themaximum number density of OC atomic ions occurs at altitudes where [N2][O] �
6.5 Electric Machine of the Earth’s Atmosphere 425
3 1019 cm�6. This corresponds to altitudes of approximately 200 km. The maxi-mum number density of atomic ions Ni follows from the balance equationZ
σiond Iion � k[N2]Ni .
For photoionization of atomic oxygen, we haveR
σiond Iion D 2 10�7 s�1, so themaximum number density is
Ni � 2 105 cm�3 [O][N2]� 106 cm�3 . (6.101)
In higher layers of the atmosphere, the number density of atomic ions is deter-mined by the barometric formula, because it is proportional to the number densityof primary atoms, and declines with increasing altitude.
At altitudes where photoionization occurs, the negative charge of the atmospher-ic plasma comes from electrons. In the D-layer of the ionosphere, electrons attachto oxygen molecules in accordance with processes 20–22 in Table 6.6, and it isnegative ions that govern the negative charge of the atmosphere. At the altitudeswhere this transition takes place, the balance equation w Ne/L � K Ne[O2]2 is ap-propriate, where K � 10�31 cm6/s is the rate constant for processes 20 and 21 inTable 6.6. From this it follows that formation of negative ions occurs at altitudeswhere N [O2]2 � 3 1039 cm�9 or [O2] � 1013 cm�3. We account for the coeffi-cient of ambipolar diffusion of ions being of the order of the diffusion coefficientfor atoms. In the D layer of the ionosphere, recombination proceeds accordingto the scheme A� C BC ! A C B , and is characterized by the rate constantα � 10�9 cm3/s. This leads to the relation
NiN � 1017 cm�6 (6.102)
for the number density of ions Ni. Thus, the properties of the middle and the upperatmosphere are established by processes in excited and dissociated air involvingions, excited atoms, and excited molecules.
6.5
Electric Machine of the Earth’s Atmosphere
6.5.1
The Earth as an Electric System
Processes in the lower atmosphere lead to charging and discharging of the Earth,and we consider below the Earth as an electric system and the processes which gov-ern its electric properties. The Earth is negatively charged, and the average electricfield strength near the Earth’s surface is E D 4πσ D 130 V/m (σ is the average sur-face charge density) [149, 150]. This gives the total Earth charge Q D 5.8 105 C.In addition, the electric potential of the Earth with respect to the environment is

426 6 Complex Plasmas, Including Atmospheric Plasmas
Figure 6.23 Character of charging of the Earth’s surface through a cloud when charge separa-
tion results from the falling of negatively charged water drops and charge transfer from a cloud
to the Earth’s surface proceeds through lightning [153, 167].
U D 300 kV) if we model the Earth as a spherical capacitor with one electrode asthe Earth’s surface and the other electrode is a sphere at a distance of 6 km fromthe Earth’s surface. From this it follows that all the electric processes of the Earth’satmosphere take place in low atmospheric layers at altitudes below approximately10 km.
Our goal is to construct the scheme of processes which create the electric ma-chine of the Earth. Because the Earth’s atmosphere contains charged particles,its conductivity determines the electric currents. The average current densityfor a quiet atmosphere over land is 2.4 10�12 A/m2, and over the ocean it is3.7 10�12 A/m2. This gives a total Earth current of approximately I D 1700 A,which leads to the Earth discharging in a time of typically τ D Q/I D 340 s,that is, the time for the Earth to discharge owing to the conductivity of theEarth is about 6 min. If we take the average mobility of atmospheric ions to beK D 2.3 cm2/(V cm), we find the average ion number density to be Ni D 300 cm�3.
We use the following simple scheme of the electric machine of the Earth’s at-mosphere [151]. The discharge of the Earth results from currents of positive andnegative atmospheric ions which are formed under the action of both cosmic radia-tion and radioactivity of the Earth’s surface. Charging of the Earth’s surface beginsin clouds, where the positive and negative charges are separated, and the lowercloud edge has a high electric potential with respect to the Earth’s surface of 20–100 MV [152]. Subsequent lightning between the lower cloud edge and the Earth’ssurface leads to charging of the Earth (see Figure 6.23 [153]).
Note that the character of charge separation in clouds as a result of the fallingof water aerosols depends on the sort of atmospheric ions, which may be differentdepending on small admixtures to atmospheric air in a given region. Therefore,the lower cloud edge may be charged both negatively and positively. Nevertheless,the negative charge of the lower cloud edge is preferable. In reality, the number oflightning discharges from clouds to the ground with transfer of the negative chargeto the Earth’s surface exceeds that for transfer of positive charge by 2.1˙ 0.5 timeson average [154]. The ratio of the amount of negative charge to positive charge

6.5 Electric Machine of the Earth’s Atmosphere 427
transferred in this way is 3.2 ˙ 1.2 on average [154]. In addition, there are 100negative flashes per second over the entire globe on average [152].
Thus, although it may seem strange at first glance, the charging of the Earth oc-curs as a result of lightning in the atmosphere. Charge transfer processes in cloudsthat are connected with charging and precipitation of small drops or aerosols leadto a redistribution of the charges therein. The lower part of a cloud is usually neg-atively charged and the upper part is usually positively charged. The electric poten-tial of a cloud can reach hundreds of millions of Volt, causing breakdown of theair. The discharge of a cloud to the Earth’s surface in the form of a lightning strokeis accompanied by the transfer of electric charge to the Earth’s surface. About 10%of thunderstorms transfer positive charge to the Earth’s surface, and 90% transfernegative charge. The net result is that the Earth acquires a negative charge.
We can estimate the timescales for the electric processes of the Earth. Positiveand negative ions recombine under atmospheric conditions in three body colli-sions, with an effective ion recombination coefficient of α D 2 10�6 cm3/s forrecombination according to processes 17–19 in Table 6.6. We note that electrons arepractically absent in the atmosphere near the Earth’s surface although electron for-mation is the first stage of ionization processes in the lower Earth atmosphere. Butaccording to processes 20 and 21 in Table 6.6, conversion of electrons into negativeions O�
2 near the Earth’s surface proceeds during a time of approximately 10�8 s,which is short compared with the lifetime of charged particles in the atmosphere.Hence, we assume the negative charge in the lower atmosphere to be connectedpartially to the negative molecular ions. One can estimate from this a time for re-combination of molecular ions as about τ D (αNi)�1 D 0.5 h for Ni D 103 cm�3.This contrasts with the much shorter characteristic time of q/I D 6 min for dis-charging of the Earth, where q is the Earth’s charge and I is the average atmosphericcurrent.
One can estimate a typical distance an ion travels during its lifetime τ, whichis s D K E τ, where K is the ion mobility and E is the electric field strength nearthe Earth. Table 6.10 contains the measured mobilities of some ions in nitrogen.These ions may be formed in a humid atmosphere and are characterized by highelectron binding energies. Indeed, the electron affinity is 2.3 eV for the NO2, 3.7 eVfor NO3, and 2.8 eV for CO3. For comparison, the electron affinity for O2 is 0.43 eVand for the oxygen atom is 1.5 eV. These stable negative ions can form complexions in a humid atmosphere. Using the data in Table 6.10, we take the ion mobilityK 2 cm2/(V s), which gives for the distance traveled by an ion during its lifetimeas s 50 m. This distance is short compared with the size of the atmosphere,which is evidence for continuous formation of charged particles in the atmosphere.
One can estimate the average number density of molecular ions taking into ac-count, as follows from measurements, the average current density over land of2.4 10�16 A/cm2 and over the ocean of 3.7 10�16 A/cm2 [149]. Let us assumethe mobility of negative and positive molecular ions to be close to 2 cm2/(V s) asfollows from Table 6.10. Taking the number densities Ni of negative and posi-tive molecular ions to be identical, on the basis of the electric field strength E D1.3 V/cm we obtain that the indicated current density over land is provided by a ion

428 6 Complex Plasmas, Including Atmospheric Plasmas
Table 6.10 The mobilities of some neg-
ative and positive ions in nitrogen [155–
158]. The mobility K is reduced to normal
conditions (the nitrogen number density
N D 2.69 � 1019 cm�3 corresponds to the
temperature T D 273 K and a pressure of
1 atm) and is expressed in square centimeters
per volt per second.
Ion K
NO�2 2.5
NO�3 2.3
CO�3 2.4
NO�2 � H2O 2.4
NO�3 � H2O 2.2
CO�3 � H2O 2.1
NC2 1.9
COC2 2.2
N2HC 2.1NC
3 2.3
N2OC 2.3
NC4 2.3
HC � H2O 2.8
HC � (H2O)2 2.3
HC � (H2O)3 2.1
number density of Ni D 300 cm�3 and over the ocean we have Ni D 500 cm�3.Note that molecular ions carry only a part of the atmospheric charge.
Let us consider the ionization balance in the lower atmosphere. There are twomechanisms for the ionization process. Near the Earth they result from radioac-tivity of the Earth’s surface, but these processes proceed in a thick layer. Anothermechanism is determined by galactic and solar cosmic rays [159–161]. Maximumionization is observed at altitudes between 11 and 15 km, and is characterized byionization rates of [161] 30�40 cm�3 s�1. This leads to an ion number density ofabout 6 103 cm�3 if we use the recombination coefficient of about 10�6 cm3/s atthis altitude. This number density exceeds that at low atmosphere altitudes.
Thus, one can compose the following character of electric processes for the Earththat is negatively charged owing to the falling of water drops in clouds. The chargetransfer from lower cloud edges to the Earth’s surface results from electric break-down in the atmosphere that is realized by lightning.
6.5.2
Lightning
Let us consider the characteristics of lightning as an atmospheric phenomenon.Lightning is a powerful electric breakdown between a cloud and the Earth’s surface,between two clouds, or within one cloud. The length of the lightning channel ismeasured in kilometers. Lightning is the most widespread electric phenomenon
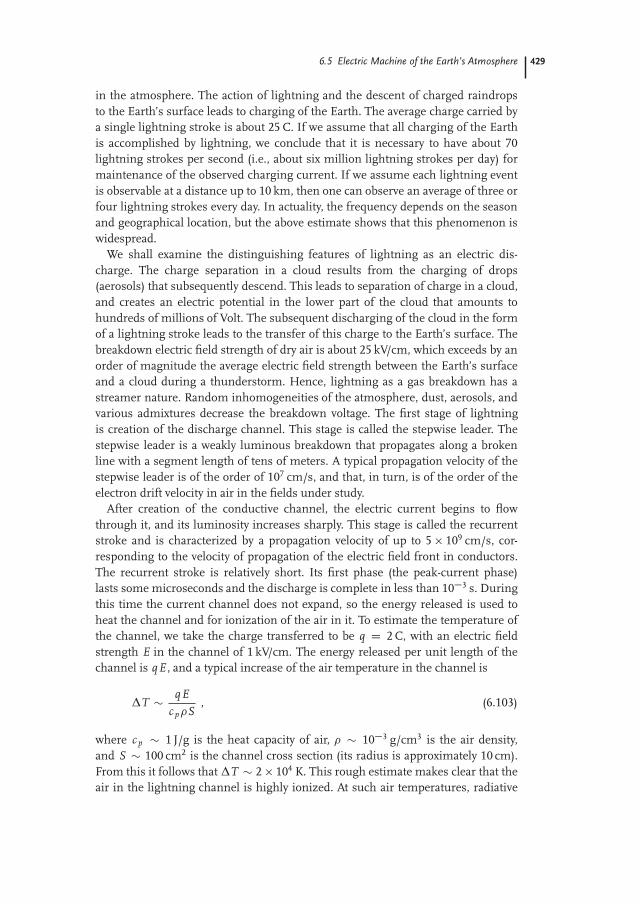
6.5 Electric Machine of the Earth’s Atmosphere 429
in the atmosphere. The action of lightning and the descent of charged raindropsto the Earth’s surface leads to charging of the Earth. The average charge carried bya single lightning stroke is about 25 C. If we assume that all charging of the Earthis accomplished by lightning, we conclude that it is necessary to have about 70lightning strokes per second (i.e., about six million lightning strokes per day) formaintenance of the observed charging current. If we assume each lightning eventis observable at a distance up to 10 km, then one can observe an average of three orfour lightning strokes every day. In actuality, the frequency depends on the seasonand geographical location, but the above estimate shows that this phenomenon iswidespread.
We shall examine the distinguishing features of lightning as an electric dis-charge. The charge separation in a cloud results from the charging of drops(aerosols) that subsequently descend. This leads to separation of charge in a cloud,and creates an electric potential in the lower part of the cloud that amounts tohundreds of millions of Volt. The subsequent discharging of the cloud in the formof a lightning stroke leads to the transfer of this charge to the Earth’s surface. Thebreakdown electric field strength of dry air is about 25 kV/cm, which exceeds by anorder of magnitude the average electric field strength between the Earth’s surfaceand a cloud during a thunderstorm. Hence, lightning as a gas breakdown has astreamer nature. Random inhomogeneities of the atmosphere, dust, aerosols, andvarious admixtures decrease the breakdown voltage. The first stage of lightningis creation of the discharge channel. This stage is called the stepwise leader. Thestepwise leader is a weakly luminous breakdown that propagates along a brokenline with a segment length of tens of meters. A typical propagation velocity of thestepwise leader is of the order of 107 cm/s, and that, in turn, is of the order of theelectron drift velocity in air in the fields under study.
After creation of the conductive channel, the electric current begins to flowthrough it, and its luminosity increases sharply. This stage is called the recurrentstroke and is characterized by a propagation velocity of up to 5 109 cm/s, cor-responding to the velocity of propagation of the electric field front in conductors.The recurrent stroke is relatively short. Its first phase (the peak-current phase)lasts some microseconds and the discharge is complete in less than 10�3 s. Duringthis time the current channel does not expand, so the energy released is used toheat the channel and for ionization of the air in it. To estimate the temperature ofthe channel, we take the charge transferred to be q D 2 C, with an electric fieldstrength E in the channel of 1 kV/cm. The energy released per unit length of thechannel is qE , and a typical increase of the air temperature in the channel is
ΔT � qEc p �S
, (6.103)
where c p � 1 J/g is the heat capacity of air, � � 10�3 g/cm3 is the air density,and S � 100 cm2 is the channel cross section (its radius is approximately 10 cm).From this it follows that ΔT � 2 104 K. This rough estimate makes clear that theair in the lightning channel is highly ionized. At such air temperatures, radiative
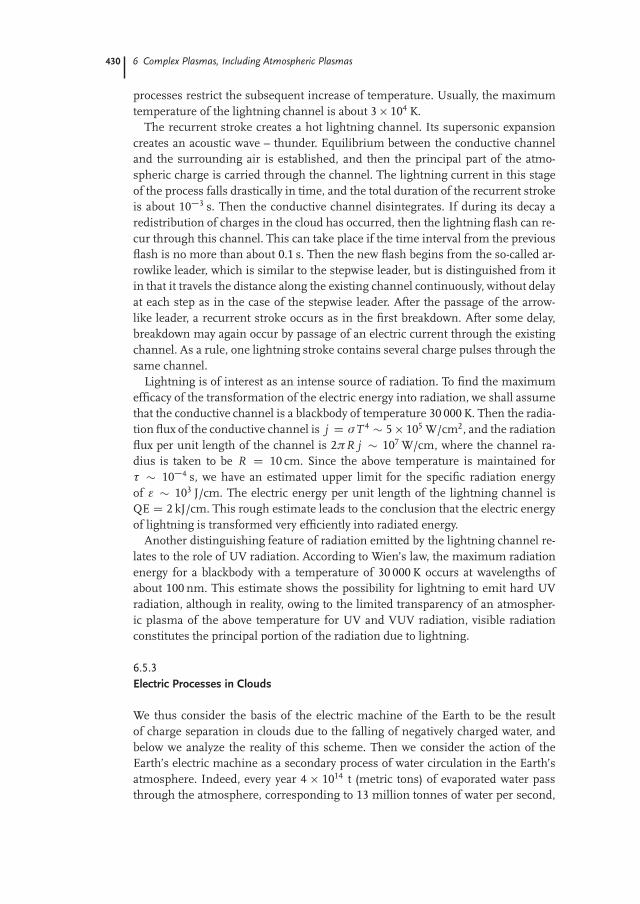
430 6 Complex Plasmas, Including Atmospheric Plasmas
processes restrict the subsequent increase of temperature. Usually, the maximumtemperature of the lightning channel is about 3 104 K.
The recurrent stroke creates a hot lightning channel. Its supersonic expansioncreates an acoustic wave – thunder. Equilibrium between the conductive channeland the surrounding air is established, and then the principal part of the atmo-spheric charge is carried through the channel. The lightning current in this stageof the process falls drastically in time, and the total duration of the recurrent strokeis about 10�3 s. Then the conductive channel disintegrates. If during its decay aredistribution of charges in the cloud has occurred, then the lightning flash can re-cur through this channel. This can take place if the time interval from the previousflash is no more than about 0.1 s. Then the new flash begins from the so-called ar-rowlike leader, which is similar to the stepwise leader, but is distinguished from itin that it travels the distance along the existing channel continuously, without delayat each step as in the case of the stepwise leader. After the passage of the arrow-like leader, a recurrent stroke occurs as in the first breakdown. After some delay,breakdown may again occur by passage of an electric current through the existingchannel. As a rule, one lightning stroke contains several charge pulses through thesame channel.
Lightning is of interest as an intense source of radiation. To find the maximumefficacy of the transformation of the electric energy into radiation, we shall assumethat the conductive channel is a blackbody of temperature 30 000 K. Then the radia-tion flux of the conductive channel is j D σT 4 � 5 105 W/cm2, and the radiationflux per unit length of the channel is 2πR j � 107 W/cm, where the channel ra-dius is taken to be R D 10 cm. Since the above temperature is maintained forτ � 10�4 s, we have an estimated upper limit for the specific radiation energyof ε � 103 J/cm. The electric energy per unit length of the lightning channel isQE D 2 kJ/cm. This rough estimate leads to the conclusion that the electric energyof lightning is transformed very efficiently into radiated energy.
Another distinguishing feature of radiation emitted by the lightning channel re-lates to the role of UV radiation. According to Wien’s law, the maximum radiationenergy for a blackbody with a temperature of 30 000 K occurs at wavelengths ofabout 100 nm. This estimate shows the possibility for lightning to emit hard UVradiation, although in reality, owing to the limited transparency of an atmospher-ic plasma of the above temperature for UV and VUV radiation, visible radiationconstitutes the principal portion of the radiation due to lightning.
6.5.3
Electric Processes in Clouds
We thus consider the basis of the electric machine of the Earth to be the resultof charge separation in clouds due to the falling of negatively charged water, andbelow we analyze the reality of this scheme. Then we consider the action of theEarth’s electric machine as a secondary process of water circulation in the Earth’satmosphere. Indeed, every year 4 1014 t (metric tons) of evaporated water passthrough the atmosphere, corresponding to 13 million tonnes of water per second,
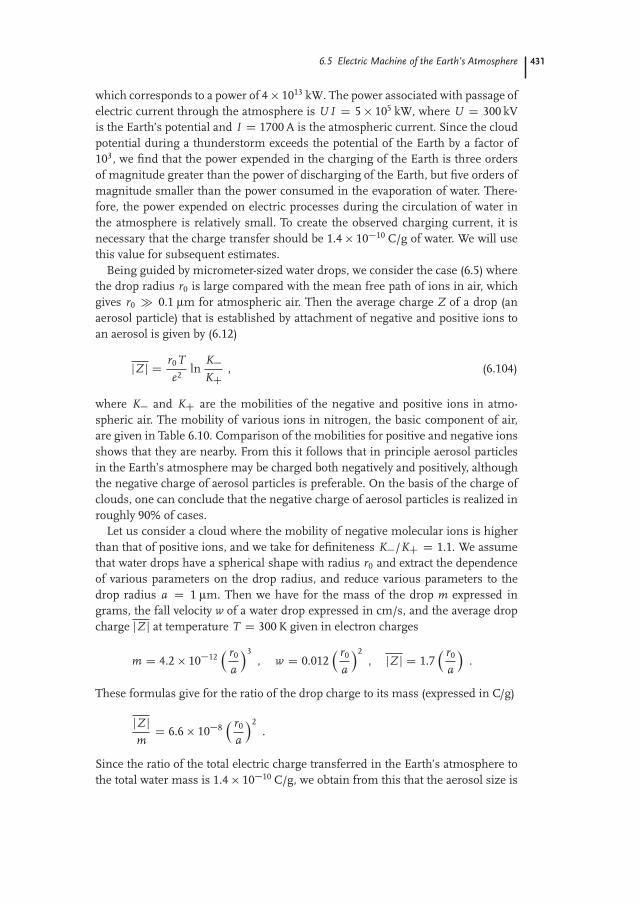
6.5 Electric Machine of the Earth’s Atmosphere 431
which corresponds to a power of 4 1013 kW. The power associated with passage ofelectric current through the atmosphere is U I D 5 105 kW, where U D 300 kVis the Earth’s potential and I D 1700 A is the atmospheric current. Since the cloudpotential during a thunderstorm exceeds the potential of the Earth by a factor of103, we find that the power expended in the charging of the Earth is three ordersof magnitude greater than the power of discharging of the Earth, but five orders ofmagnitude smaller than the power consumed in the evaporation of water. There-fore, the power expended on electric processes during the circulation of water inthe atmosphere is relatively small. To create the observed charging current, it isnecessary that the charge transfer should be 1.4 10�10 C/g of water. We will usethis value for subsequent estimates.
Being guided by micrometer-sized water drops, we consider the case (6.5) wherethe drop radius r0 is large compared with the mean free path of ions in air, whichgives r0 � 0.1 μm for atmospheric air. Then the average charge Z of a drop (anaerosol particle) that is established by attachment of negative and positive ions toan aerosol is given by (6.12)
jZ j D r0Te2
lnK�KC
, (6.104)
where K� and KC are the mobilities of the negative and positive ions in atmo-spheric air. The mobility of various ions in nitrogen, the basic component of air,are given in Table 6.10. Comparison of the mobilities for positive and negative ionsshows that they are nearby. From this it follows that in principle aerosol particlesin the Earth’s atmosphere may be charged both negatively and positively, althoughthe negative charge of aerosol particles is preferable. On the basis of the charge ofclouds, one can conclude that the negative charge of aerosol particles is realized inroughly 90% of cases.
Let us consider a cloud where the mobility of negative molecular ions is higherthan that of positive ions, and we take for definiteness K�/KC D 1.1. We assumethat water drops have a spherical shape with radius r0 and extract the dependenceof various parameters on the drop radius, and reduce various parameters to thedrop radius a D 1 μm. Then we have for the mass of the drop m expressed ingrams, the fall velocity w of a water drop expressed in cm/s, and the average dropcharge jZ j at temperature T D 300 K given in electron charges
m D 4.2 10�12 r0
a
3, w D 0.012
r0
a
2, jZ j D 1.7
r0
a
.
These formulas give for the ratio of the drop charge to its mass (expressed in C/g)
jZ jmD 6.6 10�8
r0
a
2.
Since the ratio of the total electric charge transferred in the Earth’s atmosphere tothe total water mass is 1.4 10�10 C/g, we obtain from this that the aerosol size is
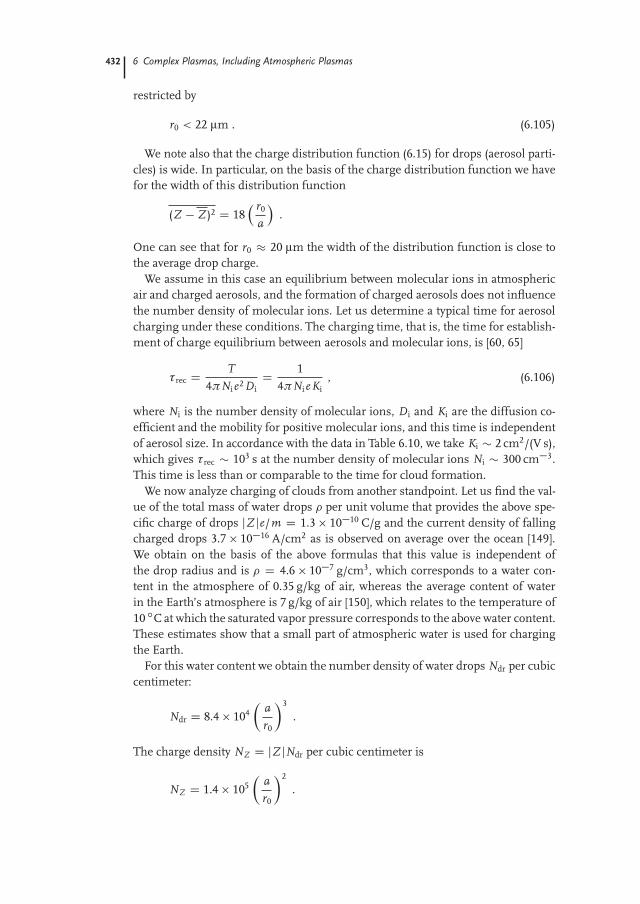
432 6 Complex Plasmas, Including Atmospheric Plasmas
restricted by
r0 < 22 μm . (6.105)
We note also that the charge distribution function (6.15) for drops (aerosol parti-cles) is wide. In particular, on the basis of the charge distribution function we havefor the width of this distribution function
(Z � Z )2 D 18 r0
a
.
One can see that for r0 20 μm the width of the distribution function is close tothe average drop charge.
We assume in this case an equilibrium between molecular ions in atmosphericair and charged aerosols, and the formation of charged aerosols does not influencethe number density of molecular ions. Let us determine a typical time for aerosolcharging under these conditions. The charging time, that is, the time for establish-ment of charge equilibrium between aerosols and molecular ions, is [60, 65]
τrec D T4πNie2Di
D 14πNieKi
, (6.106)
where Ni is the number density of molecular ions, Di and Ki are the diffusion co-efficient and the mobility for positive molecular ions, and this time is independentof aerosol size. In accordance with the data in Table 6.10, we take Ki � 2 cm2/(V s),which gives τrec � 103 s at the number density of molecular ions Ni � 300 cm�3.This time is less than or comparable to the time for cloud formation.
We now analyze charging of clouds from another standpoint. Let us find the val-ue of the total mass of water drops � per unit volume that provides the above spe-cific charge of drops jZ je/m D 1.3 10�10 C/g and the current density of fallingcharged drops 3.7 10�16 A/cm2 as is observed on average over the ocean [149].We obtain on the basis of the above formulas that this value is independent ofthe drop radius and is � D 4.6 10�7 g/cm3, which corresponds to a water con-tent in the atmosphere of 0.35 g/kg of air, whereas the average content of waterin the Earth’s atmosphere is 7 g/kg of air [150], which relates to the temperature of10 ıC at which the saturated vapor pressure corresponds to the above water content.These estimates show that a small part of atmospheric water is used for chargingthe Earth.
For this water content we obtain the number density of water drops Ndr per cubiccentimeter:
Ndr D 8.4 104�
ar0
�3
.
The charge density NZ D jZ jNdr per cubic centimeter is
NZ D 1.4 105�
ar0
�2
.
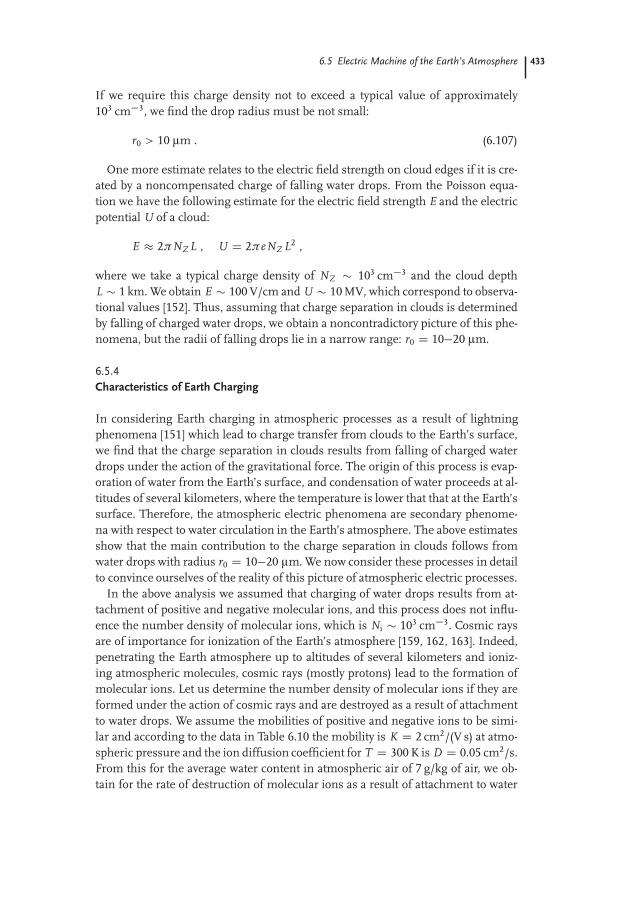
6.5 Electric Machine of the Earth’s Atmosphere 433
If we require this charge density not to exceed a typical value of approximately103 cm�3, we find the drop radius must be not small:
r0 > 10 μm . (6.107)
One more estimate relates to the electric field strength on cloud edges if it is cre-ated by a noncompensated charge of falling water drops. From the Poisson equa-tion we have the following estimate for the electric field strength E and the electricpotential U of a cloud:
E 2πNZ L , U D 2πeNZ L2 ,
where we take a typical charge density of NZ � 103 cm�3 and the cloud depthL � 1 km. We obtain E � 100 V/cm and U � 10 MV, which correspond to observa-tional values [152]. Thus, assuming that charge separation in clouds is determinedby falling of charged water drops, we obtain a noncontradictory picture of this phe-nomena, but the radii of falling drops lie in a narrow range: r0 D 10�20 μm.
6.5.4
Characteristics of Earth Charging
In considering Earth charging in atmospheric processes as a result of lightningphenomena [151] which lead to charge transfer from clouds to the Earth’s surface,we find that the charge separation in clouds results from falling of charged waterdrops under the action of the gravitational force. The origin of this process is evap-oration of water from the Earth’s surface, and condensation of water proceeds at al-titudes of several kilometers, where the temperature is lower that that at the Earth’ssurface. Therefore, the atmospheric electric phenomena are secondary phenome-na with respect to water circulation in the Earth’s atmosphere. The above estimatesshow that the main contribution to the charge separation in clouds follows fromwater drops with radius r0 D 10�20 μm. We now consider these processes in detailto convince ourselves of the reality of this picture of atmospheric electric processes.
In the above analysis we assumed that charging of water drops results from at-tachment of positive and negative molecular ions, and this process does not influ-ence the number density of molecular ions, which is Ni � 103 cm�3. Cosmic raysare of importance for ionization of the Earth’s atmosphere [159, 162, 163]. Indeed,penetrating the Earth atmosphere up to altitudes of several kilometers and ioniz-ing atmospheric molecules, cosmic rays (mostly protons) lead to the formation ofmolecular ions. Let us determine the number density of molecular ions if they areformed under the action of cosmic rays and are destroyed as a result of attachmentto water drops. We assume the mobilities of positive and negative ions to be simi-lar and according to the data in Table 6.10 the mobility is K D 2 cm2/(V s) at atmo-spheric pressure and the ion diffusion coefficient for T D 300 K is D D 0.05 cm2/s.From this for the average water content in atmospheric air of 7 g/kg of air, we ob-tain for the rate of destruction of molecular ions as a result of attachment to water
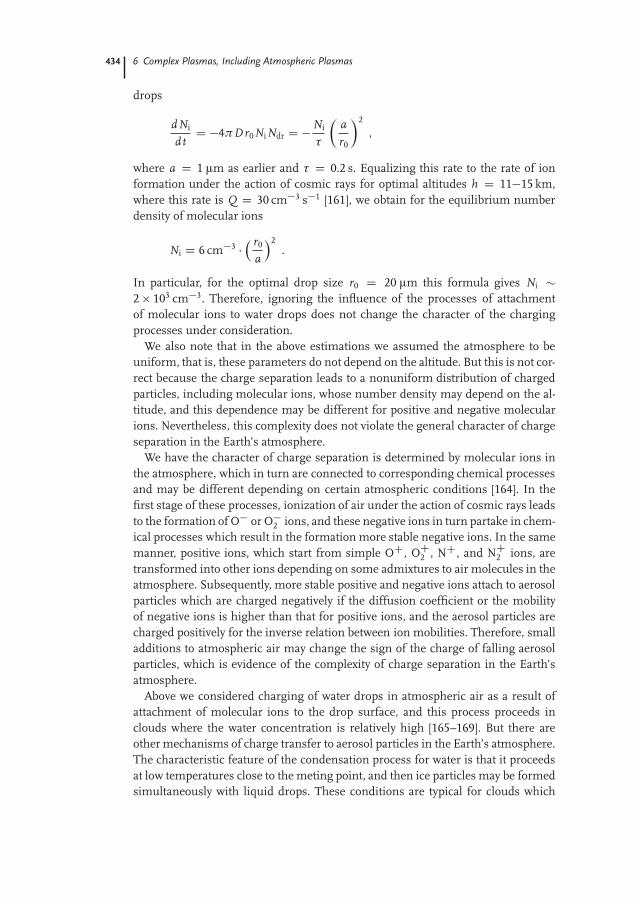
434 6 Complex Plasmas, Including Atmospheric Plasmas
drops
dNi
d tD �4πD r0NiNdr D �Ni
τ
�ar0
�2
,
where a D 1 μm as earlier and τ D 0.2 s. Equalizing this rate to the rate of ionformation under the action of cosmic rays for optimal altitudes h D 11�15 km,where this rate is Q D 30 cm�3 s�1 [161], we obtain for the equilibrium numberdensity of molecular ions
Ni D 6 cm�3 � r0
a
2.
In particular, for the optimal drop size r0 D 20 μm this formula gives Ni �2 103 cm�3. Therefore, ignoring the influence of the processes of attachmentof molecular ions to water drops does not change the character of the chargingprocesses under consideration.
We also note that in the above estimations we assumed the atmosphere to beuniform, that is, these parameters do not depend on the altitude. But this is not cor-rect because the charge separation leads to a nonuniform distribution of chargedparticles, including molecular ions, whose number density may depend on the al-titude, and this dependence may be different for positive and negative molecularions. Nevertheless, this complexity does not violate the general character of chargeseparation in the Earth’s atmosphere.
We have the character of charge separation is determined by molecular ions inthe atmosphere, which in turn are connected to corresponding chemical processesand may be different depending on certain atmospheric conditions [164]. In thefirst stage of these processes, ionization of air under the action of cosmic rays leadsto the formation of O� or O�
2 ions, and these negative ions in turn partake in chem-ical processes which result in the formation more stable negative ions. In the samemanner, positive ions, which start from simple OC, OC
2 , NC, and NC2 ions, are
transformed into other ions depending on some admixtures to air molecules in theatmosphere. Subsequently, more stable positive and negative ions attach to aerosolparticles which are charged negatively if the diffusion coefficient or the mobilityof negative ions is higher than that for positive ions, and the aerosol particles arecharged positively for the inverse relation between ion mobilities. Therefore, smalladditions to atmospheric air may change the sign of the charge of falling aerosolparticles, which is evidence of the complexity of charge separation in the Earth’satmosphere.
Above we considered charging of water drops in atmospheric air as a result ofattachment of molecular ions to the drop surface, and this process proceeds inclouds where the water concentration is relatively high [165–169]. But there areother mechanisms of charge transfer to aerosol particles in the Earth’s atmosphere.The characteristic feature of the condensation process for water is that it proceedsat low temperatures close to the meting point, and then ice particles may be formedsimultaneously with liquid drops. These conditions are typical for clouds which
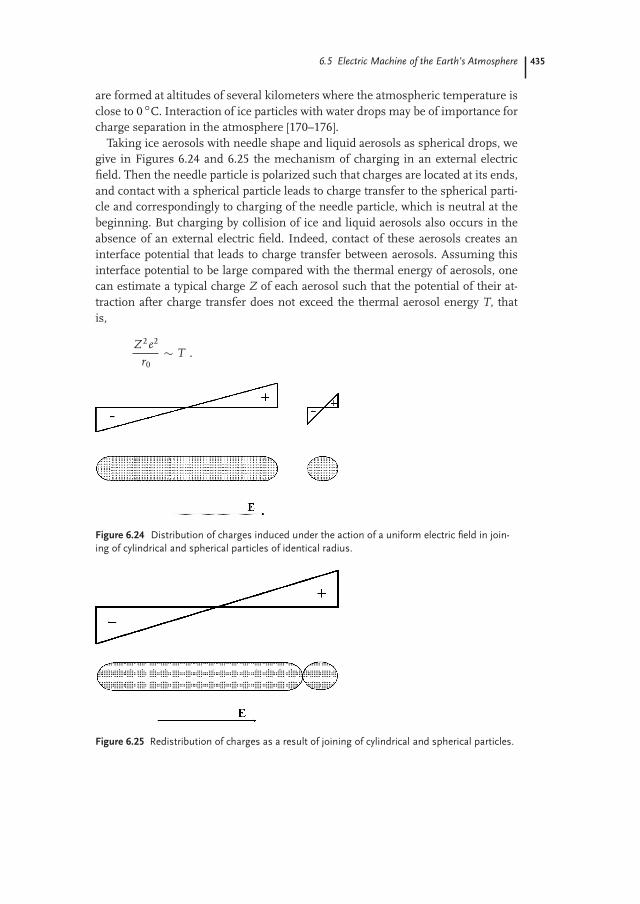
6.5 Electric Machine of the Earth’s Atmosphere 435
are formed at altitudes of several kilometers where the atmospheric temperature isclose to 0 ıC. Interaction of ice particles with water drops may be of importance forcharge separation in the atmosphere [170–176].
Taking ice aerosols with needle shape and liquid aerosols as spherical drops, wegive in Figures 6.24 and 6.25 the mechanism of charging in an external electricfield. Then the needle particle is polarized such that charges are located at its ends,and contact with a spherical particle leads to charge transfer to the spherical parti-cle and correspondingly to charging of the needle particle, which is neutral at thebeginning. But charging by collision of ice and liquid aerosols also occurs in theabsence of an external electric field. Indeed, contact of these aerosols creates aninterface potential that leads to charge transfer between aerosols. Assuming thisinterface potential to be large compared with the thermal energy of aerosols, onecan estimate a typical charge Z of each aerosol such that the potential of their at-traction after charge transfer does not exceed the thermal aerosol energy T, thatis,
Z2e2
r0� T .
Figure 6.24 Distribution of charges induced under the action of a uniform electric field in join-
ing of cylindrical and spherical particles of identical radius.
Figure 6.25 Redistribution of charges as a result of joining of cylindrical and spherical particles.
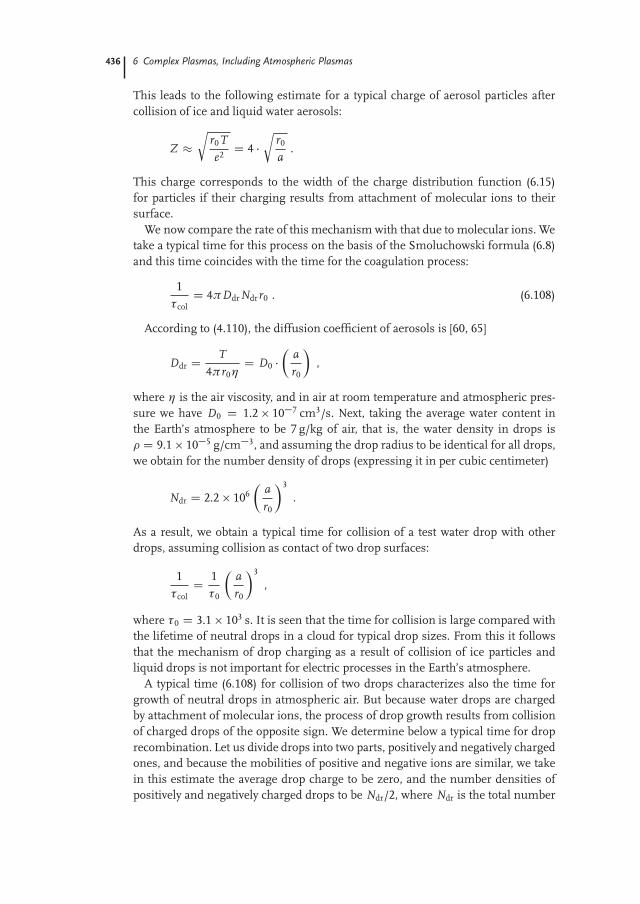
436 6 Complex Plasmas, Including Atmospheric Plasmas
This leads to the following estimate for a typical charge of aerosol particles aftercollision of ice and liquid water aerosols:
Z r
r0Te2 D 4 �
rr0
a.
This charge corresponds to the width of the charge distribution function (6.15)for particles if their charging results from attachment of molecular ions to theirsurface.
We now compare the rate of this mechanism with that due to molecular ions. Wetake a typical time for this process on the basis of the Smoluchowski formula (6.8)and this time coincides with the time for the coagulation process:
1τcolD 4πDdrNdrr0 . (6.108)
According to (4.110), the diffusion coefficient of aerosols is [60, 65]
Ddr D T4πr0η
D D0 ��
ar0
�,
where η is the air viscosity, and in air at room temperature and atmospheric pres-sure we have D0 D 1.2 10�7 cm3/s. Next, taking the average water content inthe Earth’s atmosphere to be 7 g/kg of air, that is, the water density in drops is� D 9.1 10�5 g/cm�3, and assuming the drop radius to be identical for all drops,we obtain for the number density of drops (expressing it in per cubic centimeter)
Ndr D 2.2 106�
ar0
�3
.
As a result, we obtain a typical time for collision of a test water drop with otherdrops, assuming collision as contact of two drop surfaces:
1τcolD 1
τ0
�ar0
�3
,
where τ0 D 3.1 103 s. It is seen that the time for collision is large compared withthe lifetime of neutral drops in a cloud for typical drop sizes. From this it followsthat the mechanism of drop charging as a result of collision of ice particles andliquid drops is not important for electric processes in the Earth’s atmosphere.
A typical time (6.108) for collision of two drops characterizes also the time forgrowth of neutral drops in atmospheric air. But because water drops are chargedby attachment of molecular ions, the process of drop growth results from collisionof charged drops of the opposite sign. We determine below a typical time for droprecombination. Let us divide drops into two parts, positively and negatively chargedones, and because the mobilities of positive and negative ions are similar, we takein this estimate the average drop charge to be zero, and the number densities ofpositively and negatively charged drops to be Ndr/2, where Ndr is the total number
6.5 Electric Machine of the Earth’s Atmosphere 437
density of drops. The recombination coefficient of two oppositely charged drops ina gas is given by the Langevin formula (6.10) [64]:
krec D jZCZ�je(KC C K�) , (6.109)
where ZC and Z� are the charges of positive and negative drops and KC and K�are their mobilities (KC D K� D Kdr). On the basis of the charge distributionfunction for drops (6.15), we have for the average positive jZCj and negative jZ�jdrop charges
jZCj D jZCj Dr
r0Tπe2
.
Using the expression for the mobility of drops in a gas for case (6.5),
kdr D e2
4πr0η,
where η D 1.85 10�4 g/(cm s) is the air viscosity at room temperature, we obtainfor the average rate constant for recombination for a test charged drop
krec D T2π2η
. (6.110)
As is seen, the rate constant for recombination for a test charged drop is indepen-dent of the drop size (we assume all the drops have identical radius r0) and is
krec D 1.1 10�11 cm3/s .
We now find an optimal drop size by equalizing the typical time τrec D 2/Ndrkdr
and the time τfal D L/w for falling of drops in a cloud, where L 2 km is a typicalcloud size. Taking the average water content in the atmosphere (7 g/kg of air), wehave
1τrecD 2
NdrkrecD 1.2 10�5 s�1
�ar0
�3
,
1τfalD w
LD 6 10�8 s�1
r0
a
3.
From this we obtain for the size of charged water drops when they reach the loweredge of a cloud r0 3 μm.
We note that in considering electric phenomena in the atmosphere, we simpli-fied the problem and extracted the principal mechanism of Earth charging whereseparation of charges in the atmosphere results from falling of charged waterdrops. In reality, this process is more complex. In particular, convective motionof atmospheric air leads to mixing of atmospheric layers [177], and a charged layermay be transported to other altitudes up to 100 km. This can cause breakdown andlightning at high altitudes.

438 6 Complex Plasmas, Including Atmospheric Plasmas
6.5.5
Charged Particles in an Aerosol Plasma
Ions in an aerosol plasma can attach to aerosol particles, and this is of impor-tance for atmospheric plasmas. We now consider a plasma regime wherein chargedatomic particles are created in the plasma by an external source, and their decay oc-curs through ion–ion recombination. The presence of aerosol particles in such aplasma can change its properties. The balance equations for the number densitiesNC of positive ions and N� of negative ions in the plasma have the form
dNCd tD G � αNCN� � IC
Npe ,
dN�d tD G � αNCN� � I�
Npe , (6.111)
where G is the rate of ionization by an external source, α is the ion–ion recombina-tion coefficient, Np is the number density of particles, and IC and I� are the ioncurrents to a particle as given by (6.7) and (6.9).
For simplicity we consider the case Z < r0T/e2 when the ion current is describedby the Smoluchowski formula (6.8). Then NC D N� D Ni, and the balance equa-tion in the stationary case has the form
G � αN 2i � kNiNp D 0 ,
where k D 4πD r0 and D D (DC C D�)/2 is the average diffusion coefficient forions in a gas. This equation shows that recombination of ions involving aerosols isstronger than that in an aerosol-free space when
Np �p
G αk
, (6.112)
which leads to the number density of ions
Ni D GkNp
. (6.113)
To make numerical estimates for an atmospheric plasma, we take G � 10cm�3s�1 and α � 10�6 cm3/s, so for ions with mobility K D 1 cm2/(V s) wehave k/r0 D 0.3 cm2/s, and criterion (6.112) gives Npr0 � 0.01 cm�2. In partic-ular, for particles of size r0 � 10 μm this gives Ni � 100 cm�3 (correspondingto density � � 4 10�7 g/cm3 for water vapor), so (6.113) leads to the estimateNiNp � 3 104 cm�6. Because the maximum rate of ionization in the low atmo-sphere due to cosmic rays is 30�40 cm�3 s�1 [161], from this estimation it followsthat aerosols of size r0 � 10 μm determine the ionization balance in atmosphericair if Np � 100 cm�3.
We now consider another aspect of charged aerosol particles in the Earth’s atmo-sphere when their falling under the gravitational force leads to charge separationin the atmosphere and creates there the electric field of strength E which is estab-lished by currents of atmospheric ions, which leads to the balance equation
Z eNpw D eE(KCNC C K�N�) ,
6.5 Electric Machine of the Earth’s Atmosphere 439
where Np is the number density of aerosol particles, Z e is their mean charge, w isthe velocity of its falling, which is given by (6.3), NC and N� are the number den-sities of positive and negative ions, and KC and K� are their mobilities. Taking theregime when aerosol particles give a small contribution to the ionization balance,that is, NC D N� D N , and the ion mobilities are nearby KC D K� D K , weobtain from this balance the simple relation for the electric field strength:
E D Z Npw2K N
.
In particular, from this it follows that since for large aerosol particles Z � r0 ac-cording to (6.11) and w � r2
0 according to (6.3), the electric field strength at a givenmass density of water in the atmosphere is independent of a typical size of aerosolparticles.
6.5.6
Prebreakdown Phenomena in the Atmosphere
We now analyze one more aspect of electric phenomena in the atmosphere. Asnoted above, the electric field strength of a cloud during lightning is less by oneor two orders of magnitude than the breakdown strength at atmospheric pressureof about E D 25 kV/cm (E/N D 90 Td) between plane electrodes, or the break-down strength due to propagation of a positive streamer (about 5 kV/cm). We shallconsider some reasons for this that extend our understanding of the nature of pro-cesses that accompany electric phenomena in atmospheric air.
Consider a chain of processes that can lead to breakdown. We shall consider onlyone of several mechanisms in order to demonstrate the character of these process-es [178]. Assume that atmospheric air is subjected to an electric field of strength E,and the elementary processes 11, 12, 17, 20, 23, 26, 40, and 41 in Table 6.6 arethe determining factors. These processes lead to balance equations for the num-ber densities of electrons Ne, negative oxygen ions N�, and ozone [O3] that can bestated as
dNe
d tD (νion � νat)Ne C N�[O3]k23 ,
dN�d tD νatNe � k17N 2
� � N�[O3]k23 ,
d[O3]d tD M � [O3]
τC 2ν26Ne . (6.114)
We employ here the quantities νion D k11[O2]C k12[N2], νat D k20[O2], and ν26 Dk26[O2]. We assume that process 17 in Table 6.6 gives the main contribution torecombination of positive and negative charges and that the number density ofozone molecules is relatively small, so the dissociation of an oxygen molecule leadsautomatically to the formation of two ozone molecules as a result of processes 40and 41. The rate of ozone formation is denoted by M, and τ is the lifetime of ozonemolecules.

440 6 Complex Plasmas, Including Atmospheric Plasmas
Solving the set of two equations (6.114) under the assumption that Ne � N�,we have for the number densities of charged particles
Ne D k223
k17
νion
(νat � νion)2 [O3]2 , N� D k23
k17
νion
νat � νion[O3] . (6.115)
The subscripts in the rate constants correspond to the process numbers in Ta-ble 6.6. Expressions (6.115) show that a reverse connection between processes re-stores electrons. As a result, there are stable currents in atmospheric air subjectedto an electric field. At νat D νion, an instability develops that leads to breakdownin pure air. This will occur at E D 25 kV/cm, which is the breakdown strength ofdry air in the case of uniform currents. However, the sequence of processes spec-ified above leads to breakdown at smaller electric fields. An increase of the ozonenumber density leads to an increase of the electron number density, which, in turn,causes an increase of the ozone number density. Then at certain sets of parametervalues an explosive instability can develop, meaning that breakdown has occurred.We now seek the threshold for this instability.
For this purpose, we analyze the third equation in (6.114). Substituting it for theelectron number density in (6.115), we have
d[O3]d tD N0
τ� [O3]
τC kef[O3]2 , (6.116)
where N0 D M τ is the ozone number density in the absence of the electric field.The effective rate constant determined by
kef D 2k223νion ν26
k17(νat � νion)2
is the combination of the rate constants for the corresponding processes. Un-der typical atmospheric conditions we have N0 � 1012 cm�3. The effectiverate constant kef depends strongly on the electric field strength. It has the val-ues 8 10�13 cm3/s at E/N D 30 Td, 2 10�11 cm3/s at E/N D 50 Td, and6 10�10 cm3/s at E/N D 80 Td.
In the stationary case, (6.116) has two solutions, of which one is stable. The in-stability corresponds to imaginary values for the solutions. Hence, the instabilitythat leads to breakdown corresponds to the condition
kef � (4N0τ)�1 . (6.117)
The real lifetime of ozone molecules in the atmosphere is rather long (τ � 106 s)because ozone is produced at high altitudes (40–80 km) and its loss results fromchemical reactions (ozone cycles) or from transport to the Earth’s surface. The pa-rameter τ in condition (6.117) refers to the time during which an ozone moleculeis located in a region with a large electric field strength. If we take the size of such aregion as the cloud size L � 1 km, and the velocity of transport from this region tobe the wind velocity v � 1 m/s, then we have τ � 103 s, and condition (6.117) gives

References 441
kef � 2 10�16 cm3/s. The above values of kef show that the chain of processeswe are considering leads to reduction of the breakdown electric field strength byseveral times.
We consider the ozone version of breakdown reduction to be merely illustrative,being guided by breakdown in homogeneous air, whereas breakdown in the atmo-sphere at large distances between electrodes develops in the form of a streamer, anonuniform ionization wave, which requires lower threshold fields than uniformbreakdown. Nevertheless, the above analysis illustrates important reasons for re-duction of the electric field required to cause breakdown in natural air. Other rea-sons for a reduction in the breakdown threshold are heating of some regions of theatmosphere, the presence of particles, drops, or chemical compounds in the atmo-sphere, inhomogeneities of the electric field, and so on. This listing exemplifies thewide variety of processes that can influence atmospheric electric properties.
References
1 Fortov, V. et al. (2005) Phys. Rep., 421, 1.2 Vladimirov, S.V., Ostrikov, K., and
Samarian, A.A. (2005) Physics and Ap-plications of Complex Plasmas, ImperialCollege, London.
3 Tsytovich, V.N., Morfill, G.E.,Vladimirov, S.V., and Thomas, H. (2008)Elementary Physics of Complex Plasmas,Springer, Berlin.
4 Fortov, V.E. and Morfill, G.E. (eds) (2010)Complex and Dusty Plasmas, CRC Press,London.
5 Bonitz, M., Honig, N., and Ludwig, P.(eds) (2010)Introduction to Complex Plas-mas, Springer, Berlin.
6 Flleagle, R.G. and Businger, J.A. (1980)An Introduction to Atmospheric Physics,Academic Press, San Diego.
7 Salby, M.L. (1996) Fundamentals of At-mospheric Physics, Academic Press, SanDiego.
8 Aitken, J. (1881) Nature, 23, 195.9 Aitken, J. (1892) Proc. R. Soc. A, 51, 408.
10 Harris, S.H. (1990) in Encyclope-dia of Physics, (eds. R.G. Lerner andG.L. Trigg), Wiley & Sons Inc., NewYork, p. 30.
11 Harris, S.H. (2005) in Encyclope-dia of Physics, (eds. R.G. Lerner andG.L. Trigg), Wiley-VCH Verlag GmbH,p. 61.
12 Somov, B.V. (2000) Cosmic PlasmaPhysics, Kluwer Academic Publishing,Dordrecht.
13 Meyer-Vernet, N. (2007) Basics of So-lar Wind, Cambridge University Press,Cambridge.
14 Wright, C.C. and Nelson, G.J. (1979)Icarus, 38, 123.
15 Meyer-Vernet, N., Steinberg, J.L.,Strauss, M.A. et al. (1987) Astron. J.,93, 474.
16 Vourlidas, A., Davis, C.J., Eyles, C.J. etal. (2007) Astrophys. J., 668, L79.
17 Buffington, A., Bisi, M.M., Clover, J.M.et al. (2008) Astrophys. J., 677, 798.
18 Axford, W.I. and Mendis, D.A. (1974)Annu. Rev. Earth Planet. Sci., 2, 419.
19 Goertz, C.K. (1989) Rev. Geophys., 27,721.
20 Mendis, D.A. and Rosenberg, M. (1994)Annu. Rev. Astron. Astrophys., 32, 419.
21 Horanyi, M. (1996) Annu. Rev. Astron.Astrophys., 34, 383.
22 Tsytovich, V.N. (1997) Phys. Usp., 40, 53.23 Morfill, G.E., Grün, E., and Johnson, T.V.
(1980) Planet. Space Sci., 28, 1087.24 Morfill, G.E., Grün, E., Johnson, T.V.
(1983) J. Geophys. Res., 88, 5573.25 Horanyi, M. (2000) Phys. Plasmas, 7,
3847.26 Kurth, W.S. et al. (2006) Planet. Space
Sci., 54, 988.
442 6 Complex Plasmas, Including Atmospheric Plasmas
27 Krishna Swamy, K.S. (1997) Physics ofComets, World Scientific, Singapore.
28 Brandt, J.C. and Chapman, R.D. (2004)Introduction to Comets, Cambridge Uni-versity Press, Cambridge.
29 Mendis, D.A. (1988) Ann. Rev. Astron.Astrophys., 26, 11.
30 Chu, J.H. and Lin, I. (1994) Phys. Rev.Lett., 72, 4009.
31 Thomas, H. et al. (1994) Phys. Rev. Lett.,73, 652.
32 Hayashi, Y. and Tachibana, S. (1994) Jpn.J. Appl. Phys., 33, L804.
33 Melzer, A., Trottenberg, T., and Piel, A.(1994) Phys. Lett. A, 191, 301.
34 Nefedov, A.P., Petrov, O.F., and For-tov, V.E. (1997) Phys. Usp., 40, 1163.
35 Shukla, P.K. and Mamun, A.A. (2001)Introduction to Dusty Plasma Physics, IOPPublishing, Bristol.
36 Fortov, V.E. et al. (2004) Phys. Usp., 47447.
37 Fortov, V.E., Jakubov, I.T., and Khra-pak, A.G. (2006) Physics of Strongly Cou-pled Plasma, Oxford University Press,Oxford.
38 Melzer, A. and Goree, J. (2008) Fun-damentals of dusty plasmas, in LowTemperature Plasmas, (eds R. Hippleret al.), vol. 1, John Wiley & Sons, Inc.,Hoboken, p. 129.
39 Hippler, R. and Kersten, H. (2008) Ap-plications of dusty plasmas, in LowTemperature Plasmas, (eds R. Hippleret al.), vol. 2, John Wiley & Sons, Inc.,Hoboken, p. 787.
40 Smirnov, B.M. (1997) Phys. Usp., 40,1117.
41 Smirnov, B.M. (2000) Phys. Usp., 43, 453.42 Smirnov, B.M. (2004) Contrib. Plasma
Phys., 44, 558.43 Smirnov, B.M. (2006) Principles of Sta-
tistical Physics, John Wiley & Sons, Inc.,Hoboken.
44 Echt, O., Sattler, K., and Recknagel, E.(1981) Phys. Rev. Lett., 94, 54.
45 Echt, O. et al. (1982) Ber. Bunsenges. Phys.Chem., 86, 860.
46 Ding, A. and Hesslich, J. (1983) Chem.Phys. Lett., 94, 54.
47 Knight, W.D. et al. (1984) Phys. Rev. Lett.,52, 2141.
48 Harris, I.A., Kidwell, R.S., and North-by, J.A. (1984) Phys. Rev. Lett., 53, 2390.
49 Phillips, J.C. (1986) Chem. Rev., 86, 619.50 Harris, I.A., Norman, K.A., Mulk-
ern, R.V., and Northby, J.A. (1986) Chem.Phys. Lett., 130, 316.
51 Miehle, W., Kandler, O., Leisner, T., andEcht, O. (1989) J. Chem. Phys., 91, 5940.
52 Mott-Smith, H.M. and Langmuir, I.(1926) Phys. Rev., 28, 727.
53 Druyvesteyn, M.J. and Penning, F.M.(1940) Rev. Mod. Phys., 12, 87.
54 Baum, E. and Chapkis, R.L. (1970) AIAAJ., 8, 1073.
55 Allen, J.E. (1992) Phys. Scr., 45, 497.56 Shun’ko, E.V. (2009) Langmuir Probe
in Theory and Practice, Brown WalkerPress, Boca Raton.
57 Al’pert, Y.L., Gurevich, A.V., andPitaevsky, L.P. (1965) Space Physics withArti- facial Satellites, Consultants Bureau,New York.
58 Wigner, E.P. and Seitz, F. (1934) Phys.Rev., 46, 509.
59 Wigner, E.P. (1934) Phys. Rev., 46, 1002.60 Smirnov, B.M. (2010) Cluster Processes in
Gases and Plasmas, John Wiley & Sons,Inc., Hoboken.
61 Smirnov, B.M., Shyjumon, I., and Hip-pler, R. (2007) Phys. Rev. E, 77, 066402.
62 Fuks, N.A. (1964) Mechanics of Aerosols,Macmillan, New York.
63 Smoluchowski, M.V. (1916) Z. Phys., 17,585.
64 Langevin, P. (1905) Ann. Chem. Phys., 8,245.
65 Smirnov, B.M. (1999) Clusters and SmallParticles in Gases and Plasmas, Springer,New York.
66 Illenberger, E. and Smirnov, B.M. (1998)Phys. Usp., 41, 651.
67 Birkhoff, G.D. (1931) Proc. Natl. Acad.Sci. USA, 17, 656.
68 Neumann, J. (1932) Proc. Natl. Acad. Sci.USA, 18, 70, 263.
69 Landau, L.D. and Lifshitz, E.M. (1980)Statistical Physics, vol. 1, PergamonPress, Oxford.
70 Landau, L.D. and Lifshitz, E.M. (1980)Mechanics, Pergamon Press, London.
71 Currie, I.G. (1974) Fundamental Mechan-ics of Fluids, McGraw-Hill, London.

References 443
72 Huang, K. (1987) Statistical Mechanics,John Wiley & Sons, Inc., New York.
73 Acheson, D.J. (1990) Elementary Flu-id Dynamics, Oxford University Press,Oxford.
74 Smythe, W.R. (1950) Static and DynamicElectricity, McGraw-Hill, New York.
75 Jackson, J.D. (1998) Classical Electrody-namics, John Wiley & Sons, Inc., NewYork.
76 Smirnov, B.M. (2008) Reference Dataon Atomic Physics and Atomic Processes,Springer, Heidelberg.
77 Bernstein, I.B. and Rabinovitz, I.N.(1959) Phys. Fluids, 2, 112.
78 Zaslavskii, G.M. and Sagdeev, R.Z.(1988) Introduction to Nonlinear Physics.From Pendulum to Turbulence and Chaos,Nauka, Moscow.
79 Sena, L.A. (1946) Zh. Eksp. Teor Fiz., 16,734.
80 Sena, L.A. (1948) Collisions of Electronsand Ions with Atoms, Gostekhizdat,Leningrad.
81 Hirschfelder, J.O., Curtiss, Ch.F., andBird, R.B. (1954) Molecular Theory ofGases and Liquids, John Wiley & Sons,Inc., New York.
82 Smirnov, B.M. (2010) JETP, 110, 1042.83 Bliokh, P.V., Sinitsin, V., and
Yaroshenko, V. (1995) Dusty and Self-Gravitational Plasmas in Space, KluwerAcademic Publishing, Dordrecht.
84 Shukla, P.K. and Mamun, A.A. (2002)Introduction to Dusty Plasma Physics,Institute of Physics Publishing, Bristol.
85 Horanyi, M., Havnes, O., and Mor-fill, G.E. (2010) in Complex and DustyPlasmas, (eds. V.E. Fortov and G.E. Mor-fill), CRC Press, London, p. 291.
86 Hundhausen, A.J. (1996) Introductionto Space Physics, Cambridge UniversityPress, Cambridge.
87 Hamilton, C.J. (1995) Solar Views,http://www.solarviews.com/browse/pia/PIA06193.jpg (accessed 10 August2011).
88 Mendis, D.A. and Rosenberg, M. (1996)Annu. Rev. Astron. Astrophys., 32, 419.
89 Bosh, A.S., Olkin, C.B., French, R.G.,and Nicholson, P.D. (2002) Icarus, 157,57.
90 Dikarev, V.V. (1999) Astron. Astropys.,346, 1011.
91 Matthews, L.S., Hyde, T.W. (2004) Adv.Space Res., 33, 2292.
92 Srama, R. et al. (2006) Planet. Space Sci.54, 967.
93 Porco, C.C. et al. (2006) Science, 311,1393.
94 Wang, Z. et al. (2006) Planet. Space Sci.,54, 957.
95 Havnes, O., Morfill, G., Melandsø, F.(1992) Icarus, 98, 141.
96 Gan-Baruch, Z., Eviator, A., Richard-son, J.D. (1994) J. Geophys. Res., 99,11063.
97 Hamilton, C.J. (1995) Views of the So-lar System, http://www.solarviews.com/cap/comet/west.htm (accessed 10 Au-gust 2011).
98 Bryant, P. (2003) J. Phys. D, 36, 2859.99 Khrapak, S.A. et al. (2005) Phys. Rev. E,
72, 016406.100 Khrapak, S.A., Morfill, G.E., Khra-
pak, A.G., and D’yachkov, L.G. (2006)Phys. Plasmas, 13, 052114.
101 D’yachkov, L.G., Khrapak, A.G., Khra-pak, S.A., and Morfill, G.E. (2007) Phys.Plasmas, 14, 042102.
102 Gatti, M. and Kortshagen, U. (2008)Phys. Rev. E, 78, 046402.
103 Schottky, V.W. (1924) Phys. Z., 25, 342.104 Dutton, J. (1975) J. Phys. Chem. Ref.
Data, 4, 577.105 Konopka, U., Morfill, G.E., and
Rathke, L. (2000) Phys. Rev. Lett., 84,891.
106 Ikezi, H. (1986) Phys. Fluids, 29, 1764.107 Juan, W.T. et al. (1998) Phys. Rev. E, 58,
R6947.108 Fortov, V.E. et al. (2000) Phys. Lett. A,
267, 179.109 Karasev, V.Yu. et al. (2008) JETP, 106,
399.110 Fortov, V.E. et al. (2010) in Complex
and Dusty Plasmas, (eds. V.E. Fortov,G.E. Morfill), CRC Press, London, p. 1.
111 Smirnov, B.M. (2003) Phys. Usp., 46, 589.112 Smirnov, B.M. (1994) Phys. Usp., 37, 621.113 Smirnov, B.M. and Strizhev, A.Yu. (1994)
Phys. Scr., 49, 615.114 Smirnov, B.M., Shyjumon, I., and Hip-
pler, R. (2006) Phys. Scr., 73, 288.
444 6 Complex Plasmas, Including Atmospheric Plasmas
115 Voloshchuk, V.M. (1984) Kinetic The-ory of Coagulation, Gidrometeoizdat,Leningrad.
116 Ostwald, W. (1900) Z. Phys. Chem., 34,495.
117 Smoluchowski, M.V. (1918) Z. Phys.Chem., 92, 129.
118 Rao, B.K. and Smirnov, B.M. (1997)Phys. Scr., 56, 588.
119 Rao, B.K. and Smirnov, B.M. (2002)Mater. Phys. Mech., 5, 1.
120 Lifshitz, I.M. and Slezov, V.V. (1958) Sov.Phys. JETP, 35 331.
121 Lifshitz, I.M. and Slezov, V.V. (1959) Fiz.Tverd. Tela, 1, 1401.
122 Lifshitz, I.M. and Slezov, V.V. (1961) J.Phys. Chem. Sol., 19, 35.
123 Slezov, V.V. and Sagalovich, V.V. (1987)Sov. Phys. Usp., 30, 23.
124 Lifshitz, E.M. and Pitaevskii, L.P. (1981)Physical Kinetics, Pergamon Press, Ox-ford.
125 Zhukhovizkii, D.I., Khrapak, A.G., andJakubov, I.T. (1983) High Temp., 21, 1197.
126 Zhukhovizkii, D.I. (1989) High Temp.,27, 515.
127 Ino, S. (1969) J. Phys. Soc. Jpn., 27, 941.128 Weber, B. and Scholl, R. (1992) J. Illum.
Eng. Soc., Summer 1992, 93.129 Scholl, R. and Weber, B. (1992) in
Physics and Chemistry of Finite Systems:From Clusters to Crystals, (eds. P. Jena,S.N. Khana, and B.K. Rao), vol. 2, KluwerAcademic Press, Dordrecht, p. 1275.
130 Weber, B. and Scholl, R. (1993) J. Appl.Phys., 74, 607.
131 Scholl, R. and Natour, G. (1996) inPhenomena in Ionized Gases, (eds.K.H. Becker, W.E. Carr, E.E. Kunhardt),AIP Press, Woodbury, p. 373.
132 Smirnov, B.M. (1998) Phys. Scr., 58, 363.133 Smirnov, B.M. (2000) JETP Lett., 71, 588.134 Chamberlain, J. (1978) Theory of Plane-
tary Atmospheres, Academic Press, Lon-don.
135 Deminov, M.G. (2008) in Encyclopediaof Low Temperature Plasma, (ed V.E. For-tov), ser. B, vol. 1, Yanus, Moscow, p. 72,in Russian.
136 Reist, P.C. (1984) Introduction to AerosolScience, Macmillan, New York.
137 Green, H.L. and Lane, W.R. (1964) Par-ticulate Clouds: Dust, Smokes and Mists,Van Nostrand, Princeton.
138 Friendlander, S.K. (2008) Smoke, Dustand Haze: Fundamentals of Aerosol Dy-namics, Oxford University Press, Oxford.
139 Uman, M.A. (1986) About Lightning,Dover, New York.
140 Hinds, W.C. (1999) Aerosol Technology:Properties, Behavior and Measurement ofAirborne Particles, John Wiley & Sons,Inc., New York.
141 Kelley, M.C. (1989) The Earth’s Iono-sphere: Plasma Physics and Electrodynam-ics, Academic Press, San Diego.
142 Alpert, Ja.L. (1972) Propagation of Ra-diowaves in Atmosphere, Nauka, Moscow.
143 Davies, K. (1990) Ionospheric Radio, PeterPeregrinus Ltd, London.
144 McIven, M. and Philips, L. (1978) Chem-istry of Atmospheres, Mir, Moscow.
145 Brunelli, B.E. and Laminadze, A.A.(1988) Physics of Ionosphere, Nauka,Moscow.
146 Rees, M.H. (1989) Physics and Chem-istry of Upper Atmosphere, CambridgeUniversity Press, Cambridge.
147 Shunk, R.W. and Nagy, A.E. (2000)Ionospheres: Physics, Plasma Physics, andChemistry, Cambridge University Press,Cambridge.
148 Bilitza, D. (2002) Radio Science, 36, 261.149 Israel, H. (1973) Atmospheric Electricity,
Keter Press Binding, Jerusalem.150 Moore, C.B. and Vonnegut, B. (1977) in
Lightning, (ed. R.H. Golde), AcademicPress, London, p. 51.
151 Feynman, R.P., Leighton, R.B., andSands, M. (1964) The Feynman Lectureson Physics, vol. 2, Addison-Wesley, Read-ing.
152 Berger, K. (1977) in Lightning, (ed.R.H. Golde), Academic Press, London,p. 119.
153 Fowler, R.G. (1982) in Applied AtomicCollision Physics, (eds H.S.W. Massey,E.W. McDaniel, and B. Bederson), vol. 5,Academic Press, New York, p. 35.
154 Latham, J. and Stromberg, I.M. (1977)in Lightning, (ed. R.H. Golde), AcademicPress, London, p. 99.
References 445
155 Ellis, H.W., Pai, R.Y., McDaniel, E.W.,Mason, E.A., and Viehland, L.A. (1976)Atom. Data Nucl. Data Tables, 17, 177.
156 Ellis, H.W., McDaniel, E.W., Albrit-ton, D.L., Viehland, L.A., Lin, S.L., andMason, E.A. (1978) Atom, Data Nucl.Data Tables, 22, 179.
157 Ellis, H.W., Trackston, M.G., Mc-Daniel, E.W., and Mason, E.A. (1984)Atom. Data Nucl. Data Tables, 31, 113.
158 Viehland, L.A. and Mason, E.A. (1995)Atom. Data Nucl. Data Tables, 60, 37.
159 Wilson, C.T.R. (1925) Proc. R. Soc., 37,32D.
160 Neher, H.V. (1971) J. Geophys. Res., 76,1637.
161 Nicolet, M. (1975) Planet. Space Sci., 23,637.
162 Schouland, B. (1930) Proc. R. Soc., A130,37.
163 Appelton, E. and Bowen, E. (1933) Na-ture, 132, 965.
164 Seinfeld, J.H. and Pandis, S.N. (1998)Atmospheric Chemistry and Physics, JohnWiley & Sons, Inc., New York.
165 Byers, H.R. (1965) Elements of CloudPhysics, University of Chicago Press,Chicago.
166 Fletcher, N.H. (1969) The Physics ofRainclouds, Cambridge University Press,London.
167 Mason, B.J. (1971) The Physics of Clouds,Clarendon Press, Oxford.
168 Twomey, S. (1977) Atmospheric Aerosols,Elsevier, Amsterdam.
169 Proppacher, H. and Klett, J. (1978) Mi-crophysics of Clouds and Precipitation,Reidel, London.
170 Javaratne, E.R., Saunders, C.P.R., andHallett, J. (1983) Q. J. R. Meteorol. Soc.,109, 609.
171 Williams, E.R., Zhang, R., and Rydock, J.(1991) J. Atmos. Sci., 48, 2195.
172 Dong, Y. and Hallett, J. (1992) J. Geo-phys.Res., 97, 20361.
173 Mason, B.L. and Dash, J.G. (2000) J. Geo-phys.Res., 105, 10185.
174 Dash, J.G., Mason, B.L., and Wett-laufer, J.S. (2001) J. Geophys.Res., 106,20395.
175 Berdeklis, P. and List, R. (2001) J. At-mos.Sci., 58, 2751.
176 Nelson, J. and Baker, M. (2003) Atmos.Chem. Phys. Discuss., 3, 41.
177 MacGorman, D.R. and Rust, W.D. (1998)Electrical Nature of Storms, Oxford Uni-versity Press, New York.
178 Eletskii, A.V. and Smirnov, B.M. (1991)J. Phys. D, 24, 2175.
179 Holstein, T. (1952) J. Chem. Phys., 56,832.
180 Appleton, E.V. and Barnett, M.A.F.(1925) Nature, 115, 333.
181 Appleton, E.V. and Barnett, M.A.F.(1925) Proc. Roy. Soc. A, 109, 621.