fundamentals of gis materials by austin troy © 2006 lecture 9: data quality and input methods by...
TRANSCRIPT

Materials by Austin Troy © 2006
Fundamentals of GIS
Lecture 9:Data Quality and Input Methods
By Austin TroyUniversity of Vermont

Materials by Austin Troy © 2006
Fundamentals of GIS
Part 1: •Data input methods: Digitizing
and Geocoding
------Using GIS--

Materials by Austin Troy © 2006
Fundamentals of GIS
1. Geocoding

Materials by Austin Troy © 2006
Fundamentals of GIS
What is Geocoding?•One of the most common forms of geographic data is the address, which usually come in lists•Geocoding allows us to create a point feature for each address, properly referenced in space•But since an address is merely a text string containing the information of house number, street name, direction, and/or zip codes, an address needs a mechanism to calculate the geographic coordinate for the address and then display the location on a map based on the assigned coordinate. •address matching is a type of geocoding using a street address database, created from a streets layer.

Materials by Austin Troy © 2006
Fundamentals of GIS
Address Matching Geocoding
• Two inputs: – 1) a DBF or text table with the address records to
be geocoded and – 2)a geographic reference layer, like streets (we
could also geocode addresses with reference to a property boundary layer, if we had one)
• Output: a point file, where each point represents an address record; includes all attributes from original address table

Materials by Austin Troy © 2006
Fundamentals of GIS
How are addresses matched?• Common method: matching address to street ranges.• In urban areas, usually each street segment (arc)
corresponds to a block. Each segment (which represents a record in the attribute table) has attributes for the left from and to and right from and to addresses.
• Hence computer knows the left address and right address and the beginning and end of the block.
• You give it an address and it matches the street name, finds the address range it falls in (that is, the street segment it falls along) and interpolates the position of the address point based on its numeric distance between the from and to addresses on that block

Materials by Austin Troy © 2006
Fundamentals of GIS
Geocoding with streets: Address ranges
1060 Main St
•It places it on even (upper) side of street•Position of 1060 is interpolated
Main St1000 1100
1001 1101
R-F-ADDR R-T-ADDR
L-F-ADDR L-T-ADDR
It looks for Main street, than for the 1000-1100 block

Materials by Austin Troy © 2006
Fundamentals of GIS
Address Matching in ArcGIS •The first thing we must do is create a geocoding service•This is where we tell Arc GIS “I am going to be using this streets layer (or other type) as a reference layer for future geocoding. Please create a database of all the address ranges on this streets layer.”•The geocoding service is where you specify information about your reference layer that ArcGIS might not know, allowing for more efficient geocoding•When you geocode in ArcMap, you do so with reference to the Service, not the reference layer

Materials by Austin Troy © 2006
Fundamentals of GIS
Geocoding in Arc GIS• We create our geocoding
service in Arc Catalog.
• This will bring up a dialogue asking for the geocoding style for that geocoding service

Materials by Austin Troy © 2006
Fundamentals of GIS
Geocoding Service• Geocoding styles are necessary because
– Reference layers come in many forms and formats. For instance, a reference layer may have the from right address attribute as fr_rt_add or add_rt_frm)
– There are other types of geocoding, besides address geocoding, like geocoding points to the center of zip codes, and there are other types of address geocoding besides street address geocoding, like using a property parcel layer as reference.

Materials by Austin Troy © 2006
Fundamentals of GIS
Most Common Geocoding Styles• US Streets: This is where street address ranges exist
in the reference file on the left and right side of each street segment
• US Streets with Zone: requires a zone (usually zip code or city) as well as an address. This is for mapping larger areas, where the same street name may appear in several locations
• Street Map USA: This allows you to plot out street addresses based on the standardized address street range format of StreetMap USA (should be installed soon on 222 machines). Arc GIS “knows” this.

Materials by Austin Troy © 2006
Fundamentals of GIS
Geocoding in Arc GIS• Once you choose your geocoding style, it brings
up an interface where you choose your reference file and then specify which attributes in the reference layer correspond with the inputs that ArcGIS needs to do geocoding.
• It also asks for some information about what to expect in your geocoding table (what the required attribute headings are called) and how sensitive to be to things like spelling differences

Materials by Austin Troy © 2006
Fundamentals of GIS
Specify reference file
Specify address range attributes
Specify rules for address list
Specify zone

Materials by Austin Troy © 2006
Fundamentals of GIS
Geocoding in Arc GIS• We have now created a geocoding service, which
we should name so we can keep it straight.
• Now, in Arc Map we go to Tools>>Geocode Addresses and we addthe geocoding service we want to use
• Not that you can now browse to yougeocoding service by cliking onCatalog>>Geocoding Services

Materials by Austin Troy © 2006
Fundamentals of GIS
Geocoding in Arc GIS• This brings up the
geocoding interface where we specify which field holds the address and which holds the zone
• Also specify an output shapefile or geodatabase and geocoding sensitivity

Materials by Austin Troy © 2006
Fundamentals of GIS
Geocoding in Arc GIS• After geocoding, it tells
me how many were successfully matched and how many were either totally unmatchable or potentially matchable
• We can interactively match the potential ones if we want

Materials by Austin Troy © 2006
Fundamentals of GIS
Geocoding and Error• Your Geocoding result is only as good as your
reference data.
• If your streets layer is accurate only to 200 meters of accuracy, so will your geocoded points be
• If your streets are consistently 100 meters to the north, then your points will be the same too
• Some roads layers may have better attributes than other too. For instance, one layer may be lacking address ranges for small streets

Materials by Austin Troy © 2006
Fundamentals of GIS
Geocoding and Error• Here’s an example where the same address list was
geocoded with two different street layers.• Note here how the same house is 100 m off between the
two geocoding attempts
100 m
Materials by Austin Troy © 2006
Fundamentals of GIS
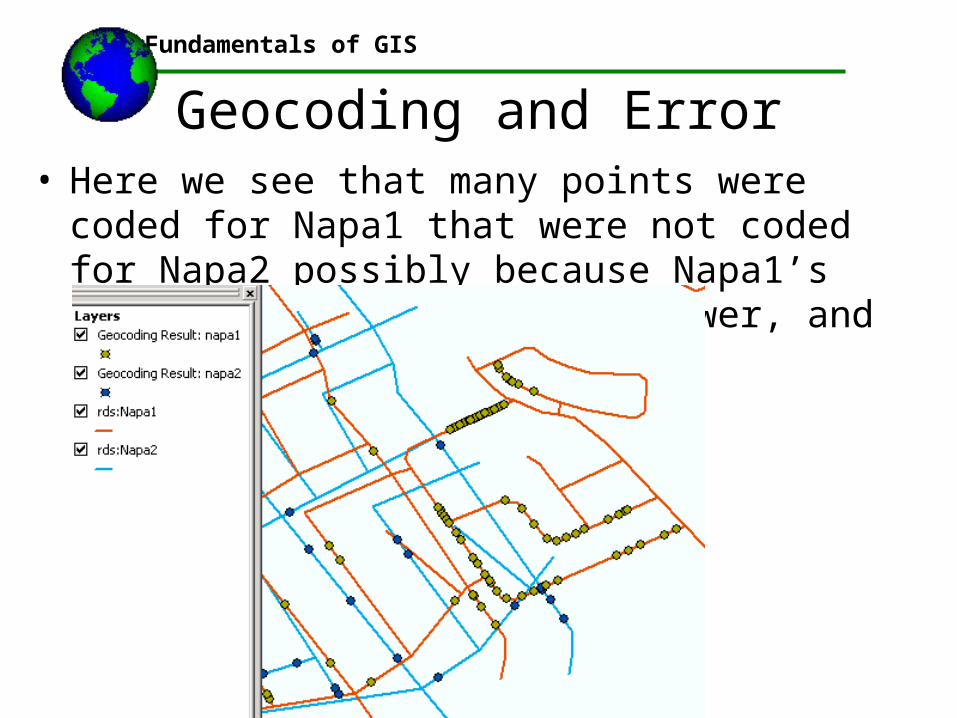
Geocoding and Error• Here we see that many points were coded for Napa1 that
were not coded for Napa2 possibly because Napa1’s street reference layer is newer, and has more streets

Materials by Austin Troy © 2006
Fundamentals of GIS
Geocoding and Error• This error is due to an attribute error in
one of the layers which puts that address in the wrong street segment
100 m
300 m
Materials by Austin Troy © 2006
Fundamentals of GIS
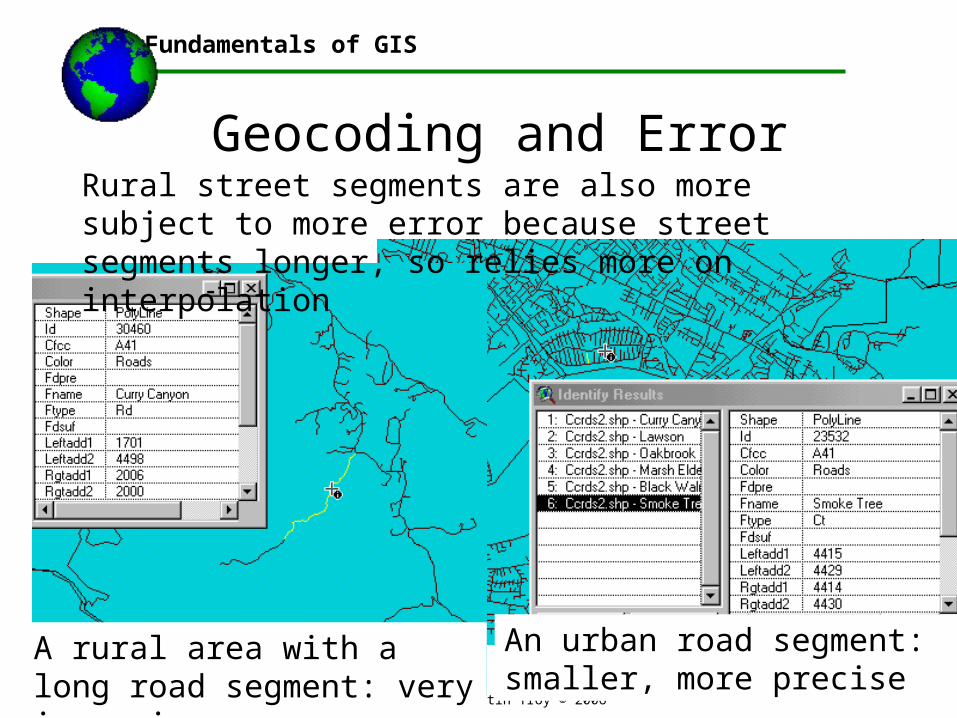
Geocoding and Error
A rural area with a long road segment: very imprecise
An urban road segment: smaller, more precise
Rural street segments are also more subject to more error because street segments longer, so relies more on interpolation

Materials by Austin Troy © 2006
Fundamentals of GIS
Geocoding in ActionMapping hazard zone properties in L.A. to see effects on property values

Materials by Austin Troy © 2006
Fundamentals of GIS
XY GeocodingWe can also create points from a table by their latitude and longitudeDo this by clicking:
CA haz. waste sites
•Then we specify the lat and long fields
•Lat and Long should be in decimal degrees

Materials by Austin Troy © 2006
Fundamentals of GIS
2. Digitizing

Materials by Austin Troy © 2006
Fundamentals of GIS
Digitizing•This is generally the process of converting data from analog to digital , but usually refers to the process of using a device, such as a digitizing tablet or mouse to create new vector features
•The user moves a mouse or cursor over a feature, (either over a paper map on a table, or a digital rasterized map on a screen) and defines features, by pointing, dragging and clicking.

Materials by Austin Troy © 2006
Fundamentals of GIS
Digitizing•Table digitizing involves use of a digitizing tablet or table
•A digitizing table is a big table with an electronic mesh that can sense the position of a digitizing cursor
•Usually have accuracy of .001 inch
•Transmits x and y coordinates of each mouse/cursor click to the computer and usually joins those with lines

Materials by Austin Troy © 2006
Fundamentals of GIS
Digitizing•Notice how it is attached with tape
Source: http://ndis.nrel.colostate.edu/ndis/riparian/Tablet.jpg
•If it moves, the map will be inaccurate, because it’s recording position relative to the tablet, not the map

Materials by Austin Troy © 2006
Fundamentals of GIS
Digitizing•Many GIS packages have a built-in module to handle manual digitizing data
•The highest quality way to do it is to use a Computer Aided Design program (CAD) like AutoCAD, which is what engineers use
•Multiple layers can be digitized from the same map in CAD by activating a different “levels” for each layer
•However, that file will have no topology
•Topology, if desired, will have to be built in Arc/Info

Materials by Austin Troy © 2006
Fundamentals of GIS
Digitizing•Snapping: Arc will also snap closed any unsnapped lines or polygons and will crop dangling lines, based on user-defined tolerances
• Snap tolerance: won’t snap together
Snap tolerance: will snap together
Dangling arc Snapped to other arc

Materials by Austin Troy © 2006
Fundamentals of GIS
Digitizing•Digitizing on a tablet requires defining “control points” which allow the conversion of the digitized map to real world coordinates.
•Usually, a corner point on the map of known geographic location is digitized first and its coordinates are assigned in some sort of header file; this way the computer knows where the map is location, what the scale is and what the relative location of all features is

Materials by Austin Troy © 2006
Fundamentals of GIS
Digitizing•“Heads” up digitizing involves scanning a paper map to a digital file, or otherwise obtaining a digital raster map/ image and digitizing “on top” of it with the mouse in a program, like Arc View (see lab 7)
•In Arc View, we create a new Shapefile and use the digitizing tools (points, lines, polygons) to draw features over what appear to be recognizable features on the raster map. This is the easiest way to digitize

Materials by Austin Troy © 2006
Fundamentals of GIS
Part 2
Spatial Data Quality

Materials by Austin Troy © 2006
Fundamentals of GIS
Data Quality
•Accuracy+ Precision = Quality
•Error= fn(accuracy, precision)
•Cost vs. quality tradeoff

Materials by Austin Troy © 2006
Fundamentals of GIS
Accuracy• “the degree to which information on a map or in a
digital database matches true or accepted values.”• From Kenneth E. Foote and Donald J. Huebner
http://www.colorado.edu/geography/gcraft/notes/error/error_f.html
• Reflection of how close a measurement represent the actual quantity measured and of the number and severity of errors in a dataset or map.

Materials by Austin Troy © 2006
Fundamentals of GIS
Precision• Intensity or level of preciseness, or exactitude in
measurements. The more precise a measurement is, the smaller the unit which you intend to measure
• Hence, a measurement down to a fraction of a cm is more precise than a measurement to a cm
• However, data with a high level of precision can still be inaccurate—this is due to errors
• Each application requires a different level of precision

Materials by Austin Troy © 2006
Fundamentals of GIS
Random and Systematic error•Error can be systematic or random
•Systematic error can be rectified if discovered, because its source is understood
•A common example is where an remote sensing instrument consistently measures data erroneously because of bad calibration—if the problem in calibration can be understood and accounted for, then that error is called systematic
•Another example: projecting map data using the wrong zone would result in consistently wrong data

Materials by Austin Troy © 2006
Fundamentals of GIS
Random and Systematic error•Systematic errors affect accuracy, but are usually independent of precision; data can use highly precise methods but still be inaccurate due to systematic error
Accurate and precise: no systematic , little random error
inaccurate and precise: little random error but significant systematic error
Accurate and imprecise: no systematic , but considerable random error
inaccurate and imprecise: both types of error

Materials by Austin Troy © 2006
Fundamentals of GIS
Error propagation•Where one error leads to another
•Example: if a key reference point was mis-digitized in layer A and that point was used to “register” layer B to layer A, then the error is propagated in layer B and all subsequent layers based on either of them; this error can propagate additively or multiplicatively

Materials by Austin Troy © 2006
Fundamentals of GIS
Error cascading•Refers to when errors are allowed to propagate unchecked from one layer to the next and on to the final set of products or recommendations
•Can be managed to a certain extent by conducting “sensitivity analysis”
•Can occur with positional as well as with attribute errors

Materials by Austin Troy © 2006
Fundamentals of GIS
Positional Accuracy• Positional accuracy standards specify that
acceptable positional error varies with scale
• Data can have high level of precision but still be positionally inaccurate
• Positional error is inversely related to precision and to amount of processing

Materials by Austin Troy © 2006
Fundamentals of GIS
Measurement of Positional AccuracyOften stated as confidence interval: e.g. 104.2 cm
+/- .01 = true value lies between 104.21 and 104.19
Root mean squared error (MSE); equals squared difference between observed and expected value for observation i divided by total number of observations, summed across each observation i
This is just a standardized measure of error—how close the predicted measure is to observed

Materials by Austin Troy © 2006
Fundamentals of GIS
Positional Error• Different agencies have different standards for
positional error
• Example: USGS horizontal positional requirements state that 90% of all points must be within 1/30th of an inch for maps at a scale of 1:20,000 or larger, and 1/50th of an inch for maps at scales smaller than 1:20,000

Materials by Austin Troy © 2006
Fundamentals of GIS
Positional Error• USGS Accuracy standards on the ground:
1:4,800 ± 13.33 feet
1:10,000 ± 27.78 feet
1:12,000 ± 33.33 feet
1:24,000 ± 40.00 feet
1:63,360 ± 105.60 feet
1:100,000 ± 166.67 feet
See image from U. Colorado showing accuracy standards visually
Hence, a point on a map represents the center of a spatial probability distribution of its possible locations
Thanks to Kenneth E. Foote and Donald J. Huebner, The Geographer's Craft Project, Department of Geography, The University of Colorado at Boulder for links

Materials by Austin Troy © 2006
Fundamentals of GIS
Positional Error-some examples

Materials by Austin Troy © 2006
Fundamentals of GIS
Positional Error-some examples
Notice that the small scale map has much less detail (less precision) and hence is less accurate locally; here accuracy is a function of precision; from a distance, however, this is less apparent

Materials by Austin Troy © 2006
Fundamentals of GIS
Positional Error-some examples

Materials by Austin Troy © 2006
Fundamentals of GIS
Positional Error-some examples
Notice the same pattern between medium and large scale

Materials by Austin Troy © 2006
Fundamentals of GIS
Positional Error-some examples

Materials by Austin Troy © 2006
Fundamentals of GIS
Positional Error-some examples
Here two layers derived from the same scale data (1:100,000) have different positions: the blue has less error because it has a local projection, while the thicker line has a regional projection; here positional error is not due to precision, but to processing

Materials by Austin Troy © 2006
Fundamentals of GIS
Attribute Precision• Precision for a database means lots of details—lots
of attributes about a given record,
• Precision for a record means a high level of numeric precision—that is, lots of digits, so does not apply to categorical data
• Example: recording income down to cents, rather than just dollars

Materials by Austin Troy © 2006
Fundamentals of GIS
Attribute Accuracy• Continuous (numeric) attributes are often treated
like geo-spatial data in terms of accuracy; these errors often arise from mis-measurement
• Conceptual Accuracy
• Conceptual Precision

Materials by Austin Troy © 2006
Fundamentals of GIS
Conceptual Precision• The accuracy of your classifications will depend on
the precision you are using.
• The less precise you need your classifications to be, the less likely there will be errors
• If just classifying as “land and water”, that is not very precise, and not likely to result in an error

Materials by Austin Troy © 2006
Fundamentals of GIS
Other measures of data quality• Logical consistency
• Completeness
• Data currency/timeliness
• Accessibility
• These apply to both attribute and positional data

Materials by Austin Troy © 2006
Fundamentals of GIS
Logical Consistency• Do data follow rules of logic?
• Attribute Example: is something classified as both water and as commercially zoned land?
• Geospatial example: Do lines intersect when they should not (eg. With power lines)? Do polygons not close on themselves

Materials by Austin Troy © 2006
Fundamentals of GIS
Completeness• Is a data layer complete or lacking in coverage?
• Examples: does a layer on roads leave out some roads? If so, does it do so systematically or randomly? Does a database of buildings in a city leave out some buildings?
• Examples where completeness is crucial: a database of houses used to notify neighbors when a noxious facility is proposed?

Materials by Austin Troy © 2006
Fundamentals of GIS
Completeness• Completeness also describes completeness in coding
of features.
• If two databases are linked (say one has attributes and the other has geometry) and one has features added without the other being updated, one will be incomplete and result in link inconsistencies
• This happens when several agencies each maintain different parts of a commonly used meta-database

Materials by Austin Troy © 2006
Fundamentals of GIS
Currency and Timeliness• Since some things change faster than others, the
importance of timeliness in data depends on what is being displayed

Materials by Austin Troy © 2006
Fundamentals of GIS
Currency and Timeliness

Materials by Austin Troy © 2006
Fundamentals of GIS
Currency and Timeliness
• Streets are another data set where currency is important; blue represents all the additional streets built between 1990 and 2000

Materials by Austin Troy © 2006
Fundamentals of GIS
Conflation• When one layer is better in one way and another is
better in another and you wish to get the best of both
• Way of reconciling best geometric and attribute features from two layers into a new one
• Very commonly used for case where one layer has better attribute accuracy or completeness and another has better geometric accuracy or resolution
• Also used where newer layer is produced for some theme but is has lower resolution than older one
Materials by Austin Troy © 2006
Fundamentals of GIS
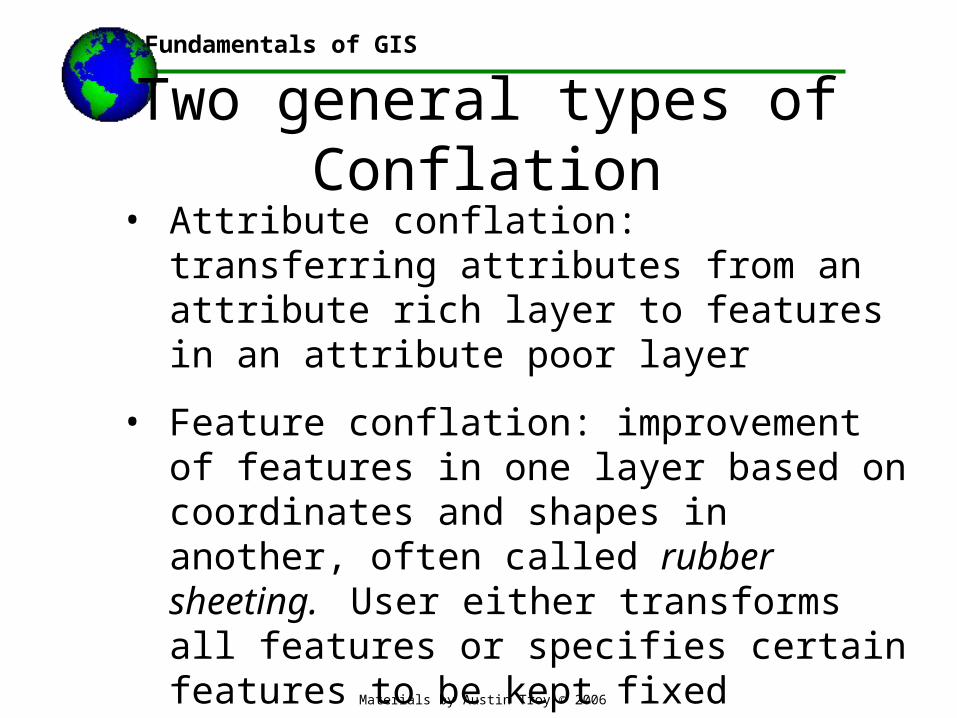
Two general types of Conflation• Attribute conflation: transferring attributes from
an attribute rich layer to features in an attribute poor layer
• Feature conflation: improvement of features in one layer based on coordinates and shapes in another, often called rubber sheeting. User either transforms all features or specifies certain features to be kept fixed

Materials by Austin Troy © 2006
Fundamentals of GIS
Conflation layers• More spatially accurate layer is referred to as the
base, coordinate or target layer
• Layer with more accurate attribution is referred to as the reference, or non-base layer
Materials by Austin Troy © 2006
Fundamentals of GIS
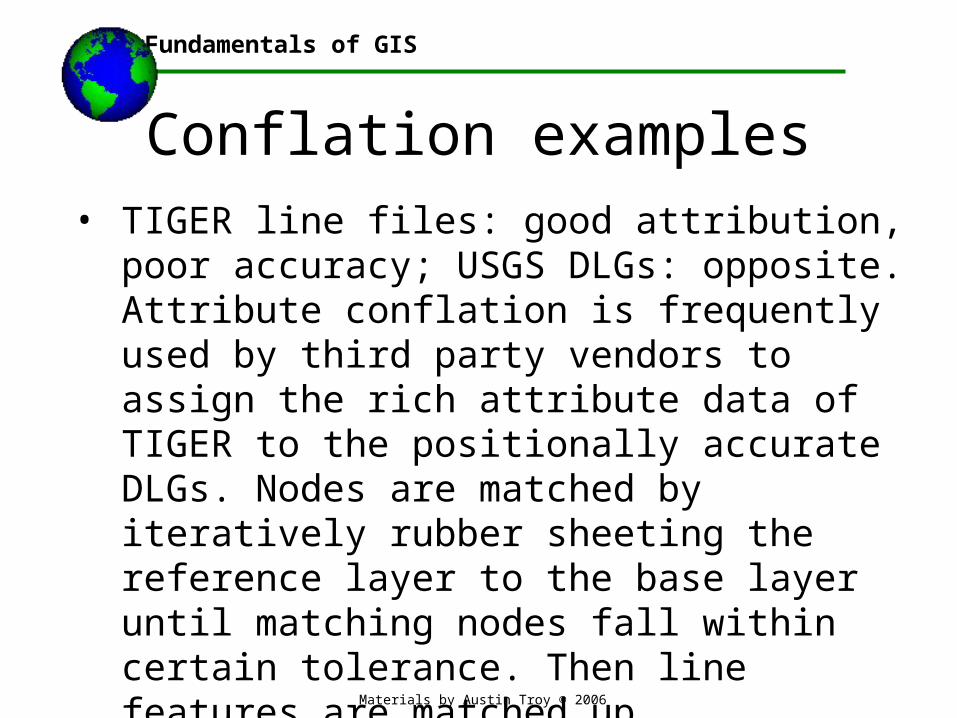
Conflation examples• TIGER line files: good attribution, poor accuracy;
USGS DLGs: opposite. Attribute conflation is frequently used by third party vendors to assign the rich attribute data of TIGER to the positionally accurate DLGs. Nodes are matched by iteratively rubber sheeting the reference layer to the base layer until matching nodes fall within certain tolerance. Then line features are matched up.

Materials by Austin Troy © 2006
Fundamentals of GIS
Conflation examples
Source: Stanley Dalal, GIS cafe

Materials by Austin Troy © 2006
Fundamentals of GIS
Documentation and Metadata•To avoid many of these errors, good documentation of source data is needed
•Metadata is data documentation, or “data about data”
•Ideally, the metadata describes the data according to federally recognized standards of accuracy
•Almost all state, local and federal agencies are required to provide metadata with geodata they make

Materials by Austin Troy © 2006
Fundamentals of GIS
Documentation and Metadata•The federal geographic data committee (FGDC) is a federal entity that developed a “Content Standard for Digital Geospatial Metadata” in 1998, which is a model for all spatial data users to follow
•Purpose is: “to provide a common set of terminology and definitions for the documentation of digital geospatial data.”
•All federal agencies are required to use these standards

Materials by Austin Troy © 2006
Fundamentals of GIS
Documentation and Metadata• Some roles of metadata
1. Information retrieval, cataloguing, querying and searching for data electronically.
2. Describing fitness for use and documenting the usability and quality of data.
3. Describing how to transfer, access or process data
4. Documenting all relevant characteristics of data needed to use it

Materials by Austin Troy © 2006
Fundamentals of GIS
Documentation and Metadata•Critical components usually break down into:
•Dataset identification, overview
•Data quality
•Spatial reference information
•Data definition
•Administrative information
•Meta metadata
Materials by Austin Troy © 2006
Fundamentals of GIS
Documentation and Metadata•Data identification, overview and administrative info:
•General info: name and brief ID of dataset and owner organization, geographic domain, general description/ summary of content, data model used to represent spatial features, intent of production, language used , reference to more detailed documents, if applicable
•Constraints on access and use
•This is usually where info on currency is found

Materials by Austin Troy © 2006
Fundamentals of GIS
Documentation and Metadata•Spatial reference should include:
• horizontal coordinate system (e.g. State Plane)
•Includes projection used, scale factors, longitude of central meridian, latitude of projection origin, distance units
•Geodetic model (e.g. NAD 83), ellipsoid, semi-major axis

Materials by Austin Troy © 2006
Fundamentals of GIS
Documentation and Metadata•Data definition, also known as “Entity and Attribute Information,” should include:
•Entity types (e.g. polygon, raster)
•Information about each attribute, including label, definition, domain of values
•Sometimes will include a data dictionary, or description of attribute codes, while sometimes it will reference a documents with those codes if they are too long and complex

Materials by Austin Troy © 2006
Fundamentals of GIS
Documentation and Metadata•Data distribution info usually includes:
•Name, address, phone, email of contact person and organization
•Liability information
•Ordering information, including online and ordering by other media; usually includes fees

Materials by Austin Troy © 2006
Fundamentals of GIS
Documentation and Metadata•Metadata reference, or meta-metadata
•This is data about the metadata
•Contains information on
•When metadata updated
•Who made it
•What standard was used
•What constraints apply to the metadata

Materials by Austin Troy © 2006
Fundamentals of GIS
Metadata in Arc GIS•Arc GIS allows you to display, import and export metadata in and to a variety of Metadata formats:
•
•It defaults to FGDC ESRI which looks like:

Materials by Austin Troy © 2006
Fundamentals of GIS
Metadata in Arc GIS•XML is the most flexible form because its tag structure allows it to be used in programming; tags can be called as variables or can be created through form interfaces; allows for compatibility across platforms and programs

Materials by Austin Troy © 2006
Fundamentals of GIS
Metadata in Arc GIS•In the past, complete metadata was only available as text; you had to create most embedded metadata tags yourself. Today many state and nationwide datasets come with complete embedded metadata including full attribute codes
•E.g. NEDs, NLCD, all VCGI data

Materials by Austin Troy © 2006
Fundamentals of GIS
Metadata in Arc GIS•Can edit, import, edit and export metadata in multiple formats allowing helping with proper sharing of data.