fundamentals of finance - corporate cash flows exercise...
TRANSCRIPT

Corporate cash flows – Exercise 1
Exercise 1
1
2
3
4
5
6
7
8
9
10
11
12
13
14
15
16
17
18
19
A B C D E F G H I
Year
Current assets
Cash
Other current assets
Fixed assets
Current liabilities
Long-term debt
Retained earnings
Stockholders’ equity
Net sales
Cost of goods sold
Depreciation
Earnings before interest and taxes
Interest paid
Taxes
Net income
2016 2017
200 200
92 101
1600 1650
59 65
850 880
183 206
800 800
1010
650
200
160
60
25
75
Jukka Perttunen Fundamentals of finance
Corporate cash flows – Exercise 1
Exercise 1
21
22
23
24
25
26
27
28
29
30
31
32
33
34
35
A B C D E F G H I
Year
Growth rate
Net sales
Cost of goods sold
Depreciation
Earnings before interest and taxes
Capital expenditures
Cash
Other current assets
Current liabilities
Net working capital
Change in Net working capital
2017 2018 2019 2020 2021 2022 2023
0.10 0.10 0.05 0.05 0.05 0.05
1010
650
200
160
200
101
65
Jukka Perttunen Fundamentals of finance

Corporate cash flows – Exercise 1
Exercise 1
37
38
39
40
41
42
43
44
45
46
47
48
49
50
51
A B C D E F G H I
Year
Unlevered free cash flow
Growth rate
Discount rate
Value of constant growth cash flows
Cash flows under valuation
Discount factor
Present value
Value of assets
Value of equity
2017 2018 2019 2020 2021 2022 2023
0.08
Jukka Perttunen Fundamentals of finance

Corporate cash flows – Exercise 1
Exercise 1
21
22
23
24
25
26
27
28
29
30
31
32
33
34
35
A B C D E F G H I
Year
Growth rate
Net sales
Cost of goods sold
Depreciation
Earnings before interest and taxes
Capital expenditures
Cash
Other current assets
Current liabilities
Net working capital
Change in Net working capital
2017 2018 2019 2020 2021 2022 2023
0.10 0.10 0.05 0.05 0.05 0.05
1010
650
200
160
200
101
65
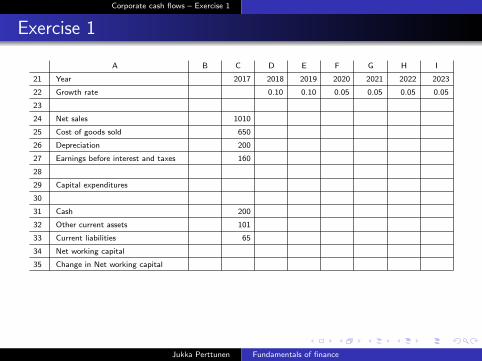
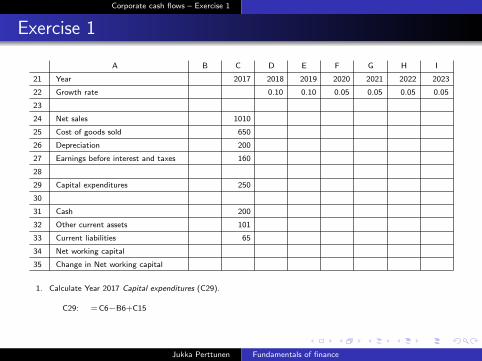
1. Calculate Year 2017 Capital expenditures (C29).
C29: = C6−B6+C15
250
Jukka Perttunen Fundamentals of finance

Corporate cash flows – Exercise 1
Exercise 1
21
22
23
24
25
26
27
28
29
30
31
32
33
34
35
A B C D E F G H I
Year
Growth rate
Net sales
Cost of goods sold
Depreciation
Earnings before interest and taxes
Capital expenditures
Cash
Other current assets
Current liabilities
Net working capital
Change in Net working capital
2017 2018 2019 2020 2021 2022 2023
0.10 0.10 0.05 0.05 0.05 0.05
1010
650
200
160
200
101
65
1. Calculate Year 2017 Capital expenditures (C29).
C29: = C6−B6+C15
250
Jukka Perttunen Fundamentals of finance

Corporate cash flows – Exercise 1
Exercise 1
21
22
23
24
25
26
27
28
29
30
31
32
33
34
35
A B C D E F G H I
Year
Growth rate
Net sales
Cost of goods sold
Depreciation
Earnings before interest and taxes
Capital expenditures
Cash
Other current assets
Current liabilities
Net working capital
Change in Net working capital
2017 2018 2019 2020 2021 2022 2023
0.10 0.10 0.05 0.05 0.05 0.05
1010
650
200
160
250
200
101
65
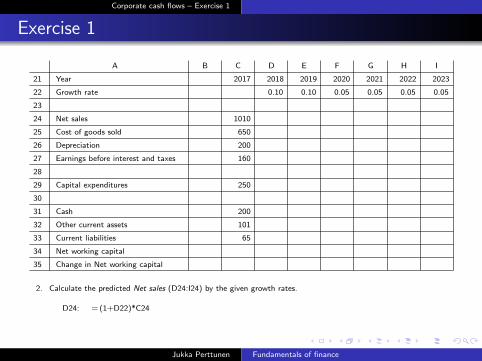
2. Calculate the predicted Net sales (D24:I24) by the given growth rates.
D24: = (1+D22)*C24
1111
Copy D24 to E24:I24.
1222 1283 1347 1415 1485
Jukka Perttunen Fundamentals of finance
Corporate cash flows – Exercise 1
Exercise 1
21
22
23
24
25
26
27
28
29
30
31
32
33
34
35
A B C D E F G H I
Year
Growth rate
Net sales
Cost of goods sold
Depreciation
Earnings before interest and taxes
Capital expenditures
Cash
Other current assets
Current liabilities
Net working capital
Change in Net working capital
2017 2018 2019 2020 2021 2022 2023
0.10 0.10 0.05 0.05 0.05 0.05
1010
650
200
160
250
200
101
65
2. Calculate the predicted Net sales (D24:I24) by the given growth rates.
D24: = (1+D22)*C24
1111
Copy D24 to E24:I24.
1222 1283 1347 1415 1485
Jukka Perttunen Fundamentals of finance
Corporate cash flows – Exercise 1
Exercise 1
21
22
23
24
25
26
27
28
29
30
31
32
33
34
35
A B C D E F G H I
Year
Growth rate
Net sales
Cost of goods sold
Depreciation
Earnings before interest and taxes
Capital expenditures
Cash
Other current assets
Current liabilities
Net working capital
Change in Net working capital
2017 2018 2019 2020 2021 2022 2023
0.10 0.10 0.05 0.05 0.05 0.05
1010
650
200
160
250
200
101
65
1111 1222 1283 1347 1415 1485
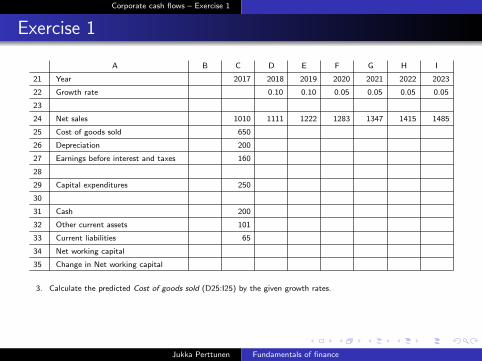
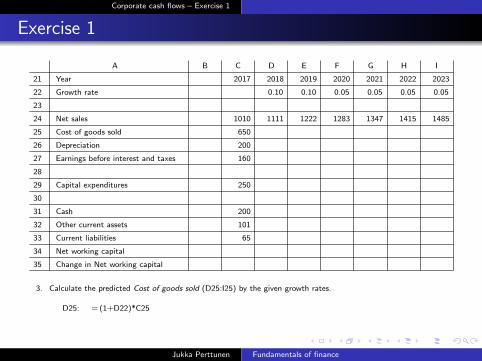
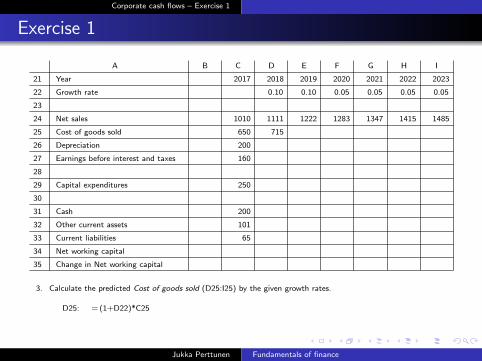
3. Calculate the predicted Cost of goods sold (D25:I25) by the given growth rates.
D25: = (1+D22)*C25
715
Copy D25 to E25:I25.
787 826 867 910 956
Jukka Perttunen Fundamentals of finance
Corporate cash flows – Exercise 1
Exercise 1
21
22
23
24
25
26
27
28
29
30
31
32
33
34
35
A B C D E F G H I
Year
Growth rate
Net sales
Cost of goods sold
Depreciation
Earnings before interest and taxes
Capital expenditures
Cash
Other current assets
Current liabilities
Net working capital
Change in Net working capital
2017 2018 2019 2020 2021 2022 2023
0.10 0.10 0.05 0.05 0.05 0.05
1010
650
200
160
250
200
101
65
1111 1222 1283 1347 1415 1485
3. Calculate the predicted Cost of goods sold (D25:I25) by the given growth rates.
D25: = (1+D22)*C25
715
Copy D25 to E25:I25.
787 826 867 910 956
Jukka Perttunen Fundamentals of finance

Corporate cash flows – Exercise 1
Exercise 1
21
22
23
24
25
26
27
28
29
30
31
32
33
34
35
A B C D E F G H I
Year
Growth rate
Net sales
Cost of goods sold
Depreciation
Earnings before interest and taxes
Capital expenditures
Cash
Other current assets
Current liabilities
Net working capital
Change in Net working capital
2017 2018 2019 2020 2021 2022 2023
0.10 0.10 0.05 0.05 0.05 0.05
1010
650
200
160
250
200
101
65
1111 1222 1283 1347 1415 1485
715 787 826 867 910 956
4. Calculate the predicted Depreciation (D26:I26) by the given growth rates.
D26: = (1+D22)*C26
220
Copy D26 to E26:I26.
242 254 267 280 294
Jukka Perttunen Fundamentals of finance
Corporate cash flows – Exercise 1
Exercise 1
21
22
23
24
25
26
27
28
29
30
31
32
33
34
35
A B C D E F G H I
Year
Growth rate
Net sales
Cost of goods sold
Depreciation
Earnings before interest and taxes
Capital expenditures
Cash
Other current assets
Current liabilities
Net working capital
Change in Net working capital
2017 2018 2019 2020 2021 2022 2023
0.10 0.10 0.05 0.05 0.05 0.05
1010
650
200
160
250
200
101
65
1111 1222 1283 1347 1415 1485
715 787 826 867 910 956
220 242 254 267 280 294
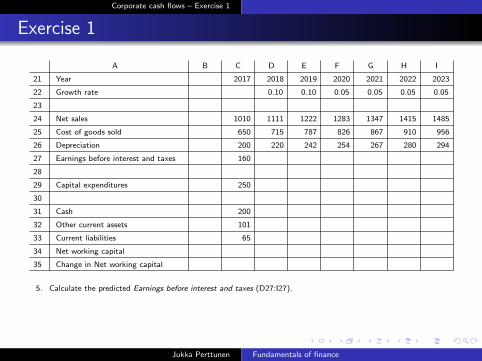
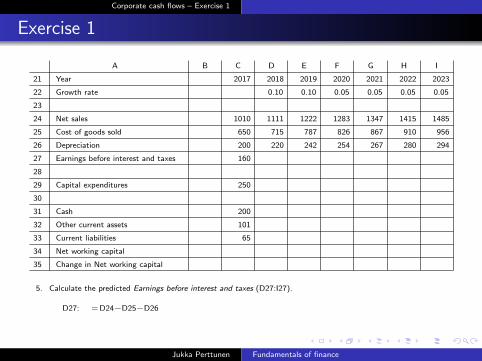
5. Calculate the predicted Earnings before interest and taxes (D27:I27).
D27: = D24−D25−D26
176
Copy D27 to E27:I27.
194 203 213 224 235
Jukka Perttunen Fundamentals of finance
Corporate cash flows – Exercise 1
Exercise 1
21
22
23
24
25
26
27
28
29
30
31
32
33
34
35
A B C D E F G H I
Year
Growth rate
Net sales
Cost of goods sold
Depreciation
Earnings before interest and taxes
Capital expenditures
Cash
Other current assets
Current liabilities
Net working capital
Change in Net working capital
2017 2018 2019 2020 2021 2022 2023
0.10 0.10 0.05 0.05 0.05 0.05
1010
650
200
160
250
200
101
65
1111 1222 1283 1347 1415 1485
715 787 826 867 910 956
220 242 254 267 280 294
5. Calculate the predicted Earnings before interest and taxes (D27:I27).
D27: = D24−D25−D26
176
Copy D27 to E27:I27.
194 203 213 224 235
Jukka Perttunen Fundamentals of finance

Corporate cash flows – Exercise 1
Exercise 1
21
22
23
24
25
26
27
28
29
30
31
32
33
34
35
A B C D E F G H I
Year
Growth rate
Net sales
Cost of goods sold
Depreciation
Earnings before interest and taxes
Capital expenditures
Cash
Other current assets
Current liabilities
Net working capital
Change in Net working capital
2017 2018 2019 2020 2021 2022 2023
0.10 0.10 0.05 0.05 0.05 0.05
1010
650
200
160
250
200
101
65
1111 1222 1283 1347 1415 1485
715 787 826 867 910 956
220 242 254 267 280 294
176 194 203 213 224 235
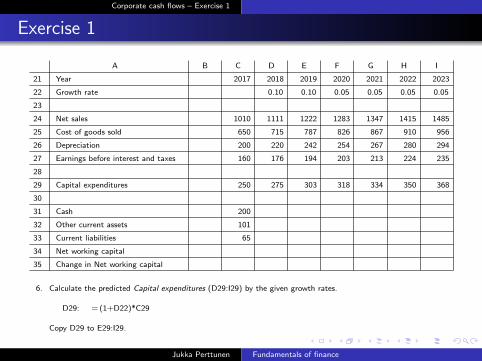
6. Calculate the predicted Capital expenditures (D29:I29) by the given growth rates.
D29: = (1+D22)*C29
275
Copy D29 to E29:I29.
303 318 334 350 368
Jukka Perttunen Fundamentals of finance

Corporate cash flows – Exercise 1
Exercise 1
21
22
23
24
25
26
27
28
29
30
31
32
33
34
35
A B C D E F G H I
Year
Growth rate
Net sales
Cost of goods sold
Depreciation
Earnings before interest and taxes
Capital expenditures
Cash
Other current assets
Current liabilities
Net working capital
Change in Net working capital
2017 2018 2019 2020 2021 2022 2023
0.10 0.10 0.05 0.05 0.05 0.05
1010
650
200
160
250
200
101
65
1111 1222 1283 1347 1415 1485
715 787 826 867 910 956
220 242 254 267 280 294
176 194 203 213 224 235
6. Calculate the predicted Capital expenditures (D29:I29) by the given growth rates.
D29: = (1+D22)*C29
275
Copy D29 to E29:I29.
303 318 334 350 368
Jukka Perttunen Fundamentals of finance

Corporate cash flows – Exercise 1
Exercise 1
21
22
23
24
25
26
27
28
29
30
31
32
33
34
35
A B C D E F G H I
Year
Growth rate
Net sales
Cost of goods sold
Depreciation
Earnings before interest and taxes
Capital expenditures
Cash
Other current assets
Current liabilities
Net working capital
Change in Net working capital
2017 2018 2019 2020 2021 2022 2023
0.10 0.10 0.05 0.05 0.05 0.05
1010
650
200
160
250
200
101
65
1111 1222 1283 1347 1415 1485
715 787 826 867 910 956
220 242 254 267 280 294
176 194 203 213 224 235
275 303 318 334 350 368
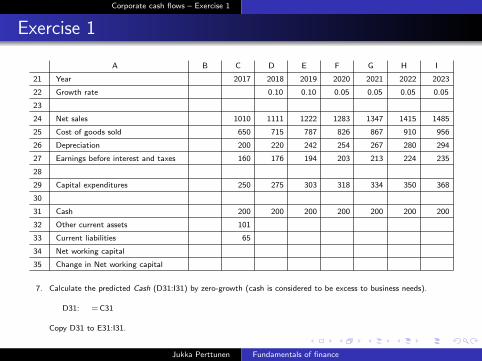
7. Calculate the predicted Cash (D31:I31) by zero-growth (cash is considered to be excess to business needs).
D31: = C31
200
Copy D31 to E31:I31.
200 200 200 200 200
Jukka Perttunen Fundamentals of finance

Corporate cash flows – Exercise 1
Exercise 1
21
22
23
24
25
26
27
28
29
30
31
32
33
34
35
A B C D E F G H I
Year
Growth rate
Net sales
Cost of goods sold
Depreciation
Earnings before interest and taxes
Capital expenditures
Cash
Other current assets
Current liabilities
Net working capital
Change in Net working capital
2017 2018 2019 2020 2021 2022 2023
0.10 0.10 0.05 0.05 0.05 0.05
1010
650
200
160
250
200
101
65
1111 1222 1283 1347 1415 1485
715 787 826 867 910 956
220 242 254 267 280 294
176 194 203 213 224 235
275 303 318 334 350 368
7. Calculate the predicted Cash (D31:I31) by zero-growth (cash is considered to be excess to business needs).
D31: = C31
200
Copy D31 to E31:I31.
200 200 200 200 200
Jukka Perttunen Fundamentals of finance

Corporate cash flows – Exercise 1
Exercise 1
21
22
23
24
25
26
27
28
29
30
31
32
33
34
35
A B C D E F G H I
Year
Growth rate
Net sales
Cost of goods sold
Depreciation
Earnings before interest and taxes
Capital expenditures
Cash
Other current assets
Current liabilities
Net working capital
Change in Net working capital
2017 2018 2019 2020 2021 2022 2023
0.10 0.10 0.05 0.05 0.05 0.05
1010
650
200
160
250
200
101
65
1111 1222 1283 1347 1415 1485
715 787 826 867 910 956
220 242 254 267 280 294
176 194 203 213 224 235
275 303 318 334 350 368
200 200 200 200 200 200
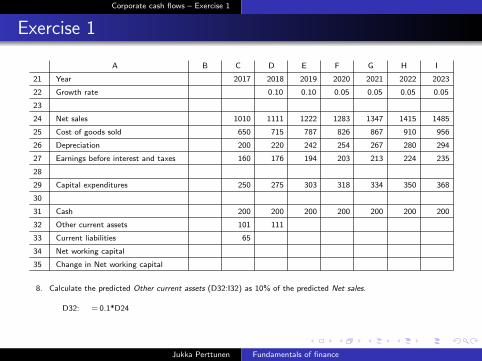
8. Calculate the predicted Other current assets (D32:I32) as 10% of the predicted Net sales.
D32: = 0.1*D24
111
Copy D32 to E32:I32.
122 128 135 141 149
Jukka Perttunen Fundamentals of finance

Corporate cash flows – Exercise 1
Exercise 1
21
22
23
24
25
26
27
28
29
30
31
32
33
34
35
A B C D E F G H I
Year
Growth rate
Net sales
Cost of goods sold
Depreciation
Earnings before interest and taxes
Capital expenditures
Cash
Other current assets
Current liabilities
Net working capital
Change in Net working capital
2017 2018 2019 2020 2021 2022 2023
0.10 0.10 0.05 0.05 0.05 0.05
1010
650
200
160
250
200
101
65
1111 1222 1283 1347 1415 1485
715 787 826 867 910 956
220 242 254 267 280 294
176 194 203 213 224 235
275 303 318 334 350 368
200 200 200 200 200 200
8. Calculate the predicted Other current assets (D32:I32) as 10% of the predicted Net sales.
D32: = 0.1*D24
111
Copy D32 to E32:I32.
122 128 135 141 149
Jukka Perttunen Fundamentals of finance
Corporate cash flows – Exercise 1
Exercise 1
21
22
23
24
25
26
27
28
29
30
31
32
33
34
35
A B C D E F G H I
Year
Growth rate
Net sales
Cost of goods sold
Depreciation
Earnings before interest and taxes
Capital expenditures
Cash
Other current assets
Current liabilities
Net working capital
Change in Net working capital
2017 2018 2019 2020 2021 2022 2023
0.10 0.10 0.05 0.05 0.05 0.05
1010
650
200
160
250
200
101
65
1111 1222 1283 1347 1415 1485
715 787 826 867 910 956
220 242 254 267 280 294
176 194 203 213 224 235
275 303 318 334 350 368
200 200 200 200 200 200
111 122 128 135 141 149
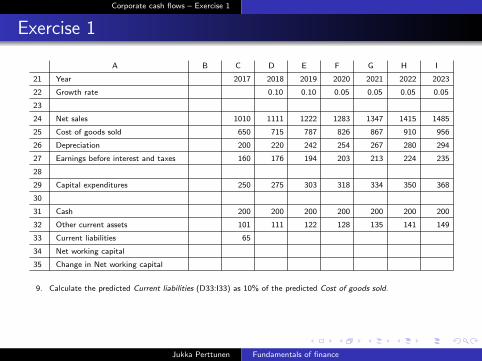
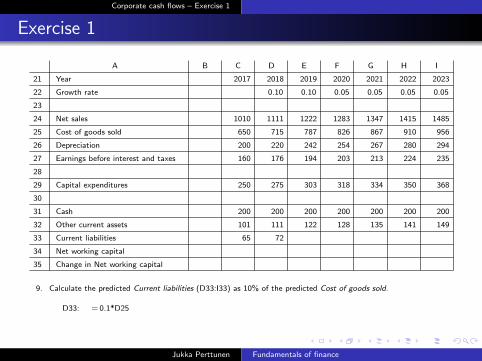
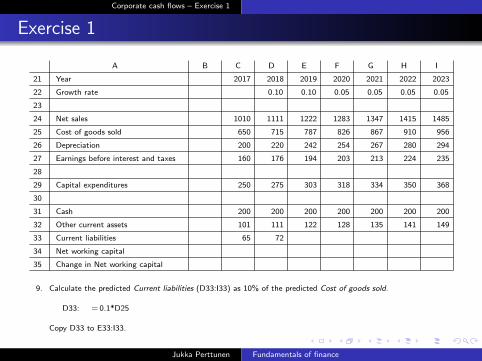
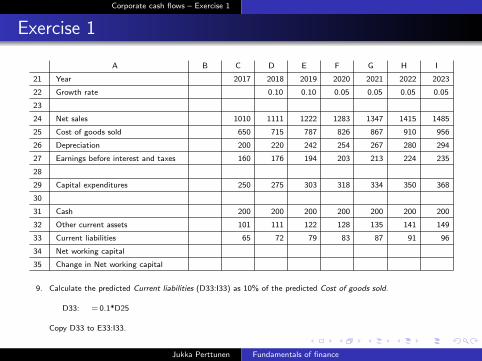
9. Calculate the predicted Current liabilities (D33:I33) as 10% of the predicted Cost of goods sold.
D33: = 0.1*D25
72
Copy D33 to E33:I33.
79 83 87 91 96
Jukka Perttunen Fundamentals of finance

Corporate cash flows – Exercise 1
Exercise 1
21
22
23
24
25
26
27
28
29
30
31
32
33
34
35
A B C D E F G H I
Year
Growth rate
Net sales
Cost of goods sold
Depreciation
Earnings before interest and taxes
Capital expenditures
Cash
Other current assets
Current liabilities
Net working capital
Change in Net working capital
2017 2018 2019 2020 2021 2022 2023
0.10 0.10 0.05 0.05 0.05 0.05
1010
650
200
160
250
200
101
65
1111 1222 1283 1347 1415 1485
715 787 826 867 910 956
220 242 254 267 280 294
176 194 203 213 224 235
275 303 318 334 350 368
200 200 200 200 200 200
111 122 128 135 141 149
9. Calculate the predicted Current liabilities (D33:I33) as 10% of the predicted Cost of goods sold.
D33: = 0.1*D25
72
Copy D33 to E33:I33.
79 83 87 91 96
Jukka Perttunen Fundamentals of finance
Corporate cash flows – Exercise 1
Exercise 1
21
22
23
24
25
26
27
28
29
30
31
32
33
34
35
A B C D E F G H I
Year
Growth rate
Net sales
Cost of goods sold
Depreciation
Earnings before interest and taxes
Capital expenditures
Cash
Other current assets
Current liabilities
Net working capital
Change in Net working capital
2017 2018 2019 2020 2021 2022 2023
0.10 0.10 0.05 0.05 0.05 0.05
1010
650
200
160
250
200
101
65
1111 1222 1283 1347 1415 1485
715 787 826 867 910 956
220 242 254 267 280 294
176 194 203 213 224 235
275 303 318 334 350 368
200 200 200 200 200 200
111 122 128 135 141 149
72 79 83 87 91 96
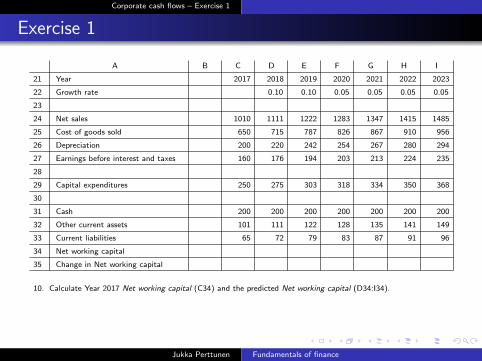
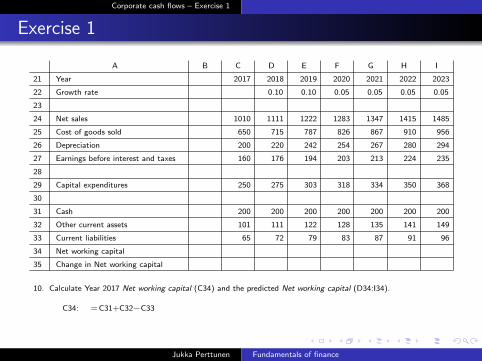
10. Calculate Year 2017 Net working capital (C34) and the predicted Net working capital (D34:I34).
C34: = C31+C32−C33
236
Copy C34 to D34:I34.
240 244 246 248 250 253
Jukka Perttunen Fundamentals of finance
Corporate cash flows – Exercise 1
Exercise 1
21
22
23
24
25
26
27
28
29
30
31
32
33
34
35
A B C D E F G H I
Year
Growth rate
Net sales
Cost of goods sold
Depreciation
Earnings before interest and taxes
Capital expenditures
Cash
Other current assets
Current liabilities
Net working capital
Change in Net working capital
2017 2018 2019 2020 2021 2022 2023
0.10 0.10 0.05 0.05 0.05 0.05
1010
650
200
160
250
200
101
65
1111 1222 1283 1347 1415 1485
715 787 826 867 910 956
220 242 254 267 280 294
176 194 203 213 224 235
275 303 318 334 350 368
200 200 200 200 200 200
111 122 128 135 141 149
72 79 83 87 91 96
10. Calculate Year 2017 Net working capital (C34) and the predicted Net working capital (D34:I34).
C34: = C31+C32−C33
236
Copy C34 to D34:I34.
240 244 246 248 250 253
Jukka Perttunen Fundamentals of finance

Corporate cash flows – Exercise 1
Exercise 1
21
22
23
24
25
26
27
28
29
30
31
32
33
34
35
A B C D E F G H I
Year
Growth rate
Net sales
Cost of goods sold
Depreciation
Earnings before interest and taxes
Capital expenditures
Cash
Other current assets
Current liabilities
Net working capital
Change in Net working capital
2017 2018 2019 2020 2021 2022 2023
0.10 0.10 0.05 0.05 0.05 0.05
1010
650
200
160
250
200
101
65
1111 1222 1283 1347 1415 1485
715 787 826 867 910 956
220 242 254 267 280 294
176 194 203 213 224 235
275 303 318 334 350 368
200 200 200 200 200 200
111 122 128 135 141 149
72 79 83 87 91 96
236 240 244 246 248 250 253
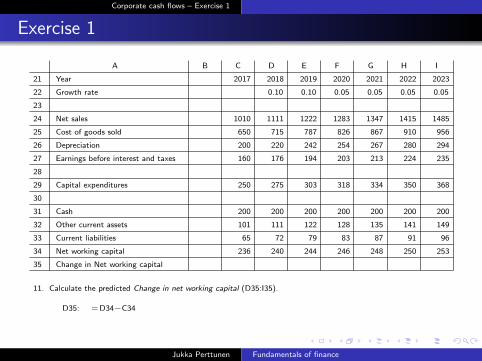
11. Calculate the predicted Change in net working capital (D35:I35).
D35: = D34−C34
4
Copy D35 to E35:I35.
4 2 2 2 3
Jukka Perttunen Fundamentals of finance
Corporate cash flows – Exercise 1
Exercise 1
21
22
23
24
25
26
27
28
29
30
31
32
33
34
35
A B C D E F G H I
Year
Growth rate
Net sales
Cost of goods sold
Depreciation
Earnings before interest and taxes
Capital expenditures
Cash
Other current assets
Current liabilities
Net working capital
Change in Net working capital
2017 2018 2019 2020 2021 2022 2023
0.10 0.10 0.05 0.05 0.05 0.05
1010
650
200
160
250
200
101
65
1111 1222 1283 1347 1415 1485
715 787 826 867 910 956
220 242 254 267 280 294
176 194 203 213 224 235
275 303 318 334 350 368
200 200 200 200 200 200
111 122 128 135 141 149
72 79 83 87 91 96
236 240 244 246 248 250 253
11. Calculate the predicted Change in net working capital (D35:I35).
D35: = D34−C34
4
Copy D35 to E35:I35.
4 2 2 2 3
Jukka Perttunen Fundamentals of finance

Corporate cash flows – Exercise 1
Exercise 1
37
38
39
40
41
42
43
44
45
46
47
48
49
50
51
A B C D E F G H I
Year
Unlevered free cash flow
Growth rate
Discount rate
Value of constant growth cash flows
Cash flows under valuation
Discount factor
Present value
Value of assets
Value of equity
2017 2018 2019 2020 2021 2022 2023
0.08
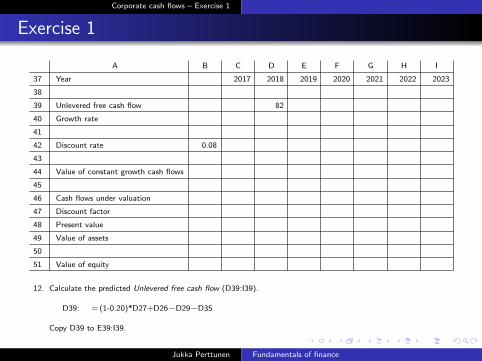
12. Calculate the predicted Unlevered free cash flow (D39:I39).
D39: = (1-0.20)*D27+D26−D29−D35
82
Copy D39 to E39:I39.
90 97 102 107 112
Jukka Perttunen Fundamentals of finance

Corporate cash flows – Exercise 1
Exercise 1
37
38
39
40
41
42
43
44
45
46
47
48
49
50
51
A B C D E F G H I
Year
Unlevered free cash flow
Growth rate
Discount rate
Value of constant growth cash flows
Cash flows under valuation
Discount factor
Present value
Value of assets
Value of equity
2017 2018 2019 2020 2021 2022 2023
0.08
12. Calculate the predicted Unlevered free cash flow (D39:I39).
D39: = (1-0.20)*D27+D26−D29−D35
82
Copy D39 to E39:I39.
90 97 102 107 112
Jukka Perttunen Fundamentals of finance

Corporate cash flows – Exercise 1
Exercise 1
37
38
39
40
41
42
43
44
45
46
47
48
49
50
51
A B C D E F G H I
Year
Unlevered free cash flow
Growth rate
Discount rate
Value of constant growth cash flows
Cash flows under valuation
Discount factor
Present value
Value of assets
Value of equity
2017 2018 2019 2020 2021 2022 2023
0.08
82 90 97 102 107 112
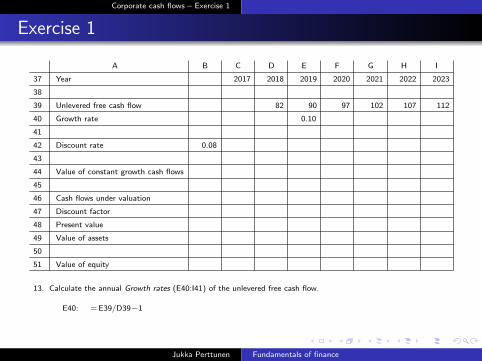
13. Calculate the annual Growth rates (E40:I41) of the unlevered free cash flow.
E40: = E39/D39−1
0.10
Copy E40 to F40:I40.
0.07 0.05 0.05 0.05
Jukka Perttunen Fundamentals of finance

Corporate cash flows – Exercise 1
Exercise 1
37
38
39
40
41
42
43
44
45
46
47
48
49
50
51
A B C D E F G H I
Year
Unlevered free cash flow
Growth rate
Discount rate
Value of constant growth cash flows
Cash flows under valuation
Discount factor
Present value
Value of assets
Value of equity
2017 2018 2019 2020 2021 2022 2023
0.08
82 90 97 102 107 112
13. Calculate the annual Growth rates (E40:I41) of the unlevered free cash flow.
E40: = E39/D39−1
0.10
Copy E40 to F40:I40.
0.07 0.05 0.05 0.05
Jukka Perttunen Fundamentals of finance

Corporate cash flows – Exercise 1
Exercise 1
37
38
39
40
41
42
43
44
45
46
47
48
49
50
51
A B C D E F G H I
Year
Unlevered free cash flow
Growth rate
Discount rate
Value of constant growth cash flows
Cash flows under valuation
Discount factor
Present value
Value of assets
Value of equity
2017 2018 2019 2020 2021 2022 2023
0.08
82 90 97 102 107 112
0.10 0.07 0.05 0.05 0.05
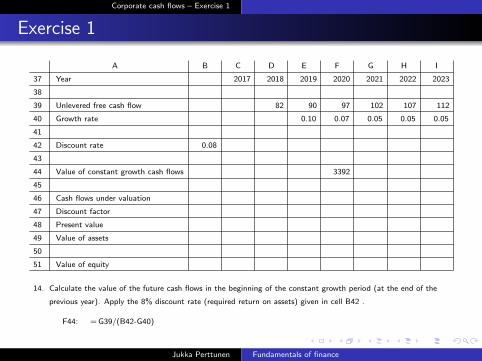
14. Calculate the value of the future cash flows in the beginning of the constant growth period (at the end of the
previous year). Apply the 8% discount rate (required return on assets) given in cell B42 .
F44: = G39/(B42-G40)
3392
Jukka Perttunen Fundamentals of finance

Corporate cash flows – Exercise 1
Exercise 1
37
38
39
40
41
42
43
44
45
46
47
48
49
50
51
A B C D E F G H I
Year
Unlevered free cash flow
Growth rate
Discount rate
Value of constant growth cash flows
Cash flows under valuation
Discount factor
Present value
Value of assets
Value of equity
2017 2018 2019 2020 2021 2022 2023
0.08
82 90 97 102 107 112
0.10 0.07 0.05 0.05 0.05
14. Calculate the value of the future cash flows in the beginning of the constant growth period (at the end of the
previous year). Apply the 8% discount rate (required return on assets) given in cell B42 .
F44: = G39/(B42-G40)
3392
Jukka Perttunen Fundamentals of finance

Corporate cash flows – Exercise 1
Exercise 1
37
38
39
40
41
42
43
44
45
46
47
48
49
50
51
A B C D E F G H I
Year
Unlevered free cash flow
Growth rate
Discount rate
Value of constant growth cash flows
Cash flows under valuation
Discount factor
Present value
Value of assets
Value of equity
2017 2018 2019 2020 2021 2022 2023
0.08
82 90 97 102 107 112
0.10 0.07 0.05 0.05 0.05
3392
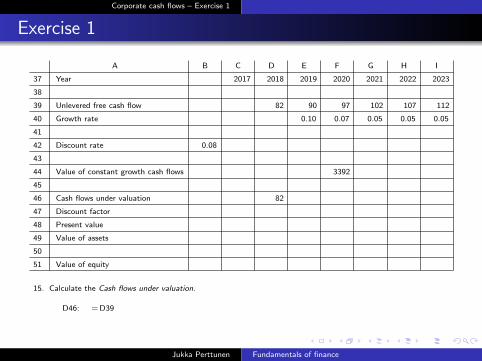
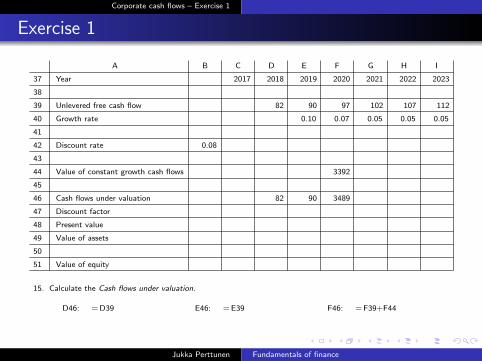
15. Calculate the Cash flows under valuation.
D46: = D39
82
E46: = E39
90
F46: = F39+F44
3489
Jukka Perttunen Fundamentals of finance

Corporate cash flows – Exercise 1
Exercise 1
37
38
39
40
41
42
43
44
45
46
47
48
49
50
51
A B C D E F G H I
Year
Unlevered free cash flow
Growth rate
Discount rate
Value of constant growth cash flows
Cash flows under valuation
Discount factor
Present value
Value of assets
Value of equity
2017 2018 2019 2020 2021 2022 2023
0.08
82 90 97 102 107 112
0.10 0.07 0.05 0.05 0.05
3392
15. Calculate the Cash flows under valuation.
D46: = D39
82
E46: = E39
90
F46: = F39+F44
3489
Jukka Perttunen Fundamentals of finance

Corporate cash flows – Exercise 1
Exercise 1
37
38
39
40
41
42
43
44
45
46
47
48
49
50
51
A B C D E F G H I
Year
Unlevered free cash flow
Growth rate
Discount rate
Value of constant growth cash flows
Cash flows under valuation
Discount factor
Present value
Value of assets
Value of equity
2017 2018 2019 2020 2021 2022 2023
0.08
82 90 97 102 107 112
0.10 0.07 0.05 0.05 0.05
3392
82 90 3489
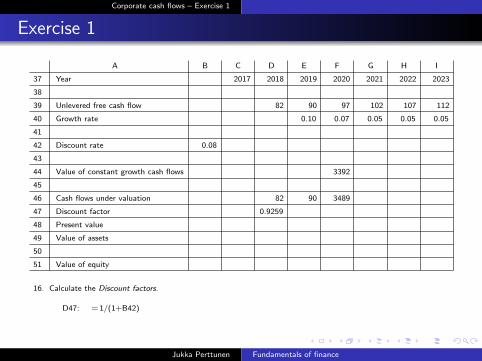
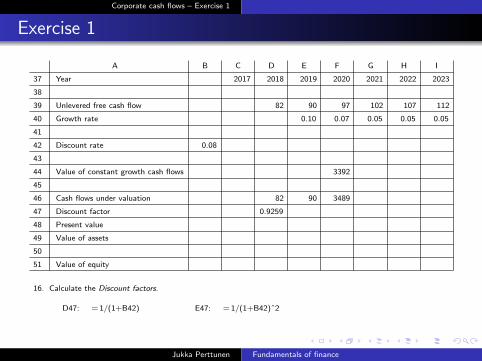
16. Calculate the Discount factors.
D47: = 1/(1+B42)
0.9259
E47: = 1/(1+B42)ˆ2
0.8573
F47: = 1/(1+B42)ˆ3
0.7938
Jukka Perttunen Fundamentals of finance

Corporate cash flows – Exercise 1
Exercise 1
37
38
39
40
41
42
43
44
45
46
47
48
49
50
51
A B C D E F G H I
Year
Unlevered free cash flow
Growth rate
Discount rate
Value of constant growth cash flows
Cash flows under valuation
Discount factor
Present value
Value of assets
Value of equity
2017 2018 2019 2020 2021 2022 2023
0.08
82 90 97 102 107 112
0.10 0.07 0.05 0.05 0.05
3392
82 90 3489
16. Calculate the Discount factors.
D47: = 1/(1+B42)
0.9259
E47: = 1/(1+B42)ˆ2
0.8573
F47: = 1/(1+B42)ˆ3
0.7938
Jukka Perttunen Fundamentals of finance

Corporate cash flows – Exercise 1
Exercise 1
37
38
39
40
41
42
43
44
45
46
47
48
49
50
51
A B C D E F G H I
Year
Unlevered free cash flow
Growth rate
Discount rate
Value of constant growth cash flows
Cash flows under valuation
Discount factor
Present value
Value of assets
Value of equity
2017 2018 2019 2020 2021 2022 2023
0.08
82 90 97 102 107 112
0.10 0.07 0.05 0.05 0.05
3392
82 90 3489
0.9259 0.8573 0.7938
17. Calculate the Present values of the cash flows under valuation.
D48: = D47*D46
76
E48: = E47*E46
78
F48: = F47*F46
2770
Jukka Perttunen Fundamentals of finance
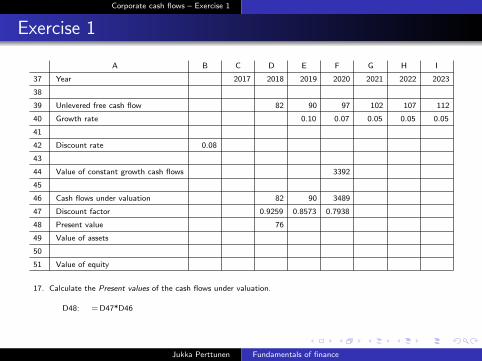
Corporate cash flows – Exercise 1
Exercise 1
37
38
39
40
41
42
43
44
45
46
47
48
49
50
51
A B C D E F G H I
Year
Unlevered free cash flow
Growth rate
Discount rate
Value of constant growth cash flows
Cash flows under valuation
Discount factor
Present value
Value of assets
Value of equity
2017 2018 2019 2020 2021 2022 2023
0.08
82 90 97 102 107 112
0.10 0.07 0.05 0.05 0.05
3392
82 90 3489
0.9259 0.8573 0.7938
17. Calculate the Present values of the cash flows under valuation.
D48: = D47*D46
76
E48: = E47*E46
78
F48: = F47*F46
2770
Jukka Perttunen Fundamentals of finance
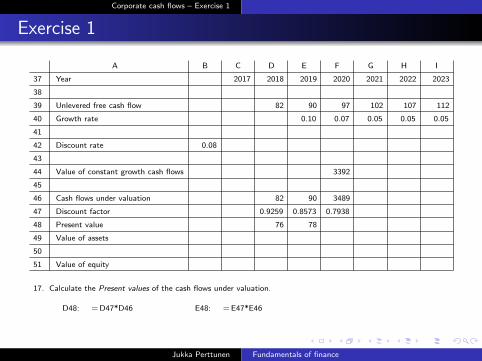
Corporate cash flows – Exercise 1
Exercise 1
37
38
39
40
41
42
43
44
45
46
47
48
49
50
51
A B C D E F G H I
Year
Unlevered free cash flow
Growth rate
Discount rate
Value of constant growth cash flows
Cash flows under valuation
Discount factor
Present value
Value of assets
Value of equity
2017 2018 2019 2020 2021 2022 2023
0.08
82 90 97 102 107 112
0.10 0.07 0.05 0.05 0.05
3392
82 90 3489
0.9259 0.8573 0.7938
17. Calculate the Present values of the cash flows under valuation.
D48: = D47*D46
76
E48: = E47*E46
78
F48: = F47*F46
2770
Jukka Perttunen Fundamentals of finance
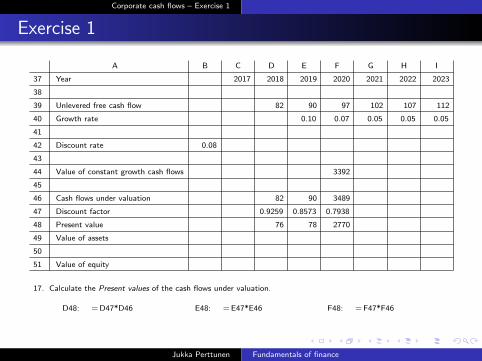
Corporate cash flows – Exercise 1
Exercise 1
37
38
39
40
41
42
43
44
45
46
47
48
49
50
51
A B C D E F G H I
Year
Unlevered free cash flow
Growth rate
Discount rate
Value of constant growth cash flows
Cash flows under valuation
Discount factor
Present value
Value of assets
Value of equity
2017 2018 2019 2020 2021 2022 2023
0.08
82 90 97 102 107 112
0.10 0.07 0.05 0.05 0.05
3392
82 90 3489
0.9259 0.8573 0.7938
17. Calculate the Present values of the cash flows under valuation.
D48: = D47*D46
76
E48: = E47*E46
78
F48: = F47*F46
2770
Jukka Perttunen Fundamentals of finance

Corporate cash flows – Exercise 1
Exercise 1
37
38
39
40
41
42
43
44
45
46
47
48
49
50
51
A B C D E F G H I
Year
Unlevered free cash flow
Growth rate
Discount rate
Value of constant growth cash flows
Cash flows under valuation
Discount factor
Present value
Value of assets
Value of equity
2017 2018 2019 2020 2021 2022 2023
0.08
82 90 97 102 107 112
0.10 0.07 0.05 0.05 0.05
3392
82 90 3489
0.9259 0.8573 0.7938
76 78 2770
18. Calculate the Value of assets (C49).
C49: = SUM(D48:F48)
2923
Jukka Perttunen Fundamentals of finance
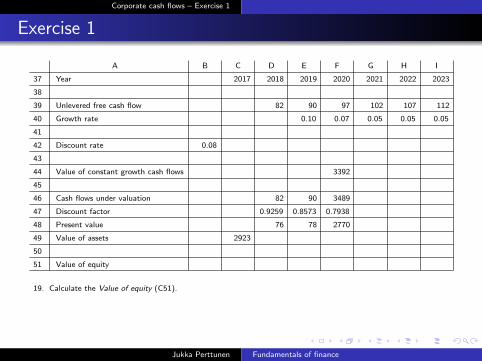
Corporate cash flows – Exercise 1
Exercise 1
37
38
39
40
41
42
43
44
45
46
47
48
49
50
51
A B C D E F G H I
Year
Unlevered free cash flow
Growth rate
Discount rate
Value of constant growth cash flows
Cash flows under valuation
Discount factor
Present value
Value of assets
Value of equity
2017 2018 2019 2020 2021 2022 2023
0.08
82 90 97 102 107 112
0.10 0.07 0.05 0.05 0.05
3392
82 90 3489
0.9259 0.8573 0.7938
76 78 2770
2923
19. Calculate the Value of equity (C51).
C51: = C49−(C9−C4)
2243
Jukka Perttunen Fundamentals of finance
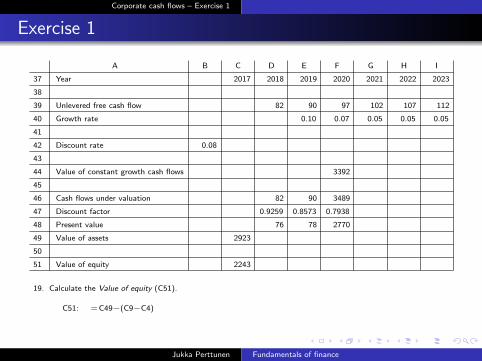
Corporate cash flows – Exercise 1
Exercise 1
37
38
39
40
41
42
43
44
45
46
47
48
49
50
51
A B C D E F G H I
Year
Unlevered free cash flow
Growth rate
Discount rate
Value of constant growth cash flows
Cash flows under valuation
Discount factor
Present value
Value of assets
Value of equity
2017 2018 2019 2020 2021 2022 2023
0.08
82 90 97 102 107 112
0.10 0.07 0.05 0.05 0.05
3392
82 90 3489
0.9259 0.8573 0.7938
76 78 2770
2923
19. Calculate the Value of equity (C51).
C51: = C49−(C9−C4)
2243
Jukka Perttunen Fundamentals of finance