fund processing standardisation - efama efama swift...efama – swift fps report 2017 mid-year data...
TRANSCRIPT
Fund Processing Standardisation
Tracking industry progress
2017 Mid-Year Data Report
EFAMA – SWIFT FPS Report 2017 Mid-Year Data Report Page 2
EFAMA – SWIFT FPS Report 2017 Mid-Year Data Report Page 3
Background
EFAMA and SWIFT publish on a bi-yearly1 basis trends in standardisation and automation rates of
fund orders received by transfer agents (TAs) in Luxembourg and Ireland. These reports showing the
evolution of standardisation and automation rates of funds orders are available on both EFAMA and
SWIFT websites2 dating back to May 2009.
This Mid-year report gives an update about the evolution during the first half of 2017. The EFAMA
Fund Processing Standardisation report combines the Luxembourg and Ireland data into one single
cross-border fund processing report providing
a. An aggregated view of both fund processing centres ; and
b. A detailed overview, including the regional split, per fund processing centre.
The goal of this initiative is to inform all institutions involved in fund processing, as well as the
European Commission, the European Parliament and other interested stakeholders, about the
industry’s progress towards greater automation of fund orders and use of the ISO messaging standards
recommended by EFAMA.
Contents
Report Highlights .................................................................................................................................... 4
A. Cross-border fund processing standardisation in Luxembourg and Ireland ................................... 4
B. Cross-border fund processing standardisation in Luxembourg ...................................................... 4
C. Cross-border fund processing standardisation in Ireland ............................................................... 5
A. Cross-border fund processing standardisation Ireland and Luxembourg. .......................................... 6
A.1 Order volume evolution ............................................................................................................... 6
A.2 Automation level .......................................................................................................................... 6
A.3 Standardisation levels ................................................................................................................... 7
B. Focus on Luxembourg ........................................................................................................................ 8
B.1 Order volume evolution ................................................................................................................ 8
B.2 Automation level .......................................................................................................................... 8
B.3 Standardisation levels ................................................................................................................... 9
B.4 Regional data ................................................................................................................................ 9
C. Focus on Ireland ............................................................................................................................... 11
C.1 Order volume evolution .............................................................................................................. 11
C.2 Automation level ........................................................................................................................ 11
C.3 Standardisation levels ................................................................................................................. 12
C.4. Regional data ............................................................................................................................. 12
D. Standardisation of fund processing in Italy ...................................................................................... 13
E. Next report ........................................................................................................................................ 16
1 EFAMA and SWIFT publish two fund processing standardisation reports per year: a full year detailed report and a mid-
year update report. 2 http://www.swift.com/funds
http://www.efama.org/index.php?option=com_docman&task=cat_view&gid=88&Itemid=-99
EFAMA – SWIFT FPS Report 2017 Mid-Year Data Report Page 4
Report Highlights
A. Cross-border fund processing standardisation in Luxembourg and Ireland
Key insights of the combined surveys coverage:
28 transfers agents3 (TAs) surveyed: 19 in Luxembourg & 9 in Ireland
With an estimated market coverage of 80% of the cross-border market volumes in
Ireland and an estimated market coverage of 75% in Luxembourg.
Standardisation data collected on 19.5 million incoming orders H1 2017
In the first half of 2017, the total volume of orders increased by 13.3% to 19.5 million
orders, compared to 17.2 million orders in the second half of 2016.
The volume of automated processed orders increased by 14% to 17 million (against
14.9 million in H2 2016).
In the first half of 2017, the adoption of ISO messaging standards (composed of ISO
15022 and 20022 messages) increased by 0.8 percentage points to 54.2% in Q2 2017.
In parallel, the use of proprietary ftp decreased by 0.9 p.p. to 32.4% in Q2 2017. The
manual processing rate remains quite stable at 13.4% in Q2 2017.
B. Cross-border fund processing standardisation in Luxembourg
Comparing the first half of 2017 to the second half of 2016, order volumes increased by
11.6%. In total, 12.1 million orders were processed by survey contributors during the
first half of 2017.
Among these orders, 10.3 million orders were processed automatically in the first half of
2017, compared to 9.1 million orders in Q4 2016.
The 19 Luxembourg-based TAs manually processed 1.9 million orders during the first
half of 2017.
The total automation rate of orders processed in Luxembourg decreased slightly from
84.4% in Q4 2016 to 84% in Q2 2017.
The percentage of automated orders based on the ISO messaging standards increased
from 68.3% during Q4 2016 to 69.4% in Q2 2017, whereas the use of proprietary ftp
decreased from 16.1% in Q4 2016 to 14.7% in Q2 2017.
3 The transfer agency services from one TA based in Luxembourg have been incorporated in the course of 2016 into
another TA (also contributing to this survey) – this explains why the number of contributors decreased from 29 to 28 TA, with a total coverage of the report remaining identical.
EFAMA – SWIFT FPS Report 2017 Mid-Year Data Report Page 5
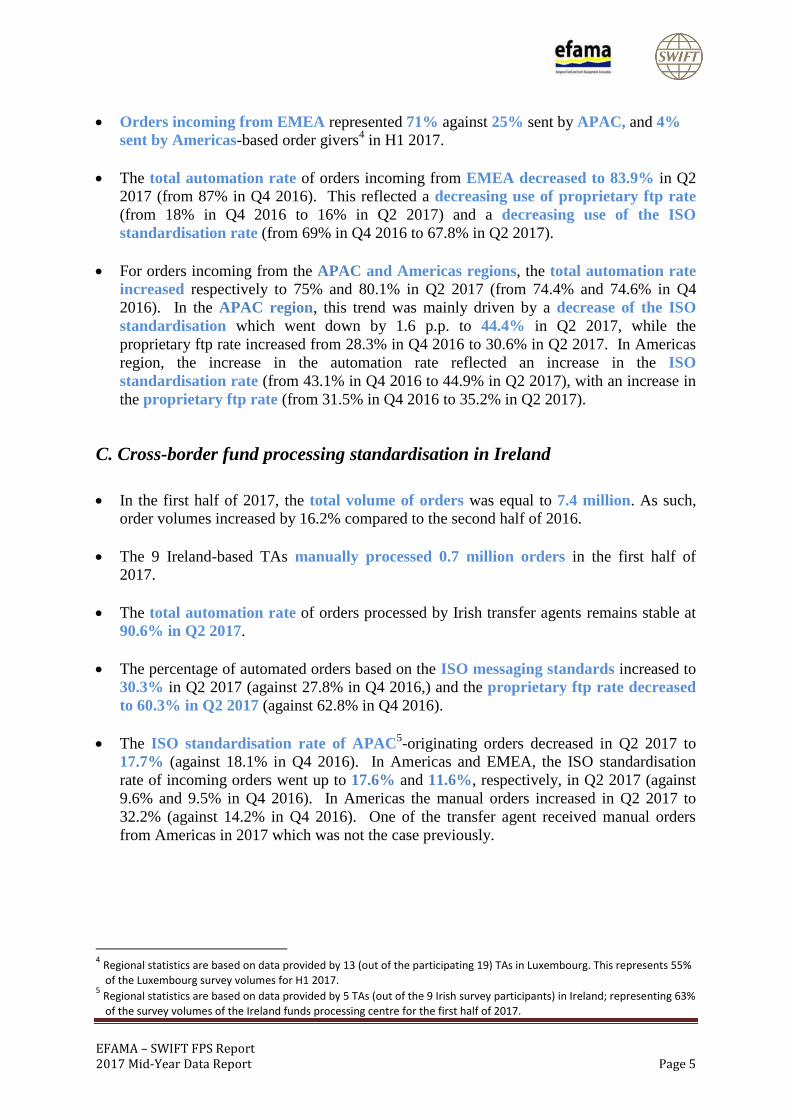
Orders incoming from EMEA represented 71% against 25% sent by APAC, and 4%
sent by Americas-based order givers4 in H1 2017.
The total automation rate of orders incoming from EMEA decreased to 83.9% in Q2
2017 (from 87% in Q4 2016). This reflected a decreasing use of proprietary ftp rate
(from 18% in Q4 2016 to 16% in Q2 2017) and a decreasing use of the ISO
standardisation rate (from 69% in Q4 2016 to 67.8% in Q2 2017).
For orders incoming from the APAC and Americas regions, the total automation rate
increased respectively to 75% and 80.1% in Q2 2017 (from 74.4% and 74.6% in Q4
2016). In the APAC region, this trend was mainly driven by a decrease of the ISO
standardisation which went down by 1.6 p.p. to 44.4% in Q2 2017, while the
proprietary ftp rate increased from 28.3% in Q4 2016 to 30.6% in Q2 2017. In Americas
region, the increase in the automation rate reflected an increase in the ISO
standardisation rate (from 43.1% in Q4 2016 to 44.9% in Q2 2017), with an increase in
the proprietary ftp rate (from 31.5% in Q4 2016 to 35.2% in Q2 2017).
C. Cross-border fund processing standardisation in Ireland
In the first half of 2017, the total volume of orders was equal to 7.4 million. As such,
order volumes increased by 16.2% compared to the second half of 2016.
The 9 Ireland-based TAs manually processed 0.7 million orders in the first half of
2017.
The total automation rate of orders processed by Irish transfer agents remains stable at
90.6% in Q2 2017.
The percentage of automated orders based on the ISO messaging standards increased to
30.3% in Q2 2017 (against 27.8% in Q4 2016,) and the proprietary ftp rate decreased
to 60.3% in Q2 2017 (against 62.8% in Q4 2016).
The ISO standardisation rate of APAC5-originating orders decreased in Q2 2017 to
17.7% (against 18.1% in Q4 2016). In Americas and EMEA, the ISO standardisation
rate of incoming orders went up to 17.6% and 11.6%, respectively, in Q2 2017 (against
9.6% and 9.5% in Q4 2016). In Americas the manual orders increased in Q2 2017 to
32.2% (against 14.2% in Q4 2016). One of the transfer agent received manual orders
from Americas in 2017 which was not the case previously.
4 Regional statistics are based on data provided by 13 (out of the participating 19) TAs in Luxembourg. This represents 55%
of the Luxembourg survey volumes for H1 2017. 5 Regional statistics are based on data provided by 5 TAs (out of the 9 Irish survey participants) in Ireland; representing 63%
of the survey volumes of the Ireland funds processing centre for the first half of 2017.
EFAMA – SWIFT FPS Report 2017 Mid-Year Data Report Page 6
A. Cross-border fund processing standardisation Ireland and
Luxembourg.
A.1 Order volume evolution
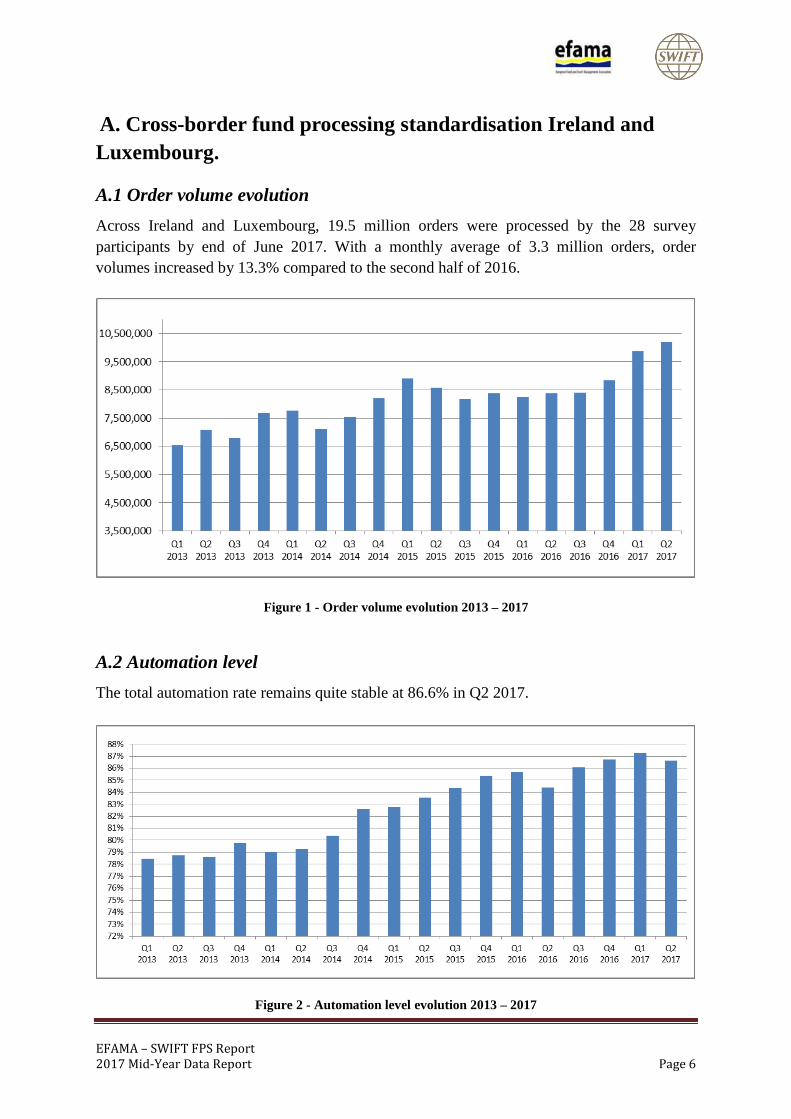
Across Ireland and Luxembourg, 19.5 million orders were processed by the 28 survey
participants by end of June 2017. With a monthly average of 3.3 million orders, order
volumes increased by 13.3% compared to the second half of 2016.
Figure 1 - Order volume evolution 2013 – 2017
A.2 Automation level
The total automation rate remains quite stable at 86.6% in Q2 2017.
Figure 2 - Automation level evolution 2013 – 2017
EFAMA – SWIFT FPS Report 2017 Mid-Year Data Report Page 7
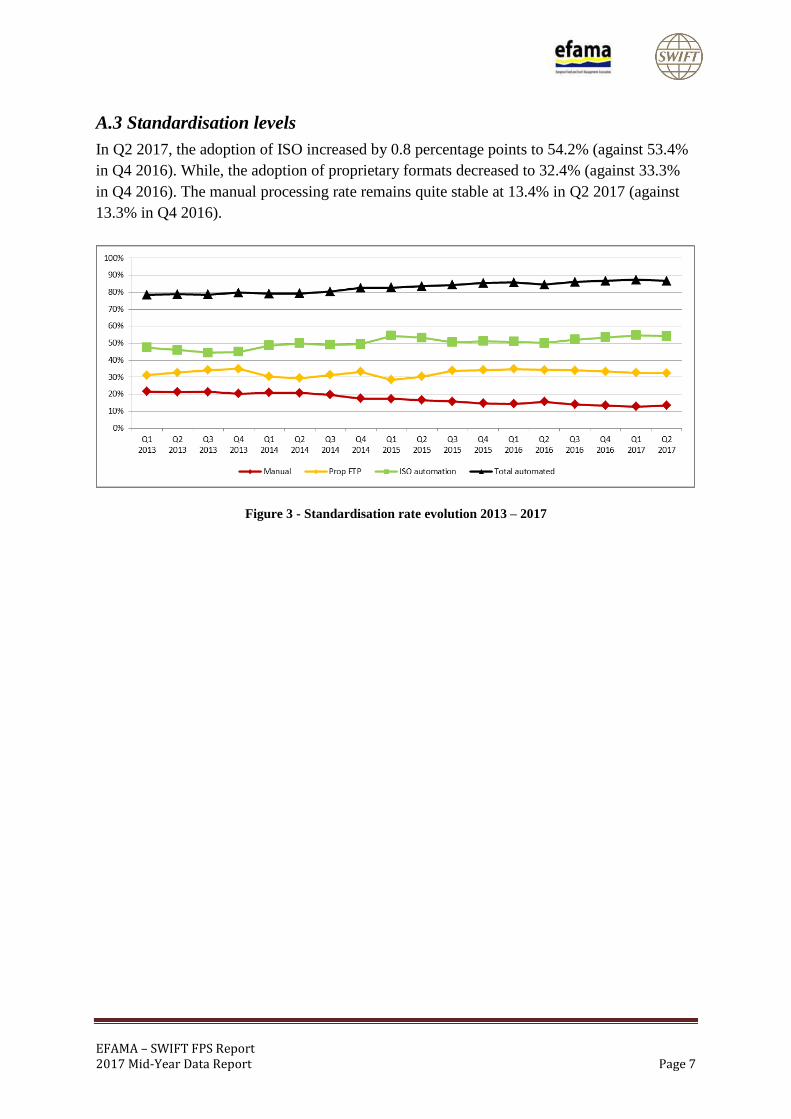
A.3 Standardisation levels
In Q2 2017, the adoption of ISO increased by 0.8 percentage points to 54.2% (against 53.4%
in Q4 2016). While, the adoption of proprietary formats decreased to 32.4% (against 33.3%
in Q4 2016). The manual processing rate remains quite stable at 13.4% in Q2 2017 (against
13.3% in Q4 2016).
Figure 3 - Standardisation rate evolution 2013 – 2017
EFAMA – SWIFT FPS Report 2017 Mid-Year Data Report Page 8
B. Focus on Luxembourg
B.1 Order volume evolution
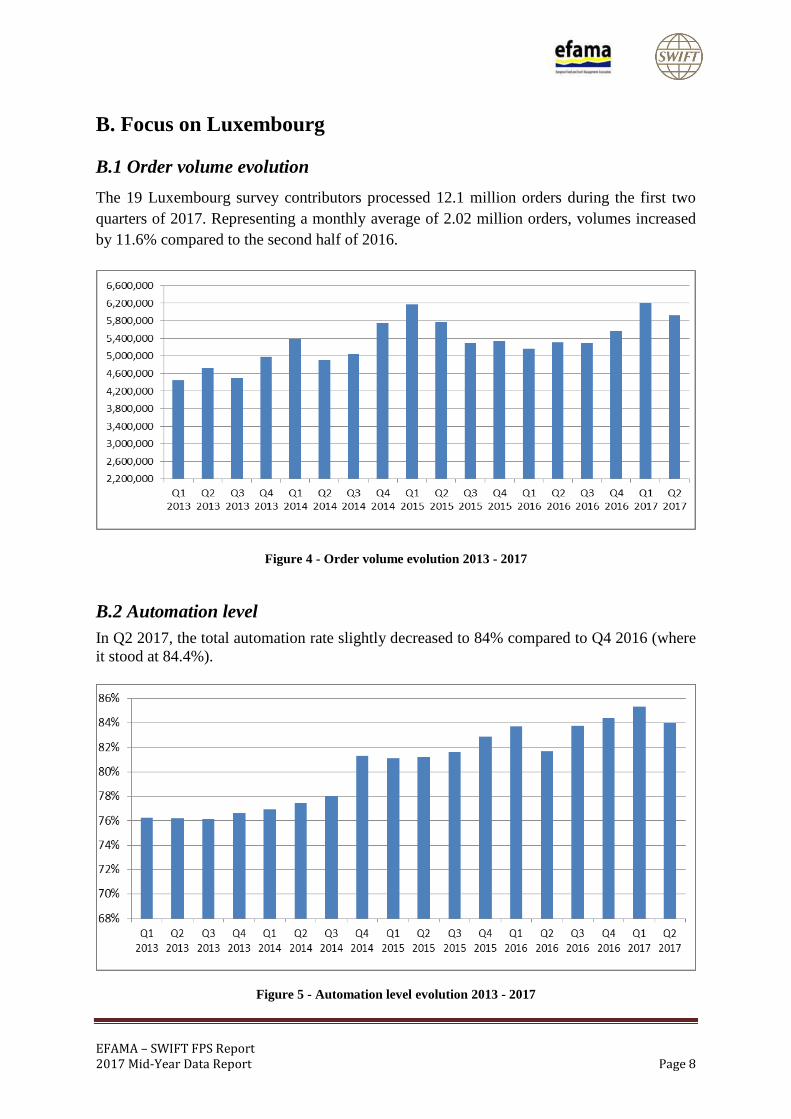
The 19 Luxembourg survey contributors processed 12.1 million orders during the first two
quarters of 2017. Representing a monthly average of 2.02 million orders, volumes increased
by 11.6% compared to the second half of 2016.
Figure 4 - Order volume evolution 2013 - 2017
B.2 Automation level
In Q2 2017, the total automation rate slightly decreased to 84% compared to Q4 2016 (where
it stood at 84.4%).
Figure 5 - Automation level evolution 2013 - 2017
EFAMA – SWIFT FPS Report 2017 Mid-Year Data Report Page 9
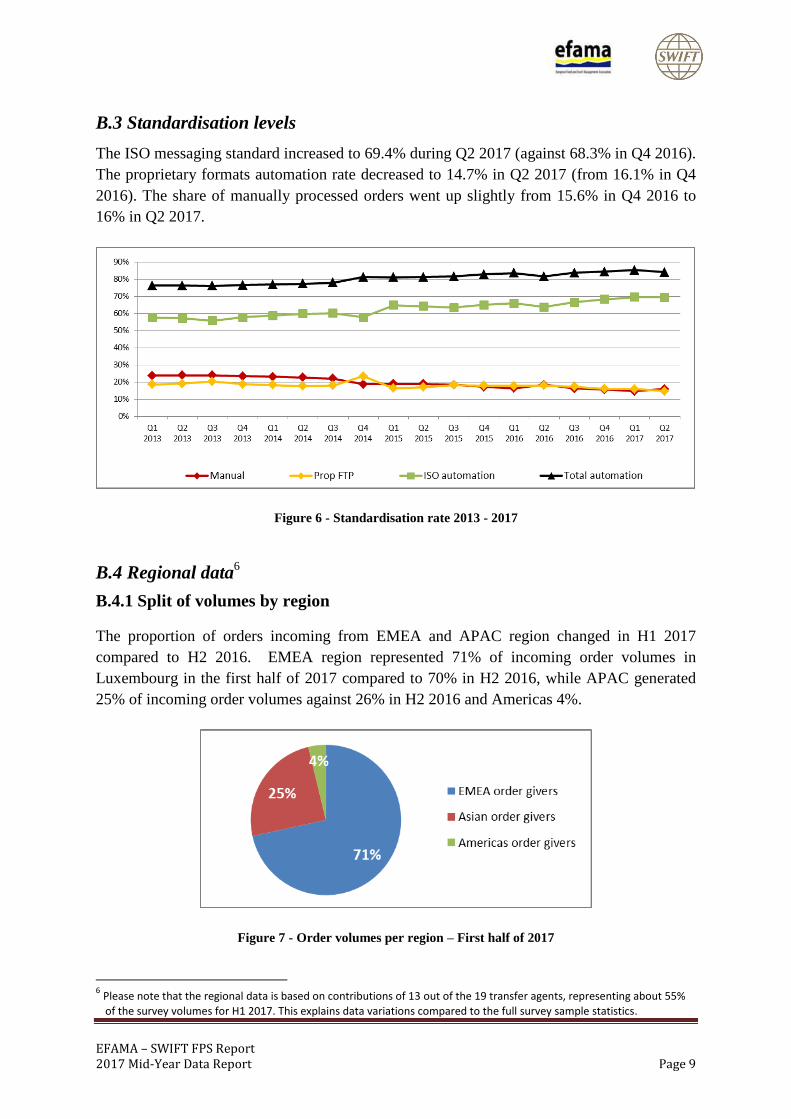
B.3 Standardisation levels
The ISO messaging standard increased to 69.4% during Q2 2017 (against 68.3% in Q4 2016).
The proprietary formats automation rate decreased to 14.7% in Q2 2017 (from 16.1% in Q4
2016). The share of manually processed orders went up slightly from 15.6% in Q4 2016 to
16% in Q2 2017.
Figure 6 - Standardisation rate 2013 - 2017
B.4 Regional data6
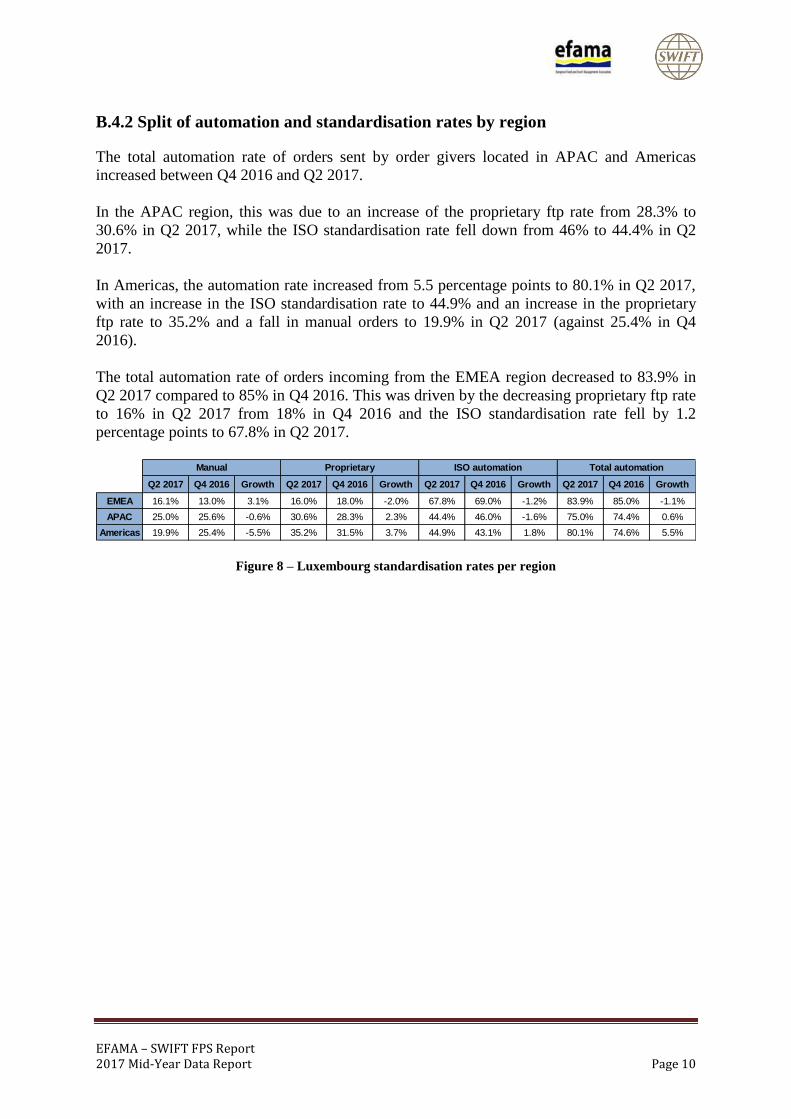
B.4.1 Split of volumes by region
The proportion of orders incoming from EMEA and APAC region changed in H1 2017
compared to H2 2016. EMEA region represented 71% of incoming order volumes in
Luxembourg in the first half of 2017 compared to 70% in H2 2016, while APAC generated
25% of incoming order volumes against 26% in H2 2016 and Americas 4%.
Figure 7 - Order volumes per region – First half of 2017
6 Please note that the regional data is based on contributions of 13 out of the 19 transfer agents, representing about 55%
of the survey volumes for H1 2017. This explains data variations compared to the full survey sample statistics.
EFAMA – SWIFT FPS Report 2017 Mid-Year Data Report Page 10
B.4.2 Split of automation and standardisation rates by region
The total automation rate of orders sent by order givers located in APAC and Americas
increased between Q4 2016 and Q2 2017.
In the APAC region, this was due to an increase of the proprietary ftp rate from 28.3% to
30.6% in Q2 2017, while the ISO standardisation rate fell down from 46% to 44.4% in Q2
2017.
In Americas, the automation rate increased from 5.5 percentage points to 80.1% in Q2 2017,
with an increase in the ISO standardisation rate to 44.9% and an increase in the proprietary
ftp rate to 35.2% and a fall in manual orders to 19.9% in Q2 2017 (against 25.4% in Q4
2016).
The total automation rate of orders incoming from the EMEA region decreased to 83.9% in
Q2 2017 compared to 85% in Q4 2016. This was driven by the decreasing proprietary ftp rate
to 16% in Q2 2017 from 18% in Q4 2016 and the ISO standardisation rate fell by 1.2
percentage points to 67.8% in Q2 2017.
Q2 2017 Q4 2016 Growth Q2 2017 Q4 2016 Growth Q2 2017 Q4 2016 Growth Q2 2017 Q4 2016 Growth
EMEA 16.1% 13.0% 3.1% 16.0% 18.0% -2.0% 67.8% 69.0% -1.2% 83.9% 85.0% -1.1%
APAC 25.0% 25.6% -0.6% 30.6% 28.3% 2.3% 44.4% 46.0% -1.6% 75.0% 74.4% 0.6%
Americas 19.9% 25.4% -5.5% 35.2% 31.5% 3.7% 44.9% 43.1% 1.8% 80.1% 74.6% 5.5%
Manual Proprietary ISO automation Total automation
Figure 8 – Luxembourg standardisation rates per region
EFAMA – SWIFT FPS Report 2017 Mid-Year Data Report Page 11
C. Focus on Ireland
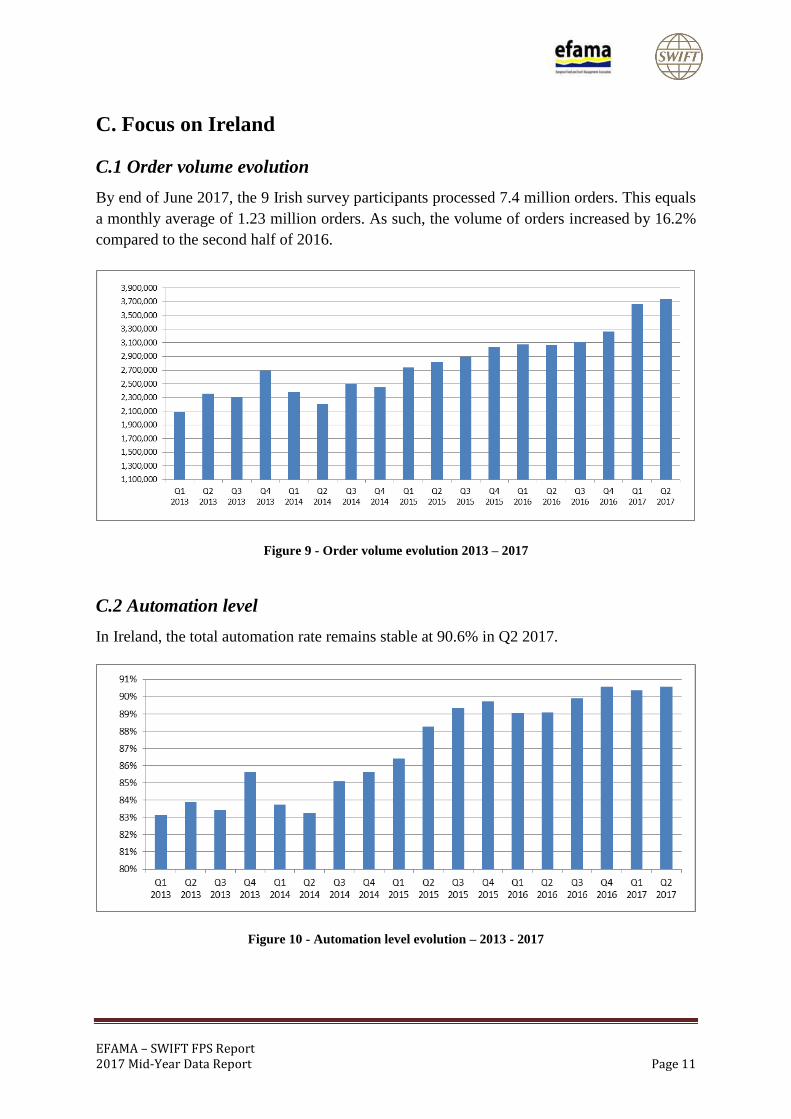
C.1 Order volume evolution
By end of June 2017, the 9 Irish survey participants processed 7.4 million orders. This equals
a monthly average of 1.23 million orders. As such, the volume of orders increased by 16.2%
compared to the second half of 2016.
Figure 9 - Order volume evolution 2013 – 2017
C.2 Automation level
In Ireland, the total automation rate remains stable at 90.6% in Q2 2017.
Figure 10 - Automation level evolution – 2013 - 2017
EFAMA – SWIFT FPS Report 2017 Mid-Year Data Report Page 12
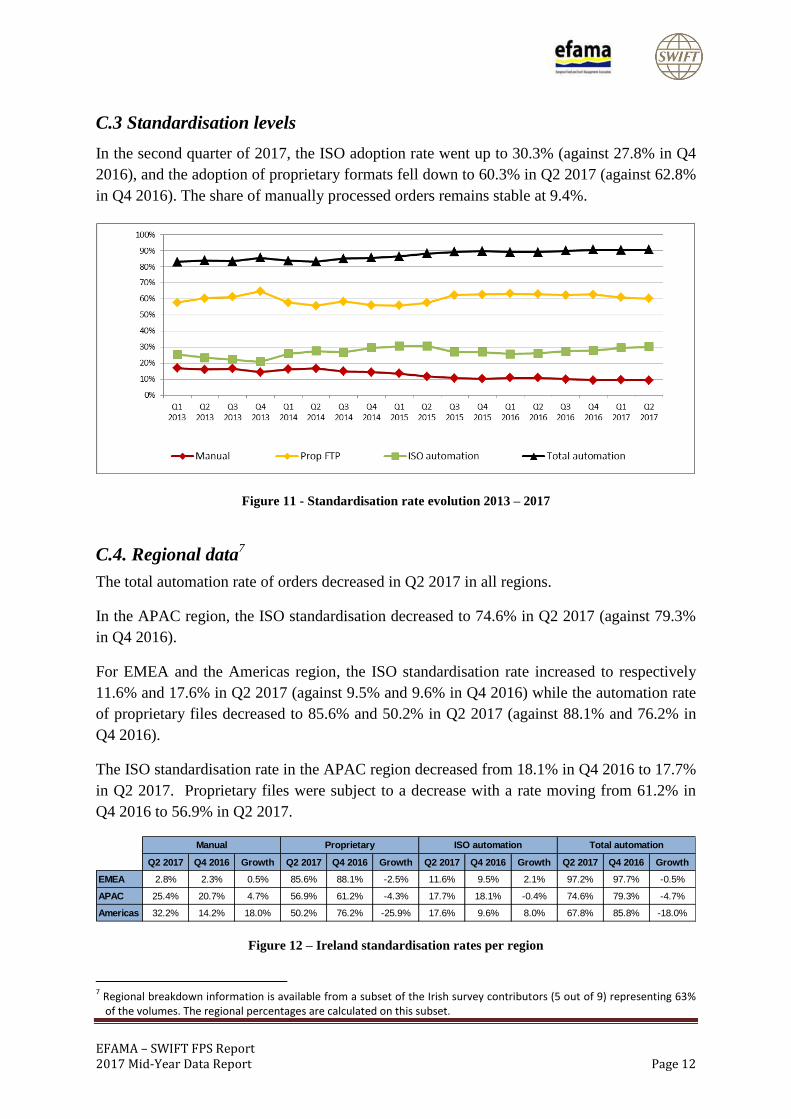
C.3 Standardisation levels
In the second quarter of 2017, the ISO adoption rate went up to 30.3% (against 27.8% in Q4
2016), and the adoption of proprietary formats fell down to 60.3% in Q2 2017 (against 62.8%
in Q4 2016). The share of manually processed orders remains stable at 9.4%.
Figure 11 - Standardisation rate evolution 2013 – 2017
C.4. Regional data7
The total automation rate of orders decreased in Q2 2017 in all regions.
In the APAC region, the ISO standardisation decreased to 74.6% in Q2 2017 (against 79.3%
in Q4 2016).
For EMEA and the Americas region, the ISO standardisation rate increased to respectively
11.6% and 17.6% in Q2 2017 (against 9.5% and 9.6% in Q4 2016) while the automation rate
of proprietary files decreased to 85.6% and 50.2% in Q2 2017 (against 88.1% and 76.2% in
Q4 2016).
The ISO standardisation rate in the APAC region decreased from 18.1% in Q4 2016 to 17.7%
in Q2 2017. Proprietary files were subject to a decrease with a rate moving from 61.2% in
Q4 2016 to 56.9% in Q2 2017.
Q2 2017 Q4 2016 Growth Q2 2017 Q4 2016 Growth Q2 2017 Q4 2016 Growth Q2 2017 Q4 2016 Growth
EMEA 2.8% 2.3% 0.5% 85.6% 88.1% -2.5% 11.6% 9.5% 2.1% 97.2% 97.7% -0.5%
APAC 25.4% 20.7% 4.7% 56.9% 61.2% -4.3% 17.7% 18.1% -0.4% 74.6% 79.3% -4.7%
Americas 32.2% 14.2% 18.0% 50.2% 76.2% -25.9% 17.6% 9.6% 8.0% 67.8% 85.8% -18.0%
Manual Proprietary ISO automation Total automation
Figure 12 – Ireland standardisation rates per region
7 Regional breakdown information is available from a subset of the Irish survey contributors (5 out of 9) representing 63%
of the volumes. The regional percentages are calculated on this subset.
EFAMA – SWIFT FPS Report 2017 Mid-Year Data Report Page 13
D. Standardisation of fund processing in Italy
The Italian market is progressing in its transition towards ISO20022 communication
standards between asset managers, intermediaries, local TAs and custodian banks.
The survey launched in 2015 showed good take up of the standards across the industry: 10
Asset managers, 32 Distributors and 7 Paying Agents were engaged in the process and 58%
of AUM of Italian domiciled funds and 80% of AUM of foreign domiciled funds are
ISO 20022 compliant (they can process orders via ISO 20022).
Since then the standardization process has further progressed with:
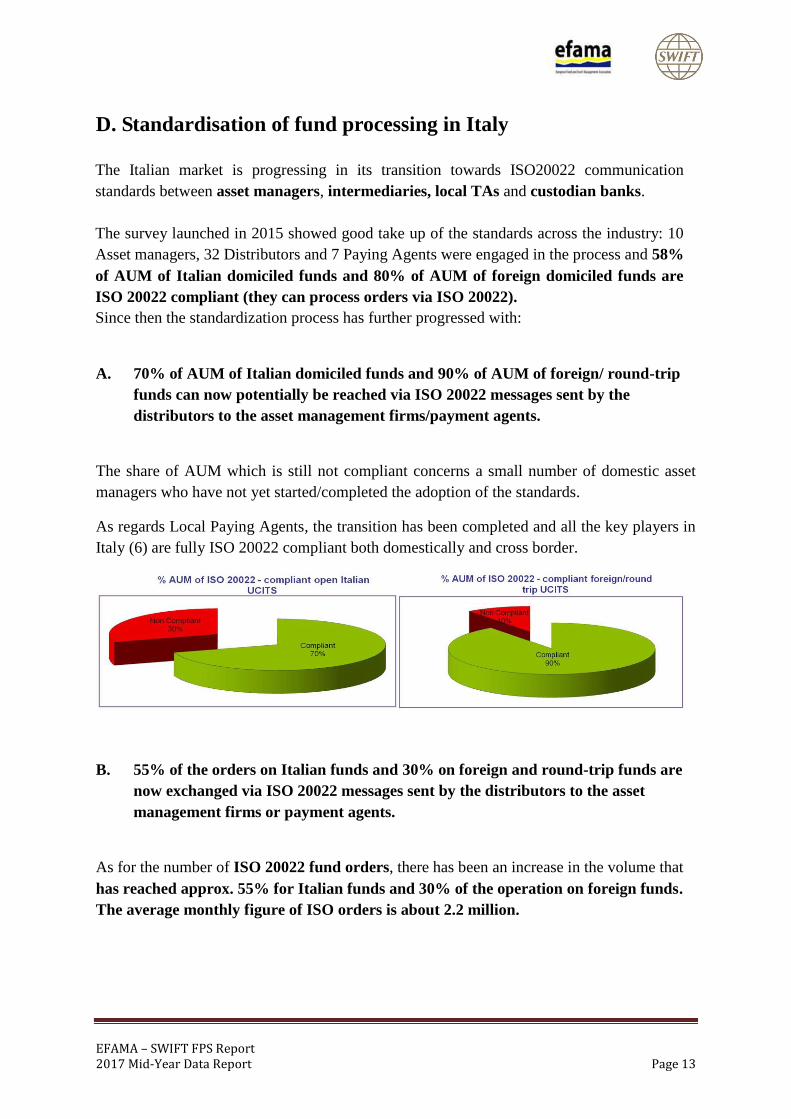
A. 70% of AUM of Italian domiciled funds and 90% of AUM of foreign/ round-trip
funds can now potentially be reached via ISO 20022 messages sent by the
distributors to the asset management firms/payment agents.
The share of AUM which is still not compliant concerns a small number of domestic asset
managers who have not yet started/completed the adoption of the standards.
As regards Local Paying Agents, the transition has been completed and all the key players in
Italy (6) are fully ISO 20022 compliant both domestically and cross border.
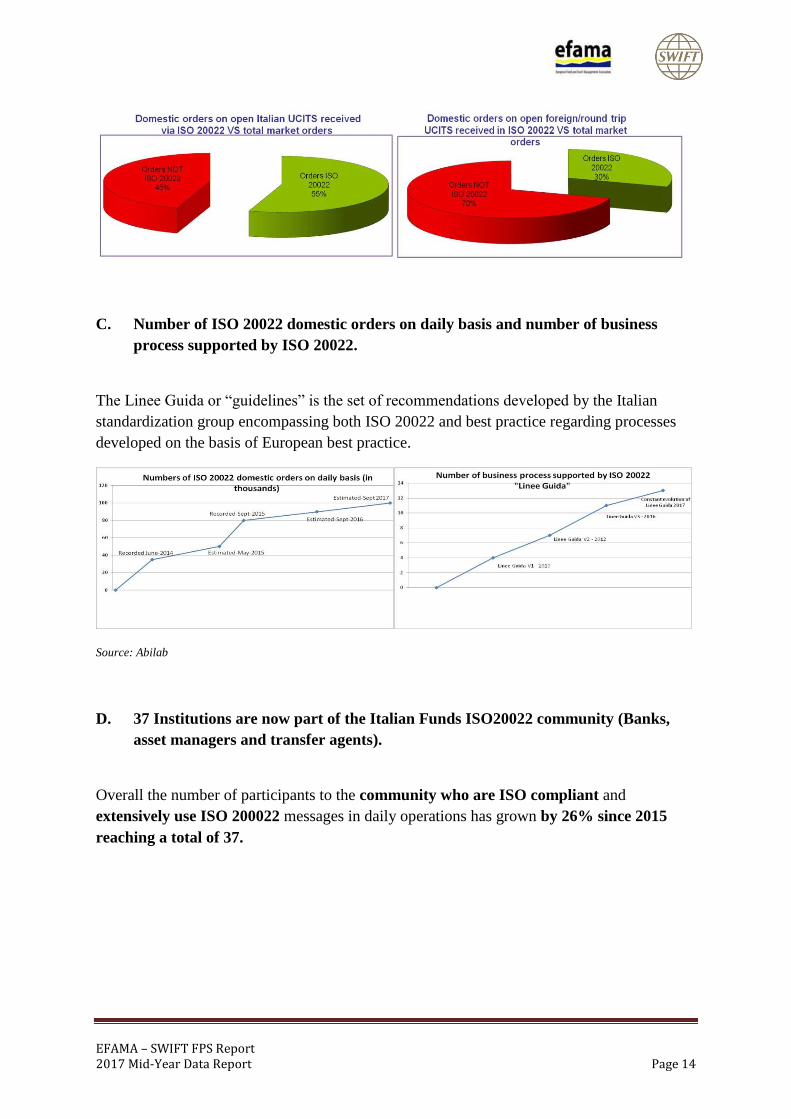
B. 55% of the orders on Italian funds and 30% on foreign and round-trip funds are
now exchanged via ISO 20022 messages sent by the distributors to the asset
management firms or payment agents.
As for the number of ISO 20022 fund orders, there has been an increase in the volume that
has reached approx. 55% for Italian funds and 30% of the operation on foreign funds.
The average monthly figure of ISO orders is about 2.2 million.
EFAMA – SWIFT FPS Report 2017 Mid-Year Data Report Page 14
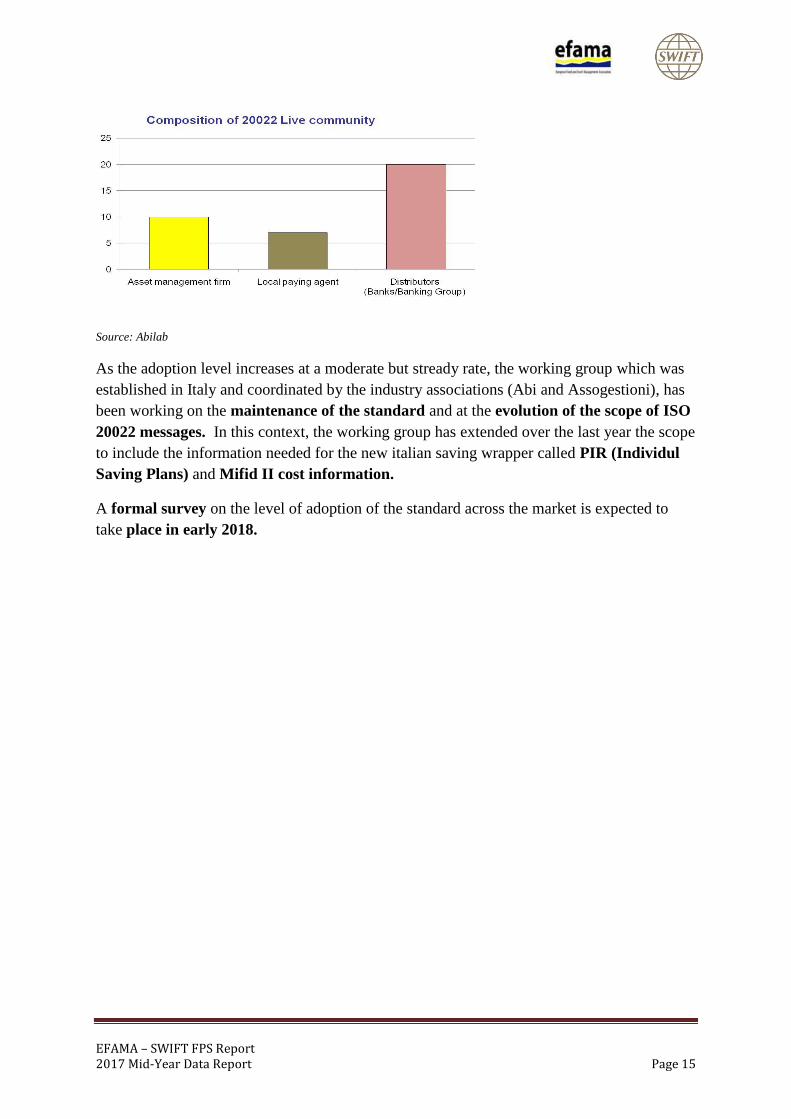
C. Number of ISO 20022 domestic orders on daily basis and number of business
process supported by ISO 20022.
The Linee Guida or “guidelines” is the set of recommendations developed by the Italian
standardization group encompassing both ISO 20022 and best practice regarding processes
developed on the basis of European best practice.
Source: Abilab
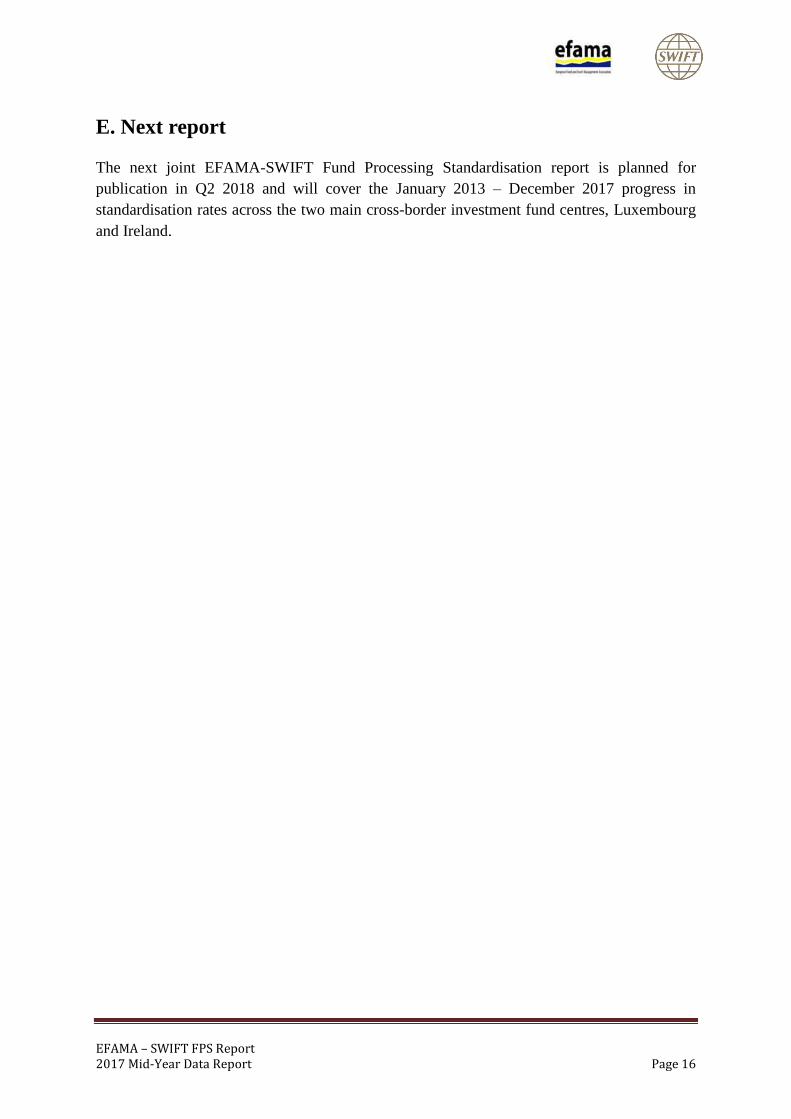
D. 37 Institutions are now part of the Italian Funds ISO20022 community (Banks,
asset managers and transfer agents).
Overall the number of participants to the community who are ISO compliant and
extensively use ISO 200022 messages in daily operations has grown by 26% since 2015
reaching a total of 37.
EFAMA – SWIFT FPS Report 2017 Mid-Year Data Report Page 15
Source: Abilab
As the adoption level increases at a moderate but stready rate, the working group which was
established in Italy and coordinated by the industry associations (Abi and Assogestioni), has
been working on the maintenance of the standard and at the evolution of the scope of ISO
20022 messages. In this context, the working group has extended over the last year the scope
to include the information needed for the new italian saving wrapper called PIR (Individul
Saving Plans) and Mifid II cost information.
A formal survey on the level of adoption of the standard across the market is expected to
take place in early 2018.
EFAMA – SWIFT FPS Report 2017 Mid-Year Data Report Page 16
E. Next report
The next joint EFAMA-SWIFT Fund Processing Standardisation report is planned for
publication in Q2 2018 and will cover the January 2013 – December 2017 progress in
standardisation rates across the two main cross-border investment fund centres, Luxembourg
and Ireland.