fund performance report - bpi-philam · 2019-10-04 · index fund bpi-philam growth fund assets...
TRANSCRIPT

FUND PERFORMANCE REPORTBPI-Philam Life Assurance corp. (BPLAC)
Variable Unit-Linked Funds Annual Report and Statement of Assets and Liabilities

STATEMENT OF ASSETS AND LIABILITIESpages 2 - 4
MARKETREVIEWpages 6 - 9
BPI-PHILAM MAX GROWTH ASIApages 10 - 11
BPI-PHILAM MAX GROWTH ASIA 2pages 12 - 13
BPI-PHILAM MAX GROWTH ASIA 3pages 14 - 15
BPI-PHILAM EQUITY INDEX FUND
pages 18 - 19
BPI-PHILAMGROWTH FUND
pages 20 - 21
BPI-PHILAM ODYSSEY BOND FUND
pages 22 - 23
BPI-PHILAMBALANCED FUND
pages 28 - 29
BPI-PHILAM ODYSSEY HIGH CONVICTION
EQUITY FUNDpages 24 - 25
BPI-PHILAM ODYSSEY BALANCED FUND
pages 26 - 27
BPI-PHILAM PESO BOND FUNDpages 16 - 17
MESSAGE FROMTHE CEOpage I

CONTENTS
BPI-PHILAM EQUITY INDEX FUND 2pages 30 - 31
BPI-PHILAM PHILIPPINE HIGH DIVIDEND EQUITY FUNDpages 32 - 33
BPI-PHILAM GROWTH FUND 2pages 34 - 35
BPI-PHILAM EQUITY VALUE FUNDpages 36 -37
BPI-PHILAM ACTIVE ALLOCATION FUNDpages 38 - 39
BPI-PHILAM HIGH-WATER MARK FUND 2019pages 40 - 41
BPI-PHILAM HIGH-WATER MARK
FUND 2021pages 42 - 43
BPI-PHILAM US DOLLAR BOND FUND
pages 44 - 45
BPI-PHILAM US DOLLAR BOND FUND 2
pages 46 - 47
BPI-PHILAM GLOBAL EQUITY FUND
pages 48 - 49
BPI-PHILAM ODYSSEY ASIA PACIFIC HIGH
DIVIDEND EQUITY FUNDpages 50 - 51
DISLOSURESTATEMENT
pages 54 - 55
BPI-PHILAM PHILIPPINE DOLLAR BOND FUND
pages 52 - 53

MESSSAGE FROM THE
CEO

Dear Policyholder,
The world economy firmly grew 3.0% in 2018, albeit at a slower pace than in 2017. Asia remains to be the biggest contributor to world GDP, growing 6.3% in 2018. Meanwhile, the Philippine economy continues to display strength despite headwinds in 2018. Local economic growth registered 6.2% in 2018, slower than 2017’s 6.7% growth rate.
The year 2018 was a challenging one for both global and local financial markets. It was a story of reflation and rising interest rates in the Philippine setting. The Build, Build, Build Infrastructure program by the government continued to buoy economic growth, resulting in stronger demand for imported raw materials and capital equipment, which contributed to a wider current account deficit and ultimately depreciating the value of the Philippine peso against the US dollar. Meanwhile, the increase in global oil prices and weaker local currency pressured Philippine inflation, which averaged 5.2% in 2018, breaching the Bangko Sentral ng Pilipinas’ (BSP) 2.0 to 4.0% target. To abate rising price pressures, the BSP aggressively hiked policy rates by 175bps cumulatively to 4.75%. Given high local interest rates and peso depreciation amid escalating concerns in geo-politics and global trade, the Philippine Stock Index (PSEi) underperformed in 2018 at -12.8%.
Despite the volatility in the market and other factors, BPI-Philam reaffirms its strength and leadership with strong financial performance in 2018 based on audited financial statements:
- Total Assets of PHP 101.88 billion - Net Worth of PHP 6.36 billion - Paid up Capital of PHP 0.75 billion - Gross Premiums of PHP 18.92 billion - Net Income of PHP 1.39 billion
Thank you for your loyalty and continued patronage. Should you have any inquiries, please do not hesitate to call us at (+632) 528-5501 or e-mail us at [email protected]. You may also visit our website at www.bpi-philam.com or talk to our Bancassurance Sales Executive at your nearest BPI or BPI Family Bank branch.
SURENDRA MENONChief Executive Officer

ASSETS AND LIABILITIESas of December 31, 2018
BPI-PHILAM PESO VARIABLE FUNDS
BPI-Philam Max Growth Asia Fund
BPI-Philam Max Growth Asia Fund 2
BPI-Philam Max Growth Asia Fund 3
in PHP Equivalent
ASSETS
Financial Assets at FVTPL* 425,676,672 207,387,840 116,973,480
Net Asset Value (NAV) 425,676,672 207,387,840 116,973,480
BPI-Philam Peso Bond Fund
BPI-Philam Equity Index Fund
BPI-PhilamGrowth Fund
ASSETS
Cash and cash equivalentsFinancial assets at FVTPL*Loans and receivablesAccrued income
-9,660,017,324
12,209,067-
-5,876,510,224
3,509,136-
-3,759,509,337
2,970,819-
9,672,226,391 5,880,019,360 3,762,480,157
LIABILITIES
Accounts payable and accrued expenses 901,564 180,034 790,820
Net Asset Value (NAV) 9,671,324,827 5,879,839,326 3,761,689,337
901,564 180,034 790,820
BPI-Philam Odyssey Bond Fund
BPI-Philam Odyssey Balanced Fund
BPI-Philam Odyssey High Conviction
Equity Fund
ASSETS
Cash and cash equivalentsFinancial assets at FVTPL*Loans and receivablesAccrued income
-1,720,552,606
2,644,757-
-1,672,812,488
1,342,797-
-788,074,874
5,046,280-
1,723,197,363 1,674,155,285 793,121,155
LIABILITIES
Accounts payable and accrued expenses 1,035,711 911,577 457,502
Net Asset Value (NAV) 1,722,161,652 1,673,243,707 792,663,653
1,035,711 911,577 457,502
2
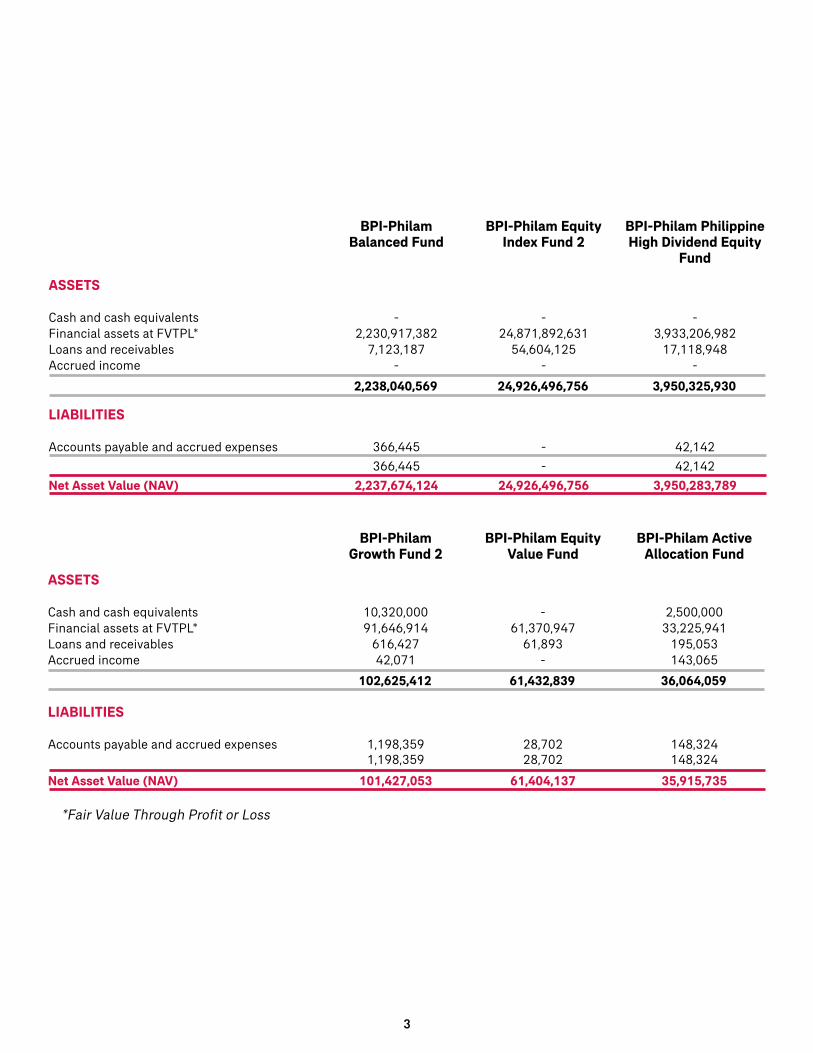
BPI-PhilamBalanced Fund
BPI-Philam Equity Index Fund 2
BPI-Philam Philippine High Dividend Equity
Fund
ASSETS
Cash and cash equivalentsFinancial assets at FVTPL*Loans and receivablesAccrued income
- 2,230,917,382
7,123,187-
-24,871,892,631
54,604,125-
-3,933,206,982
17,118,948 -
2,238,040,569 24,926,496,756 3,950,325,930
LIABILITIES
Accounts payable and accrued expenses 366,445 - 42,142
Net Asset Value (NAV)
366,445 - 42,142
2,237,674,124 24,926,496,756 3,950,283,789
BPI-PhilamGrowth Fund 2
BPI-Philam Equity Value Fund
BPI-Philam Active Allocation Fund
ASSETS
Cash and cash equivalentsFinancial assets at FVTPL*Loans and receivablesAccrued income
10,320,000 91,646,914
616,427 42,071
-61,370,947
61,893 -
2,500,000 33,225,941
195,053 143,065
102,625,412 61,432,839 36,064,059
LIABILITIES
Accounts payable and accrued expenses 1,198,359 28,702 148,324
Net Asset Value (NAV) 101,427,053 61,404,137 35,915,735
1,198,359 28,702 148,324
*Fair Value Through Profit or Loss
3

ASSETS AND LIABILITIESas of December 31, 2018
BPI-PHILAM DOLLAR VARIABLE FUNDS
BPI-Philam High-WaterMark Fund 2019
BPI-Philam High-WaterMark Fund 2021
in USD Equivalent
ASSETS
Financial Assets at FVTPL* 28,414,886 3,559,840
Net Asset Value (NAV) 28,414,886 3,559,840
BPI-Philam US DollarBond Fund
BPI-Philam US DollarBond Fund 2
ASSETS
Cash and cash equivalentsFinancial assets at FVTPL*Loans and receivablesAccrued income
12,400,000114,402,979
186,787 2,022,684
8,550,000 51,656,406
264,307 904,087
129,012,450 61,374,800
LIABILITIES
Accounts payable and accrued expenses 371,259 346,261
Net Asset Value (NAV) 128,641,191 61,028,540
371,259 346,261
BPI-Philam Odyssey Asia Pacific High Dividend Equity
Fund
BPI-Philam Odyssey Philippine Dollar
Bond Fund
BPI-Philam GlobalEquity Fund
ASSETS
Cash and cash equivalentsFinancial assets at FVTPL*Loans and receivablesAccrued income
-5,393,890
6,064 -
-3,057,914
1,483 -
-50,437,959
229,110-
5,399,954 3,059,396 50,667,069
LIABILITIES
Accounts payable and accrued expenses 5,992 113 -
Net Asset Value (NAV) 5,393,963 3,059,283 50,667,069
5,992 113 -
4

5

MARKETREVIEW
7
OVERVIEW2018 was an eventful year. The US Federal Reserve Bank (Fed) raised its short-term interest rates four times or a total of 100 basis points. The Bangko Sentral ng Pilipinas (BSP) followed suit, raising its overnight lending rate by a total of 175 basis points. The Philippine Peso depreciated by 5.3% against the US Dollar, and for the first time since 2004, the country’s imports outpaced its exports. Domestic inflation rose to 11-year highs amid disruptions in food supply and the passage of new taxes. Global crude oil prices soared in 2018 as well. Trade disagreements between the US and China had a dampening impact on the global economy, causing the global Gross Domestic Product (GDP) growth to slow down to 3.6% from 3.8% in 2017. Notwithstanding, the Philippine economy grew at a faster pace than 6% (at 6.2%) for the seventh consecutive year, owing to robust domestic consumption and investment spending.
INCOME MARKETThe year 2018 was difficult for Peso Fixed Income, as rising inflation (5.2%) and the BSP’s aggressive monetary policy stance (adding 175 bps to the policy rate) resulted in a spike in yields. The local currency bond index fell by a total of 4.4% over the year due to mark-to-market losses, as the yield curve climbed 2.6% on average (over 3% at the short end, and over 1% at the long end). The local fixed income-themed Funds were positioned defensively given the tough market environment, having an underweight duration position and preference for accrual income throughout the year. As the outlook improved towards the tail end of 2018, the underweight position was reduced. Though inflation is beginning to cool, expectations in 2019 may not yet see significant yield reduction, on the tail end of hawkish policy, a weakening currency, and as elevated infrastructure spending (Php776 billion in capital outlays, or 4% of GDP) increases the need for funding. Nevertheless, the current environment presents some opportunity for accrual income, especially as corporations continue to take on debt at current rates ahead of a perceived slowdown in the economy. Overall, while 2019 will likely not see a significant rally for the local bond market, it will most probably be less challenging than 2018. Volatility may persist in the global space, and the Funds will be actively managed to take advantage of this. Investors in a bond fund must be prepared to withstand volatility as higher investment value is typically achieved over the medium- to long-term.
7

EQUITY MARKETThe Philippine Stock Exchange index (PSEi) dropped in 2018 amid a slew of domestic and international events. Locally, the shoot-up of inflation was a surprise (initial estimate was around 3.9%) to the markets. The current account deficit and the fiscal deficit also shot up amidst the Build, Build, Build program and higher expenditures from the government sector.
Meanwhile, the US-China trade war heightened risks for a global growth slowdown not only in the US and China, but in emerging countries as a whole due to their participation in the global supply chain.
The equity-themed Funds were defensively positioned, focused on big-cap quality names and overweight on Cash, given the tough environment. Sector-wise, the Funds retained preference in property, banking and consumer.
In the long run, the outlook for local equities remains positive on the back of the Philippines’ strong economic fundamentals. Moreover, inflation risk, one of the main concerns of investors in 2018, is forecasted to dissipate following the decline in global crude oil prices and implementation of rice tariffication in 1H2019.
In 2018, there was a global growth de-synchronization with the US growing faster-than-expected on the back of fiscal stimulus, while Europe and China slowed down. This, coupled with idiosyncratic geopolitical risks in Europe, resulted in US equity outperformance. However, the implementation of protectionist policies (e.g. trade tariffs) and central bank tightening amplified investors’ risk aversion, resulting to still negative returns for US (-6.24%), Europe (-13.10%), and Asia-ex Japan (-16.25%) equity indices.
In 2019, expectations are for EM equities to outperform developed markets (DM) as China stabilizes its economy on the back of various fiscal stimuli. The EM-DM growth differential will widen in 2019, making EM equities more attractive on a risk-return basis and prompting investors to tilt their portfolios towards EM. Moreover, the strength of the US dollar will most likely wane as the Fed pauses on its hiking cycle and as the US’ twin deficits start to kick in.
8
INCOME MARKETThe 10-year US Treasury bond yield moved from 3% levels in mid-2018 to 2.7% by year-end and going down further to around 2.5% on growth concerns due to weakening consumer demand, souring business sentiment, and not-so-strong federal spending due to a divided legislature in the US.
The global fixed income-themed Funds were also positioned defensively given the tough market environment, having an underweight duration position and preference for accrual income throughout the year. As the outlook improved towards the tail end of 2018, the underweight position was reduced.
In 2019, expectations for a more dovish US Fed is mounting and the risk of US rate hikes is abating. Forecasts for US growth and inflation have been revised lower on concerns about slowing global growth, particularly in China, which would also affect the US as well.
The Funds are banking on the position that a balanced allocation to government and high-quality corporate bonds is ideal. Recent trade tensions and concerns on global growth have caused a flight to safety. Lower US interest rates will boost attractiveness of emerging markets (EM) fixed income assets such as the Philippines.
9
EQUITY MARKET

9

MAX GROWTH ASIA FUNDFund Inception Date:February 28, 2013
The BPI-Philam Max Growth Asia Fund (the “Fund”) is a PHP-denominated single-asset fund created for peso variable life insurance contracts issued by BPI-Philam Life Assurance Corporation (BPI-Philam). The Fund is invested in a certificate issued by BNP Paribas Arbitrage Issuance BV. The certificate protects at least 80% of the principal at maturity and provides participation in the performance of an index composed of seventeen (17) stocks in the consumer, bank, infrastructure and telecommunication sectors in the Philippines, Indonesia and Thailand.
FUND PERFORMANCE a
2018 Return2017 Return2016 Return2015 Return2014 Return3 Year Return (annualized as of Dec 31, 2018) 5 Year Return (annualized as of Dec 31, 2018)Return since Inception (annualized as of Dec 31, 2018)
-2.76%5.47%0.15%
-5.92%-1.47%0.90%
-0.98%-19.72%
a Fund returns are calculated based on Net Asset Value per Unit Past performance is not indicative of future performance
10

10
PORTFOLIO STATISTICS (as of December 31, 2018)
Net Asset Value (NAV in PHP thousands) b
Net Asset Value per UnitRemaining Life (in years)
425,677 c
0.8028 1.16
b NAV is net of 3% policy management chargec Based on Audited Financial Statement
REFERENCE INDEX
Astra International Tbk PT Bank Rakyat Indonesia Persero Tbk PT Bank Mandiri Persero Tbk PT IndoFood Sukses Makmur Tbk PT Indocement Tunggal Prakarsa Tbk PT Perusahaan Gas Negara Persero Tbk PT Telekomunikasi Indonesia Persero Tbk PT Bank of the Philippine Islands DMCI Holdings Inc SM Investments Corp Philippine Long Distance Telephone Co Universal Robina Corp Thai Beverage PCL Advanced Info Service PCL CP ALL PCL Siam Commercial Bank PCL Siam Cement PCL
9.41%5.55%5.59%1.53%2.36%3.14%5.75%5.88%3.00%9.83%
11.49%3.13%4.28%8.77%5.57%8.18%6.54%
SHARE TARGET WEIGHT
MA
R 1
3
JUN
13
SE
P 1
3
DE
C 1
3
MA
R 1
4
JUN
14
SE
P 1
4
DE
C 1
4
MA
R 1
5
JUN
15
SE
P 1
5
DE
C 1
5
MA
R 1
6
JUN
16
SE
P 1
6
DE
C 1
6
MA
R 1
7
JUN
17
SE
P 1
7
DE
C 1
7D
EC
17
MA
R 1
8
JUN
18
SE
P 1
8
DE
C 1
8
-25%
-20%
-15%
-10%
-5%
0%
RETURN SINCE INCEPTION d
d Fund returns are calculated based on Net Asset Value per Unit
11

MAX GROWTH ASIA FUND 2Fund Inception Date:May 28, 2013
The BPI-Philam Max Growth Asia Fund 2 (the “Fund”) is a PHP-denominated single-asset fund created for peso variable life insurance contracts issued by BPI-Philam Life Assurance Corporation (BPI-Philam). The Fund is invested in a certificate issued by BNP Paribas Arbitrage Issuance BV. The certificate protects at least 80% of the principal at maturity and provides participation in the performance of an index composed of seventeen (17) stocks in the consumer, bank, infrastructure and telecommunication sectors in the Philippines, Indonesia and Thailand.
FUND PERFORMANCE a
2018 Return2017 Return2016 Return2015 Return2014 Return3 Year Return (annualized as of Dec 31, 2018) 5 Year Return (annualized as of Dec 31, 2018)Return since Inception (annualized as of Dec 31, 2018)
-4.32%6.07%0.34%
-6.64%-3.18%0.61%
-1.64%-21.28%
a Fund returns are calculated based on Net Asset Value per Unit Past performance is not indicative of future performance
12 13

12
PORTFOLIO STATISTICS (as of December 31, 2018)
Net Asset Value (NAV in PHP thousands) b
Net Asset Value per UnitRemaining Life (in years)
207,388 c
0.7872 1.41
b NAV is net of 3% policy management chargec Based on Audited Financial Statement
REFERENCE INDEX
Astra International Tbk PT Bank Rakyat Indonesia Persero Tbk PT Bank Mandiri Persero Tbk PT IndoFood Sukses Makmur Tbk PT Indocement Tunggal Prakarsa Tbk PT Perusahaan Gas Negara Persero Tbk PT Telekomunikasi Indonesia Persero Tbk PT Bank of the Philippine Islands DMCI Holdings Inc SM Investments Corp Philippine Long Distance Telephone Co Universal Robina Corp Thai Beverage PCL Advanced Info Service PCL CP ALL PCL Siam Commercial Bank PCL Siam Cement PCL
9.41%5.55%5.59%1.53%2.36%3.14%5.75%5.88%3.00%9.83%
11.49%3.13%4.28%8.77%5.57%8.18%6.54%
SHARE TARGET WEIGHT
RETURN SINCE INCEPTION d
d Fund returns are calculated based on Net Asset Value per Unit
MA
Y 13
AU
G 1
3
DEC
13
AP
R 1
4
AU
G 1
4
DEC
14
AP
R 1
5
AU
G 1
5
DEC
15
AP
R 1
6
AU
G 1
6
DEC
16
AP
R 1
7
AU
G 1
7
DEC
17
AP
R 1
8
AU
G 1
8
DEC
18
-25%
-20%
-15%
-10%
-5%
0%
-30%
13

MAX GROWTH ASIA FUND 3Fund Inception Date:August 28, 2013
The BPI-Philam Max Growth Asia Fund 3 (the “Fund”) is a PHP-denominated single-asset fund created for peso variable life insurance contracts issued by BPI-Philam Life Assurance Corporation (BPI-Philam). The Fund is invested in a certificate issued by BNP Paribas Arbitrage Issuance BV. The certificate protects at least 80% of the principal at maturity and provides participation in the performance of an index composed of seventeen (17) stocks in the consumer, bank, infrastructure and telecommunication sectors in the Philippines, Indonesia and Thailand.
FUND PERFORMANCE a
2018 Return2017 Return2016 Return2015 Return2014 Return3 Year Return (annualized as of Dec 31, 2018) 5 Year Return (annualized as of Dec 31, 2018)Return since Inception (annualized as of Dec 31, 2018)
-4.11%12.00%
1.04%-9.59%-3.80%2.76%
-1.15%-13.16%
a Fund returns are calculated based on Net Asset Value per Unit Past performance is not indicative of future performance
14

14
PORTFOLIO STATISTICS (as of December 31, 2018)
Net Asset Value (NAV in PHP thousands) b
Net Asset Value per UnitRemaining Life (in years)
116,973 c 0.8684
1.66
b NAV is net of 3% policy management chargec Based on Audited Financial Statement
REFERENCE INDEX
Astra International Tbk PT Bank Rakyat Indonesia Persero Tbk PT Bank Mandiri Persero Tbk PT IndoFood Sukses Makmur Tbk PT Indocement Tunggal Prakarsa Tbk PT Perusahaan Gas Negara Persero Tbk PT Telekomunikasi Indonesia Persero Tbk PT Bank of the Philippine Islands DMCI Holdings Inc SM Investments Corp Philippine Long Distance Telephone Co Universal Robina Corp Thai Beverage PCL Advanced Info Service PCL CP ALL PCL Siam Commercial Bank PCL Siam Cement PCL
9.41%5.55%5.59%1.53%2.36%3.14%5.75%5.88%3.00%9.83%
11.49%3.13%4.28%8.77%5.57%8.18%6.54%
SHARE TARGET WEIGHT
RETURN SINCE INCEPTION d
d Fund returns are calculated based on Net Asset Value per Unit
AU
G 1
3
DEC
13
AP
R 1
4
AU
G 1
4
DEC
14
AP
R 1
5
AU
G 1
5
DEC
15
AP
R 1
6
AU
G 1
6
DEC
16
AP
R 1
7
AU
G 1
7
DEC
17
AP
R 1
8
AU
G 1
8
DEC
18
-25%
-20%
-15%
-10%
-5%
0%
15

PESO BOND FUNDFund Inception Date:October 26, 2011
The BPI-Philam Peso Bond Fund (the “Fund”) is a PHP-denominated investment fund created for peso variable life insurance contracts issued by BPI-Philam Life Assurance Corporation (BPI-Philam). The Fund is invested primarily in the ALFM Peso Bond Fund, Inc. (ALFM Peso), an open-end investment company duly registered with the SEC. ALFM Peso aims to generate a steady stream of income through investments in a diversified portfolio of Philippine Peso denominated, high-grade fixed income instruments.
FUND PERFORMANCE a
2018 Return2017 Return2016 Return2015 Return2014 Return3 Year Return (annualized as of Dec 31, 2018) 5 Year Return (annualized as of Dec 31, 2018)Return since Inception (annualized as of Dec 31, 2018)
1.73%2.26%2.07%1.11%1.70%2.02%1.77%
25.06%
a Fund returns are calculated based on Net Asset Value per Unit Past performance is not indicative of future performance
16 17
FUND REVIEW
The Fund took on a more defensive stance in 2018 as concerns over inflation and tighter monetary policy were in the background, leading to a higher interest rate scenario. As a result, the Fund decreased its duration and booked more securities as held-to-collect to shield the Fund from further volatility. Towards the end of the year, the Fund shifted some of its liquidity into high-yielding money market instruments.

PORTFOLIO STATISTICS (as of December 31, 2018)
Net Asset Value (NAV in PHP thousands) b
Net Asset Value per Unit 9,671,325 c
1.2506
b NAV is net of 1.5% fund management chargec Based on Audited Financial Statement
PORTFOLIO COMPOSITION
Government Corporates Fixed Income Funds Cash, time deposits, and other receivables - net of liabilities Preferreds
12.3070.25
1.809.476.18
ALLOCATION % OF FUND
TOP THREE HOLDINGS - ALFM PESO BOND FUND
MPIC Notes JG Summit Holdings Bond Ayala Corporation Bond
NAME
3.062.602.51
% OF FUND
6/30/20208/27/20192/10/2025
MATURITY
RETURN SINCE INCEPTION d
d Fund returns are calculated based on Net Asset Value per Unit
OC
T 1
1
MA
Y 1
2
DE
C 1
2
JUN
13
JUN
13
JAN
14
JUL
14
FE
B 1
5
AU
G 1
5
MA
R 1
6
OC
T 1
6
AP
R 1
7
NO
V 1
7
MA
Y 1
8
DE
C 1
8
5%
10%
15%
20%
25%
30%
0%
17
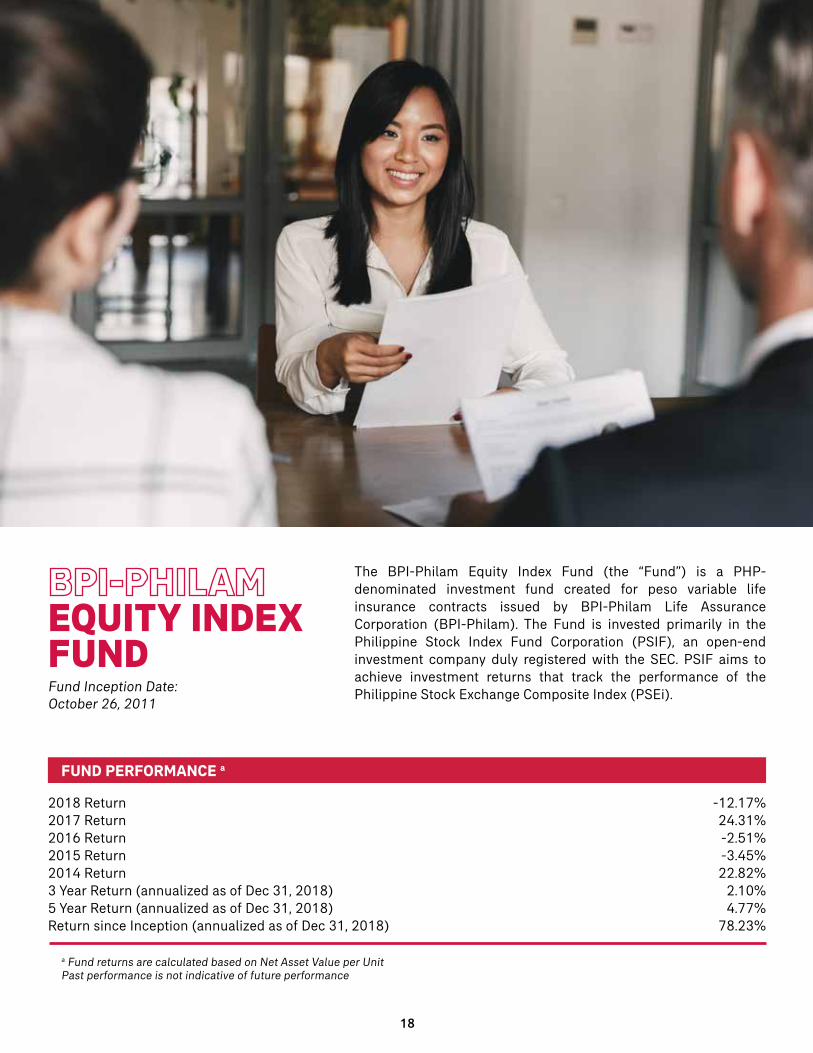
EQUITY INDEX FUNDFund Inception Date:October 26, 2011
The BPI-Philam Equity Index Fund (the “Fund”) is a PHP-denominated investment fund created for peso variable life insurance contracts issued by BPI-Philam Life Assurance Corporation (BPI-Philam). The Fund is invested primarily in the Philippine Stock Index Fund Corporation (PSIF), an open-end investment company duly registered with the SEC. PSIF aims to achieve investment returns that track the performance of the Philippine Stock Exchange Composite Index (PSEi).
FUND PERFORMANCE a
2018 Return2017 Return2016 Return2015 Return2014 Return3 Year Return (annualized as of Dec 31, 2018) 5 Year Return (annualized as of Dec 31, 2018)Return since Inception (annualized as of Dec 31, 2018)
-12.17%24.31%-2.51%-3.45%22.82%
2.10%4.77%
78.23%
a Fund returns are calculated based on Net Asset Value per Unit Past performance is not indicative of future performance
18 19

18
PORTFOLIO STATISTICS (as of December 31, 2018)
Net Asset Value (NAV in PHP thousands) b
Net Asset Value per Unit 5,879,839 c
1.7823
b NAV is net of 1.5% fund management chargec Based on Audited Financial Statement
PORTFOLIO COMPOSITION
Equities Cash, cash equivalents and other receivables-net of liabilities
99.850.15
ALLOCATION % OF FUND
TOP THREE HOLDINGS - PHILIPPINE STOCK INDEX FUND
SM Investments Corporation SM Prime Holdings, Inc. Ayala Land, Inc.
NAME
13.45 8.86 8.60
% OF FUND
RETURN SINCE INCEPTION d
d Fund returns are calculated based on Net Asset Value per Unit
OC
T 1
1
MA
Y 1
2
DE
C 1
2
JUN
13
JAN
14
JUL
14
FE
B 1
5
AU
G 1
5
MA
R 1
6
OC
T 1
6
AP
R 1
7
NO
V 1
7
MA
Y 1
8
DE
C 1
8
0%
20%
40%
60%
80%
100%
-20%
120%
19

GROWTH FUNDFund Inception Date:October 26, 2011
The BPI-Philam Growth Fund (the “Fund”) is a PHP-denominated investment fund created for peso variable life insurance contracts issued by BPI-Philam Life Assurance Corporation (BPI-Philam). The Fund is invested primarily in the ALFM Growth Fund, Inc. (ALFM Growth), an open-end investment company duly registered with the SEC. ALFM Growth aims to achieve long-term capital appreciation by investing in a diversified portfolio of equities and fixed income instruments.
FUND PERFORMANCE a
2018 Return2017 Return2016 Return2015 Return2014 Return3 Year Return (annualized as of Dec 31, 2018) 5 Year Return (annualized as of Dec 31, 2018)Return since Inception (annualized as of Dec 31, 2018)
-13.74%21.92%-2.84%-5.43%19.93%
0.72%3.00%
38.55%
a Fund returns are calculated based on Net Asset Value per Unit Past performance is not indicative of future performance
20 21
FUND REVIEW
As the PSEi was coming off its peak level of 9,000+ in late January 2018, the Fund lowered its equity exposure from 95% to 90%, and increased its fixed income portion from 5% to 10% of the portfolio. A couple of stocks which were non-index names were added to the Fund, with a view that these names will generate alpha.

20
PORTFOLIO STATISTICS (as of December 31, 2018)
Net Asset Value (NAV in PHP thousands) b
Net Asset Value per Unit 3,761,689 c
1.3855
b NAV is net of 2.0% fund management chargec Based on Audited Financial Statement
PORTFOLIO COMPOSITION
Equities Fixed Income Cash, time deposits, and other receivables - net of liabilities Money market funds
90.620.718.510.16
ALLOCATION % OF FUND
TOP THREE HOLDINGS - ALFM GROWTH FUND
SM Investments Corp Metropolitan Bank and Trust Co. Ayala Land, Inc.
NAME
9.72 7.09 5.75
% OF FUND
RETURN SINCE INCEPTION d
d Fund returns are calculated based on Net Asset Value per Unit
OC
T 1
1
MA
Y 1
2
DE
C 1
2
JUN
13
JAN
14
JUL
14
FE
B 1
5
AU
G 1
5
MA
R 1
6
OC
T 1
6
AP
R 1
7
NO
V 1
7
MA
Y 1
8
DE
C 1
8
10%
20%
30%
40%
50%
60%
0%
70%
21

ODYSSEY BOND FUNDFund Inception Date:September 12, 2012
The BPI-Philam Odyssey Bond Fund (the “Fund”) is a PHP-denominated investment fund created for peso variable life insurance contracts issued by BPI-Philam Life Assurance Corporation (BPI-Philam). The Fund is invested primarily in the Odyssey Peso Bond Fund, a Unit Investment Trust Fund (UITF) established under the authority of the Bangko Sentral ng Pilipinas (BSP). The Odyssey Peso Bond Fund seeks to achieve capital appreciation and income growth over a period of time by investing in a diversified portfolio of Philippine Peso denominated fixed income instruments.
FUND PERFORMANCE a
2018 Return2017 Return2016 Return2015 Return2014 Return3 Year Return (annualized as of Dec 31, 2018) 5 Year Return (annualized as of Dec 31, 2018)Return since Inception (annualized as of Dec 31, 2018)
-5.31%0.79%
-0.39%-0.70%4.63%
-1.67%-0.25%8.06%
a Fund returns are calculated based on Net Asset Value per Unit Past performance is not indicative of future performance
22 23

22
PORTFOLIO STATISTICS (as of December 31, 2018)
Net Asset Value (NAV in PHP thousands) b
Net Asset Value per Unit 1,722,162 c
1.0806
b NAV is net of 1.0% fund management chargec Based on Audited Financial Statement
PORTFOLIO COMPOSITION
Government Corporates Cash Time deposits and money market Other receivables -net of liabilities
69.0521.31
0.318.181.15
ALLOCATION % OF FUND
TOP TEN HOLDINGS - ODYSSEY PHILIPPINE HIGH CONVICTION EQUITY FUND
Fixed Rate Treasury Note Retail Treasury Bond Fixed Rate Treasury Note San Miguel Corporation Retail Treasury Bond Cyberzone Properties, Inc. Fixed Rate Treasury Note Time Deposit Petron Corp. Fixed Rate Treasury Note
NAME
35.70 10.62
7.55 7.08 6.30 5.92 5.39 4.26 4.19 2.39
% OF FUND
7/19/203112/4/20224/12/20255/25/20206/13/20211/7/20239/9/2025
10/27/20214/20/2024
MATURITY
RETURN SINCE INCEPTION d
d Fund returns are calculated based on Net Asset Value per Unit
SE
P 1
2
FE
B 1
3
JUL
13
DE
C 1
3
MA
Y 1
4
OC
T 1
4
MA
R 1
5
AU
G 1
5
JAN
16
JUN
16
AP
R 1
7
SE
P 1
7
FE
B 1
8
JUL
18
0%
5%
10%
15%
20%
25%
-5%
DE
C 1
8
23

ODYSSEY HIGH CONVICTION EQUITY FUNDFund Inception Date:September 12, 2012
The BPI-Philam Odyssey High Conviction Equity Fund (the “Fund”) is a PHP-denominated investment fund created for peso variable life insurance contracts issued by BPI-Philam Life Assurance Corporation (BPI-Philam). The Fund is invested primarily in the Odyssey Philippine High Conviction Equity Fund, a Unit Investment Trust Fund (UITF) established under the authority of the Bangko Sentral ng Pilipinas (BSP). The Odyssey Philippine High Conviction Equity Fund seeks to pursue long-term capital growth by investing in a concentrated portfolio of stocks listed in the Philippine Stock Exchange.
FUND PERFORMANCE a
2018 Return2017 Return2016 Return2015 Return2014 Return3 Year Return (annualized as of Dec 31, 2018) 5 Year Return (annualized as of Dec 31, 2018)Return since Inception (annualized as of Dec 31, 2018)
-16.48%20.56%-4.03%
-12.41%22.74%-1.14%0.77%
-29.97%
a Fund returns are calculated based on Net Asset Value per Unit Past performance is not indicative of future performance
24 25

24
PORTFOLIO STATISTICS (as of December 31, 2018)
Net Asset Value (NAV in PHP thousands) b
Net Asset Value per Unit 792,664 c
0.7003
b NAV is net of 2.5% fund management chargec Based on Audited Financial Statement
PORTFOLIO COMPOSITION
Equities Cash Time Deposits and Money Market Other receivables-net of liabilities
97.420.401.860.32
ALLOCATION % OF FUND
TOP TEN HOLDINGS - ODYSSEY PHLIPPINE HIGH CONVICTION EQUITY FUND
SM Investments Corporation SM Prime Holdings, Inc Ayala Corporation Ayala Land, Inc. Bank of the Philippine Islands BDO Unibank, Inc. Metropolitan Bank & Trust Co. JG Summit Holdings, Inc. Jollibee Foods Corp. Megaworld Corp.
NAME
13.32 10.14 10.02
9.87 8.09 7.93 5.83 4.47 4.36 2.99
% OF FUND
RETURN SINCE INCEPTION d
d Fund returns are calculated based on Net Asset Value per Unit
SE
P 1
2
FE
B 1
3
JUL
13
DE
C 1
3
MA
Y 1
4
OC
T 1
4
MA
R 1
5
AU
G 1
5
JAN
16
JUN
16
AP
R 1
7
SE
P 1
7
FE
B 1
8
JUL
18
-30%
-20%
-10%
0%
10%
20%
-40%
DE
C 1
8
25
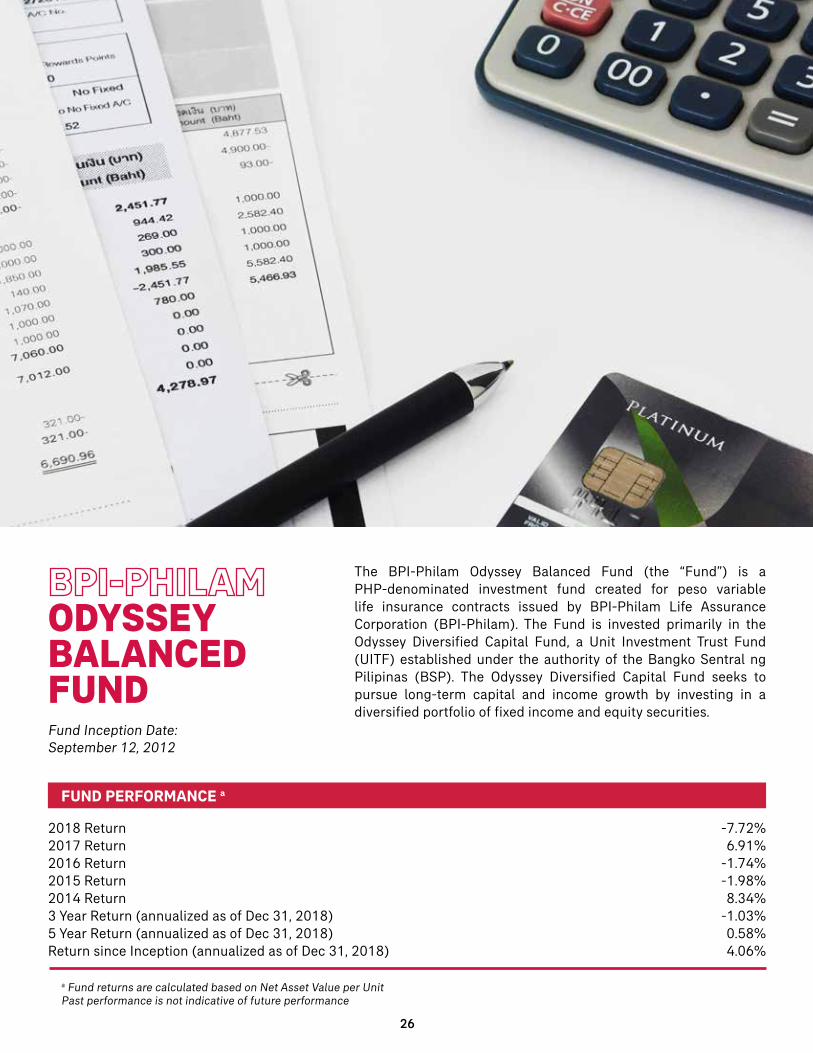
ODYSSEY BALANCED FUNDFund Inception Date:September 12, 2012
The BPI-Philam Odyssey Balanced Fund (the “Fund”) is a PHP-denominated investment fund created for peso variable life insurance contracts issued by BPI-Philam Life Assurance Corporation (BPI-Philam). The Fund is invested primarily in the Odyssey Diversified Capital Fund, a Unit Investment Trust Fund (UITF) established under the authority of the Bangko Sentral ng Pilipinas (BSP). The Odyssey Diversified Capital Fund seeks to pursue long-term capital and income growth by investing in a diversified portfolio of fixed income and equity securities.
FUND PERFORMANCE a
2018 Return2017 Return2016 Return2015 Return2014 Return3 Year Return (annualized as of Dec 31, 2018) 5 Year Return (annualized as of Dec 31, 2018)Return since Inception (annualized as of Dec 31, 2018)
-7.72%6.91%
-1.74%-1.98%8.34%
-1.03%0.58%4.06%
a Fund returns are calculated based on Net Asset Value per Unit Past performance is not indicative of future performance
26 27

26
PORTFOLIO STATISTICS (as of December 31, 2018)
Net Asset Value (NAV in PHP thousands) b
Net Asset Value per Unit 1,673,244 c
1.0406
b NAV is net of 1.5% fund management chargec Based on Audited Financial Statement
PORTFOLIO COMPOSITION
Equities Fixed Income Cash Time deposits and money market Other receivables -net of liabilities
45.5343.20
0.4510.23
0.59
ALLOCATION % OF FUND
TOP TEN HOLDINGS - ODYSSEY DIVERSIFIED CAPITAL FUND
Fixed Rate Treasury Note Time Deposit SM Investments Corporation Retail Treasury Bond Ayala Land, Inc. SM Prime Holdings, Inc. Banco De Oro Unibank, Inc. Ayala Corporation Fixed Rate Treasury Note Retail Treasury Bond
NAME
21.826.005.615.404.183.943.913.623.613.34
% OF FUND
7/19/1931
12/4/2022
4/12/20256/13/2021
MATURITY
RETURN SINCE INCEPTION d
d Fund returns are calculated based on Net Asset Value per Unit
SE
P 1
2
FE
B 1
3
JUL
13
DE
C 1
3
MA
Y 1
4
OC
T 1
4
MA
R 1
5
AU
G 1
5
JAN
16
JUN
16
AP
R 1
7
SE
P 1
7
FE
B 1
8
JUL
18
0%
5%
10%
15%
20%
-5%
DE
C 1
8
27

BALANCED FUNDFund Inception Date:March 12, 2015
The BPI-Philam Balanced Fund (the “Fund”) is a PHP-denominated investment fund created for peso variable life insurance contracts issued by BPI-Philam Life Assurance Corporation (BPI-Philam). The Fund is invested primarily in BPI Balanced Fund, a Unit Investment Trust Fund (UITF) established under the authority of the Bangko Sentral ng Pilipinas (BSP). The BPI Balanced Fund intends to achieve long term capital growth derived from a diversified portfolio of equity and fixed income securities.
FUND PERFORMANCE a
2018 Return2017 Return2016 Return2015 Return3 Year Return (annualized as of Dec 31, 2018) Return since Inception (annualized as of Dec 31, 2018)
-6.37%12.12%-0.99%-5.26%1.30%
-1.53%
a Fund returns are calculated based on Net Asset Value per Unit Past performance is not indicative of future performance
28

28
PORTFOLIO STATISTICS (as of December 31, 2018)
Net Asset Value (NAV in PHP thousands) b
Net Asset Value per Unit 2,237,674 c
0.9847
b NAV is net of 1.5% policy managementc Based on Audited Financial Statement
PORTFOLIO COMPOSITION
Equities Fixed Income Cash, cash equivalents and other receivables-net of liabilities
50.132.74
47.13
ALLOCATION % OF FUND
TOP TEN HOLDINGS - BPI BALANCED FUND
Time Deposit Time Deposit Time Deposit Time Deposit SM Investments Corporation Ayala Land, Inc. Time Deposit Time Deposit SM Prime Holdings, Inc. Banco de Oro Unibank, Inc.
NAME
8.55 5.70 5.70 5.70 5.60 4.79 4.75 4.75 4.30 3.91
% OF FUND
RETURN SINCE INCEPTION d
d Fund returns are calculated based on Net Asset Value per Unit
MA
R 1
5
JUN
15
SE
P 1
5
DE
C 1
5
MA
R 1
5
JUN
16
SE
P 1
6
MA
R 1
7
JUN
17
SE
P 1
7
DE
C 1
7
MA
R 1
8
JUN
18
SE
P 1
8
-8%
-5%
-3%
0%
3%
5%
-10%
8%
DE
C 1
8
10%
29
EQUITY INDEX FUND 2Fund Inception Date:February 13, 2015
The BPI-Philam Equity Index Fund 2 (the “Fund”) is a PHP-denominated investment fund created for peso variable life insurance contracts issued by BPI-Philam Life Assurance Corporation (BPI-Philam). The Fund is invested primarily in the BPI Philippine Equity Index Fund, a Unit Investment Trust Fund (UITF) established under the authority of the Bangko Sentral ng Pilipinas (BSP). The BPI Philippine Equity Index Fund intends to achieve investment returns that track the performance of the Philippine Stock Exchange Index (PSEi) by investing in a diversified portfolio of stocks comprising the PSEi in the same weights as the index, to the extent practicable.
FUND PERFORMANCE a
2018 Return2017 Return2016 Return2015 Return3 Year Return (annualized as of Dec 31, 2018) Return since Inception (annualized as of Dec 31, 2018)
-12.35%23.98%-1.92%
-10.57%2.15%
-4.69%
a Fund returns are calculated based on Net Asset Value per Unit Past performance is not indicative of future performance
30 31
PORTFOLIO STATISTICS (as of December 31, 2018)
Net Asset Value (NAV in PHP thousands) b
Net Asset Value per Unit 24,926,497 c
0.9531
b NAV is net of 1.5% policy managementc Based on Audited Financial Statement
PORTFOLIO COMPOSITION
Equities Cash, cash equivalents and other receivables-net of liabilities
99.750.25
ALLOCATION % OF FUND
TOP TEN HOLDINGS - BPI PHILIPPINE EQUITY INDEX FUND
SM Investments Corp. SM Prime Holdings, Inc. Ayala Land, Inc. BDO Unibank, Inc. Ayala Corporation Bank of the Philippine Islands JG Summit Holdings, Inc. Metropolitan Bank & Trust Co. Jollibee Foods Corp. Aboitiz Equity Venture, Inc.
NAME
13.43 8.85 8.59 7.11 6.75 5.61 4.52 4.36 3.86 3.85
% OF FUND
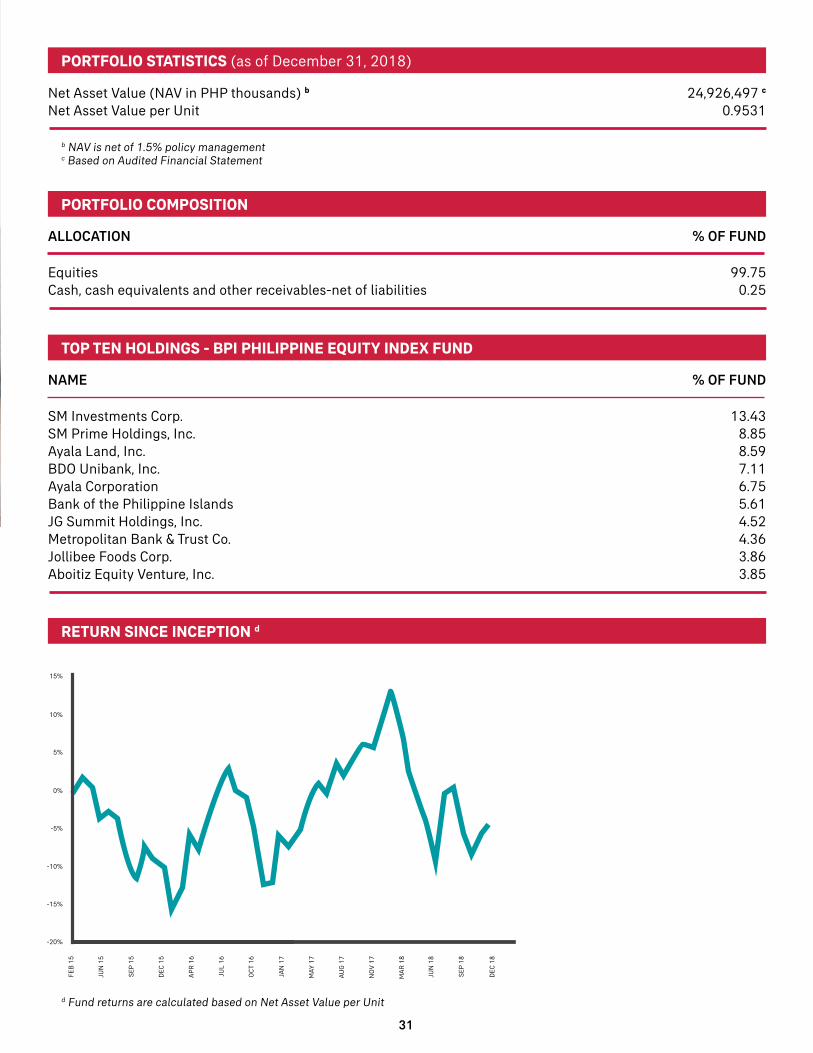
RETURN SINCE INCEPTION d
d Fund returns are calculated based on Net Asset Value per Unit
FE
B 1
5
JUN
15
SE
P 1
5
DE
C 1
5
AP
R 1
6
JUL
16
OC
T 1
6
JAN
17
MA
Y 1
7
AU
G 1
7
NO
V 1
7
MA
R 1
8
JUN
18
SE
P 1
8
-15%
-10%
-5%
0%
5%
10%
-20%
15%
DE
C 1
8
31

PHILIPPINE HIGH DIVIDEND EQUITY FUND Fund Inception Date:March 12, 2015
The BPI-Philam Philippine High Dividend Equity Fund (the “Fund”) is a PHP-denominated investment fund created for peso variable life insurance contracts issued by BPI-Philam Life Assurance Corporation (BPI-Philam). The Fund is invested primarily in the BPI Philippine High Dividend Equity Fund, a Unit Investment Trust Fund (UITF) established under the authority of the Bangko Sentral ng Pilipinas (BSP). The BPI Philippine High Dividend Equity Fund intends to total return through a combination of current income and long-term capital appreciation by investing in listed companies that have high dividend yields or have established a history of dividend payouts.
FUND PERFORMANCE a
2018 Return2017 Return2016 Return2015 Return3 Year Return (annualized as of Dec 31, 2018) Return since Inception (annualized as of Dec 31, 2018)
-11.53%22.76%-3.25%-9.71%1.66%
-5.13%
a Fund returns are calculated based on Net Asset Value per Unit Past performance is not indicative of future performance
32 33

32
PORTFOLIO STATISTICS (as of December 31, 2018)
Net Asset Value (NAV in PHP thousands) b
Net Asset Value per Unit 3,950,284 c
0.9487
b NAV is net of 1.5% policy managementc Based on Audited Financial Statement
PORTFOLIO COMPOSITION
Equities Cash, cash equivalents and other receivables-net of liabilities
93.76.3
ALLOCATION % OF FUND
TOP TEN HOLDINGS - BPI PHILIPPINE HIGH DIVIDEND EQUITY FUND
SM Investments Corporation Ayala Land, Inc. SM Prime Holdings, Inc. BDO Unibank, Inc. Ayala Corporation Bank of the Philippine Islands Manila Electric Company Metropolitan Bank & Trust Co. JG Summit Holdings, Inc. PLDT Inc.
NAME
12.65 8.54 8.31 6.96 6.29 5.34 4.31 4.16 3.92 3.55
% OF FUND
RETURN SINCE INCEPTION d
d Fund returns are calculated based on Net Asset Value per Unit
MA
R 1
5
AU
G 1
5
JAN
16
JUN
16
NO
V 1
6
AP
R 1
7
SE
P 1
7
FEB
18
JUL
18
DEC
18
-16
-12%
-8%
-4%
0%
4%
-20%
8%
12%
16%
33

GROWTH FUND 2Fund Inception Date:March 17, 2017
The BPI-Philam Growth Fund 2 (the “Fund”) is a PHP-denominated investment fund created for peso variable life insurance contracts issued by BPI-Philam Life Assurance Corporation (BPI-Philam). This is a segregated investment account which provides aggressive investors with long-term capital appreciation from a diversified portfolio of equities and fixed income instruments. This fund shall invest at least 90% of its net assets in equity securities under normal market conditions.
FUND PERFORMANCE a
2018 Return2017 ReturnReturn since Inception (annualized as of Dec 31, 2018)
-13.45%11.04%-3.89%
a Fund returns are calculated based on Net Asset Value per Unit Past performance is not indicative of future performance
34

34
PORTFOLIO STATISTICS (as of December 31, 2018)
Net Asset Value (NAV in PHP thousands) b
Net Asset Value per Unit 101,427 c
0.9611
b NAV is net of 2.0% policy managementc Based on Audited Financial Statement
PORTFOLIO COMPOSITION
Equities Fixed Income Cash, time deposits, and other receivables - net of liabilities Money market funds
90.620.718.510.16
ALLOCATION % OF FUND
TOP HOLDINGS
SM Investments Corp Metropolitan Bank and Trust Co. Ayala Land, Inc.
NAME
9.72 7.09 5.75
% OF FUND
RETURN SINCE INCEPTION d
d Fund returns are calculated based on Net Asset Value per Unit
MA
R 1
7
JUN
17
AU
G 1
7
OC
T 1
7
JAN
18
MA
R 1
8
MA
Y 1
8
AU
G 1
8
AU
G 1
8
OC
T 1
8
DE
C 1
8
-10%
-%%
0%
5%
10%
`15%
20%
35

EQUITY VALUE FUNDFund Inception Date:March 31, 2017
The BPI-Philam Equity Value Fund (the “Fund”) is a PHP-denominated investment fund created for peso variable life insurance contracts issued by BPI-Philam Life Assurance Corporation (BPI-Philam). The Fund is invested primarily in the BPI Equity Value Fund, a Unit Investment Trust Fund (UITF) established under the authority of the Bangko Sentral ng Pilipinas (BSP). The BPI Equity Value Fund provides aggressive investors long term capital growth by investing in equity securities issued by Philippine domiciled companies which have a value style bias.
FUND PERFORMANCE a
2018 Return2017 ReturnReturn since Inception (annualized as of Dec 31, 2018)
-12.56%11.00%-2.94%
a Fund returns are calculated based on Net Asset Value per Unit Past performance is not indicative of future performance
36 37

36
PORTFOLIO STATISTICS (as of December 31, 2018)
Net Asset Value (NAV in PHP thousands) b
Net Asset Value per Unit 61,404 c
0.9706
b NAV is net of 1.5% policy managementc Based on Audited Financial Statement
PORTFOLIO COMPOSITION
Equities Cash, cash equivalents and other receivables-net of liabilities
93.36.7
ALLOCATION % OF FUND
TOP TEN HOLDINGS - BPI PHILIPPINE EQUITY INDEX FUND
SM Investments Corp. Ayala Land, Inc. SM Prime Holdings, Inc. Banco de Oro Unibank, Inc. Ayala Corporation Bank of the Philippine Islands JG Summit Holdings, Inc. Aboitiz Equity Ventures, Inc. Metropolitan Bank & Trust Co. Philippine Long Distance Telephone Co.
NAME
12.10 9.10 8.30 7.40 6.71 6.36 4.31 3.82 3.36 3.31
% OF FUND
RETURN SINCE INCEPTION d
d Fund returns are calculated based on Net Asset Value per Unit
-5%
0%
5%
10%
15%
20%
-10%
AP
R 1
7
JUN
17
JUL
17
AU
G 1
7
OC
T 1
7
NO
V 1
7
DE
C 1
7
FE
B 1
8
MA
R 1
8
AP
R 1
8
JUN
18
JUL
18
AU
G 1
8
OC
T 1
8
NO
V 1
8
DE
C 1
8
37

PORTFOLIO STATISTICS (as of December 31, 2018)
Net Asset Value (NAV in PHP thousands) b
Net Asset Value per Unit 35,916 c
0.9270
b NAV is net of 1.75% policy managementc Based on Audited Financial Statement
ACTIVE ALLOCATION FUNDFund Inception Date:June 14, 2017
The BPI-Philam Active Allocation Fund (the “Fund”) is a PHP-denominated investment fund created for peso variable life insurance contracts issued by BPI-Philam Life Assurance Corporation (BPI-Philam). This is a segregated investment account which provides aggressive investors with long-term capital and income growth by investing in a diversified portfolio of fixed income and equity securities. The fund may be invested up to 70% in local equities or up to 70% domestic fixed income depending on prevailing market conditions.
FUND PERFORMANCE a
2018 Return2017 ReturnReturn since Inception (annualized as of Dec 31, 2018)
-10.37%3.43%
-7.30%
a Fund returns are calculated based on Net Asset Value per Unit Past performance is not indicative of future performance
38 39

38
PORTFOLIO COMPOSITION
Equities Fixed Income Cash Time deposit and money market Other receivables - net of liabilities
45.5343.20.45
10.230.59
ALLOCATION % OF FUND
TOP EQUITY HOLDINGS
SM Investments Corp. Ayala Land, Inc. SM Prime Holdings, Inc. Banco de Oro Unibank, Inc. Ayala Corporation
NAMES
5.36 4.94 4.69 3.59 3.53
% OF FUND
TOP FIXED INCOME HOLDINGS
Fixed Rate Treasury Note 7/19/31 Time Deposit Retail Treasury Bond 12/4/22 Fixed Rate Treasury Note 4/12/25 Retail Treasury Bond 6/13/21
NAMES
21.82 6.00 5.40 3.61 3.34
% OF FUND
RETURN SINCE INCEPTION d
d Fund returns are calculated based on Net Asset Value per Unit
-10%
--8%
-6%
-4%
-2%
0%
-12%
2%
4%
6%
JUN
17
JUL
17
AU
G 1
7
SE
P 1
7
OC
T 1
7
NO
V 1
7
DE
C 1
7
JAN
18
FE
B 1
8
MA
R 1
8
AP
R 1
8
MA
Y 1
8
JUN
18
JUL1
8
SE
P1
8
8%
OC
T 1
8
NO
V 1
8
DE
C 1
8
39

HIGH-WATER MARK FUND 2019Fund Inception Date:February 24, 2010
The BPI-Philam High-Water Mark (HWM) Fund 2019 (the “Fund”) is a USD-denominated single-asset fund created for dollar variable life insurance contracts issued by BPI-Philam Life Assurance Corporation (BPI-Philam). The Fund locks in the highest NAVPU of the fund at maturity. The fund is invested in a 10-year structured note issued by Barclays Bank PLC, which is exposed to various asset classes and markets, such as global and emerging market equities and bonds. On a daily basis, the note allocates its exposure between risky and risk-free assets to maximize returns while ensuring that the highest NAVPU is protected at maturity.
FUND PERFORMANCE a
2018 Return2017 Return2016 Return2015 Return2014 Return3 Year Return (annualized as of Dec 31, 2018) 5 Year Return (annualized as of Dec 31, 2018)Return since Inception (annualized as of Dec 31, 2018)
-0.65%-1.30%-1.26%-0.05%0.46%
-1.07%-0.56%5.69%
a Fund returns are calculated based on Net Asset Value per Unit Past performance is not indicative of future performance
40 41

40
PORTFOLIO STATISTICS (as of December 31, 2018)
Net Asset Value (NAV in PHP thousands) b
Net Asset Value per UnitRemaining Life (in years)
28,415 c
1.1950 0.36
b NAV is net of 2.2% policy managementc Based on Audited Financial Statement
RETURN SINCE INCEPTION d
d Fund returns are calculated based on Net Asset Value per Unit
Peak return = 13.76% as of 05/03/2013
-1%
3%
7%
11%
15%
-5%
FE
B 1
0
AU
G 1
0
JAN
11
JUN
11
NO
V 1
1
MA
Y 1
2
OC
T 1
2
MA
R 1
3
AU
G 1
3
FE
B 1
4
JUL
14
DE
C 1
4
JUN
15
NO
V 1
5
AP
R 1
6
SE
P 1
6
MA
R 1
7
AU
G 1
7
JAN
18
JUN
18
DE
C 1
8
41
HIGH-WATER MARK FUND 2021Fund Inception Date:May 5, 2011
The BPI-Philam High-Water Mark (HWM) Fund 2021 (the “Fund”) is a USD-denominated single-asset fund created for dollar variable life insurance contracts issued by BPI-Philam Life Assurance Corporation (BPI-Philam). The Fund locks in the highest NAVPU of the fund at maturity. The fund is invested in a 10-year structured note issued by Barclays Bank PLC, which is exposed to various asset classes and markets, such as global and emerging market equities, commodities and bonds. On a daily basis, the note allocates its exposure between risky and risk-free assets to maximize returns while ensuring that the highest NAVPU is protected at maturity.
FUND PERFORMANCE a
2018 Return2017 Return2016 Return2015 Return2014 Return3 Year Return (annualized as of Dec 31, 2018) 5 Year Return (annualized as of Dec 31, 2018)Return since Inception (annualized as of Dec 31, 2018)
-1.60%-1.63%-1.75%0.15%3.28%
-1.66%-0.33%0.61%
a Fund returns are calculated based on Net Asset Value per Unit Past performance is not indicative of future performance
42 43
42
PORTFOLIO STATISTICS (as of December 31, 2018)
Net Asset Value (NAV in PHP thousands) b
Net Asset Value per UnitRemaining Life (in years)
3,560 c
1.0061 2.35
b NAV is net of fund management charge, which is 1.05% of the Account Value plus 1.70% of the Outstanding Premium, where Outstanding Premium is defined as outstanding units multiplied by the Unit Price at Fund Inception Datec Based on Audited Financial Statement
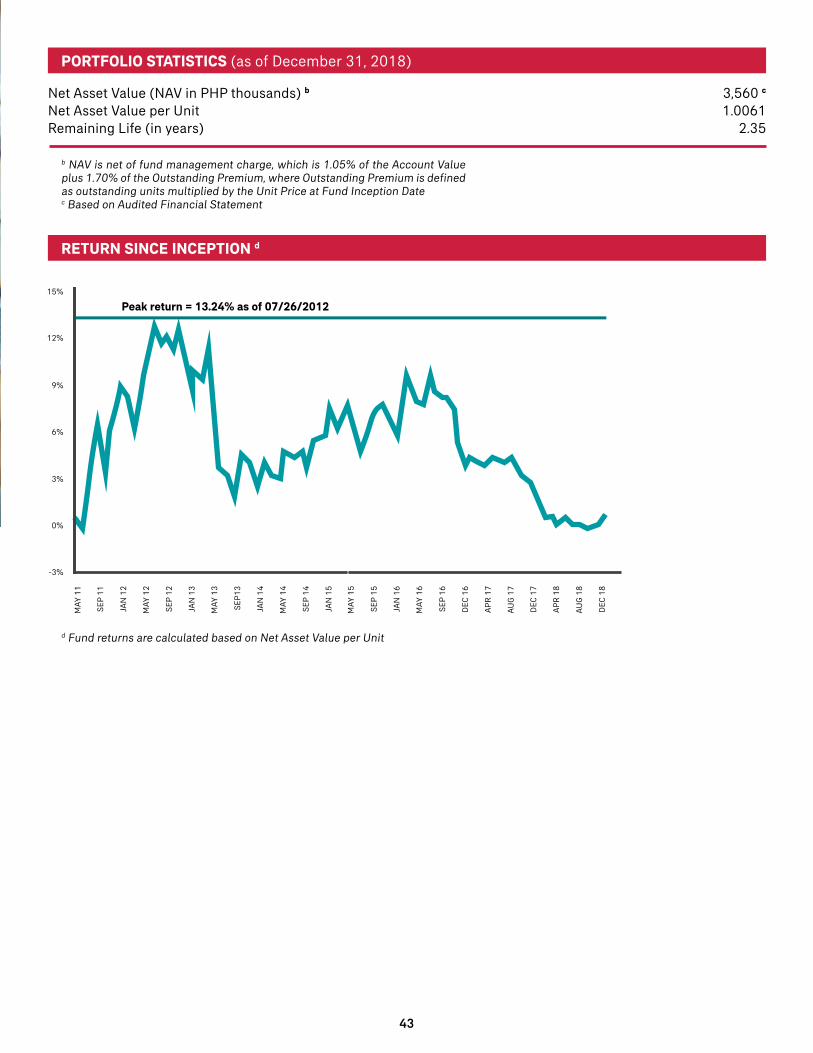
RETURN SINCE INCEPTION d
d Fund returns are calculated based on Net Asset Value per Unit
0%
3%
6%
9%
12%
15%
-3%
MA
Y 1
1
SE
P 1
1
JAN
12
MA
Y 1
2
SE
P 1
2
JAN
13
MA
Y 1
3
SE
P1
3
JAN
14
MA
Y 1
4
SE
P 1
4
JAN
15
MA
Y 1
5
SE
P 1
5
JAN
16
MA
Y 1
6
SE
P 1
6
DE
C 1
6
AP
R 1
7
AU
G 1
7
DE
C 1
7
AP
R 1
8
AU
G 1
8
DE
C 1
8
Peak return = 13.24% as of 07/26/2012
43

US DOLLAR BOND FUNDFund Inception Date:February 23, 2011
The BPI-Philam US Dollar Bond Fund (the “Fund”) is a USD-denominated investment fund created for dollar variable life insurance contracts issued by BPI-Philam Life Assurance Corporation (BPI-Philam). The Fund is invested in a diversified portfolio of USD-denominated fixed income instruments to achieve a balance of income and capital growth in the medium to long-term.
FUND PERFORMANCE a
2018 Return2017 Return2016 Return2015 Return2014 Return3 Year Return (annualized as of Dec 31, 2018) 5 Year Return (annualized as of Dec 31, 2018)Return since Inception (annualized as of Dec 31, 2018)
-0.33%4.42%2.56%2.97%6.80%2.20%3.26%
36.05%
a Fund returns are calculated based on Net Asset Value per Unit Past performance is not indicative of future performance
44

44
PORTFOLIO STATISTICS (as of December 31, 2018)
Net Asset Value (NAV in USD thousands) b
Net Asset Value per Unit 128,641 c
1.3605
b NAV is net of 0.50% fund management changec Based on Audited Financial Statement
PORTFOLIO COMPOSITION
Government Corporates Fixed Income Funds Cash, time deposits and other receivables - net of liabilities
34.55 32.28
0.55 32.62
ALLOCATION % OF FUND
TOP THREE HOLDINGS
Republic of the Philippines BondsRepublic of the Philippines BondsEnergy Development Corp. Bond
NAME
5.62 5.46 5.27
% OF FUND
3/16/20251/15/20191/20/2021
MATURITY
RETURN SINCE INCEPTION d
d Fund returns are calculated based on Net Asset Value per Unit
3%
8%
13%
18%
23%
28%
-2%
33%
38%
FE
B 1
1
JUL
11
DE
C 1
1
MA
Y 1
2
OC
T 1
2
MA
R 1
3
AU
G 1
3
JAN
14
JUN
14
AP
R 1
5
SE
P 1
5
FE
B 1
5
JUL
16
NO
V 1
6
AP
R 1
7
SE
P 1
7
FE
B 1
8
JUL
18
DE
C 1
8
45

US DOLLAR BOND FUND 2Fund Inception Date:April 18, 2016
The BPI-Philam US Dollar Bond Fund 2 (the “Fund”) is a USD-denominated investment fund created for dollar variable life insurance contracts issued by BPI-Philam Life Assurance Corporation (BPI-Philam). The Fund is invested in USD-denominated fixed income instruments to achieve a balance of income and capital growth in the medium to long term.
FUND PERFORMANCE a
2018 Return2017 Return2016 ReturnReturn since Inception (annualized as of Dec 31, 2018)
-0.92%3.03%
-3.07%-1.05%
a Fund returns are calculated based on Net Asset Value per Unit Past performance is not indicative of future performance
46

46
PORTFOLIO STATISTICS (as of December 31, 2018)
Net Asset Value (NAV in USD thousands) b
Net Asset Value per Unit 61,029 c
0.9895
b NAV is net of 1.25% fund management changec Based on Audited Financial Statement
PORTFOLIO COMPOSITION
Government Corporates Fixed Income Funds Cash and other receivables
34.55 32.28
0.55 32.62
ALLOCATION % OF FUND
TOP THREE HOLDINGS
Republic of the Philippines BondsRepublic of the Philippines BondsEnergy Development Corp. Bond
NAME
5.62 5.46 5.27
% OF FUND
3/16/20251/15/20191/20/2021
MATURITY
RETURN SINCE INCEPTION d
d Fund returns are calculated based on Net Asset Value per Unit
-3%
-3%
-2%
-2%
-1%
-1%
-4%
0%
1%
1%
AP
R 1
6
JUN
16
AU
G 1
6
OC
T 1
6
DE
C 1
7
FE
B 1
7
AP
R 1
7
JUN
17
AU
G 1
7
OC
T 1
7
DE
C 1
7
FE
B 1
8
AP
R 1
8
JUN
18
AU
G 1
8
2%
OC
T 1
8
DE
C 1
8
47

GLOBAL EQUITY FUNDFund Inception Date:March 12, 2015
The BPI-Philam Global Equity Fund (the “Fund”) is a USD-denominated investment fund created for dollar variable life insurance contracts issued by BPI-Philam Life Assurance Corporation (BPI-Philam). The Fund is invested primarily in the BPI Global Equity Fund-of-Funds, a Unit Investment Trust Fund (UITF) established under the authority of the Bangko Sentral ng Pilipinas (BSP). The BPI Global Equity Fund-of-Funds aims to provide excess returns over the MSCI Index (USD) by investing in a diversified portfolio of global equities.
FUND PERFORMANCE a
2018 Return2017 Return2016 Return2015 Return3 Year Return (annualized as of Dec 31, 2018) Return since Inception (annualized as of Dec 31, 2018)
-8.57%24.24%-0.57%-0.71%4.14%
12.14%
a Fund returns are calculated based on Net Asset Value per Unit Past performance is not indicative of future performance
48 49

48
PORTFOLIO STATISTICS (as of December 31, 2018)
Net Asset Value (NAV in PHP thousands) b
Net Asset Value per Unit 50,667 c
1.1214
b NAV is net of 1.5% policy managementc Based on Audited Financial Statement
PORTFOLIO COMPOSITION
Equity funds Cash, cash equivalents and other receivables-net of liabilities
94.35 5.65
ALLOCATION % OF FUND
TOP HOLDINGS - BPI GLOBAL EQUITY FUND-OF-FUNDS
Wellington Global Quality Growth FundSPDR S&P 500 ETF Wellington Strategic European FundWellington Global Health Care BOCH Deposit Wells Fargo EM Income Fund UBS Global EM Opportunity FundCHIB Time Deposit Wellington Asia Technology Fund
NAME
40.01 26.10 15.79
6.72 3.36 2.64 2.62 1.69 1.07
% OF FUND
RETURN SINCE INCEPTION d
d Fund returns are calculated based on Net Asset Value per Unit
-5%
0%
5%
10%
15%
20%
-10%
25%
30%
35%
MA
R 1
5
JUN
15
SE
P 1
5
NO
V 1
5
FE
B 1
6
MA
Y 1
6
JUL
16
OC
T 1
6
MA
R 1
7
JUN
17
AU
G 1
7
NO
V 1
7
FE
B 1
8
AP
R 1
8
JUL
18
OC
T 1
8
DE
C 1
8
49

ODYSSEY ASIA PACIFIC HIGH DIVIDEND EQUITY FUNDFund Inception Date:March 12, 2015
The BPI-Philam Odyssey Asia Pacific High Dividend Equity Fund (the “Fund”) is a USD-denominated investment fund created for dollar variable life insurance contracts issued by BPI-Philam Life Assurance Corporation (BPI-Philam). The Fund is invested primarily in the BPI Odyssey Asia Pacific High Dividend Equity Fund, a Unit Investment Trust Fund (UITF) established under the authority of the Bangko Sentral ng Pilipinas (BSP). The BPI Odyssey Asia Pacific High Dividend Equity Fund intends to pursue long-term capital appreciation by investing in a diversified portfolio of attractively priced stocks with high dividend yields in the Asia Pacific region.
FUND PERFORMANCE a
2018 Return2017 Return2016 Return2015 Return3 Year Return (annualized as of Dec 31, 2018) Return since Inception (annualized as of Dec 31, 2018)
-8.85%20.00%
3.76%-10.73%
4.31%1.32%
a Fund returns are calculated based on Net Asset Value per Unit Past performance is not indicative of future performance
50 51

50
PORTFOLIO STATISTICS (as of December 31, 2018)
Net Asset Value (NAV in PHP thousands) b
Net Asset Value per Unit 5,394 c
1.0132
b NAV is net of 1.75% policy managementc Based on Audited Financial Statement
PORTFOLIO COMPOSITION
Equities Cash, cash equivalents and other receivables-net of liabilities
97.09 2.91
ALLOCATION % OF FUND
TOP HOLDINGS - ODYSSEY ASIA PACIFIC HIGH DIVIDEND EQUITY FUND
Taiwan Semiconductor ManufacturingDBS Group Holdings Samsung Electronics Transurban Group Bangkok Bank China Life Insurance United Overseas Bank Australia and New Zealand Banking GroupBOC Hong Kong Shinhan Financial Group
NAME
4.95 4.38 4.09 3.42 3.29 3.16 3.08 2.96 2.92 2.85
% OF FUND
RETURN SINCE INCEPTION d
d Fund returns are calculated based on Net Asset Value per Unit
-15%
-10%
-5%
0%
5%
10%
-20%
15%
20%
25%
MA
R 1
5
JUN
15
SE
P 1
5
DE
C 1
5
MA
R 1
6
JUN
16
SE
P 1
6
DE
C 1
6
MA
R 1
7
JUN
17
SE
P 1
7
DE
C 1
7
MA
R 1
8
JUN
18
SE
P 1
8
DE
C 1
8
51

ODYSSEY PHILIPPINE DOLLAR BOND FUNDFund Inception Date:March 12, 2015
The BPI-Philam Odyssey Philippine Dollar Bond Fund (the “Fund”) is a USD-denominated investment fund created for dollar variable life insurance contracts issued by BPI-Philam Life Assurance Corporation (BPI-Philam). The Fund is invested primarily in the BPI Odyssey Philippine Dollar Bond Fund, a Unit Investment Trust Fund (UITF) established under the authority of the Bangko Sentral ng Pilipinas (BSP). The BPI Odyssey Philippine Dollar Bond Fund intends to achieve capital appreciation and income growth by investing in a diversified portfolio of US dollar denominated fixed income instruments issued by the Philippine government, corporations, and financial institutions.
FUND PERFORMANCE a
2018 Return2017 Return2016 Return2015 Return3 Year Return (annualized as of Dec 31, 2018) Return since Inception (annualized as of Dec 31, 2018)
-1.83%4.82%3.04%0.20%1.97%6.25%
a Fund returns are calculated based on Net Asset Value per Unit Past performance is not indicative of future performance
52 53

52
PORTFOLIO STATISTICS (as of December 31, 2018)
Net Asset Value (NAV in PHP thousands) b
Net Asset Value per Unit 3,059 c 1.0625
b NAV is net of 1.25% policy managementc Based on Audited Financial Statement
PORTFOLIO COMPOSITION
Government Corporates Cash Time deposits and money market Other receivables, net of liabilities
50.35 41.52
0.53 6.14 1.46
ALLOCATION % OF FUND
TOP TEN HOLDINGS - ODYSSEY PHILIPPINE DOLLAR BOND FUND
Republic of the Philippines SM Investments Corporation Republic of the Philippines JG Summit Holdings Republic of the Philippines Energy Development Corp. ICT Services, Inc. ICT Services, Inc. Time Deposits Republic of the Philippines
NAME
21.32 12.65 12.52 12.48 11.33
7.59 4.88 3.92 3.61 3.47
% OF FUND
2/2/20306/10/20243/16/20251/23/2023
10/23/20341/20/20213/17/20201/16/2023
6/4/2023
RETURN SINCE INCEPTION d
d Fund returns are calculated based on Net Asset Value per Unit
MA
R 1
5
JUN
15
SE
P 1
5
DE
C 1
5
JUN
16
SE
P 1
6
DE
C 1
6
MA
R 1
7
JUN
17
SE
P 1
7
DE
C 1
7
-3%
0%
3%
6%
9%
12%
MA
R 1
8
JUN
18
SE
P 1
8
DE
C 1
8
53

DISCLOSURESTATEMENT
55

Readership: This document is intended solely for the addressee(s). Its content may be legally privileged and/or confidential.
Opinions: Any opinions expressed in this document may be subject to change without notice. We are not soliciting or recommending any action based on this material.
Risk Warning: Past performance is not indicative of future results. Our investment management services relate to a variety of investments, each of which can fluctuate in value. The value of portfolios we manage may fall as well as rise, and the investor may not get back the full amount originally invested. The investment risks vary between different types of instruments. For example, for investments involving exposure to a currency other than that in which the portfolio is denominated, changes in the rate of exchange may cause the value of investments, and consequently the value of the portfolio, to go up or down. In the case of a higher volatility portfolio the loss on realization or cancellation may be very high (including total loss of investment), as the value of such an investment may fall suddenly and substantially. In making an investment decision, prospective investors must rely on their own examination of the merits and risks involved. Unless otherwise noted, all information contained herein is sourced with BPI-Philam internal data. The content included herein has been shared with various in-house departments within BPI-Philam will comply with the confidentiality requirements of their respective jurisdictions. Parts of this presentation may be based on information received from sources we consider reliable. We do not represent that all of this information is accurate or complete and may not be relied upon as such. The investment risks and other risks associated with this product are borne solely by the policyowner.
55

About BPI-Philam
BPI-Philam Life Assurance Corporation is a strategic alliance between two leading financial companies in the Philippines - The Philippine American Life and General Insurance Company (Philam Life) and Bank of the Philippine Islands (BPI). Philam Life is the country’s premier and most trusted life insurer for over seven decades now. Bank of the Philippine Islands is a leading commercial bank in the country with over 160 years of experience in the local banking industry and an extensive branch network of more than 1,000 branches and 3,000 ATMs. BPI-Philam was once again hailed as the Philippine’s Best Life Insurance Company for 2018 by an international finance magazine, World Finance. The win is a shining testament to the best quality service BPI-Philam has afforded Filipinos throughout the years with their accessible and comprehensive offerings. BPI-Philam’s professional and expertly trained Bancassurance Sales Executives are assigned in BPI and BPI Family Savings Bank branches nationwide to render financial advisory services that address customers’ financial and protection needs. As a combined brand, Filipinos can trust BPI-Philam to help achieve their dreams through solutions that are accessible, affordable and personalized. We at BPI-Philam understand that the Filipinos’ needs continue to evolve as they go through the different life stages and they want to be able to easily access solutions that help them live healthier, longer and better lives.