fund manager s eport - js investments · non compliant investments under circular 07/2009 ......
TRANSCRIPT
Growth
Stability
Performance
Trust
Experience
FUND MANAGER’S REPORT OCTOBER 2012
Market Review
Unit Trust of Pakistan (UTP)
JS Large Cap. Fund (JS LCF)
JS Islamic Fund (JS ISF)
JS Aggressive Asset Allocation Fund (JS AAA)
JS Fund of Funds (JS FoF)
JS KSE-30 Index Fund (JS KSE 30 Index)
JS Income Fund (JS IF)
JS Aggressive Income Fund (JS AIF)
JS Cash Fund (JS CF)
JS Growth Fund (JS GF)
JS Value Fund Ltd (JS VFL)
JS Pension Savings Fund (JS PSF)
JS Islamic Pension Savings Fund (JS IPSF)
Oct‐12
Daily volume vs. KSE‐30 movement
Disclaimer : This publication is for informational purposes only and nothing herein should be construed as a solicitation, recommendation or an offer to buy or sell any fund. All investments in mutual funds aresubject to market risks. The NAV based prices of units and any dividends/returns thereon are dependent on forces and factors affecting the capital markets. These may go up or down based on marketconditions. Past performance is not necessarily indicative of future results.
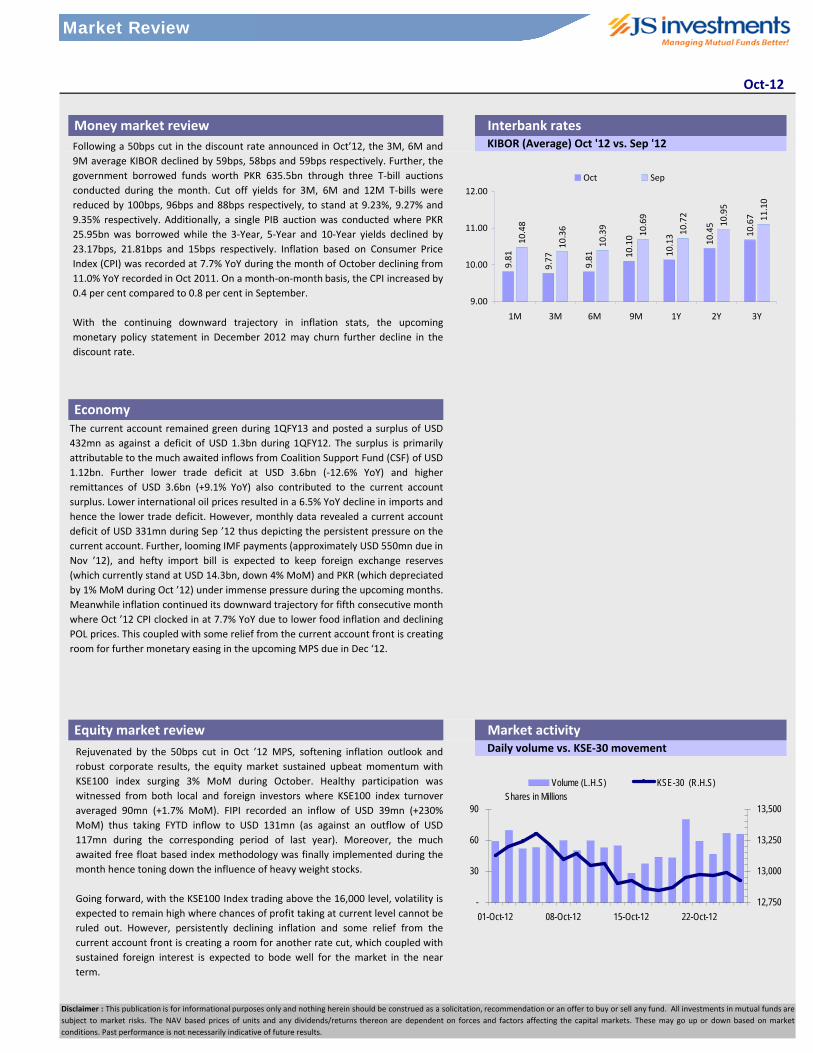
Money market review Interbank ratesKIBOR (Average) Oct '12 vs. Sep '12
Market activity Equity market review
Economy
Following a 50bps cut in the discount rate announced in Oct’12, the 3M, 6M and9M average KIBOR declined by 59bps, 58bps and 59bps respectively. Further, thegovernment borrowed funds worth PKR 635.5bn through three T‐bill auctionsconducted during the month. Cut off yields for 3M, 6M and 12M T‐bills werereduced by 100bps, 96bps and 88bps respectively, to stand at 9.23%, 9.27% and9.35% respectively. Additionally, a single PIB auction was conducted where PKR25.95bn was borrowed while the 3‐Year, 5‐Year and 10‐Year yields declined by23.17bps, 21.81bps and 15bps respectively. Inflation based on Consumer PriceIndex (CPI) was recorded at 7.7% YoY during the month of October declining from11.0% YoY recorded in Oct 2011. On a month‐on‐month basis, the CPI increased by0.4 per cent compared to 0.8 per cent in September.
With the continuing downward trajectory in inflation stats, the upcomingmonetary policy statement in December 2012 may churn further decline in thediscount rate.
Rejuvenated by the 50bps cut in Oct ’12 MPS, softening inflation outlook androbust corporate results, the equity market sustained upbeat momentum withKSE100 index surging 3% MoM during October. Healthy participation waswitnessed from both local and foreign investors where KSE100 index turnoveraveraged 90mn (+1.7% MoM). FIPI recorded an inflow of USD 39mn (+230%MoM) thus taking FYTD inflow to USD 131mn (as against an outflow of USD117mn during the corresponding period of last year). Moreover, the muchawaited free float based index methodology was finally implemented during themonth hence toning down the influence of heavy weight stocks.
Going forward, with the KSE100 Index trading above the 16,000 level, volatility isexpected to remain high where chances of profit taking at current level cannot beruled out. However, persistently declining inflation and some relief from thecurrent account front is creating a room for another rate cut, which coupled withsustained foreign interest is expected to bode well for the market in the nearterm.
-
30
60
90
01-Oct-12 08-Oct-12 15-Oct-12 22-Oct-12
Shares in Millions
12,750
13,000
13,250
13,500
Volume (L.H.S) KSE-30 (R.H.S)
9.81
9.77
9.81 10
.10
10.13
10.45
10.67
10.48
10.36
10.39
10.69
10.72
10.95
11.10
9.00
10.00
11.00
12.00
1M 3M 6M 9M 1Y 2Y 3Y
Oct Sep
The current account remained green during 1QFY13 and posted a surplus of USD432mn as against a deficit of USD 1.3bn during 1QFY12. The surplus is primarilyattributable to the much awaited inflows from Coalition Support Fund (CSF) of USD1.12bn. Further lower trade deficit at USD 3.6bn (‐12.6% YoY) and higherremittances of USD 3.6bn (+9.1% YoY) also contributed to the current accountsurplus. Lower international oil prices resulted in a 6.5% YoY decline in imports andhence the lower trade deficit. However, monthly data revealed a current accountdeficit of USD 331mn during Sep ’12 thus depicting the persistent pressure on thecurrent account. Further, looming IMF payments (approximately USD 550mn due inNov ’12), and hefty import bill is expected to keep foreign exchange reserves(which currently stand at USD 14.3bn, down 4% MoM) and PKR (which depreciatedby 1% MoM during Oct ’12) under immense pressure during the upcoming months.Meanwhile inflation continued its downward trajectory for fifth consecutive monthwhere Oct ’12 CPI clocked in at 7.7% YoY due to lower food inflation and decliningPOL prices. This coupled with some relief from the current account front is creatingroom for further monetary easing in the upcoming MPS due in Dec ‘12.
Market Review
Performance data and analytics MUFAP Recommended Format
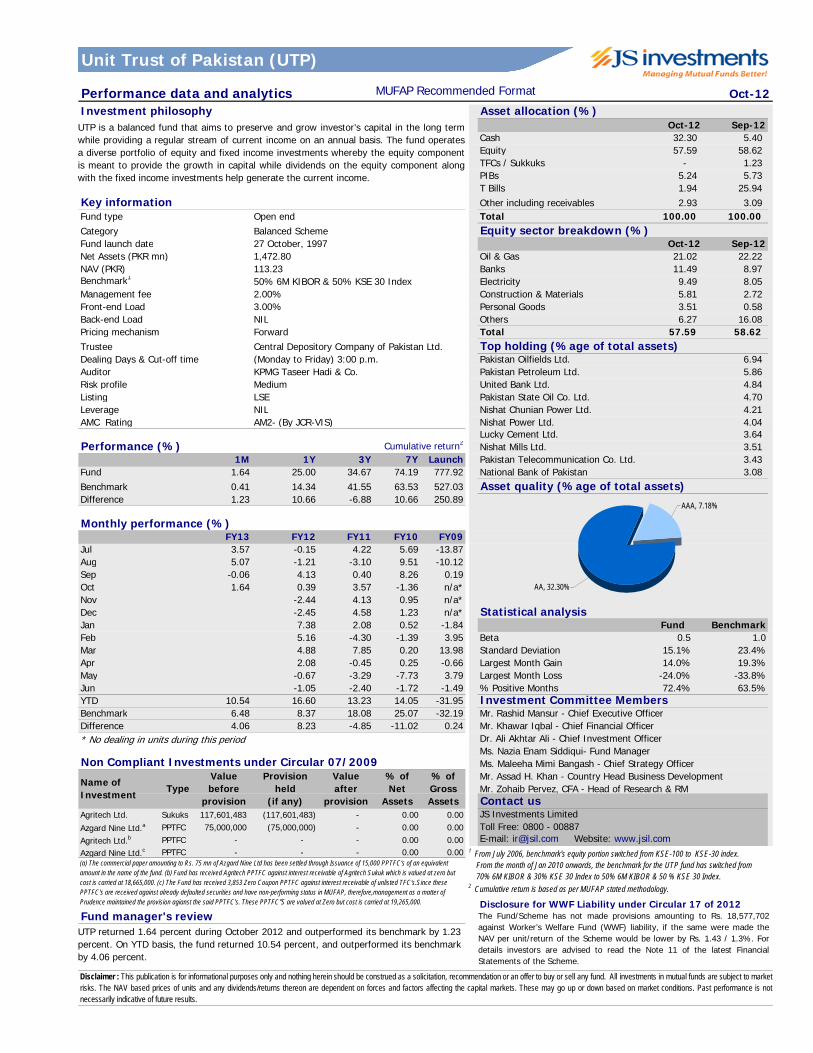
Investment philosophy Asset allocation (%)Oct-12 Sep-12
Cash 32.30 5.40 Equity 57.59 58.62 TFCs / Sukkuks - 1.23 PIBs 5.24 5.73 T Bills 1.94 25.94
Key information Other including receivables 2.93 3.09 Fund type Open end Total 100.00 100.00 Category Balanced Scheme Equity sector breakdown (%)Fund launch date 27 October, 1997 Oct-12 Sep-12Net Assets (PKR mn) 1,472.80 Oil & Gas 21.02 22.22 NAV (PKR) 113.23 Banks 11.49 8.97 Benchmark1 50% 6M KIBOR & 50% KSE 30 Index Electricity 9.49 8.05 Management fee 2.00% Construction & Materials 5.81 2.72 Front-end Load 3.00% Personal Goods 3.51 0.58 Back-end Load NIL Others 6.27 16.08 Pricing mechanism Forward Total 57.59 58.62 Trustee Central Depository Company of Pakistan Ltd. Top holding (%age of total assets)Dealing Days & Cut-off time (Monday to Friday) 3:00 p.m. Pakistan Oilfields Ltd. 6.94 Auditor KPMG Taseer Hadi & Co. Pakistan Petroleum Ltd. 5.86 Risk profile Medium United Bank Ltd. 4.84 Listing LSE Pakistan State Oil Co. Ltd. 4.70 Leverage NIL Nishat Chunian Power Ltd. 4.21 AMC Rating AM2- (By JCR-VIS) Nishat Power Ltd. 4.04
Lucky Cement Ltd. 3.64 Performance (%) Cumulative return2 Nishat Mills Ltd. 3.51
1M 1Y 3Y 7Y Launch Pakistan Telecommunication Co. Ltd. 3.43 Fund 1.64 25.00 34.67 74.19 777.92 National Bank of Pakistan 3.08 Benchmark 0.41 14.34 41.55 63.53 527.03 Asset quality (%age of total assets)Difference 1.23 10.66 -6.88 10.66 250.89
Monthly performance (%)FY13 FY12 FY11 FY10 FY09
Jul 3.57 -0.15 4.22 5.69 -13.87Aug 5.07 -1.21 -3.10 9.51 -10.12Sep -0.06 4.13 0.40 8.26 0.19Oct 1.64 0.39 3.57 -1.36 n/a*Nov -2.44 4.13 0.95 n/a*Dec -2.45 4.58 1.23 n/a* Statistical analysisJan 7.38 2.08 0.52 -1.84 Fund BenchmarkFeb 5.16 -4.30 -1.39 3.95 Beta 0.5 1.0Mar 4.88 7.85 0.20 13.98 Standard Deviation 15.1% 23.4%Apr 2.08 -0.45 0.25 -0.66 Largest Month Gain 14.0% 19.3%May -0.67 -3.29 -7.73 3.79 Largest Month Loss -24.0% -33.8%Jun -1.05 -2.40 -1.72 -1.49 % Positive Months 72.4% 63.5%YTD 10.54 16.60 13.23 14.05 -31.95 Investment Committee MembersBenchmark 6.48 8.37 18.08 25.07 -32.19Difference 4.06 8.23 -4.85 -11.02 0.24* No dealing in units during this period
Non Compliant Investments under Circular 07/2009
Contact usAgritech Ltd. Sukuks 117,601,483 (117,601,483) - 0.00 0.00 JS Investments LimitedAzgard Nine Ltd.a PPTFC 75,000,000 (75,000,000) - 0.00 0.00 Toll Free: 0800 - 00887Agritech Ltd.b PPTFC - - - 0.00 0.00 E-mail: [email protected] Website: www.jsil.comAzgard Nine Ltd.c PPTFC - - - 0.00 0.00
Disclosure for WWF Liability under Circular 17 of 2012Fund manager's review
Oct-12
Disclaimer : This publication is for informational purposes only and nothing herein should be construed as a solicitation, recommendation or an offer to buy or sell any fund. All investments in mutual funds are subject to marketrisks. The NAV based prices of units and any dividends/returns thereon are dependent on forces and factors affecting the capital markets. These may go up or down based on market conditions. Past performance is notnecessarily indicative of future results.
Name of Investment
% of Net
Assets
% of GrossAssets
TypeValue before
provision
Provision held
(if any)
Value after
provision
(a) The commercial paper amounting to Rs. 75 mn of Azgard Nine Ltd has been settled through Issuance of 15,000 PPTFC's of an equivalent amount in the name of the fund. (b) Fund has received Agritech PPTFC against interest receivable of Agritech Sukuk which is valued at zero but cost is carried at 18,665,000. (c) The Fund has received 3,853 Zero Coupon PPTFC against interest receivable of unlisted TFC's.Since these PPTFC's are received against already defaulted securities and have non-performing status in MUFAP, therefore,management as a matter of Prudence maintained the provision agianst the said PPTFC's. These PPTFC"S are valued at Zero but cost is carried at 19,265,000.
UTP is a balanced fund that aims to preserve and grow investor’s capital in the long termwhile providing a regular stream of current income on an annual basis. The fund operatesa diverse portfolio of equity and fixed income investments whereby the equity componentis meant to provide the growth in capital while dividends on the equity component alongwith the fixed income investments help generate the current income.
Unit Trust of Pakistan (UTP)
1 From July 2006, benchmark's equity portion switched from KSE-100 to KSE-30 index. From the month of Jan 2010 onwards, the benchmark for the UTP fund has switched from 70% 6M KIBOR & 30% KSE 30 Index to 50% 6M KIBOR & 50 % KSE 30 Index.2 Cumulative return is based as per MUFAP stated methodology.
AAA, 7.18%
AA, 32.30%
Mr. Rashid Mansur - Chief Executive OfficerMr. Khawar Iqbal - Chief Financial OfficerDr. Ali Akhtar Ali - Chief Investment OfficerMs. Nazia Enam Siddiqui- Fund ManagerMs. Maleeha Mimi Bangash - Chief Strategy Officer Mr. Assad H. Khan - Country Head Business DevelopmentMr. Zohaib Pervez, CFA - Head of Research & RM
UTP returned 1.64 percent during October 2012 and outperformed its benchmark by 1.23percent. On YTD basis, the fund returned 10.54 percent, and outperformed its benchmarkby 4.06 percent.
The Fund/Scheme has not made provisions amounting to Rs. 18,577,702against Worker’s Welfare Fund (WWF) liability, if the same were made theNAV per unit/return of the Scheme would be lower by Rs. 1.43 / 1.3%. Fordetails investors are advised to read the Note 11 of the latest FinancialStatements of the Scheme.
Performance data and analytics MUFAP Recommended Format Oct-12Investment philosophy Asset allocation (%)
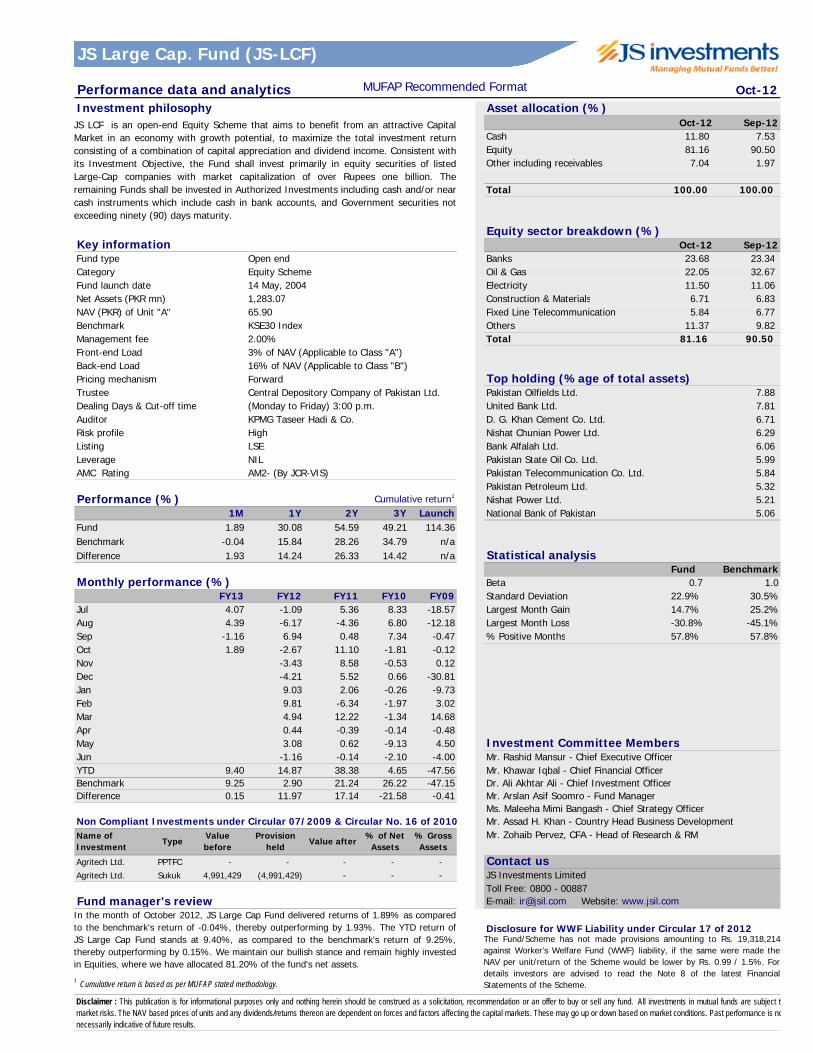
Oct-12 Sep-12Cash 11.80 7.53 Equity 81.16 90.50 Other including receivables 7.04 1.97
Total 100.00 100.00
Equity sector breakdown (%)Key information Oct-12 Sep-12Fund type Open end Banks 23.68 23.34 Category Equity Scheme Oil & Gas 22.05 32.67 Fund launch date 14 May, 2004 Electricity 11.50 11.06 Net Assets (PKR mn) 1,283.07 Construction & Materials 6.71 6.83 NAV (PKR) of Unit "A" 65.90 Fixed Line Telecommunication 5.84 6.77 Benchmark KSE30 Index Others 11.37 9.82 Management fee 2.00% Total 81.16 90.50 Front-end Load 3% of NAV (Applicable to Class "A")Back-end Load 16% of NAV (Applicable to Class "B")Pricing mechanism Forward Top holding (%age of total assets)Trustee Central Depository Company of Pakistan Ltd. Pakistan Oilfields Ltd. 7.88 Dealing Days & Cut-off time (Monday to Friday) 3:00 p.m. United Bank Ltd. 7.81 Auditor KPMG Taseer Hadi & Co. D. G. Khan Cement Co. Ltd. 6.71 Risk profile High Nishat Chunian Power Ltd. 6.29 Listing LSE Bank Alfalah Ltd. 6.06 Leverage NIL Pakistan State Oil Co. Ltd. 5.99 AMC Rating AM2- (By JCR-VIS) Pakistan Telecommunication Co. Ltd. 5.84
Pakistan Petroleum Ltd. 5.32 Performance (%) Cumulative return1 Nishat Power Ltd. 5.21
1M 1Y 2Y 3Y Launch National Bank of Pakistan 5.06 Fund 1.89 30.08 54.59 49.21 114.36Benchmark -0.04 15.84 28.26 34.79 n/aDifference 1.93 14.24 26.33 14.42 n/a Statistical analysis
Fund BenchmarkMonthly performance (%) Beta 0.7 1.0
FY13 FY12 FY11 FY10 FY09 Standard Deviation 22.9% 30.5%Jul 4.07 -1.09 5.36 8.33 -18.57 Largest Month Gain 14.7% 25.2%Aug 4.39 -6.17 -4.36 6.80 -12.18 Largest Month Loss -30.8% -45.1%Sep -1.16 6.94 0.48 7.34 -0.47 % Positive Months 57.8% 57.8%Oct 1.89 -2.67 11.10 -1.81 -0.12Nov -3.43 8.58 -0.53 0.12Dec -4.21 5.52 0.66 -30.81Jan 9.03 2.06 -0.26 -9.73Feb 9.81 -6.34 -1.97 3.02Mar 4.94 12.22 -1.34 14.68Apr 0.44 -0.39 -0.14 -0.48May 3.08 0.62 -9.13 4.50 Investment Committee MembersJun -1.16 -0.14 -2.10 -4.00 Mr. Rashid Mansur - Chief Executive OfficerYTD 9.40 14.87 38.38 4.65 -47.56 Mr. Khawar Iqbal - Chief Financial OfficerBenchmark 9.25 2.90 21.24 26.22 -47.15 Dr. Ali Akhtar Ali - Chief Investment OfficerDifference 0.15 11.97 17.14 -21.58 -0.41 Mr. Arslan Asif Soomro - Fund Manager
Ms. Maleeha Mimi Bangash - Chief Strategy Officer Non Compliant Investments under Circular 07/2009 & Circular No. 16 of 2010 Mr. Assad H. Khan - Country Head Business Development
Mr. Zohaib Pervez, CFA - Head of Research & RM
Agritech Ltd. PPTFC - - - - - Contact usAgritech Ltd. Sukuk 4,991,429 (4,991,429) - - - JS Investments Limited
Toll Free: 0800 - 00887Fund manager's review E-mail: [email protected] Website: www.jsil.com
Disclosure for WWF Liability under Circular 17 of 2012
Value after % of Net
Assets% GrossAssets
Name of Investment
TypeValue before
Provision held
Disclaimer : This publication is for informational purposes only and nothing herein should be construed as a solicitation, recommendation or an offer to buy or sell any fund. All investments in mutual funds are subject tomarket risks. The NAV based prices of units and any dividends/returns thereon are dependent on forces and factors affecting the capital markets. These may go up or down based on market conditions. Past performance is nonecessarily indicative of future results.
JS LCF is an open-end Equity Scheme that aims to benefit from an attractive CapitalMarket in an economy with growth potential, to maximize the total investment returnconsisting of a combination of capital appreciation and dividend income. Consistent withits Investment Objective, the Fund shall invest primarily in equity securities of listedLarge-Cap companies with market capitalization of over Rupees one billion. Theremaining Funds shall be invested in Authorized Investments including cash and/or nearcash instruments which include cash in bank accounts, and Government securities notexceeding ninety (90) days maturity.
In the month of October 2012, JS Large Cap Fund delivered returns of 1.89% as comparedto the benchmark's return of -0.04%, thereby outperforming by 1.93%. The YTD return ofJS Large Cap Fund stands at 9.40%, as compared to the benchmark's return of 9.25%,thereby outperforming by 0.15%. We maintain our bullish stance and remain highly investedin Equities, where we have allocated 81.20% of the fund's net assets.
1 Cumulative return is based as per MUFAP stated methodology.
The Fund/Scheme has not made provisions amounting to Rs. 19,318,214against Worker’s Welfare Fund (WWF) liability, if the same were made theNAV per unit/return of the Scheme would be lower by Rs. 0.99 / 1.5%. Fordetails investors are advised to read the Note 8 of the latest FinancialStatements of the Scheme.
JS Large Cap. Fund (JS-LCF)
Performance data and analytics MUFAP Recommended Format Oct-12Investment philosophy Asset allocation (%)
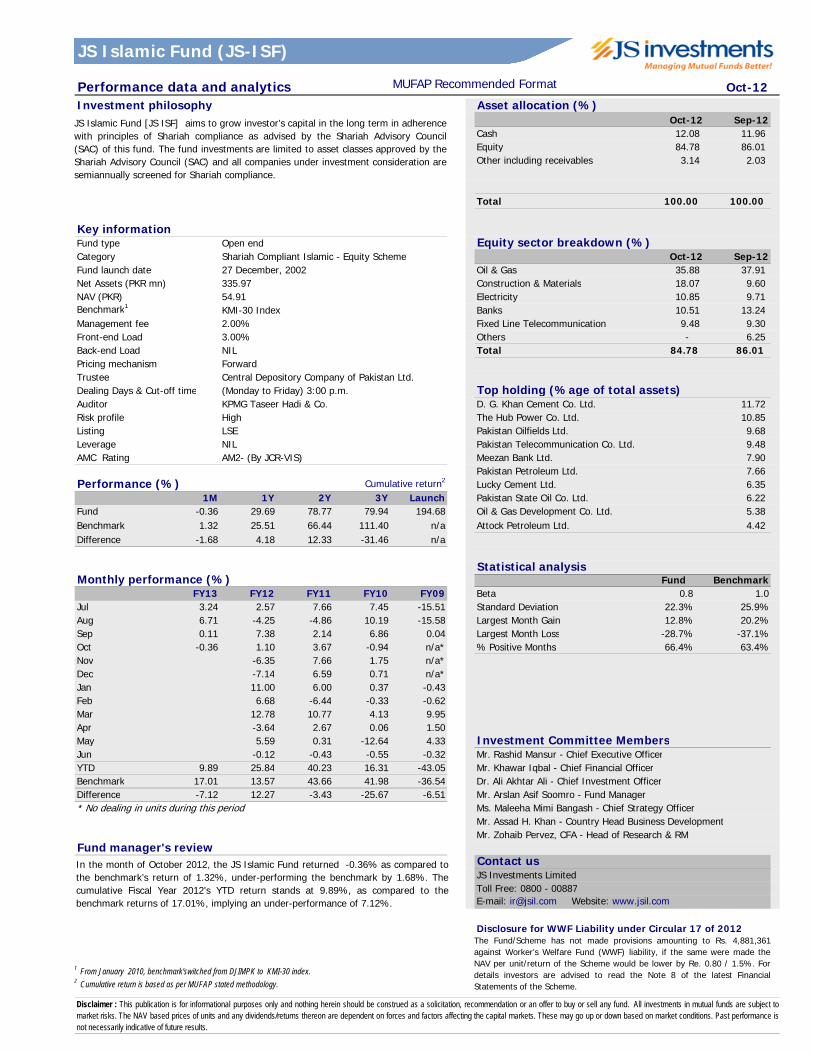
Oct-12 Sep-12Cash 12.08 11.96 Equity 84.78 86.01 Other including receivables 3.14 2.03
Total 100.00 100.00
Key informationFund type Open end Equity sector breakdown (%)Category Shariah Compliant Islamic - Equity Scheme Oct-12 Sep-12Fund launch date 27 December, 2002 Oil & Gas 35.88 37.91 Net Assets (PKR mn) 335.97 Construction & Materials 18.07 9.60 NAV (PKR) 54.91 Electricity 10.85 9.71 Benchmark1 KMI-30 Index Banks 10.51 13.24 Management fee 2.00% Fixed Line Telecommunication 9.48 9.30 Front-end Load 3.00% Others - 6.25 Back-end Load NIL Total 84.78 86.01 Pricing mechanism Forward Trustee Central Depository Company of Pakistan Ltd.Dealing Days & Cut-off time (Monday to Friday) 3:00 p.m. Top holding (%age of total assets)Auditor KPMG Taseer Hadi & Co. D. G. Khan Cement Co. Ltd. 11.72 Risk profile High The Hub Power Co. Ltd. 10.85 Listing LSE Pakistan Oilfields Ltd. 9.68 Leverage NIL Pakistan Telecommunication Co. Ltd. 9.48 AMC Rating AM2- (By JCR-VIS) Meezan Bank Ltd. 7.90
Pakistan Petroleum Ltd. 7.66 Performance (%) Cumulative return2 Lucky Cement Ltd. 6.35
1M 1Y 2Y 3Y Launch Pakistan State Oil Co. Ltd. 6.22 Fund -0.36 29.69 78.77 79.94 194.68 Oil & Gas Development Co. Ltd. 5.38 Benchmark 1.32 25.51 66.44 111.40 n/a Attock Petroleum Ltd. 4.42 Difference -1.68 4.18 12.33 -31.46 n/a
Statistical analysisMonthly performance (%) Fund Benchmark
FY13 FY12 FY11 FY10 FY09 Beta 0.8 1.0Jul 3.24 2.57 7.66 7.45 -15.51 Standard Deviation 22.3% 25.9%Aug 6.71 -4.25 -4.86 10.19 -15.58 Largest Month Gain 12.8% 20.2%Sep 0.11 7.38 2.14 6.86 0.04 Largest Month Loss -28.7% -37.1%Oct -0.36 1.10 3.67 -0.94 n/a* % Positive Months 66.4% 63.4%Nov -6.35 7.66 1.75 n/a*Dec -7.14 6.59 0.71 n/a*Jan 11.00 6.00 0.37 -0.43Feb 6.68 -6.44 -0.33 -0.62Mar 12.78 10.77 4.13 9.95Apr -3.64 2.67 0.06 1.50May 5.59 0.31 -12.64 4.33 Investment Committee MembersJun -0.12 -0.43 -0.55 -0.32 Mr. Rashid Mansur - Chief Executive OfficerYTD 9.89 25.84 40.23 16.31 -43.05 Mr. Khawar Iqbal - Chief Financial OfficerBenchmark 17.01 13.57 43.66 41.98 -36.54 Dr. Ali Akhtar Ali - Chief Investment OfficerDifference -7.12 12.27 -3.43 -25.67 -6.51 Mr. Arslan Asif Soomro - Fund Manager * No dealing in units during this period Ms. Maleeha Mimi Bangash - Chief Strategy Officer
Mr. Assad H. Khan - Country Head Business DevelopmentMr. Zohaib Pervez, CFA - Head of Research & RM
Fund manager's reviewContact usJS Investments LimitedToll Free: 0800 - 00887E-mail: [email protected] Website: www.jsil.com
Disclosure for WWF Liability under Circular 17 of 2012
Disclaimer : This publication is for informational purposes only and nothing herein should be construed as a solicitation, recommendation or an offer to buy or sell any fund. All investments in mutual funds are subject tomarket risks. The NAV based prices of units and any dividends/returns thereon are dependent on forces and factors affecting the capital markets. These may go up or down based on market conditions. Past performance isnot necessarily indicative of future results.
JS Islamic Fund [JS ISF] aims to grow investor’s capital in the long term in adherencewith principles of Shariah compliance as advised by the Shariah Advisory Council(SAC) of this fund. The fund investments are limited to asset classes approved by theShariah Advisory Council (SAC) and all companies under investment consideration aresemiannually screened for Shariah compliance.
In the month of October 2012, the JS Islamic Fund returned -0.36% as compared tothe benchmark’s return of 1.32%, under-performing the benchmark by 1.68%. Thecumulative Fiscal Year 2012's YTD return stands at 9.89%, as compared to thebenchmark returns of 17.01%, implying an under-performance of 7.12%.
1 From January 2010, benchmark'switched from DJIMPK to KMI-30 index.2 Cumulative return is based as per MUFAP stated methodology.
The Fund/Scheme has not made provisions amounting to Rs. 4,881,361against Worker’s Welfare Fund (WWF) liability, if the same were made theNAV per unit/return of the Scheme would be lower by Re. 0.80 / 1.5%. Fordetails investors are advised to read the Note 8 of the latest FinancialStatements of the Scheme.
JS Islamic Fund (JS-ISF)
Performance data and analytics MUFAP Recommended Format Oct-12Investment philosophy Asset allocation (%)
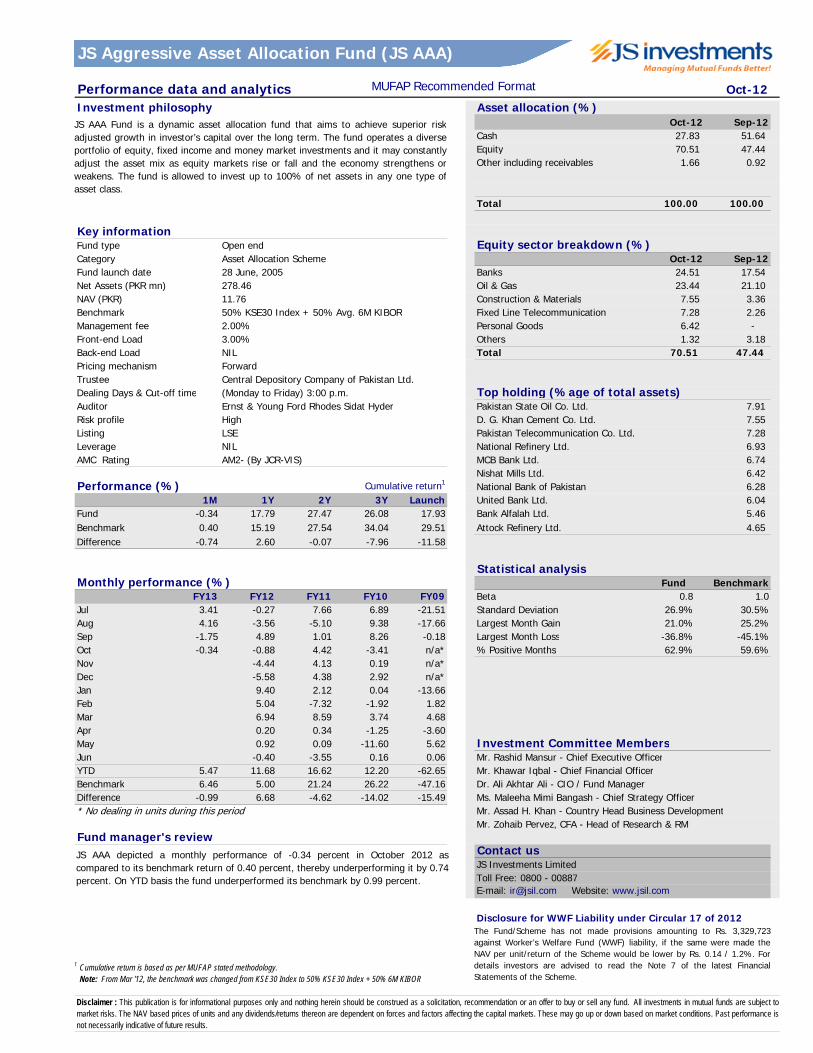
Oct-12 Sep-12Cash 27.83 51.64 Equity 70.51 47.44 Other including receivables 1.66 0.92
Total 100.00 100.00
Key informationFund type Open end Equity sector breakdown (%)Category Asset Allocation Scheme Oct-12 Sep-12Fund launch date 28 June, 2005 Banks 24.51 17.54 Net Assets (PKR mn) 278.46 Oil & Gas 23.44 21.10 NAV (PKR) 11.76 Construction & Materials 7.55 3.36 Benchmark 50% KSE30 Index + 50% Avg. 6M KIBOR Fixed Line Telecommunication 7.28 2.26 Management fee 2.00% Personal Goods 6.42 - Front-end Load 3.00% Others 1.32 3.18 Back-end Load NIL Total 70.51 47.44 Pricing mechanism Forward Trustee Central Depository Company of Pakistan Ltd.Dealing Days & Cut-off time (Monday to Friday) 3:00 p.m. Top holding (%age of total assets)Auditor Ernst & Young Ford Rhodes Sidat Hyder Pakistan State Oil Co. Ltd. 7.91 Risk profile High D. G. Khan Cement Co. Ltd. 7.55 Listing LSE Pakistan Telecommunication Co. Ltd. 7.28 Leverage NIL National Refinery Ltd. 6.93 AMC Rating AM2- (By JCR-VIS) MCB Bank Ltd. 6.74
Nishat Mills Ltd. 6.42 Performance (%) Cumulative return1 National Bank of Pakistan 6.28
1M 1Y 2Y 3Y Launch United Bank Ltd. 6.04 Fund -0.34 17.79 27.47 26.08 17.93 Bank Alfalah Ltd. 5.46 Benchmark 0.40 15.19 27.54 34.04 29.51 Attock Refinery Ltd. 4.65 Difference -0.74 2.60 -0.07 -7.96 -11.58
Statistical analysisMonthly performance (%) Fund Benchmark
FY13 FY12 FY11 FY10 FY09 Beta 0.8 1.0Jul 3.41 -0.27 7.66 6.89 -21.51 Standard Deviation 26.9% 30.5%Aug 4.16 -3.56 -5.10 9.38 -17.66 Largest Month Gain 21.0% 25.2%Sep -1.75 4.89 1.01 8.26 -0.18 Largest Month Loss -36.8% -45.1%Oct -0.34 -0.88 4.42 -3.41 n/a* % Positive Months 62.9% 59.6%Nov -4.44 4.13 0.19 n/a*Dec -5.58 4.38 2.92 n/a*Jan 9.40 2.12 0.04 -13.66Feb 5.04 -7.32 -1.92 1.82Mar 6.94 8.59 3.74 4.68Apr 0.20 0.34 -1.25 -3.60May 0.92 0.09 -11.60 5.62 Investment Committee MembersJun -0.40 -3.55 0.16 0.06 Mr. Rashid Mansur - Chief Executive OfficerYTD 5.47 11.68 16.62 12.20 -62.65 Mr. Khawar Iqbal - Chief Financial OfficerBenchmark 6.46 5.00 21.24 26.22 -47.16 Dr. Ali Akhtar Ali - CIO / Fund ManagerDifference -0.99 6.68 -4.62 -14.02 -15.49 Ms. Maleeha Mimi Bangash - Chief Strategy Officer * No dealing in units during this period Mr. Assad H. Khan - Country Head Business Development
Mr. Zohaib Pervez, CFA - Head of Research & RMFund manager's review
Contact usJS Investments LimitedToll Free: 0800 - 00887E-mail: [email protected] Website: www.jsil.com
Disclosure for WWF Liability under Circular 17 of 2012
Disclaimer : This publication is for informational purposes only and nothing herein should be construed as a solicitation, recommendation or an offer to buy or sell any fund. All investments in mutual funds are subject tomarket risks. The NAV based prices of units and any dividends/returns thereon are dependent on forces and factors affecting the capital markets. These may go up or down based on market conditions. Past performance isnot necessarily indicative of future results.
JS AAA Fund is a dynamic asset allocation fund that aims to achieve superior riskadjusted growth in investor’s capital over the long term. The fund operates a diverseportfolio of equity, fixed income and money market investments and it may constantlyadjust the asset mix as equity markets rise or fall and the economy strengthens orweakens. The fund is allowed to invest up to 100% of net assets in any one type ofasset class.
JS AAA depicted a monthly performance of -0.34 percent in October 2012 ascompared to its benchmark return of 0.40 percent, thereby underperforming it by 0.74percent. On YTD basis the fund underperformed its benchmark by 0.99 percent.
1 Cumulative return is based as per MUFAP stated methodology. Note: From Mar '12, the benchmark was changed from KSE30 Index to 50% KSE30 Index + 50% 6M KIBOR
The Fund/Scheme has not made provisions amounting to Rs. 3,329,723against Worker’s Welfare Fund (WWF) liability, if the same were made theNAV per unit/return of the Scheme would be lower by Rs. 0.14 / 1.2%. Fordetails investors are advised to read the Note 7 of the latest FinancialStatements of the Scheme.
JS Aggressive Asset Allocation Fund (JS AAA)
Performance data and analytics MUFAP Recommended Format Oct-12Investment philosophy Asset allocation (%)
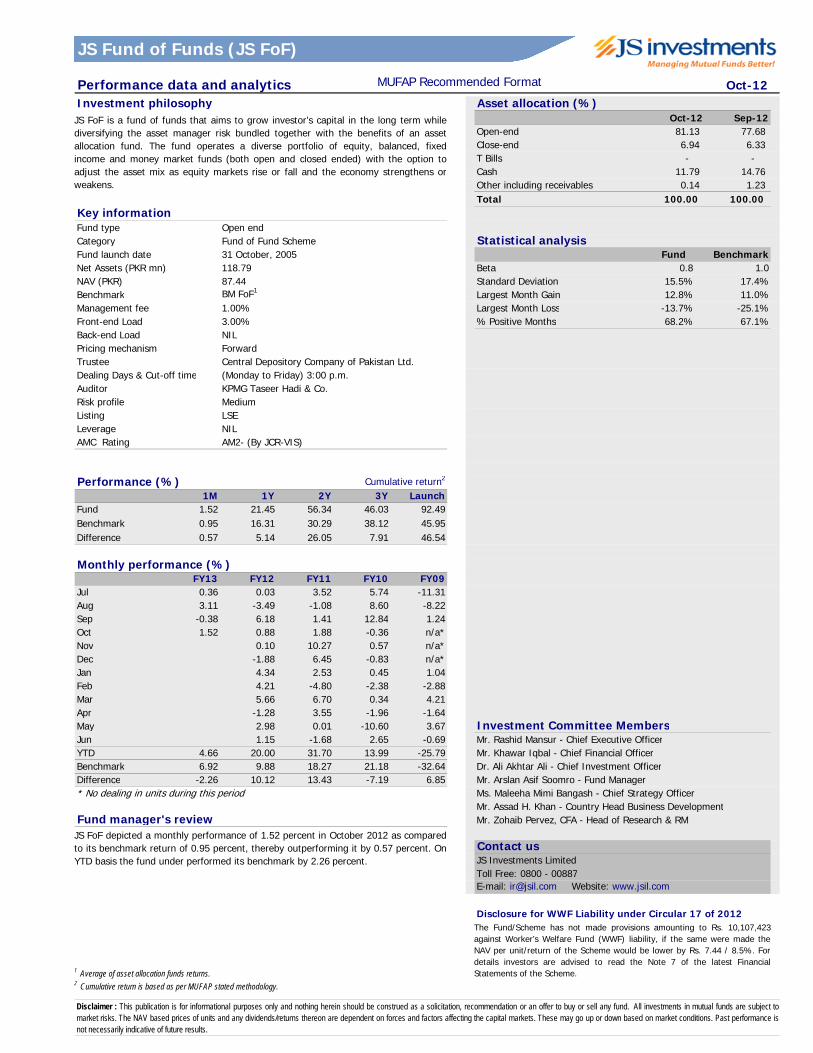
Oct-12 Sep-12Open-end 81.13 77.68 Close-end 6.94 6.33 T Bills - - Cash 11.79 14.76 Other including receivables 0.14 1.23 Total 100.00 100.00
Key informationFund type Open endCategory Fund of Fund Scheme Statistical analysisFund launch date 31 October, 2005 Fund BenchmarkNet Assets (PKR mn) 118.79 Beta 0.8 1.0NAV (PKR) 87.44 Standard Deviation 15.5% 17.4%Benchmark BM FoF1 Largest Month Gain 12.8% 11.0%Management fee 1.00% Largest Month Loss -13.7% -25.1%Front-end Load 3.00% % Positive Months 68.2% 67.1%Back-end Load NILPricing mechanism Forward Trustee Central Depository Company of Pakistan Ltd.Dealing Days & Cut-off time (Monday to Friday) 3:00 p.m.Auditor KPMG Taseer Hadi & Co.Risk profile MediumListing LSELeverage NILAMC Rating AM2- (By JCR-VIS)
Performance (%) Cumulative return2
1M 1Y 2Y 3Y LaunchFund 1.52 21.45 56.34 46.03 92.49Benchmark 0.95 16.31 30.29 38.12 45.95Difference 0.57 5.14 26.05 7.91 46.54
Monthly performance (%)FY13 FY12 FY11 FY10 FY09
Jul 0.36 0.03 3.52 5.74 -11.31Aug 3.11 -3.49 -1.08 8.60 -8.22Sep -0.38 6.18 1.41 12.84 1.24Oct 1.52 0.88 1.88 -0.36 n/a*Nov 0.10 10.27 0.57 n/a*Dec -1.88 6.45 -0.83 n/a*Jan 4.34 2.53 0.45 1.04Feb 4.21 -4.80 -2.38 -2.88Mar 5.66 6.70 0.34 4.21Apr -1.28 3.55 -1.96 -1.64May 2.98 0.01 -10.60 3.67 Investment Committee MembersJun 1.15 -1.68 2.65 -0.69 Mr. Rashid Mansur - Chief Executive OfficerYTD 4.66 20.00 31.70 13.99 -25.79 Mr. Khawar Iqbal - Chief Financial OfficerBenchmark 6.92 9.88 18.27 21.18 -32.64 Dr. Ali Akhtar Ali - Chief Investment OfficerDifference -2.26 10.12 13.43 -7.19 6.85 Mr. Arslan Asif Soomro - Fund Manager * No dealing in units during this period Ms. Maleeha Mimi Bangash - Chief Strategy Officer
Mr. Assad H. Khan - Country Head Business DevelopmentFund manager's review Mr. Zohaib Pervez, CFA - Head of Research & RM
Contact usJS Investments LimitedToll Free: 0800 - 00887E-mail: [email protected] Website: www.jsil.com
Disclosure for WWF Liability under Circular 17 of 2012
Disclaimer : This publication is for informational purposes only and nothing herein should be construed as a solicitation, recommendation or an offer to buy or sell any fund. All investments in mutual funds are subject tomarket risks. The NAV based prices of units and any dividends/returns thereon are dependent on forces and factors affecting the capital markets. These may go up or down based on market conditions. Past performance isnot necessarily indicative of future results.
JS FoF is a fund of funds that aims to grow investor’s capital in the long term whilediversifying the asset manager risk bundled together with the benefits of an assetallocation fund. The fund operates a diverse portfolio of equity, balanced, fixedincome and money market funds (both open and closed ended) with the option toadjust the asset mix as equity markets rise or fall and the economy strengthens orweakens.
JS FoF depicted a monthly performance of 1.52 percent in October 2012 as comparedto its benchmark return of 0.95 percent, thereby outperforming it by 0.57 percent. OnYTD basis the fund under performed its benchmark by 2.26 percent.
1 Average of asset allocation funds returns.2 Cumulative return is based as per MUFAP stated methodology.
The Fund/Scheme has not made provisions amounting to Rs. 10,107,423against Worker’s Welfare Fund (WWF) liability, if the same were made theNAV per unit/return of the Scheme would be lower by Rs. 7.44 / 8.5%. Fordetails investors are advised to read the Note 7 of the latest FinancialStatements of the Scheme.
JS Fund of Funds (JS FoF)

Performance data and analytics MUFAP Recommended Format Oct-12Investment philosophy Asset allocation (%)
Oct-12 Sep-12Cash 2.03 45.75 Equity 96.68 53.68 Other including receivables 1.28 0.57
Total 100.00 100.00
Key informationFund type Open end Equity sector breakdown (%)Category Index Tracker Scheme Oct-12 Sep-12Fund launch date 29 May, 2006 Oil & Gas 35.74 12.71 Net Assets (PKR mn) 95.05 Banks 21.18 13.09 NAV (PKR) 20.08 Chemicals 18.46 14.53 Benchmark KSE30 Index Electricity 6.73 5.42 Management fee 1.50% Food Producers 4.80 2.25 Front-end Load 2.00% Others 9.77 5.69 Back-end Load NIL Total 96.68 53.68 Pricing mechanism Forward Trustee MCB Financial Services LtdDealing Days & Cut-off time (Monday to Friday) 3:00 p.m. Top holding (%age of total assets)Auditor KPMG Taseer Hadi & Co. Oil & Gas Development Co. Ltd. 16.12 Risk profile High Fauji Fertilizer Co. Ltd. 11.32 Listing LSE MCB Bank Ltd. 9.75 Leverage NIL Pakistan Petroleum Ltd. 8.26 AMC Rating AM2- (By JCR-VIS) Pakistan Oilfields Ltd. 6.21
The Hub Power Co. Ltd. 5.59 Performance (%) Cumulative return1 Unilever Pakistan Ltd. 3.74
1M 1Y 2Y 3Y Launch United Bank Ltd. 3.23 Fund 0.75 20.53 38.74 51.43 30.02 Engro Corporation Ltd. 3.13 Benchmark -0.04 15.84 28.26 34.79 8.50 National Bank of Pakistan 2.79 Difference 0.79 4.69 10.48 16.64 21.52
Monthly performance (%) Statistical analysisFY13 FY12 FY11 FY10 FY09 Fund Benchmark
Jul 5.23 -0.53 9.14 7.88 -15.53 Beta 1.0 1.0Aug 5.28 -8.19 -5.76 13.68 -15.17 Standard Deviation 30.6% 30.5%Sep -1.03 6.71 0.77 8.23 -0.56 Largest Month Gain 25.5% 25.2%Oct 0.75 1.32 5.22 -3.26 n/a* Largest Month Loss -43.9% -45.1%Nov -3.51 6.46 0.50 n/a* % Positive Months 61.5% 56.4%Dec -5.22 7.04 1.75 n/a*Jan 9.05 3.24 1.78 -5.21Feb 6.86 -8.72 0.20 13.64Mar 4.48 7.52 5.69 25.48Apr 0.72 1.13 0.68 4.91May -2.38 0.46 -12.86 2.47 Investment Committee MembersJun -0.34 -0.62 3.50 -2.47 Mr. Rashid Mansur - Chief Executive OfficerYTD 10.46 7.75 27.12 28.52 -43.64 Mr. Khawar Iqbal - Chief Financial OfficerBenchmark 9.25 2.90 21.24 26.22 -47.16 Dr. Ali Akhtar Ali - Chief Investment OfficerDifference 1.21 4.85 5.88 2.29 3.52 Mr. Muhammad Salman Siddiqui, CFA - Fund Manager * No dealing in units during this period Ms. Maleeha Mimi Bangash - Chief Strategy Officer
Mr. Assad H. Khan - Country Head Business DevelopmentJS KSE-30 Index Fund vs. KSE 30 Mr. Zohaib Pervez, CFA - Head of Research & RM
Contact usJS Investments LimitedToll Free: 0800 - 00887E-mail: [email protected] Website: www.jsil.com
Disclosure for WWF Liability under Circular 17 of 2012
Disclaimer : This publication is for informational purposes only and nothing herein should be construed as a solicitation, recommendation or an offer to buy or sell any fund. All investments in mutual funds are subject tomarket risks. The NAV based prices of units and any dividends/returns thereon are dependent on forces and factors affecting the capital markets. These may go up or down based on market conditions. Past performance isnot necessarily indicative of future results.
JS KSE-30 Index Fund is an index fund that aims to track the performance of the KSE-30 Index by investing in constituent companies of the index in proportion to theirweighting. The fund targets sophisticated investors who can time their entry and exitfrom the fund in accordance with the expected performance of the equity market orfor investors who seek long term exposure to the equity market.
1 Cumulative return is based as per MUFAP stated methodology.
-20%
-10%
0%
10%
20%
Jan/10 Jun/10 Nov/10 Mar/11 Aug/11 Jan/12 May/12 Oct/12
JS KSE-30 Index Fund KSE-30 Index
The Fund/Scheme has not made provisions amounting to Rs. 1,717,992against Worker’s Welfare Fund (WWF) liability, if the same were made theNAV per unit/return of the Scheme would be lower by Re. 0.36 / 1.8%. Fordetails investors are advised to read the Note 7 of the latest FinancialStatements of the Scheme.
JS KSE-30 Index Fund (JS KSE-30)
Performance data and analytics MUFAP Recommended Format Oct-12Investment philosophy Asset allocation (%)
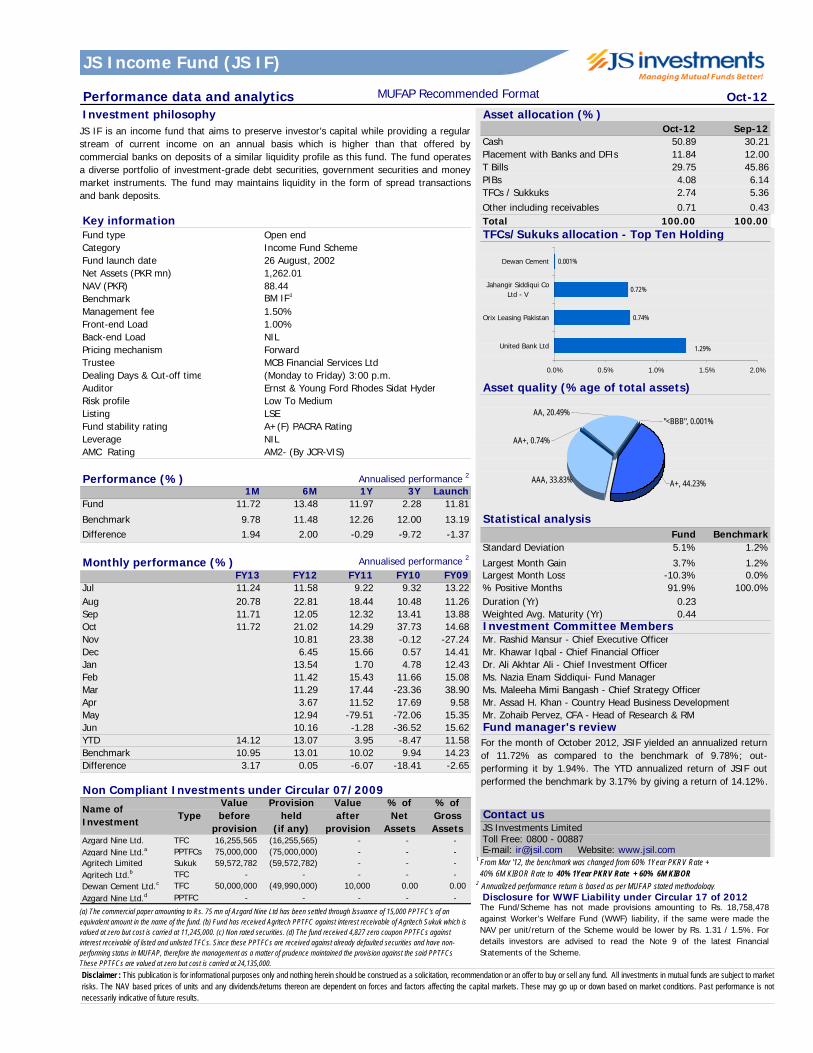
Oct-12 Sep-12Cash 50.89 30.21Placement with Banks and DFIs 11.84 12.00T Bills 29.75 45.86PIBs 4.08 6.14TFCs / Sukkuks 2.74 5.36Other including receivables 0.71 0.43
Key information Total 100.00 100.00Fund type Open end TFCs/Sukuks allocation - Top Ten HoldingCategory Income Fund SchemeFund launch date 26 August, 2002Net Assets (PKR mn) 1,262.01NAV (PKR) 88.44Benchmark BM IF1
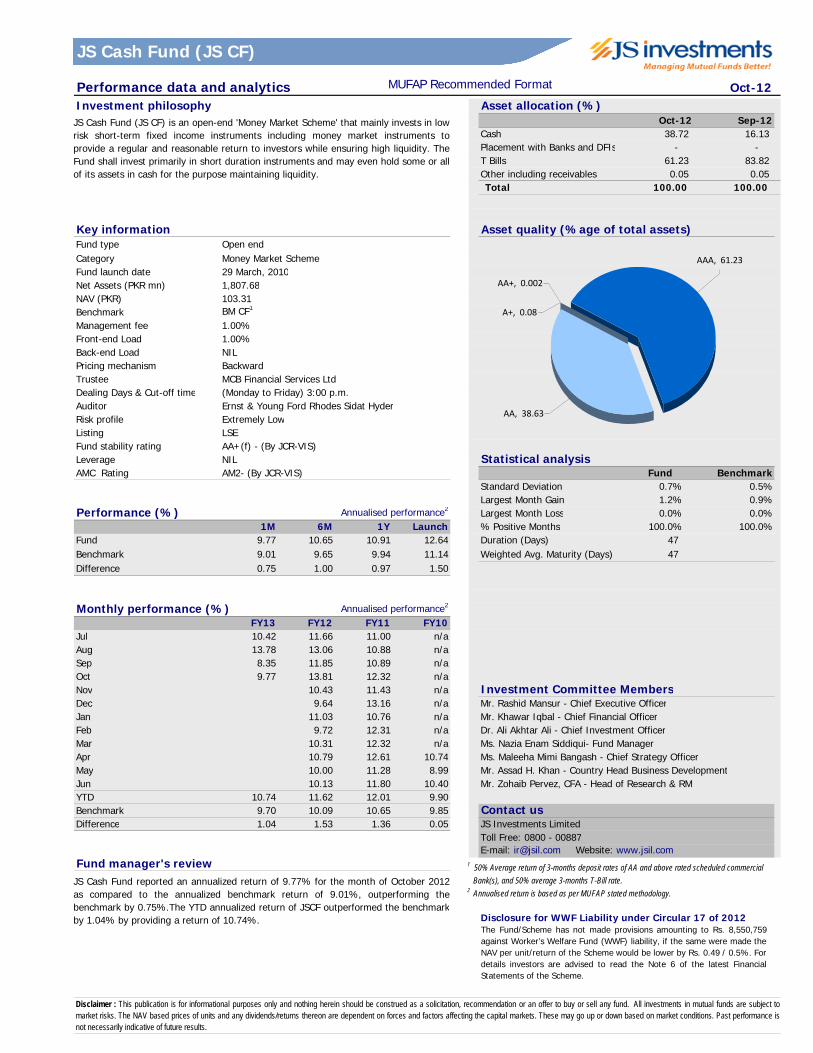
Management fee 1.50%Front-end Load 1.00%Back-end Load NILPricing mechanism Forward Trustee MCB Financial Services LtdDealing Days & Cut-off time (Monday to Friday) 3:00 p.m.Auditor Ernst & Young Ford Rhodes Sidat Hyder Asset quality (%age of total assets)Risk profile Low To MediumListing LSEFund stability rating A+(F) PACRA RatingLeverage NILAMC Rating AM2- (By JCR-VIS)
Performance (%) Annualised performance 2
1M 6M 1Y 3Y LaunchFund 11.72 13.48 11.97 2.28 11.81
Benchmark 9.78 11.48 12.26 12.00 13.19 Statistical analysisDifference 1.94 2.00 -0.29 -9.72 -1.37 Fund Benchmark
Standard Deviation 5.1% 1.2%
Monthly performance (%) Annualised performance 2 Largest Month Gain 3.7% 1.2%FY13 FY12 FY11 FY10 FY09 Largest Month Loss -10.3% 0.0%
Jul 11.24 11.58 9.22 9.32 13.22 % Positive Months 91.9% 100.0%Aug 20.78 22.81 18.44 10.48 11.26 Duration (Yr) 0.23Sep 11.71 12.05 12.32 13.41 13.88 Weighted Avg. Maturity (Yr) 0.44Oct 11.72 21.02 14.29 37.73 14.68 Investment Committee MembersNov 10.81 23.38 -0.12 -27.24 Mr. Rashid Mansur - Chief Executive OfficerDec 6.45 15.66 0.57 14.41 Mr. Khawar Iqbal - Chief Financial OfficerJan 13.54 1.70 4.78 12.43 Dr. Ali Akhtar Ali - Chief Investment OfficerFeb 11.42 15.43 11.66 15.08 Ms. Nazia Enam Siddiqui- Fund ManagerMar 11.29 17.44 -23.36 38.90 Ms. Maleeha Mimi Bangash - Chief Strategy Officer Apr 3.67 11.52 17.69 9.58 Mr. Assad H. Khan - Country Head Business DevelopmentMay 12.94 -79.51 -72.06 15.35 Mr. Zohaib Pervez, CFA - Head of Research & RMJun 10.16 -1.28 -36.52 15.62 Fund manager's reviewYTD 14.12 13.07 3.95 -8.47 11.58Benchmark 10.95 13.01 10.02 9.94 14.23Difference 3.17 0.05 -6.07 -18.41 -2.65
Non Compliant Investments under Circular 07/2009
Contact usJS Investments Limited
Azgard Nine Ltd. TFC 16,255,565 (16,255,565) - - - Toll Free: 0800 - 00887Azgard Nine Ltd.a PPTFCs 75,000,000 (75,000,000) - - - E-mail: [email protected] Website: www.jsil.comAgritech Limited Sukuk 59,572,782 (59,572,782) - - - Agritech Ltd.b TFC - - - - - Dewan Cement Ltd.c TFC 50,000,000 (49,990,000) 10,000 0.00 0.00 Azgard Nine Ltd.d PPTFC - - - - - Disclosure for WWF Liability under Circular 17 of 2012
Disclaimer : This publication is for informational purposes only and nothing herein should be construed as a solicitation, recommendation or an offer to buy or sell any fund. All investments in mutual funds are subject to marketrisks. The NAV based prices of units and any dividends/returns thereon are dependent on forces and factors affecting the capital markets. These may go up or down based on market conditions. Past performance is notnecessarily indicative of future results.
Value after
provision
% ofNet
Assets
% of GrossAssets
Name of Investment
TypeValue before
provision
Provision held
(if any)
JS IF is an income fund that aims to preserve investor’s capital while providing a regularstream of current income on an annual basis which is higher than that offered bycommercial banks on deposits of a similar liquidity profile as this fund. The fund operatesa diverse portfolio of investment-grade debt securities, government securities and moneymarket instruments. The fund may maintains liquidity in the form of spread transactionsand bank deposits.
For the month of October 2012, JSIF yielded an annualized returnof 11.72% as compared to the benchmark of 9.78%; out-performing it by 1.94%. The YTD annualized return of JSIF outperformed the benchmark by 3.17% by giving a return of 14.12%.
0.74%
0.72%
1.29%
0.001%
0.0% 0.5% 1.0% 1.5% 2.0%
United Bank Ltd
Orix Leasing Pakistan
Jahangir Siddiqui CoLtd - V
Dewan Cement
AAA, 33.83%
AA+, 0.74%
AA, 20.49%"<BBB", 0.001%
A+, 44.23%
1 From Mar '12, the benchmark was changed from 60% 1Year PKRV Rate + 40% 6M KIBOR Rate to 40% 1Year PKRV Rate + 60% 6M KIBOR2 Annualized performance return is based as per MUFAP stated methodology.
(a) The commercial paper amounting to Rs. 75 mn of Azgard Nine Ltd has been settled through Issuance of 15,000 PPTFC's of an equivalent amount in the name of the fund. (b) Fund has received Agritech PPTFC against interest receivable of Agritech Sukuk which is valued at zero but cost is carried at 11,245,000. (c) Non rated securities. (d) The fund received 4,827 zero coupon PPTFCs against interest receivable of listed and unlisted TFCs. Since these PPTFCs are received against already defaulted securities and have non-performing status in MUFAP, therefore the management as a matter of prudence maintained the provision against the said PPTFCsThese PPTFCs are valued at zero but cost is carried at 24,135,000.
The Fund/Scheme has not made provisions amounting to Rs. 18,758,478against Worker’s Welfare Fund (WWF) liability, if the same were made theNAV per unit/return of the Scheme would be lower by Rs. 1.31 / 1.5%. Fordetails investors are advised to read the Note 9 of the latest FinancialStatements of the Scheme.
JS Income Fund (JS IF)

Performance data and analytics MUFAP Recommended Format Oct-12Investment philosophy Asset allocation (%)
Oct-12 Sep-12Cash 63.40 54.69TFCs / Sukkuks 0.00 5.90T Bills 35.83 20.00PIBs 0.00 18.38Other including receivables 0.77 1.03
Key informationFund type Open endCategory Aggressive Fixed Income Scheme Total 100.00 100.00Fund launch date 22 January, 2008Net Assets (PKR mn) 216.50NAV (PKR) 103.56 Asset quality (%age of total assets)Benchmark BM AIF1
Management fee 1.50%Front-end Load 1.00%Back-end Load NILPricing mechanism Forward Trustee Central Depository Company of Pakistan Ltd.Dealing Days & Cut-off time (Monday to Friday) 3:00 p.m.Auditor Ernst & Young Ford Rhodes Sidat Hyder & Co.Risk profile Medium Listing LSEFund stability rating BBB-(f)Leverage NILAMC Rating AM2- (By JCR-VIS)
Performance (%) Annualised performance2
1M 6M 1Y 3Y LaunchFund 11.83 14.97 20.87 9.30 8.81 Statistical analysisBenchmark 9.67 11.38 12.19 11.97 14.79 Fund BenchmarkDifference 2.16 3.59 8.68 -2.67 -5.98 Standard Deviation 8.5% 0.9%
Largest Month Gain 5.1% 1.2%Monthly performance (%) Annualised performance2 Largest Month Loss -13.1% 0.0%
FY13 FY12 FY11 FY10 FY09 % Positive Months 81.4% 100.0%Jul 12.46 28.90 11.26 26.11 11.91 Duration (Yr) 0.11Aug 27.73 13.55 10.63 -2.25 9.07 Weighted Avg. Maturity (Yr) 0.11Sep 10.05 12.71 33.28 6.67 13.75Oct 11.83 59.53 -9.29 -31.52 14.41Nov 18.90 8.74 -5.54 -31.48Dec 12.17 51.31 -6.30 17.38Jan 26.73 -60.02 0.00 13.61Feb 24.53 29.14 10.37 15.08Mar 22.75 26.56 -31.12 14.81Apr 37.34 33.08 12.73 12.43 Investment Committee MembersMay 12.49 31.61 -4.91 35.60 Mr. Rashid Mansur - Chief Executive OfficerJun 12.42 -159.51 13.20 -18.87 Mr. Khawar Iqbal - Chief Financial OfficerYTD 15.85 26.16 -1.99 -2.72 7.72 Dr. Ali Akhtar Ali - CIO / Fund ManagerBenchmark 10.86 12.97 10.02 9.94 14.23 Ms. Maleeha Mimi Bangash - Chief Strategy Officer Difference 4.99 13.19 -12.01 -12.67 -6.51 Mr. Assad H. Khan - Country Head Business Development
Mr. Zohaib Pervez, CFA - Head of Research & RMDetail of Non Compliant Investment
Contact usJS Investments LimitedToll Free: 0800 - 00887E-mail: [email protected] Website: www.jsil.com
Fund manager's review Disclosure for WWF Liability under Circular 17 of 2012
Disclaimer : This publication is for informational purposes only and nothing herein should be construed as a solicitation, recommendation or an offer to buy or sell any fund. All investments in mutual funds are subject tomarket risks. The NAV based prices of units and any dividends/returns thereon are dependent on forces and factors affecting the capital markets. These may go up or down based on market conditions. Past performance isnot necessarily indicative of future results.
JS AIF aims at generating current income on investments while maintaining theprospects of capital appreciation by investing in a diversified portfolio of money marketand fixed income instruments. The fund may aggressively adjust asset weightings totake advantage of directional macro and micro economic trends and may hold some oreven all of its assets in cash to either provide liquidity or for defensive purposes.
JS Aggressive Income Fund reported an annualized return of 11.83% for the month ofOctober 2012 as compared to the annualized benchmark return of 9.67%,outperforming the benchmark by 2.16%. On YTD basis, annualized return of JSAIFstood at 15.85% and outperformed its benchmark by 4.99%.
AA, 42.02%
AAA, 35.83%"<BBB", 0.00%
A+, 21.38%
1 From Mar '12, the benchmark was changed from 60% 1Year PKRV Rate + 40% 6-M KIBOR Rate to 1 Year PKRV Rate 2 Annualized performance return is based as per MUFAP stated methodology.
* Non rated securities
The Fund/Scheme has not made provisions amounting to Rs. 1,098,243against Worker’s Welfare Fund (WWF) liability, if the same were made theNAV per unit/return of the Scheme would be lower by Rs. 0.53 / 0.5%. Fordetails investors are advised to read the Note 7 of the latest FinancialStatements of the Scheme.
Name of Type Value Provision Value % Net % G ross Investment before held after Assets Assets
Dewan Cement* TFC 50 ,000 ,00 0 49,990,000 10,000 0.00 0.00
JS Aggressive Income Fund (JS AIF)
Performance data and analytics MUFAP Recommended Format Oct-12Investment philosophy Asset allocation (%)
Oct-12 Sep-12Cash 38.72 16.13 Placement with Banks and DFIs - - T Bills 61.23 83.82 Other including receivables 0.05 0.05 Total 100.00 100.00
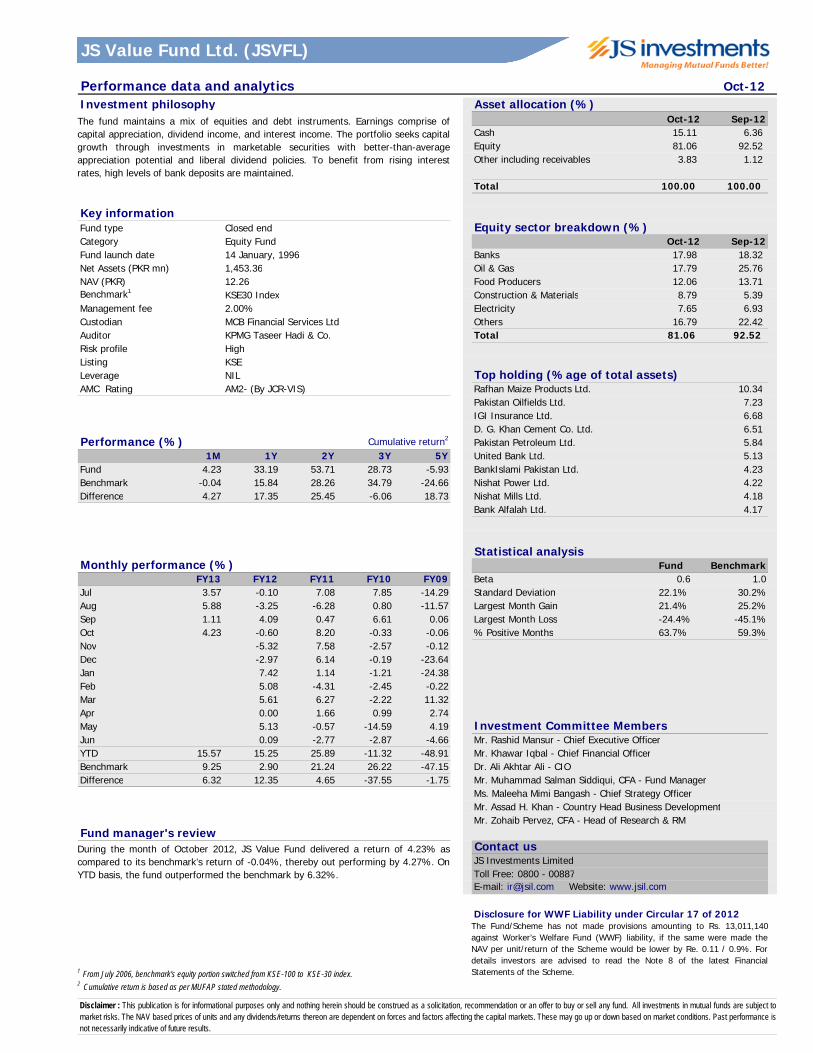
Key information Asset quality (%age of total assets)Fund type Open endCategory Money Market SchemeFund launch date 29 March, 2010Net Assets (PKR mn) 1,807.68NAV (PKR) 103.31Benchmark BM CF1
Management fee 1.00%Front-end Load 1.00%Back-end Load NILPricing mechanism BackwardTrustee MCB Financial Services Ltd Dealing Days & Cut-off time (Monday to Friday) 3:00 p.m.Auditor Ernst & Young Ford Rhodes Sidat HyderRisk profile Extremely LowListing LSEFund stability rating AA+(f) - (By JCR-VIS)Leverage NIL Statistical analysisAMC Rating AM2- (By JCR-VIS) Fund Benchmark
Standard Deviation 0.7% 0.5%Largest Month Gain 1.2% 0.9%
Performance (%) Annualised performance2 Largest Month Loss 0.0% 0.0%1M 6M 1Y Launch % Positive Months 100.0% 100.0%
Fund 9.77 10.65 10.91 12.64 Duration (Days) 47Benchmark 9.01 9.65 9.94 11.14 Weighted Avg. Maturity (Days) 47Difference 0.75 1.00 0.97 1.50
Monthly performance (%) Annualised performance2
FY13 FY12 FY11 FY10Jul 10.42 11.66 11.00 n/aAug 13.78 13.06 10.88 n/aSep 8.35 11.85 10.89 n/aOct 9.77 13.81 12.32 n/aNov 10.43 11.43 n/a Investment Committee MembersDec 9.64 13.16 n/a Mr. Rashid Mansur - Chief Executive OfficerJan 11.03 10.76 n/a Mr. Khawar Iqbal - Chief Financial OfficerFeb 9.72 12.31 n/a Dr. Ali Akhtar Ali - Chief Investment OfficerMar 10.31 12.32 n/a Ms. Nazia Enam Siddiqui- Fund ManagerApr 10.79 12.61 10.74 Ms. Maleeha Mimi Bangash - Chief Strategy Officer May 10.00 11.28 8.99 Mr. Assad H. Khan - Country Head Business DevelopmentJun 10.13 11.80 10.40 Mr. Zohaib Pervez, CFA - Head of Research & RMYTD 10.74 11.62 12.01 9.90Benchmark 9.70 10.09 10.65 9.85 Contact usDifference 1.04 1.53 1.36 0.05 JS Investments Limited
Toll Free: 0800 - 00887E-mail: [email protected] Website: www.jsil.com
Fund manager's review
Disclosure for WWF Liability under Circular 17 of 2012
Disclaimer : This publication is for informational purposes only and nothing herein should be construed as a solicitation, recommendation or an offer to buy or sell any fund. All investments in mutual funds are subject tomarket risks. The NAV based prices of units and any dividends/returns thereon are dependent on forces and factors affecting the capital markets. These may go up or down based on market conditions. Past performance isnot necessarily indicative of future results.
JS Cash Fund (JS CF) is an open-end 'Money Market Scheme' that mainly invests in lowrisk short-term fixed income instruments including money market instruments toprovide a regular and reasonable return to investors while ensuring high liquidity. TheFund shall invest primarily in short duration instruments and may even hold some or allof its assets in cash for the purpose maintaining liquidity.
JS Cash Fund reported an annualized return of 9.77% for the month of October 2012as compared to the annualized benchmark return of 9.01%, outperforming thebenchmark by 0.75%.The YTD annualized return of JSCF outperformed the benchmarkby 1.04% by providing a return of 10.74%.
1 50% Average return of 3-months deposit rates of AA and above rated scheduled commercial Bank(s), and 50% average 3-months T-Bill rate.2 Annualised return is based as per MUFAP stated methodology.
A+, 0.08
AA+, 0.002
AA, 38.63
AAA, 61.23
The Fund/Scheme has not made provisions amounting to Rs. 8,550,759against Worker’s Welfare Fund (WWF) liability, if the same were made theNAV per unit/return of the Scheme would be lower by Rs. 0.49 / 0.5%. Fordetails investors are advised to read the Note 6 of the latest FinancialStatements of the Scheme.
JS Cash Fund (JS CF)

Performance data and analytics Oct-12Investment philosophy Asset allocation (%)
Oct-12 Sep-12Cash 28.51 16.29 Equity 67.76 80.71 Other including receivables 3.73 3.01
Key information Total 100.00 100.00 Fund type Closed end Category Equity FundFund launch date 06 June, 2006 Equity sector breakdown (%)Net Assets (PKR mn) 3,254.66 Oct-12 Sep-12NAV (PKR) 11.39 Banks 22.84 23.78 Benchmark KSE30 Index Oil & Gas 13.97 21.56 Management fee 2.00% Electricity 9.60 9.89 Trustee MCB Financial Services Ltd Construction & Materials 5.52 0.96 Auditor Ernst & Young Ford Rhodes Sidat Hyder Food Producers 5.37 5.96 Risk profile High Others 10.47 18.56 Listing KSE, LSE & ISE Total 67.76 80.71 Leverage NILAMC Rating AM2- (By JCR-VIS)
Top holding (%age of total assets)Pakistan State Oil Co. Ltd. 7.76
Performance (%) Cumulative return1 United Bank Ltd. 6.22 1M 1Y 2Y 3Y Launch Pakistan Oilfields Ltd. 5.38
Fund 2.34 37.33 54.92 35.60 12.37 Nishat Chunian Power Ltd. 5.09 Benchmark -0.04 15.84 28.26 34.79 6.94 National Bank of Pakistan 4.85 Difference 2.38 21.49 26.66 0.81 5.43 Bank Alfalah Ltd. 4.76
Nishat Power Ltd. 4.50 Rafhan Maize Products Ltd. 4.12
Monthly performance (%) Pakistan Telecommunication Co. Ltd. 3.96 FY13 FY12 FY11 FY10 FY09 Lucky Cement Ltd. 3.92
Jul 3.80 -1.13 6.80 7.80 -15.66Aug 5.36 -5.05 -7.98 9.99 -16.20Sep -0.71 5.12 2.96 7.41 0.00 Statistical analysisOct 2.34 -3.31 2.45 -0.95 -0.60 Fund BenchmarkNov -3.28 6.24 -1.48 -0.17 Beta 0.8 1.0Dec -3.95 9.50 0.44 -35.17 Standard Deviation 25.8% 30.7%Jan 8.93 1.43 -0.62 -7.05 Largest Month Gain 18.9% 25.2%Feb 9.60 -6.08 -2.13 5.44 Largest Month Loss -35.2% -45.1%Mar 6.89 8.54 1.15 18.86 % Positive Months 55.8% 55.8%Apr 2.49 -0.09 -0.19 0.68May 2.07 1.98 -12.65 4.65Jun -0.35 -3.54 -0.54 -1.41YTD 11.13 17.92 22.56 6.51 -45.02Benchmark 9.25 2.90 21.24 26.22 -47.15Difference 1.88 15.02 1.32 -19.71 2.14
Investment Committee MembersMr. Rashid Mansur - Chief Executive OfficerMr. Khawar Iqbal - Chief Financial Officer
Fund manager's review Dr. Ali Akhtar Ali - CIO / Fund ManagerMs. Maleeha Mimi Bangash - Chief Strategy Officer Mr. Assad H. Khan - Country Head Business DevelopmentMr. Zohaib Pervez, CFA - Head of Research & RM
Contact usJS Investments LimitedToll Free: 0800 - 00887E-mail: [email protected] Website: www.jsil.com
Disclosure for WWF Liability under Circular 17 of 2012
Disclaimer : This publication is for informational purposes only and nothing herein should be construed as a solicitation, recommendation or an offer to buy or sell any fund. All investments in mutual funds are subject tomarket risks. The NAV based prices of units and any dividends/returns thereon are dependent on forces and factors affecting the capital markets. These may go up or down based on market conditions. Past performance isnot necessarily indicative of future results.
The main objective of JSGF is to enable the Certificate Holders to participate in adiversified portfolio of high quality equity securities listed on the stock exchanges andto maximize the investment return, by prudent investment management.
During the month of October 2012, JS Growth Fund delivered a return of 2.34% ascompared to its benchmark’s return of -0.04%, thereby outperforming it by 2.38%.On YTD basis, the fund out performed the benchmark by 1.88%.
1 Cumulative return is based as per MUFAP stated methodology.
The Fund/Scheme has not made provisions amounting to Rs. 30,179,825against Worker’s Welfare Fund (WWF) liability, if the same were made theNAV per unit/return of the Scheme would be lower by Re. 0.11 / 0.9%. Fordetails investors are advised to read the Note 8 of the latest FinancialStatements of the Scheme.
JS Growth Fund (JSGF)
Performance data and analytics Oct-12Investment philosophy Asset allocation (%)
Oct-12 Sep-1215.11 6.36 81.06 92.52 3.83 1.12
Total 100.00 100.00
Key informationFund type Closed end Equity sector breakdown (%)Category Equity Fund Oct-12 Sep-12Fund launch date 14 January, 1996 Banks 17.98 18.32 Net Assets (PKR mn) 1,453.36 Oil & Gas 17.79 25.76 NAV (PKR) 12.26 Food Producers 12.06 13.71 Benchmark1 KSE30 Index Construction & Materials 8.79 5.39 Management fee 2.00% Electricity 7.65 6.93 Custodian MCB Financial Services Ltd Others 16.79 22.42 Auditor KPMG Taseer Hadi & Co. Total 81.06 92.52 Risk profile HighListing KSELeverage NIL Top holding (%age of total assets)AMC Rating AM2- (By JCR-VIS) Rafhan Maize Products Ltd. 10.34
Pakistan Oilfields Ltd. 7.23 IGI Insurance Ltd. 6.68 D. G. Khan Cement Co. Ltd. 6.51
Performance (%) Cumulative return2 Pakistan Petroleum Ltd. 5.84 1M 1Y 2Y 3Y 5Y United Bank Ltd. 5.13
Fund 4.23 33.19 53.71 28.73 -5.93 BankIslami Pakistan Ltd. 4.23 Benchmark -0.04 15.84 28.26 34.79 -24.66 Nishat Power Ltd. 4.22 Difference 4.27 17.35 25.45 -6.06 18.73 Nishat Mills Ltd. 4.18
Bank Alfalah Ltd. 4.17
Statistical analysisMonthly performance (%) Fund Benchmark
FY13 FY12 FY11 FY10 FY09 Beta 0.6 1.0Jul 3.57 -0.10 7.08 7.85 -14.29 Standard Deviation 22.1% 30.2%Aug 5.88 -3.25 -6.28 0.80 -11.57 Largest Month Gain 21.4% 25.2%Sep 1.11 4.09 0.47 6.61 0.06 Largest Month Loss -24.4% -45.1%Oct 4.23 -0.60 8.20 -0.33 -0.06 % Positive Months 63.7% 59.3%Nov -5.32 7.58 -2.57 -0.12Dec -2.97 6.14 -0.19 -23.64Jan 7.42 1.14 -1.21 -24.38Feb 5.08 -4.31 -2.45 -0.22Mar 5.61 6.27 -2.22 11.32Apr 0.00 1.66 0.99 2.74May 5.13 -0.57 -14.59 4.19 Investment Committee MembersJun 0.09 -2.77 -2.87 -4.66 Mr. Rashid Mansur - Chief Executive OfficerYTD 15.57 15.25 25.89 -11.32 -48.91 Mr. Khawar Iqbal - Chief Financial OfficerBenchmark 9.25 2.90 21.24 26.22 -47.15 Dr. Ali Akhtar Ali - CIODifference 6.32 12.35 4.65 -37.55 -1.75 Mr. Muhammad Salman Siddiqui, CFA - Fund Manager
Ms. Maleeha Mimi Bangash - Chief Strategy Officer Mr. Assad H. Khan - Country Head Business DevelopmentMr. Zohaib Pervez, CFA - Head of Research & RM
Fund manager's reviewContact usJS Investments LimitedToll Free: 0800 - 00887E-mail: [email protected] Website: www.jsil.com
Disclosure for WWF Liability under Circular 17 of 2012
Disclaimer : This publication is for informational purposes only and nothing herein should be construed as a solicitation, recommendation or an offer to buy or sell any fund. All investments in mutual funds are subject tomarket risks. The NAV based prices of units and any dividends/returns thereon are dependent on forces and factors affecting the capital markets. These may go up or down based on market conditions. Past performance isnot necessarily indicative of future results.
CashEquityOther including receivables
The fund maintains a mix of equities and debt instruments. Earnings comprise ofcapital appreciation, dividend income, and interest income. The portfolio seeks capitalgrowth through investments in marketable securities with better-than-averageappreciation potential and liberal dividend policies. To benefit from rising interestrates, high levels of bank deposits are maintained.
During the month of October 2012, JS Value Fund delivered a return of 4.23% ascompared to its benchmark’s return of -0.04%, thereby out performing by 4.27%. OnYTD basis, the fund outperformed the benchmark by 6.32%.
1 From July 2006, benchmark's equity portion switched from KSE-100 to KSE-30 index.2 Cumulative return is based as per MUFAP stated methodology.
The Fund/Scheme has not made provisions amounting to Rs. 13,011,140against Worker’s Welfare Fund (WWF) liability, if the same were made theNAV per unit/return of the Scheme would be lower by Re. 0.11 / 0.9%. Fordetails investors are advised to read the Note 8 of the latest FinancialStatements of the Scheme.
JS Value Fund Ltd. (JSVFL)
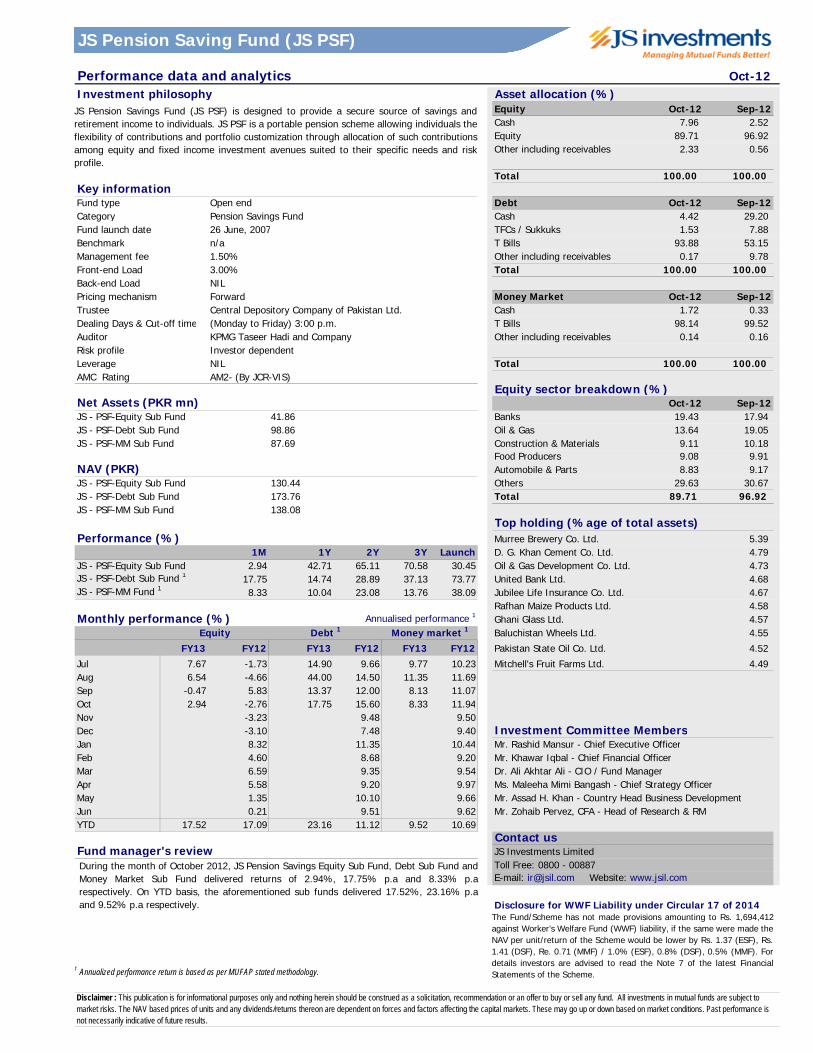
Performance data and analytics Oct-12Investment philosophy Asset allocation (%)
Equity Oct-12 Sep-12Cash 7.96 2.52 Equity 89.71 96.92 Other including receivables 2.33 0.56
Total 100.00 100.00 Key informationFund type Open end Debt Oct-12 Sep-12Category Pension Savings Fund Cash 4.42 29.20 Fund launch date 26 June, 2007 TFCs / Sukkuks 1.53 7.88 Benchmark n/a T Bills 93.88 53.15 Management fee 1.50% Other including receivables 0.17 9.78 Front-end Load 3.00% Total 100.00 100.00 Back-end Load NILPricing mechanism Forward Money Market Oct-12 Sep-12Trustee Central Depository Company of Pakistan Ltd. Cash 1.72 0.33 Dealing Days & Cut-off time (Monday to Friday) 3:00 p.m. T Bills 98.14 99.52 Auditor KPMG Taseer Hadi and Company Other including receivables 0.14 0.16 Risk profile Investor dependent Leverage NIL Total 100.00 100.00 AMC Rating AM2- (By JCR-VIS)
Equity sector breakdown (%)Net Assets (PKR mn) Oct-12 Sep-12JS - PSF-Equity Sub Fund 41.86 Banks 19.43 17.94 JS - PSF-Debt Sub Fund 98.86 Oil & Gas 13.64 19.05 JS - PSF-MM Sub Fund 87.69 Construction & Materials 9.11 10.18
Food Producers 9.08 9.91 NAV (PKR) Automobile & Parts 8.83 9.17 JS - PSF-Equity Sub Fund 130.44 Others 29.63 30.67 JS - PSF-Debt Sub Fund 173.76 Total 89.71 96.92 JS - PSF-MM Sub Fund 138.08
Top holding (%age of total assets)Performance (%) Murree Brewery Co. Ltd. 5.39
1M 1Y 2Y 3Y Launch D. G. Khan Cement Co. Ltd. 4.79 JS - PSF-Equity Sub Fund 2.94 42.71 65.11 70.58 30.45 Oil & Gas Development Co. Ltd. 4.73 JS - PSF-Debt Sub Fund 1 17.75 14.74 28.89 37.13 73.77 United Bank Ltd. 4.68 JS - PSF-MM Fund 1 8.33 10.04 23.08 13.76 38.09 Jubilee Life Insurance Co. Ltd. 4.67
Rafhan Maize Products Ltd. 4.58 Monthly performance (%) Annualised performance 1 Ghani Glass Ltd. 4.57
Baluchistan Wheels Ltd. 4.55
FY13 FY12 FY13 FY12 FY13 FY12 Pakistan State Oil Co. Ltd. 4.52
Jul 7.67 -1.73 14.90 9.66 9.77 10.23 Mitchell's Fruit Farms Ltd. 4.49 Aug 6.54 -4.66 44.00 14.50 11.35 11.69Sep -0.47 5.83 13.37 12.00 8.13 11.07Oct 2.94 -2.76 17.75 15.60 8.33 11.94Nov -3.23 9.48 9.50Dec -3.10 7.48 9.40 Investment Committee MembersJan 8.32 11.35 10.44 Mr. Rashid Mansur - Chief Executive OfficerFeb 4.60 8.68 9.20 Mr. Khawar Iqbal - Chief Financial OfficerMar 6.59 9.35 9.54 Dr. Ali Akhtar Ali - CIO / Fund ManagerApr 5.58 9.20 9.97 Ms. Maleeha Mimi Bangash - Chief Strategy Officer May 1.35 10.10 9.66 Mr. Assad H. Khan - Country Head Business DevelopmentJun 0.21 9.51 9.62 Mr. Zohaib Pervez, CFA - Head of Research & RMYTD 17.52 17.09 23.16 11.12 9.52 10.69
Contact usFund manager's review JS Investments Limited
Toll Free: 0800 - 00887E-mail: [email protected] Website: www.jsil.com
Disclosure for WWF Liability under Circular 17 of 2014
Debt 1 Money market 1
Disclaimer : This publication is for informational purposes only and nothing herein should be construed as a solicitation, recommendation or an offer to buy or sell any fund. All investments in mutual funds are subject to market risks. The NAV based prices of units and any dividends/returns thereon are dependent on forces and factors affecting the capital markets. These may go up or down based on market conditions. Past performance is not necessarily indicative of future results.
Equity
JS Pension Savings Fund (JS PSF) is designed to provide a secure source of savings andretirement income to individuals. JS PSF is a portable pension scheme allowing individuals theflexibility of contributions and portfolio customization through allocation of such contributionsamong equity and fixed income investment avenues suited to their specific needs and riskprofile.
During the month of October 2012, JS Pension Savings Equity Sub Fund, Debt Sub Fund andMoney Market Sub Fund delivered returns of 2.94%, 17.75% p.a and 8.33% p.arespectively. On YTD basis, the aforementioned sub funds delivered 17.52%, 23.16% p.aand 9.52% p.a respectively.
The Fund/Scheme has not made provisions amounting to Rs. 1,694,412against Worker’s Welfare Fund (WWF) liability, if the same were made theNAV per unit/return of the Scheme would be lower by Rs. 1.37 (ESF), Rs.1.41 (DSF), Re. 0.71 (MMF) / 1.0% (ESF), 0.8% (DSF), 0.5% (MMF). Fordetails investors are advised to read the Note 7 of the latest FinancialStatements of the Scheme.
1 Annualized performance return is based as per MUFAP stated methodology.
JS Pension Saving Fund (JS PSF)
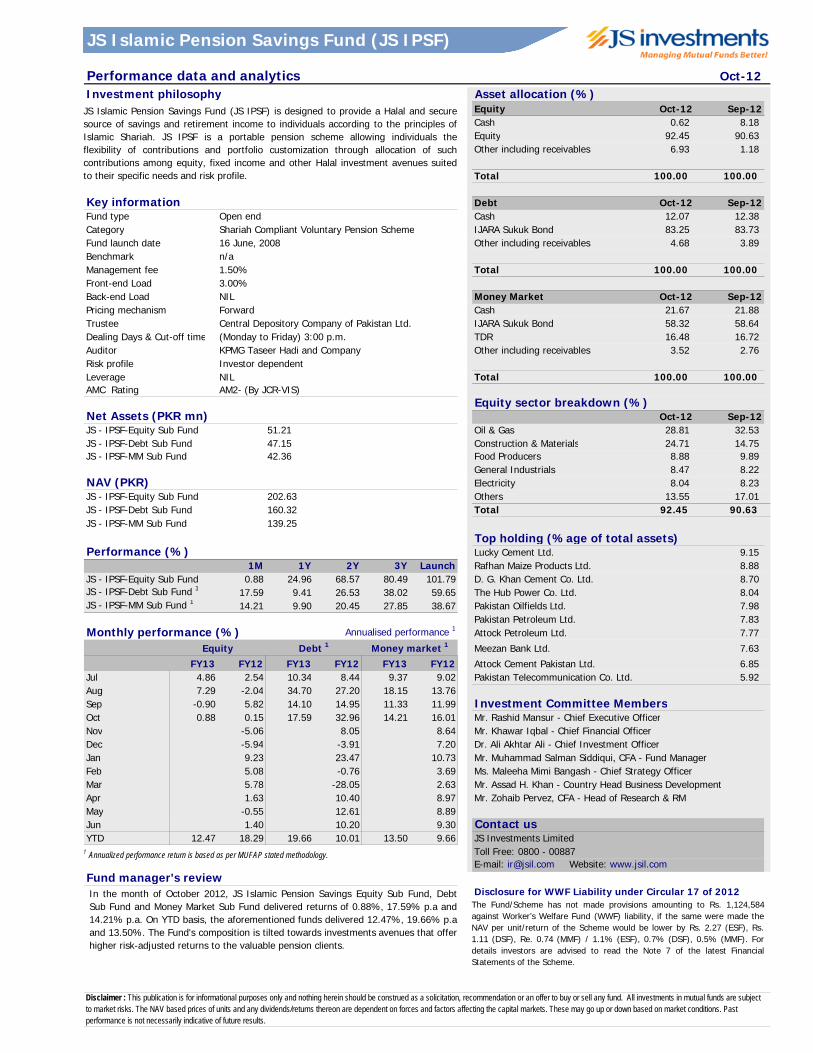
Performance data and analytics Oct-12Investment philosophy Asset allocation (%)
Equity Oct-12 Sep-12Cash 0.62 8.18 Equity 92.45 90.63 Other including receivables 6.93 1.18
Total 100.00 100.00
Key information Debt Oct-12 Sep-12Fund type Open end Cash 12.07 12.38 Category Shariah Compliant Voluntary Pension Scheme IJARA Sukuk Bond 83.25 83.73 Fund launch date 16 June, 2008 Other including receivables 4.68 3.89 Benchmark n/aManagement fee 1.50% Total 100.00 100.00 Front-end Load 3.00%Back-end Load NIL Money Market Oct-12 Sep-12Pricing mechanism Forward Cash 21.67 21.88 Trustee Central Depository Company of Pakistan Ltd. IJARA Sukuk Bond 58.32 58.64 Dealing Days & Cut-off time (Monday to Friday) 3:00 p.m. TDR 16.48 16.72 Auditor KPMG Taseer Hadi and Company Other including receivables 3.52 2.76 Risk profile Investor dependent Leverage NIL Total 100.00 100.00 AMC Rating AM2- (By JCR-VIS)
Equity sector breakdown (%)Net Assets (PKR mn) Oct-12 Sep-12JS - IPSF-Equity Sub Fund 51.21 Oil & Gas 28.81 32.53 JS - IPSF-Debt Sub Fund 47.15 Construction & Materials 24.71 14.75 JS - IPSF-MM Sub Fund 42.36 Food Producers 8.88 9.89
General Industrials 8.47 8.22 NAV (PKR) Electricity 8.04 8.23 JS - IPSF-Equity Sub Fund 202.63 Others 13.55 17.01 JS - IPSF-Debt Sub Fund 160.32 Total 92.45 90.63 JS - IPSF-MM Sub Fund 139.25
Top holding (%age of total assets)Performance (%) Lucky Cement Ltd. 9.15
1M 1Y 2Y 3Y Launch Rafhan Maize Products Ltd. 8.88 JS - IPSF-Equity Sub Fund 0.88 24.96 68.57 80.49 101.79 D. G. Khan Cement Co. Ltd. 8.70 JS - IPSF-Debt Sub Fund 1 17.59 9.41 26.53 38.02 59.65 The Hub Power Co. Ltd. 8.04 JS - IPSF-MM Sub Fund 1 14.21 9.90 20.45 27.85 38.67 Pakistan Oilfields Ltd. 7.98
Pakistan Petroleum Ltd. 7.83 Monthly performance (%) Annualised performance 1 Attock Petroleum Ltd. 7.77
Meezan Bank Ltd. 7.63
FY13 FY12 FY13 FY12 FY13 FY12 Attock Cement Pakistan Ltd. 6.85 Jul 4.86 2.54 10.34 8.44 9.37 9.02 Pakistan Telecommunication Co. Ltd. 5.92 Aug 7.29 -2.04 34.70 27.20 18.15 13.76Sep -0.90 5.82 14.10 14.95 11.33 11.99 Investment Committee MembersOct 0.88 0.15 17.59 32.96 14.21 16.01 Mr. Rashid Mansur - Chief Executive OfficerNov -5.06 8.05 8.64 Mr. Khawar Iqbal - Chief Financial OfficerDec -5.94 -3.91 7.20 Dr. Ali Akhtar Ali - Chief Investment OfficerJan 9.23 23.47 10.73 Mr. Muhammad Salman Siddiqui, CFA - Fund Manager Feb 5.08 -0.76 3.69 Ms. Maleeha Mimi Bangash - Chief Strategy Officer Mar 5.78 -28.05 2.63 Mr. Assad H. Khan - Country Head Business DevelopmentApr 1.63 10.40 8.97 Mr. Zohaib Pervez, CFA - Head of Research & RMMay -0.55 12.61 8.89Jun 1.40 10.20 9.30 Contact usYTD 12.47 18.29 19.66 10.01 13.50 9.66 JS Investments Limited
Toll Free: 0800 - 00887E-mail: [email protected] Website: www.jsil.com
Fund manager's reviewDisclosure for WWF Liability under Circular 17 of 2012
Disclaimer : This publication is for informational purposes only and nothing herein should be construed as a solicitation, recommendation or an offer to buy or sell any fund. All investments in mutual funds are subject to market risks. The NAV based prices of units and any dividends/returns thereon are dependent on forces and factors affecting the capital markets. These may go up or down based on market conditions. Past performance is not necessarily indicative of future results.
Equity Debt 1 Money market 1
JS Islamic Pension Savings Fund (JS IPSF) is designed to provide a Halal and securesource of savings and retirement income to individuals according to the principles ofIslamic Shariah. JS IPSF is a portable pension scheme allowing individuals theflexibility of contributions and portfolio customization through allocation of suchcontributions among equity, fixed income and other Halal investment avenues suitedto their specific needs and risk profile.
In the month of October 2012, JS Islamic Pension Savings Equity Sub Fund, DebtSub Fund and Money Market Sub Fund delivered returns of 0.88%, 17.59% p.a and14.21% p.a. On YTD basis, the aforementioned funds delivered 12.47%, 19.66% p.aand 13.50%. The Fund's composition is tilted towards investments avenues that offerhigher risk-adjusted returns to the valuable pension clients.
The Fund/Scheme has not made provisions amounting to Rs. 1,124,584against Worker’s Welfare Fund (WWF) liability, if the same were made theNAV per unit/return of the Scheme would be lower by Rs. 2.27 (ESF), Rs.1.11 (DSF), Re. 0.74 (MMF) / 1.1% (ESF), 0.7% (DSF), 0.5% (MMF). Fordetails investors are advised to read the Note 7 of the latest FinancialStatements of the Scheme.
1 Annualized performance return is based as per MUFAP stated methodology.
JS Islamic Pension Savings Fund (JS IPSF)

JS INVESTMENTS LIMITED
Karachi 7th Floor, The Forum , Block 9, Clifton, Karachi, Pakistan UAN: 021 111 222 626
Lahore 1st floor, Plot # 4, Block R, MM Alam Road, Lahore, Pakistan UAN: 042 111 222 626
Islamabad Office # 413, 4th Floor, ISE Building, Jinnah Avenue Islamabad UAN: 051 111 222 626
JS BANK BRANCHES
Now you can also invest in JS Investments Mutual Funds & Pension Funds through JS Bank Branches, some of which are listed below:
KARACHI BRANCHES:
Shaheen Complex: Shaheen Complex, Dr. Ziauddin Ahmed Road, P.O. Box 4847, Karachi Tel: 021-111-572-265
Teen Talwar: Plot No G-3 Shop no 6 & 7, Alhabib Arcade, Block 7, Clifton Tel: 021-35837390
New Challi: Plot No #SR 6/10 (Frere Road), Fakhri Trade Centre, Shahra-e-Liaquat, Karachi Tel: 021-32602100
SITE Area: Plot No B53-B, S.I.T.E. Karachi Tel: 021-32550080
GulshaneIqbal: Plot No SB-33, Bl 13-B, Scheme 24, Main University Rd, Gulshan-e-Iqbal, Karachi Tel: 021-34829055
Shahra-e-Faisal: Plot No 32, 1-A, Al-Tijarah Centre, Block 6, P.E.C.H.S. Karachi Tel: 021-34373240
LAHORE BRANCHES:
Upper Mall Branch: 201-A Upper Mall, Shahra-e-Quaid e Azam, P.O. Box No 249-D, Lahore Tel: 042-35776515
M.M.Alam Rd Branch: M.M. Alam Road , Main Boulevard, Lahore Tel: 042-35778721
Model Town Branch: Bank square, Model Town, Lahore Tel: 042-35915614
Circular Road Branch: 51 Circular road, Lahore 54000, Pakistan Tel: 042-37379325
D.H.A. Branch: Plot no 312, Block Z, Phase III, D.H.A. Lahore Cantt Tel: 042-35692950
ISLAMABAD/RAWALPINDI BRANCHES:
Bank Road Branch: Plot #26, Bank Road, Rawalpindi Tel: 051-5120731
Blue Area Branch: I-E Ali Plaza, Blue Area, P.O. Box No 1330, Islamabad Tel: 051-2810121
HYDERABAD BRANCH:
Saddar Branch: Bldg 41/369, Saddar Bazar - Cantt, Hyderabad Tel: 022-9201337
MULTAN BRANCH:
Abdali road Branch: Jalil Centre, Abdali road, Multan Tel: 061-4574496
SIALKOT BRANCH:
Sialkot Cantt Branch: Property # 267, A-1, Bungalow 97 A , Aziz Shaheed Road, Sialkot, Cantonment Tel: 052-4272351
For Further Information, Contact Us:
Toll Free: 0800 00887 E-mail: [email protected] Website: www.jsil.com
www.facebook.com/jsinvestments www.twitter.com/jsinvestment
CONTACT INFORMATION
Disclaimer : This publication is for informational purposes only and nothing herein should be construed as a solicitation, recommendation or an offer to buy or sell any fund. All investments in mutual funds and pension funds are subject to market risks. The NAV based prices of units and any dividends/returns thereon are dependant on forces and factors affecting the capital markets. These may go up or down based on market conditions. Past performance is not necessarily indicative of future results.