fund manager commentary · performance as at 28 february 2015 26: fund manager commentary –...
TRANSCRIPT

Fund Manager
Commentary
February 2015
Contents
Australian Shares 3
Smaller Companies 5
International Shares 7
Australian Fixed Income 9
International Fixed Income 10
Credit 14
Cash 15
Australian Property 18
International Property 21
Active Balanced 23
Performance as at 28 February 2015 26
Fund Manager Commentary – February 2015 3
Australian Shares
Market review
The S&P/ASX Accumulation Index rose 6.9% during February, the largest monthly gain since 2011.
At a macro level, the Reserve Bank of Australia’s decision to cut interest rates to a record low spurred
a greater general appetite for risk. Similarly, a pledge from ECB officials for continued accommodative
monetary policy settings helped buoy sentiment. A deal between Greek and Eurozone policy makers
also removed a source of concern for the market.
At home, the local earnings season was reasonable, but not inspiring. Aggregate earnings
expectations across the market deteriorated slightly over reporting season, to around -2% for FY15.
This was largely driven by downgrades in resources; however this was more a case of the market
updating its forecasts on the basis of weaker commodity prices rather than a material decline in
underlying conditions. The remainder of the market ex-resources is expected to deliver roughly 7-8%
earnings growth. It was cost control, rather than revenue growth, which drove earnings. At the same
time, the trend towards increased dividend payouts continued. Corporate guidance generally
suggested companies are not overly optimistic about the near-term operating environment.
The resources sector (+11.3%) was the top performer for the month. Energy stocks posted the
strongest gains, driven by a rebound in the price of the Brent crude oil benchmark. Market
heavyweight BHP Billiton also recovered as investors cheered the miner’s commitment to retaining its
progressive dividend policy, alongside cost reduction.
The telecommunication sector (+0.6%) lost steam and was the worst performer over the month as
investors rotated towards more risk-sensitive areas. Similarly, the consumer staples space lagged the
broader market with supermarket giant, Woolworths, punished following a disappointing set of first-
half earnings. Finally, financials (+7.0%) strengthened with another round of healthy results reported
by the “Big Four” banks.
Portfolio performance
The BT Wholesale Core Australian Share Fund returned 6.94% (post-fee, pre-tax) in February 2015,
outperforming its benchmark by 0.02%.

Fund Manager Commentary – February 2015 4
Contributors
Supermarket giant, Woolworths (-3.37%), reported disappointing earnings and acknowledged what
we have asserted for some time - that its prices are too high in the face of increasing competition from
Coles and from discounters such as Aldi. Management indicated it needs to change their pricing but
are yet to offer a concrete strategy. The stock sold off this uncertainty and on the implication that profit
margins are likely to compress.
Diversified financials group, Macquarie (+17.23%) enjoyed strong gains as management indicated
that their full year profit is likely to come in at the upper end of their forecast range – which had itself
been raised in January. Macquarie is enjoying tailwinds from a number of factors, including a pipeline
of corporate action and increased trading volumes, as well as a weaker AUD. The company has
successfully altered its business profile since the GFC, shifting from a reliance on transaction–driven
investment banking to a greater focus on annuity-like income streams from its various leasing
businesses.
Detractors
Telstra (+0.28%) erased earlier gains to finish the month relatively flat. The company delivered a
pleasing earnings result, revealing a jump in first-half profits by 22.4% and significant gains in market
share among mobile subscribers. Looking ahead, there are some concerns over the level of opex.
However, the negatives are more than offset by a number of strengths, including the telco’s well-
entrenched position in the marketplace. Overall it remains our preferred blue chip dividend play over
the longer term, particularly given its ability to achieve low cost earnings growth.
BHP Billiton (+15%) saw its share price rebound from its 5-year low in January. The recovery in the
price of Brent crude oil offered a tailwind to performance, as well as a commitment by management to
maintain the company’s progressive dividend policy. However, going forward we believe the
company’s top line is likely to suffer in the face of weak commodity prices, which remain significantly
below their former peaks. Further, the company is likely to suffer a high capex burden over coming
years. Taken together we prefer to remain underweight the miner.

Fund Manager Commentary – February 2015 5
Strategy and outlook
The portfolio gained broadly in line with the benchmark in February. A return to profitability from
Qantas was beneficial, as was indications from Macquarie Group’s management that the company
should meet the top end of their earnings expectations for the year. The underweight in Woolworths
also helped, as management acknowledged our long-standing concern that its current pricing strategy
– and profit margins – was unsustainable in an increasingly competitive industry. There was a distinct
rotation within the market, as investors sought high quality beta in preference to the defensive yield
stocks. This weighed on our position in Telstra which gave up some of its recent gains.
We increased the exposure to Macquarie Group and to JB HiFi over the reporting season. Macquarie
Group is one of the few companies enjoying cyclical tailwinds, benefiting from low-cost funding costs,
increased trading volumes and a depreciating currency. We like the fact that the company has
increased its exposure to annuity-like assets, such as asset management and aircraft leasing, and is
less dependent on transaction-driven investment banking. JB HiFi delivered a surprisingly good set of
results, given the challenging environment of the past six months. It is displaying good cost control
and improved cash flow and should deliver high single-digit earnings growth for FY15.
We lightened up the position in Suncorp following its results. We have been conscious for some time
that it is in a sweet spot in terms of profit margins and that the environment in its general insurance
business would become incrementally more competitive. This dynamic has started to emerge and,
while the company has a diversified profile and the ability to fund at least one more special dividend, it
is entering a more challenging period. We also reduced the exposure to Telstra following a very
strong run, although it remains our favoured defensive yield stock.
The market is currently at an elevated valuation, leaving it vulnerable in the event of a geopolitical
shock. However, history shows us that the current valuation rating is supported by low rates – this is
augmented by the additional support of QE-fuelled liquidity and increased foreign interest as the AUD
depreciates. As a result, we would not be surprised to see a period of market consolidation, as it
digests its recent gains. There is certainly scope for rotation within the market, as the possibility of US
rate hikes and a marked convergence in yield levels across the market leaves the high yield “bond
proxies” looking vulnerable. In contrast, there are high quality industrial cyclicals delivering earnings
growth at reasonable valuations, often with an increasing dividend yield, which are looking
increasingly attractive.

Fund Manager Commentary – February 2015 6
Smaller Companies
Market review
The S&P Small Ordinaries Index rose 8.4% during February, outperforming the broader index as
investors sought cyclical beta in preference to defensive yield. At a macro level, the Reserve Bank of
Australia’s decision to cut interest rates to a record low spurred a greater general appetite for risk.
Similarly, a pledge from ECB officials for continued accommodative monetary policy settings helped
buoy sentiment. A deal between Greek and Eurozone policy makers also removed a source of
concern for the market.
At home, the local earnings season was reasonable, but not inspiring. Aggregate earnings
expectations across the broad market deteriorated slightly over reporting season, to around -2% for
FY15. This was largely driven by downgrades in resources; however this was more a case of the
market updating its forecasts on the basis of weaker commodity prices rather than a material decline
in underlying conditions. The remainder of the market ex-resources is expected to deliver roughly 7-
8% earnings growth. It was cost control, rather than revenue growth, which drove earnings. At the
same time, the trend towards increased dividend payouts continued. Corporate guidance generally
suggested companies are not overly optimistic about the near-term operating environment.
The energy sector posted the strong gains, driven by a rebound in the price of the Brent crude oil
benchmark. Healthcare also did well. The telecommunication sector lost steam and was the worst
performer over the month as investors rotated towards more risk-sensitive areas.
Portfolio performance
The BT Wholesale Smaller Companies Fund returned 7.97% (post-fee, pre-tax) in February,
underperforming its benchmark the S&P/ASX Small Ordinaries Accumulation Index by 0.46%.
The portfolio made strong gains in February, helped by positions in healthcare with Mayne Pharma
Group and Japara Healthcare standing out as notable contributors. Various consumer discretionaries
also did well as the market sought cyclicality and beta. The holding in Village Roadshow detracted as
poor weather hit operations at its theme parks and the cash position also dragged as the market
made strong gains, leaving the portfolio slightly behind the index for the month. The rebound in the
resources space as commodity prices stabilised also dragged on performance, although the portfolio
remains ahead of its index over 6 months and the longer term.
Contributors
Fund Manager Commentary – February 2015 7
Mayne Pharma Group surged in mid-February on news that the company was raising capital to
acquire several US trademarks in order to grow its business there. Institutional businesses made
aggressive bids for the equity placement in a show of approval for Mayne’s expansions plans.
Japara Healthcare bounced back from a weaker January as management indicated that the company
should meet the earning targets listed in its IPO prospectus despite an adverse change in its tax
status as a result of last year’s Federal budget. A strong focus on cost control and high occupancy
rates should offset the negative effects of the tax change.
Detractors
Village Roadshow reported a significant decline in first half profits due primarily to temporary closures
of its theme parks in December and January due to severe rainstorms. Management indicated it
would be controlling costs in order to mitigate this news. Looking forward they are also positive about
upcoming theatrical releases and greater clarity around the issue of online piracy.
Qube Logistics outperformed the index on the back of strong profit growth over H1 FY15. We do not
hold it in the portfolio and it dragged on relative performance as a result.
Strategy and outlook
The market is currently at elevated valuation, leaving it vulnerable in the event of a geopolitical shock.
However, history shows us that the current valuation rating is supported by low rates – this is
augmented by the additional support of QE-fuelled liquidity and increased foreign interest as the AUD
depreciates. As a result, we would not be surprised to see a period of market consolidation, as it
digests its recent gains. The dispersion in valuation and earnings outlook across the market is
conducive to stock picking and we continue to focus on companies that combine strong or improving
cash flow with reasonable valuation. In particular, we are looking for companies that offer niche
products, robust franchises or compelling “turnaround” stories.
There is certainly scope for rotation within the market, as the possibility of US rate hikes and a
marked convergence in yield levels across the market leaves the high yield “bond proxies” looking
vulnerable. In contrast, there are high quality industrial cyclicals delivering earnings growth at
reasonable valuations, often with an increasing dividend yield, which are looking increasingly
attractive.
Fund Manager Commentary – February 2015 8
International Shares
Market review
February was a strong month for global equities across the globe with the MSCI World ex Australia
returning 5.27%, driven by strong performances from the European and Japanese markets.
The European market was buoyed by the substantial quantitative easing package announced by the
ECB and the promise of support for markets. This saw many markets outperform strongly including
Germany (+6.6%), France (+7.5%), Italy (+8.9%), Spain (+7.5%). The key to a sustained rally in these
markets will be signs of a sustainable economic recovery and increasing inflation.
The US market continued its strong run, returning a positive 5.5%, but did see some profit taking into
month end as concerns started to build about the potential impact of rate rises that seem to be getting
closer and closer to being implemented.
In Asia, Japan did well with the Nikkei index returning 6.4%, driven by signs of an economic recovery
and some of the stimulatory packages starting to take effect. China returned 3.1% as further stimulus
cuts from the PBOC helped drive investor sentiment.
Notwithstanding the RBA rate cut and accompanying comments from Glenn Stevens, the AUD rose
against the USD (+0.6%). More broadly the AUD trade weighted index rose marginally against its
largest trading partners (+0.3%).
Portfolio performance
The BT Wholesale Core Global Share Fund returned 4.51% (post fee, pre-tax) in February,
underperforming its benchmark by 0.76%. The result was predominantly due to the underperformance
of North American stock positions, with Japanese and European positions also underperforming their
regional benchmarks over the month.
Thematically, the underperformance in the US was driven by weakness in relative valuation measures
for stock selection, along with momentum signals for industry selection. Investor sentiment and
business quality measures were minor positive contributors over the month. Underperformance in
Japan was largely due to momentum measures, both for stock and industry selection, which
outweighed positive returns to relative valuation signals. European markets produced a minor loss,
with all of valuation, momentum & quality measures showing weakness over February.
In terms of stock/ sector contributions, active sector positioning generated negative returns over the
month - notably the tilt towards Utilities that underperformed the broader market. Stock selection

Fund Manager Commentary – February 2015 9
within sector groups was also negative over the month, notably within Industrials and Information
Technology, offset by strong returns within the Energy sector
At a stock level, the strongest positive contributions came from overweight positions in Pandora
Media, a US headquartered music streaming service, Valero Energy, an American manufacturer &
distributor of transportation fuels; and Humana, a US health insurer.
The largest detractors were underweight positions in: GE, Walt Disney and Citigroup.
Strategy and outlook
Entering March, the Fund maintains its largest sector tilts towards Healthcare and away from
Consumer Staples. Thematically, we are mildly tilted towards higher quality companies with positive
momentum, and away from cheaper industry peers across all regions.
Fund Manager Commentary – February 2015 10
Australian Fixed Income
Market review
During February Australian three-year bond yields fell by 13 basis points to 1.79% from 1.92% and
ten-year yields rose by 5 basis points from 2.40% to 2.45%, with the 3-10s yield curve steepening to
66 basis points.
At its February meeting, the Reserve Bank decided to cut the cash rate by 25 basis points to 2.25%.
The Bank noted that the US economy continued to strengthen, but the Euro Area and Japanese
economies were both weaker than expected. It also noted that China’s growth was in line with policy
makers’ objectives.
The Reserve Bank expects the Australian economy to continue to grow at a below-trend pace with the
unemployment rate expected to peak higher than previously expected. However, a lower exchange
rate is likely to be needed to achieve balanced growth in the economy.
During the month the housing market continued to be bolstered by low interest rates - residential
property prices and housing finance continued to climb with the support of low lending rates.
Employment growth was weak after two months of strength and the unemployment rate kept rising to
6.4% from 6.1% and as a result, wage growth slowed to 2.5%. The CAPEX survey showed the fall in
mining investment has not been offset by non-mining investment and further declines in investment
are expected.
Portfolio performance
The BT Wholesale Fixed Interest Fund returned -0.07% in February (post-fees, pre-tax),
underperforming its benchmark by 0.35%.
In the alpha overlay, losses were mainly from Duration and FX strategies. The Government bond
component underperformed its benchmark with gains from Duration strategies offset by curve
strategies. The Credit component underperformed its benchmark with negative contributions from a
curve position, and a positive contribution from an underweight in the Supranational sector and
overweights in lower rated utility bonds.
Strategy and outlook The Reserve Bank of Australia left the cash rate unchanged at its March meeting although it stated that further monetary policy easing may be appropriate over the period ahead.

Fund Manager Commentary – February 2015 11
The CAPEX survey highlights the problem facing the Australian economy: mining investment is falling sharply and the non-mining sector is not picking the slack up as quickly as the Reserve Bank would like.
The housing market, particularly in Sydney, will be causing some concern although the Reserve Bank also stated that it is working with other regulators to assess and contain risks that may arise from the housing market.
We expect further monetary policy easing from the Reserve Bank. Should fourth quarter gross domestic product data released in early March come out weaker than expected further policy easing could occur as quickly as the April meeting. We do not rule out the cash rate going sub-2% by the end of the year.

Fund Manager Commentary – February 2015 12
International Fixed Income
Market review
International markets were dominated by active central banks and the Greek loan extension
negotiation. US Federal Reserve Chairperson Yellen reiterated that the Fed remains patient in raising
rates and indicated a hike is unlikely in the next couple of meetings. She confirmed that hike decisions
will be data dependant.
US Q4 GDP growth fell short of expectation with 2.6% annualized growth rate. The labour market
continued its strength with better-than-expected nonfarm payrolls. Euro area flash PMI for February
surprised to the upside and lower oil prices are believed to be the factor to a broad-based jump of the
services PMI.
After extended negotiations, the Eurozone Finance Ministers reached an agreement to extend loans
to Greece by four months. The PBC cut the Reserve Requirement Ratio (RRR), but the Politburo
reiterated that "we need to give higher priority to improving the structure of the economy".
Over the month, US and UK bond yields rose by 35 and 47 basis points, respectively. Japanese bond
yields rose by 6 basis points. Australian bond yields outperformed the US by 30 basis points. The
Australian dollar appreciated and the trade weighted index rose by 0.31% over the month.
Portfolio performance
The BT Wholesale Global Fixed Interest Fund returned -1.49% in February (post-fees, pre-tax),
underperforming its benchmark by 0.69%. The physical allocation to domestic credit returned just
above index, adding only marginally to the fund. The PAFI overlay however detracted as positions in
duration, cross-Market FX and macro cost performance through February’s bond market weakness.
Strategy and outlook
The Greek loan extension negotiation was a manifestation of political instability within the Eurozone. It
is highly likely that such events will continue to affect the Eurozone and the global market unless the
economic recovery takes hold. Before the expected benefits from lower energy prices flow through
the economy, energy producers have reacted to the lower prices by cutting supply. Even excluding
energy prices, the core inflation measures across countries are still stuck at low levels and deflation is
taking hold in Europe.

Fund Manager Commentary – February 2015 13
For central banks, deflation risks are a bigger concern than inflation and they will continue to be
dovish and a low interest rate environment will persist. Although the Fed is a little optimistic on the
economic recovery, it is reluctant to raise rates too soon.

Fund Manager Commentary – February 2015 14
Credit
Market review
Cash credit markets spreads were marginally tighter over February, with some support coming from
the stabilisation of global oil commodity prices. Early in the month WTI oil closed over $50 per barrel.
Economic data emanating out of the US remained positive with both better labour force participation
and supportive testimony from Yellen, the Chair of the US Federal Reserve. As a counterpoint to this
the Reserve Bank reduced the cash rate by 0.25 percentage points early in February due to signs of
domestic economic weakness.
Throughout the month all eyes were focused on whether Greece would be able to forge an agreement
with the troika over its debt programme. While many pundits viewed a Greek exit as unlikely it still
remained a risk until near the end of the month when the troika agreed with Greece on a 4 month
extension as it agreed to certain conditions.
From a fundamental bottom up perspective both US and Australian corporates reported semi-annual
and quarterly results, respectively. The results in the US were positive with the overall market
expectations of sales and earnings surprising marginally on the positive side in the face of a hit to
offshore earnings as the US dollar strengthened and energy companies impacted by the lower oil
price. In Australia, on the other hand, industrials which include mining service companies reported
weaker results than anticipated.
During the month the expansion of the spread to swap differential between AAA and BBB stopped.
Since mid-November the differential has grown reflecting an aversion to riskier issuers. In February
this dynamic stopped reflecting a more sanguine view of risk. The Australian iTraxx, the US CDX, and
Euro Main index tightened 13bp, 7bp and 10bp, respectively.
Portfolio performance
The BT Wholesale Enhanced Credit fund returned 0.48% in February (post-fees, pre-tax),
underperforming the benchmark by 0.05%. Negative performance came from the swap curve and an
underweight in select supra-nationals in the 5-7 year tenor, and negative performance from lower
rated utilities, and an underweight in Washington-backed Supra-nationals. Positive performance came
from an overweight in financials and real estate.
Activity over the month consisted of adjusting exposure in financials to take advantage of new
issuance outside the large four banks.

Fund Manager Commentary – February 2015 15
Strategy and outlook
Our macro credit view is neutral. Combined with a slower global growth outlook that has resulted in
stalling market performance, increased volatility, and increased headwinds from geopolitical event
risk, we view it as prudent to take an overall short term neutral view. On a spread to swap basis the
domestic credit index stabilised in February after widening marginally over the past quarter. While we
maintain a more sanguine medium to longer term view we believe recent volatility will persist and
possibly increase in the near term and be injurious to credit performance.
Going forward in the near term risk markets will continue to battle headwinds against the implied
growth outlooks from commodity price weakness, combined with ECB actions, uncertainty over
Greece and shifting expectations on US Fed raising rates. The recent uptick in oil prices has taken
some of the pressure off markets and high yield energy issuers but the recent increase in US oil
inventory levels could be a harbinger of further weakness.
While the global growth pulse is waning, we continue to be constructive on global growth
underpinning corporate creditworthiness as companies use cost control to continue to drive margins
in the absence of top line growth.
Domestically we see growth stagnating and we continue to recommend a defensive approach that is
flat with overweights in operationally resilient sectors such as utilities, staple industrials and
infrastructure that provide a higher yield to index returns. We do not foresee continued strong
compression of spread to swap as experienced in the prior years.

Fund Manager Commentary – February 2015 16
Cash
Market review
The Reserve Bank of Australia eased monetary policy by 25 basis points at its February meeting,
taking the cash rate to 2.25%. This was the first change in policy since August 2013. The Reserve
Bank’s Statement on Monetary Policy was released shortly after the decision to ease monetary policy
and provided insight into the reasons for the decision.
The Statement on Monetary Policy showed forecasts for economic growth and inflation had fallen
since the November statement. The Reserve Bank expects growth for 2015 to be between 2.25% and
3.25% (revised down by 0.25%) and between 3% and 4% in 2016. Based off these forecasts the
Reserve Bank does not see a return to trend growth until the second half of 2016. On inflation, the
Reserve Bank revised their 2015 and 2016 forecasts lower by 0.25% to a midpoint of 2.5%. On the
currency the Reserve Bank continues to see the exchange rate, despite the depreciation, as being
above its fundamental value given the significant falls in key commodity prices and is providing less
assistance in delivering balanced growth in the economy.
Expectations for a further rate cut increased following the release of weak labour market and CAPEX
data. Employment fell by 12,200 jobs in January and the unemployment rate rose from 6.1% to 6.4%
(that said, employment growth had been strong in recent months and labour data has been volatile
and subject to revisions). Wage inflation data confirmed that the labour market remains weak, with
annual wage inflation at 2.5% being the lowest since the series started in 1998.
The CAPEX report included the first reading for 2015-2016 investment expectations. The report was
very weak with not only mining investment falling (no surprise) but also non-mining investment
intentions disappointing (a fall of 3.1% against prior corresponding period).
The Reserve Bank would have taken some comfort from the rebound in consumer confidence.
According to the Westpac/Melbourne Institute survey, consumer confidence rose by 8% in February
to its highest level since January 2014. Confidence was supported by the rate cut from the Reserve
Bank, the 21% fall in average petrol prices and the 9.7% gain in the stock market since the January
survey.
The NAB business survey continued to reflect a subdued business environment. NAB business
conditions were slightly lower and business confidence slightly higher, albeit at low levels. According
to the survey sales deteriorated considerably, profits eased and employment remained soft. The
manufacturing sector deteriorated considerably. Despite the lower oil price, confidence in the
transport/ utilities sector fell.

Fund Manager Commentary – February 2015 17
In offshore events, much focus was on Greece after the anti-austerity Syriza party formed government
following the election in late January. The Eurozone and Athens came to an agreement on an
extension of the bailout package following the draft proposals put forward by the Greek government.
Greece has now been given until the end of April to submit its detailed reform proposals.
In the United States, the FOMC meeting minutes were more dovish than was expected. According to
the minutes “many participants indicated that their assessment of the balance of risks associated with
the timing of the beginning of policy normalization had inclined them toward keeping the federal funds
rate at its effective lower bound for a longer time” and that “a premature increase in rates might
dampen the apparent solid recovery in real activity and labour market conditions”.
The Australian bond curve steepened over the month, with three year bond yields ending 13 basis
points lower at 1.79% and ten year bonds ending 5 basis points higher at 2.45%. Australian bank bills
rallied strongly after the Reserve Bank’s decision to ease monetary policy, with 90 day bank bills
falling 23 basis points to 2.33%. The Australian market outperformed the US, with US bonds selling
off sharply. US ten year bond yields ended 35 basis points higher at 1.99%.
Portfolio performance
Managed Cash
The BT Wholesale Managed Cash Fund returned 0.19% in February (post fee, pre-tax),
underperforming the benchmark by 0.02%. The fund is well positioned to outperform in March given
the higher running yield than index. The fund ended the month with a weighted average maturity of 69
days (maximum limit of 70 days). With the bank bill curve remaining positively sloped, despite further
monetary policy being priced in in the futures market, we will continue to position the fund longer than
index. Credit exposure remains consistent with prior months with excess spread from A-1 rated
issuers likely to be the main driver of outperformance.
Enhanced Cash
The BT Wholesale Enhanced Cash Fund returned 0.22% in February (post fee, pre-tax),
outperforming its benchmark by 0.01%. Positive performance came from financials, mortgage backed
securities and industrial sectors, while curve and the Itraxx position detracted from performance.
With credit spreads narrowing and our technical analysis models triggering a neutral signal, we closed
our short iTraxx position early in the month. Other activity included reducing exposure to offshore
banks whilst increasing exposure to domestic banks, auto ABS and industrial sectors.

Fund Manager Commentary – February 2015 18
As at the end of the month, the portfolio had a credit spread of 65 basis points over bank bills, an
interest rate duration of 0.18 years and credit spread duration of 1.38 years.
Strategy and outlook
The Reserve Bank of Australia left the cash rate unchanged at its March meeting although stated that
further monetary policy easing may be appropriate over the period ahead.
The CAPEX survey highlights the problem facing the Australian economy: mining investment is falling
sharply and the non-mining sector is not picking the slack up as quickly as the Reserve Bank would
like. The housing market, particularly in Sydney, will be causing some concern although the Reserve
Bank also stated that it is working with other regulators to assess and contain risks that may arise
from the housing market.
We expect further monetary policy easing from the Reserve Bank. Should fourth quarter gross
domestic product data released in early March come out weaker than expected then further policy
easings could occur as quickly as the April meeting. We do not rule out the cash rate going sub-2%
by the end of the year.

Fund Manager Commentary – February 2015 19
Australian Property
Market review The S&P/ASX 200 REIT index was up 3.7% in February, however lagged the broader market which
was up 6.9%, mostly driven by resource stocks. This brings to an end eight consecutive months of
outperformance by the REITs. However, in the rolling year REITs have outperformed the broader
market by almost 21%.
February saw a generally positive earnings season for the REITs. On average net operating income
growth was +2.3% and NTA growth was a solid +4.7%, with the average cap rate compressing 28bp.
The stand out sector was residential trusts with both MGR and SGP showing both margin recovery
and solid sales growth. The weakest results came from the office sector reflecting higher vacancy
(IOF) and still above average incentives (DXS).
Aside from the reporting season, the major REIT news for the month was corporate activity with FDC
and NVN announcing a merger agreement with an all scrip offer at an implied price of $2.55 for NVN.
The major shareholder the Gandel Group (holds 21.6%) has agreed to vote in favour of the merger in
the absence of a higher offer. Morgan Stanley also advised that it would sell the balance sheet assets
of Investa Property Group as well as the management rights to IOF and its wholesale fund.
Depending on price, this may provide IOF with an opportunity to internalize. Also during the month
WFD sold a 47.4% interest in 3 of its lower growth US assets for $440M to O’Connor Capital. This is
consistent with the WFD strategy of selling non-core assets and deploying the funds into its flagship
development pipeline.
During the month the Australian 10 year bond rate was virtually flat and ended the month at 2.47%.
However, following solid economic data in their respective economies, US bonds were up 35bp to 2%
and UK bonds were up 47bp to 1.95%. The RBA cut the cash rate by 25bp to 2.25%, the first move
since August 2013, with the Bank expecting a prolonged period of sub-trend growth and the jobless
rate to be a little higher than previously anticipated.
Portfolio performance
The BT Wholesale Property Securities Fund returned 3.44% in February (post-fee, pre-tax),
underperforming its benchmark by 0.25%. The portfolio underperformed over the month with positive
attribution coming from our overweight positions in Lifestyles Communities, Arena REIT and Novion
Property Group as well as out underweight position in Dexus Property Group. Negative attribution
came from our underweight positions in Cromwell and Stockland Group (we are closing this
underweight) and as well as our overweight positions in Australian Agricultural, Federation Centres
and Westfield Corporation.
Fund Manager Commentary – February 2015 20
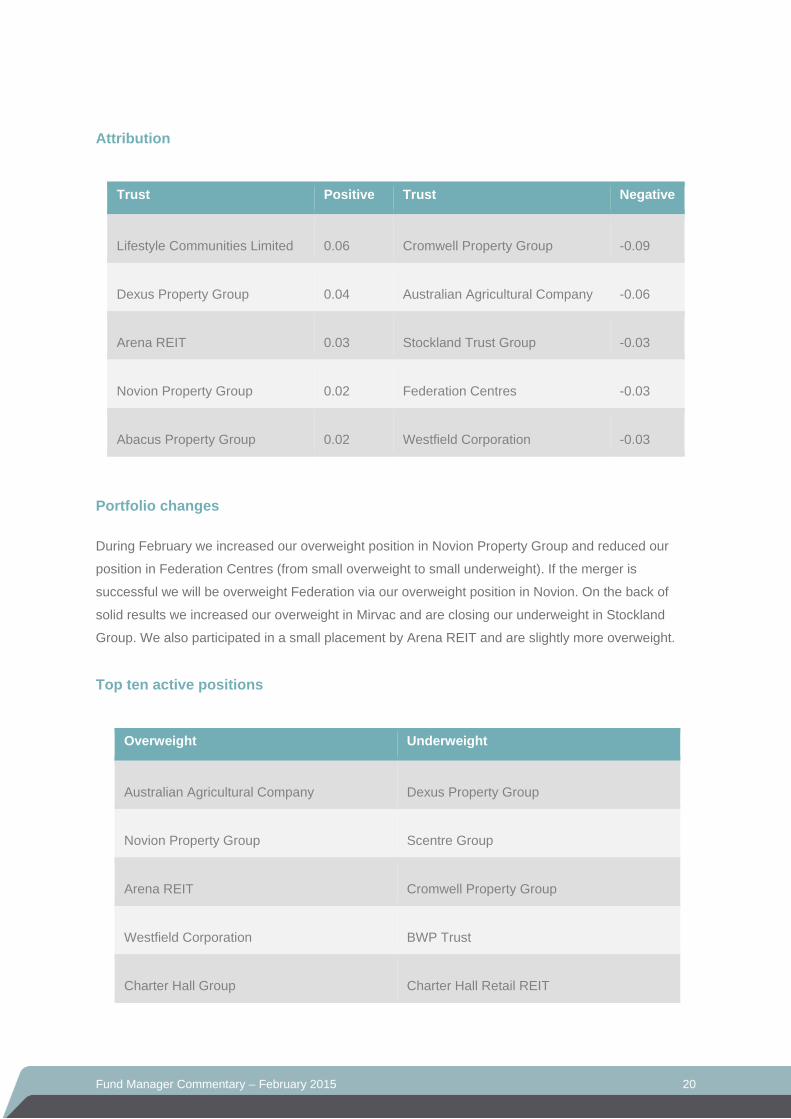
Attribution
Trust Positive Trust Negative
Lifestyle Communities Limited 0.06 Cromwell Property Group -0.09
Dexus Property Group 0.04 Australian Agricultural Company -0.06
Arena REIT 0.03 Stockland Trust Group -0.03
Novion Property Group 0.02 Federation Centres -0.03
Abacus Property Group 0.02 Westfield Corporation -0.03
Portfolio changes
During February we increased our overweight position in Novion Property Group and reduced our
position in Federation Centres (from small overweight to small underweight). If the merger is
successful we will be overweight Federation via our overweight position in Novion. On the back of
solid results we increased our overweight in Mirvac and are closing our underweight in Stockland
Group. We also participated in a small placement by Arena REIT and are slightly more overweight.
Top ten active positions
Overweight Underweight
Australian Agricultural Company Dexus Property Group
Novion Property Group Scentre Group
Arena REIT Cromwell Property Group
Westfield Corporation BWP Trust
Charter Hall Group Charter Hall Retail REIT

Fund Manager Commentary – February 2015 21
Strategy and outlook
The sector is priced on an FY15 dividend yield of 4.8%, FY15 AFFO yield of 5.2% and a PE ratio of
17.5 times. Earnings and balance sheets are stable with sector gearing currently standing at 32%. We
expect supportive funding costs, positive spread investing and cost cutting to drive earnings and the
performance of the sector in the medium term. Given AREITs do not have the lowest cost of capital (a
mantle held by both pension and sovereign funds) we would not expect significant equity capital
issuance for some time.

Fund Manager Commentary – February 2015 22
International Property
Market review
Performance of the global property securities market (on an ex-Australia basis) as measured by the
UBS Global Real Estate Investors Index fell in February, posting a total return of -1.54%. North
America (down -3.55%) posted the largest loss. Asia Pacific was up 0.10% while Europe posted a
gain of 4.21%. In Asia, New Zealand, Singapore and Japan posted gains, while Hong Kong was in
negative territory. In Europe, all countries posted a positive return and were led by Austria, Italy, and
Sweden. Within North America, the U.S. had negative returns and Canada was positive.
Portfolio performance
The BT Wholesale Global Property Securities Fund returned -1.59% in February (post-fee, pre-tax),
underperforming its benchmark by 0.05%.
The top five contributors this month were Hilton Worlwide, Digital Realty, Realty Income Corp,
Alexander & Baldwin, and Faberge. The top five detractors were Dupont Fabros, Taubman Centers,
Immofinanz Immobilien, American Assets, and Swiss Prime Site.
The North America portfolio returned -3.47% in February before fees, outpacing the UBS U.S. &
Canada Investor’s Index by 8 basis points. Modest outperformance relative to the benchmark was
driven by positive sector allocation results, which were partially offset by negative stock selection
results. In terms of sector allocation, positive results were attributable to the portfolio’s underweight to
the underperforming health care and triple net lease sectors, as well as an overweight to the
outperforming office sector. Regarding stock selection, results were weakest in the regional mall,
office, and health care sectors and were strongest in the shopping centre, apartment, and hotel
sectors. Among the portfolio’s holdings, top individual contributors to relative performance included
overweight positions in outperforming Hilton Worldwide Holdings (HLT) and Alexander & Baldwin
(ALEX), and a lack of exposure to underperforming Digital Realty Trust (DLR). Detractors most
notably included overweight positions in underperforming DuPont Fabros Technology (DFT) and
Taubman Centers (TCO), and a lack of exposure to outperforming SL Green Realty (SLG).
The European portfolio returned 4.25% in February before fees, beating the regional UBS benchmark
by 4 basis points. Outperformance relative to the benchmark was driven by positive stock selection
results, while country allocation results were largely neutral. In terms of stock selection, results were
strongest in the United Kingdom, Germany, and Finland and were weakest in the Switzerland,
France, and Netherlands. Among the portfolio’s holdings, top contributors to relative performance
included a lack of exposure to underperforming Intu Properties Plc. (U.K.) and overweight positions in

Fund Manager Commentary – February 2015 23
outperforming Unite Group Plc. (U.K.) and Fabege AB (Sweden). Detractors most notably included a
lack of exposure to outperforming Immofinanz AG (Austria) and Hufvudstaden AB Class A (Sweden),
and an overweight position in underperforming Gecina SA (France).
The Asian portfolio returned -0.08% in February before fees, lagging the regional UBS benchmark by
18 basis points. Underperformance relative to the benchmark was driven by negative stock selection
results in Hong Kong, Japan, and Singapore. Among the portfolio’s holdings, top detractors to
relative performance included a lack of exposure to outperforming Aeon Mall Co. Ltd. (Japan) and
Mori Trust Sogo REIT (Japan), and an underweight position in outperforming Frontier Real Estate
Investment Corp. (Japan). Contributors most notably included overweight positions in outperforming
Kenedix Retail REIT (Japan) and Mitsui Fudosan Co. Ltd. (Japan), and an underweight position in
underperforming Wharf Holdings Ltd. (Hong Kong). Country allocation results were largely neutral.
Strategy and outlook
North America – With US growth firming, the Federal Reserve ended its bond purchase program in
October and tweaked the “considerable time” language in its policy statement that was seen as
guaranteeing that a Fed Funds rate hike was at least 6 months away. Still, low inflation and anaemic
growth in most other major economies have resulted in extremely low sovereign yields in the rest of
the world, and flows have been moving into dollar denominated assets of all kinds. These flows
pushed the 10 year Treasury yield down from 2.51% to 2.17% during the fourth quarter (and even
lower in the first days of 2015), and while we do expect higher bond yields eventually it is not at all
clear when rates will rise. The Fed continues to maintain that it will be “patient” in normalizing
monetary policy.
This low yield environment has been good to the US REIT sector, as it returned 14.2% during the
fourth quarter alone, capping an extremely strong year where the sector delivered total returns just
over 30%. As of the end of December, US REITs are slightly above long term normalized valuations
but nowhere near the extremes seen in the 2011-12 period. REITs continue to look relatively
expensive versus other equities, slightly above normal versus the underlying real estate and
substantially more attractive than usual versus bonds as REIT dividend yields offer a healthy spread
to bond yields. Along with this yield cushion, earnings growth should offset the impact of slow to
moderate increases in interest rates, though we do expect some volatility in the REIT market near
Fed policy decisions. Going forward, we expect gains to be driven more by these improving earnings
fundamentals than by additional multiple expansion.
Real estate fundamentals continue to support earnings growth for the REITs. Apartment vacancy
levels have levelled off at healthy levels, but vacancy rates in other property types continue to trend
downward slowly. Supply risk continues to be limited on a national level, with only the apartment
sector back to long-term construction averages. A few select office and industrial markets are also

Fund Manager Commentary – February 2015 24
seeing some supply growth, but it is generally being built to fill very strong demand in these same
markets. More encouragingly, rents are now moving up in all property types, and some longer-lease
property types are transitioning into an environment where leases will be signed at higher rents than
the in-place ones, providing a boost to net operating income. We expect high single digit earnings
growth across the REIT sector in 2015.
Europe – The current low interest rate environment is positive for a stable yielding asset class like real
estate. The gap between property yields on the one side and bond yields and real estate financing
costs on the other side continues to be high. The overall risk of declining rents is limited as new
supply of assets is low in most markets. A deflationary environment would be a negative for property
equities in Continental Europe, however, as the leases are linked to inflation. Overall, European
REITs are trading at a 9% premium to net asset values. European REITs offer an attractive, relatively
low risk, and growing earnings yield of 4.8%, and the dividend yield is 3.5% as not all earnings are
paid out as dividends.
Asia – With the strong outperformance by JREITs this year, valuations in Japan are the most
expensive within our investment universe. However, we do expect valuations to remain elevated due
to the Bank of Japan’s purchase program, which acts somewhat as a “back-stop” to share price
performance. The average dividend yield for JREITs is over 250 basis points higher than the
Japanese government bond yield, and this remains an attractive asset class to pure yield investors.
Valuations in the rest of the region are at a small discount to fair value. Property fundamentals remain
positive with strong demand for assets across the region, particularly in Japan and Australia where
cap rates are still trading at an attractive spread over bond yields. This continues to drive cap rate
compression in these countries. Rents are improving as vacancies are showing improvement across
the region, supporting growth in asset values. We expect currency risk to be a likely headwind to U.S.
dollar returns for the region with Asian currencies expected to remain weak.

Fund Manager Commentary – February 2015 25
Active Balanced
Market review
February was a very strong month for equities with the Australian market the S&P/ASX300
Accumulation Index returning +6.9% - its strongest monthly performance since Oct 2011. Resources
(+11.3%) outperformed the market ex-resources (+6.1%) for the first time in six months, led by Metals
& Mining (+12.2%).
Despite a subdued reporting season, the rate cut early in the month buoyed the market to new highs
with yield stocks in particular remaining very attractive.
Global equities also followed a similar path as the MSCI World ex Australia returned 5.27%, driven by
strong performance of European and Japanese markets. The European market was buoyed by the
substantial quantitative easing package announced by the ECB and the promise of support for
markets. This saw many markets outperform strongly including Germany (+6.6%), France (+7.5%),
Italy (+8.9%), Spain (+7.5%). The key to a sustained rally in these markets will be signs of a
sustainable economic recovery and increasing inflation.
The US market continued its strong run in returning a positive 5.5%. However, we did see some profit
taking into month end as concerns started to build about the potential impact of rate rises that seem to
be getting closer and closer to being implemented.
In Asia, Japan did well as with the Nikkei index returning 6.4% driven by signs of an economic
recovery and some of the stimulatory packages starting to take effect. China was solid returning 3.1%
as further stimulus cuts from the PBOC helped drive investor sentiment.
Fixed interest markets were slightly positive in Australia but negative globally as the US bond market
started to price in rising interest rates which saw bond yields increase slightly during the month.
Notwithstanding the RBA rate cut and accompanying comments from Glenn Stevens, the AUD rose
against the USD (+0.6%). More broadly the AUD trade weighted index rose marginally against its
largest trading partners (+0.3%).
Portfolio performance
The BT Wholesale Active Balanced Fund returned 3.13% (post fee, pre-tax) in February,
underperforming its benchmark by 0.44%.

Fund Manager Commentary – February 2015 26
Returns for February were driven by very positive equity markets both domestically and globally and
Australian listed property market driven by the cut in interest rates in Australia and central bank action
in Europe.
For the month the largest contribution was from our Australian equities exposure which delivered a
strong 7.01% which slightly outperformed the index, as some of our key exposures delivered strong
results during earnings season including Qantas, Telstra and Resmed.
Our global equities exposure also added 4.30% although it did underperform the index slightly as our
stock selection in the US underperformed. Our overweight European exposure and emerging markets
exposure did outperform and add value.
From a tactical perspective our overweight global and domestic equities unfortunately did not
compensate from overweight bond and oil and copper positions which detracted, leaving a small
negative contribution for the month from our tactical asset allocation strategy.
.
Strategy and outlook
The focus on the markets now post-reporting season will be on what’s happening offshore - primarily
China and the US - to see if there are any signs of concern for Australian companies and the
economy. Domestically there will also be a strong focus on the RBA.
The Reserve Bank of Australia left the cash rate unchanged at its March meeting although it stated
that further monetary policy easing may be appropriate over the period ahead. The CAPEX survey
highlights the problem facing the Australian economy: mining investment is falling sharply and the
non-mining sector is not picking the slack up as quickly as the Reserve Bank would like. The housing
market, particularly in Sydney, will be causing some concern although the Reserve Bank also stated
that it is working with other regulators to assess and contain risks that may arise from the housing
market.
We expect further monetary policy easing from the Reserve Bank. Should fourth quarter gross
domestic product data released in early March come out weaker than expected further policy easing
could occur as quickly as the April meeting. We do not rule out the cash rate going sub-2% by the end
of the year.
Near term, risk markets will continue to battle headwinds from commodity price weakness, uncertainty
over Greece and shifting expectations on US Fed raising rates. Volatility will be a constant feature
during 2015 and we continue to ensure our portfolio remains well balanced.

Fund Manager Commentary – February 2015 27
Performance as at 28 February 2015
FYTD 1 year 2 Years 3 Years 5 Years Since(pa) (pa) (pa) (pa) Incp. (pa)
Australian Shares - All CapBT Wholesale Core Australian Share Fund APIR - RFA0818AUTotal Return (post-fee, pre-tax) 6.94 12.33 8.94 14.34 16.01 14.21 16.35 9.78 10.63Total Return (pre-fee, pre-tax) 7.00 12.55 9.37 14.94 16.93 15.12 17.28 10.66 11.66Benchmark 6.92 12.62 7.52 12.98 14.19 12.17 15.79 9.55 10.63
BT Wholesale Imputation Fund APIR - RFA0103AUTotal Return (post-fee, pre-tax) 6.50 12.08 8.67 13.98 15.49 12.55 15.10 8.90 10.70Total Return (pre-fee, pre-tax) 6.57 12.33 9.16 14.67 16.53 13.57 16.14 9.89 11.73Benchmark 6.92 12.62 7.52 12.98 14.19 12.17 15.79 9.55 9.44
BT Wholesale Focus Australian Share Fund APIR - RFA0059AUTotal Return (post-fee, pre-tax) 7.41 13.05 10.63 15.91 18.62 16.67 17.39 10.18 9.97Total Return (pre-fee, pre-tax) 7.48 13.27 11.05 16.49 19.52 17.55 18.28 11.04 11.06Benchmark 6.92 12.62 7.52 12.98 14.19 12.17 15.79 9.55 8.24
BT Wholesale Ethical Share Fund APIR - RFA0025AUTotal Return (post-fee, pre-tax) 6.77 13.19 10.45 15.81 17.53 14.26 16.04 9.22 9.27Total Return (pre-fee, pre-tax) 6.85 13.46 10.97 16.54 18.65 15.35 17.14 10.26 10.35Benchmark 6.92 12.62 7.52 12.98 14.19 12.17 15.79 9.55 8.74
Australian Shares - Mid CapBT Wholesale MidCap Fund APIR - BTA0313AUTotal Return (post-fee, pre-tax) 6.20 13.10 12.21 16.91 18.38 16.23 16.39 12.04 9.79Total Return (pre-fee, pre-tax) 6.19 13.38 12.97 17.87 19.88 18.44 18.68 14.11 12.43Benchmark 6.78 13.68 9.45 16.11 17.04 11.64 11.53 8.01 3.30
Australian Shares - Small CapBT Wholesale Smaller Companies Fund APIR - RFA0819AUTotal Return (post-fee, pre-tax) 7.97 8.44 1.44 7.63 6.47 7.70 10.70 11.26 13.53Total Return (pre-fee, pre-tax) 8.07 8.78 2.07 8.52 7.79 9.04 12.09 12.58 14.81Benchmark 8.43 9.93 -0.59 6.73 3.11 -0.31 -1.01 1.42 7.50
Australian Shares - Micro CapBT Wholesale MicroCap Opportunities Fund APIR - RFA0061AUTotal Return (post-fee, pre-tax) 11.23 13.54 10.22 20.20 18.19 19.58 18.28 19.60 19.25Total Return (pre-fee, pre-tax) 12.00 14.98 13.56 24.58 23.34 26.56 24.99 25.99 25.26Benchmark 8.43 9.93 -0.59 6.73 3.11 -0.31 -1.01 1.42 0.86
International SharesBT Wholesale Core Global Share Fund APIR - RFA0821AUTotal Return (post-fee, pre-tax) 4.51 11.99 22.81 24.79 23.11 32.29 27.26 15.65 5.61Total Return (pre-fee, pre-tax) 4.59 12.27 23.41 25.61 24.29 33.56 28.48 16.73 6.79Benchmark 5.27 11.48 22.52 24.21 23.59 31.72 26.43 14.91 7.15PropertyBT Wholesale Property Securities Fund APIR - BTA0061AUTotal Return (post-fee, pre-tax) 3.44 16.01 17.80 25.73 34.85 17.61 22.48 14.80 7.66Total Return (pre-fee, pre-tax) 3.49 16.18 18.18 26.30 35.75 18.38 23.26 15.52 8.50Benchmark 3.69 16.41 17.63 25.53 34.91 18.39 23.13 14.86 7.46
BT Wholesale Global Property Securities Fund APIR - RFA0051AUTotal Return (post-fee, pre-tax) -1.59 7.08 12.97 16.76 25.08 16.49 18.71 17.99 10.95Total Return (pre-fee, pre-tax) -1.52 7.33 13.51 17.50 26.25 17.58 19.82 19.10 11.96Benchmark -1.54 7.60 13.67 17.51 26.90 16.96 19.25 18.64 10.58Fixed InterestBT Wholesale Fixed Interest Fund APIR - RFA0813AUTotal Return (post-fee, pre-tax) -0.07 3.91 6.93 8.32 11.93 6.93 7.38 7.44 7.08Total Return (pre-fee, pre-tax) -0.03 4.04 7.19 8.68 12.49 7.47 7.91 7.94 7.65Benchmark 0.28 3.61 5.58 6.96 10.31 6.63 7.14 7.34 7.20
BT Wholesale Global Fixed Interest Fund APIR - RFA0032AUTotal Return (post-fee, pre-tax) -1.49 2.67 6.45 8.61 11.28 6.87 6.98 7.48 7.03Total Return (pre-fee, pre-tax) -1.45 2.80 6.73 8.99 11.87 7.44 7.53 8.02 7.63Benchmark -0.80 2.84 5.23 7.53 10.46 7.19 7.13 8.11 7.88
BT Wholesale Enhanced Credit Fund APIR - RFA0100AUTotal Return (post-fee, pre-tax) 0.48 3.11 4.52 5.73 8.72 6.59 7.59 7.56 6.26Total Return (pre-fee, pre-tax) 0.51 3.23 4.76 6.05 9.21 7.07 8.07 8.04 6.80Benchmark 0.53 3.23 4.66 5.88 8.71 6.55 7.45 7.42 6.39Cash & IncomeBT Wholesale Enhanced Cash Fund APIR - WFS0377AUTotal Return (post-fee, pre-tax) 0.22 0.75 1.51 2.06 3.34 3.34 4.21 4.99 5.28Total Return (pre-fee, pre-tax) 0.24 0.82 1.64 2.23 3.59 3.60 4.47 5.25 5.64Benchmark 0.21 0.69 1.36 1.83 2.73 2.76 3.08 3.79 5.32
BT Wholesale Managed Cash Fund APIR - WFS0245AUTotal Return (post-fee, pre-tax) 0.19 0.64 1.28 1.72 2.59 2.69 3.02 3.73 6.95Total Return (pre-fee, pre-tax) 0.21 0.69 1.39 1.87 2.82 2.91 3.25 3.95 7.26Benchmark 0.21 0.69 1.36 1.83 2.73 2.76 3.08 3.79 7.04
BT Wholesale Monthly Income Plus Fund APIR - BTA0318AUTotal Return (post-fee, pre-tax) 0.84 3.63 4.58 6.44 8.26 6.78 7.08 6.26 6.70Total Return (pre-fee, pre-tax) 0.89 3.80 4.92 6.90 8.97 7.49 7.78 6.90 7.36Benchmark 0.17 0.60 1.23 1.66 2.51 2.60 2.92 3.62 3.59
DiversifiedBT Wholesale Active Balanced Fund APIR - RFA0815AUTotal Return (post-fee, pre-tax) 3.13 9.19 11.68 14.91 16.92 14.52 14.43 9.70 8.04Total Return (pre-fee, pre-tax) 3.20 9.45 12.21 15.64 18.04 15.61 15.52 10.74 9.13Benchmark 3.57 8.17 8.85 12.09 14.23 12.63 13.51 9.50 7.76
(%)1 Month 3 Months 6 Months
For more information Please call 1800 813 886, contact your Business Development Representative or visit btim.com.au
All returns calculated by BT Investment Management (Fund Services) Limited, ABN 13 161 249 332, AFSL 431426 (BTIM). No part
of this Fund Manager Commentary (Commentary) is to be circulated without this page attached.
This Commentary is dated 13 March 2015 and has been prepared by BTIM. The information in this Commentary is for general
information only and should not be considered as a comprehensive statement on any of the matters described and should not be
relied upon as such. The information contained in this Commentary may contain material provided directly by third parties and is
believed to be accurate at its issue date. While such material is published with necessary permission, neither BTIM nor any
company in the Westpac Group of companies accepts any responsibility for the accuracy or completeness of this information or
otherwise endorses or accepts any responsibility for this information. Except where contrary to law, BTIM intends by this notice to
exclude liability for this material.
This Commentary has been prepared without taking into account your objectives, financial situation or needs. Furthermore, it is not
intended to be relied upon for the purpose of making investment decisions and is not a replacement of the requirement for individual
research or professional tax advice. Because of this, before acting on this information, you should seek independent financial and
taxation advice to determine its appropriateness having regard to your individual objectives, financial situation and needs.
BTIM does not give any warranty as to the accuracy, reliability or completeness of the information contained in this Commentary.
This Commentary is not to be published without the prior written consent of BTIM. An investment in the portfolios referred to in this
Commentary is not an investment in, deposit with or any other liability of the Westpac Banking Corporation (ABN 33 007 457 141)
(the Bank) or any other company in the Westpac Group of companies. BTIM is a member of the Westpac Group. An investment in
the funds is subject to investment risk, including possible delays in repayment of withdrawal proceeds and loss of income and
principal invested. Neither the Bank, BTIM nor any other company in the Westpac Group stands behind or otherwise guarantees
the capital value or investment performance of the funds or any particular rate of return.
Performance data (post-fee) assumes reinvestment of distributions and is calculated using exit prices, net of management costs.
Performance data (pre-fee) is calculated by adding back management costs to the (post-fee) performance. Past performance is not
a reliable indicator of future performance. The term ‘benchmark’ refers to the index or measurements used by an investment
manager to assess the relative risk and the performance of an investment portfolio.
BTIM is the issuer of the following products:
BT Wholesale Core Australian Share Fund
BT Wholesale Imputation Fund
BT Wholesale Focus Australian Share Fund
BT Wholesale Ethical Share Fund
BT Wholesale Smaller Companies Fund
BT Wholesale MidCap Fund
BT Wholesale Core Global Share Fund#
BT Wholesale Global Fixed Interest Fund
BT Wholesale Enhanced Credit Fund
BT Wholesale Fixed Interest Fund
BT Wholesale Property Investment Fund
BT Wholesale Global Property Securities Fund
BT Wholesale Managed Cash Fund
BT Wholesale Enhanced Cash Fund
BT Wholesale Active Balanced Fund
A product disclosure statement (PDS) is available for each of the above products and can be
obtained by contacting BTIM on 1800 813 886, by visiting btim.com.au. You should consider
the relevant PDS in deciding whether to acquire, or to continue to hold, the product. BT® is a
registered trade mark of BT Financial Group Pty Ltd and is used under licence.
# AQR began managing international equity for BT Financial Group in June 2006.