functionalized reduced graphene oxide via click...
TRANSCRIPT
FUNCTIONALIZED REDUCED GRAPHENE OXIDE VIA CLICK CHEMISTRY AS ANTIWEAR ADDITIVES FOR
LUBE OIL
NADIA BINTI JAMAL
INSTITUTE OF GRADUATE STUDIES
UNIVERSITY OF MALAYA KUALA LUMPUR
2017

FUNCTIONALIZED REDUCE GRAPHENE OXIDE
VIA CLICK CHEMISTRY AS ANTIWARE ADDITIVES
FOR LUBE OIL
NADIA BINTI JAMAL
DISSERTATION SUBMITTED IN FULFILMENT OF
THE REQUIREMENTS FOR THE DEGREE OF
MASTERS OF PHILOSOPHY
INSTITUTE OF GRADUATE STUDIES
UNIVERSITY OF MALAYA
KUALA LUMPUR
2017

ii
UNIVERSITY OF MALAYA
ORIGINAL LITERARY WORK DECLARATION
Name of Candidate: Nadia Binti Jamal (I.C/Passport No:910828086442)
Matric No: HGA 140020
Name of Degree: Masters of Philosophy
Title of Dissertation (“this Work”): Functionalized Reduced Graphene Oxide via Click
Chemistry as Antiwear Additives for Lube Oil
Field of Study: Chemistry (Nanotechnology)
I do solemnly and sincerely declare that:
(1) I am the sole author/writer of this Work;
(2) This Work is original;
(3) Any use of any work in which copyright exists was done by way of fair dealing
and for permitted purposes and any excerpt or extract from, or reference to or
reproduction of any copyright work has been disclosed expressly and
sufficiently and the title of the Work and its authorship have been
acknowledged in this Work;
(4) I do not have any actual knowledge nor do I ought reasonably to know that the
making of this work constitutes an infringement of any copyright work;
(5) I hereby assign all and every rights in the copyright to this Work to the
University of Malaya (“UM”), who henceforth shall be owner of the copyright
in this Work and that any reproduction or use in any form or by any means
whatsoever is prohibited without the written consent of UM having been first
had and obtained;
(6) I am fully aware that if in the course of making this Work I have infringed any
copyright whether intentionally or otherwise, I may be subject to legal action
or any other action as may be determined by UM.
Candidate’s Signature Date:
Subscribed and solemnly declared before,
Witness’s Signature Date:
Name: Dr. Samira Bagheri
Designation: Senior Lecturer

iii
FUNCTIONALIZED REDUCED GRAPHENE OXIDE VIA CLICK
CHEMISTRY AS ANTIWEAR ADDITIVES FOR LUBE OIL
ABSTRACT
Outstanding properties of reduced graphene oxide (rGO) makes it suitable for
application in many areas of developmental interests, especially functionalized lubricant
additive. The procedure involved synthesizing graphene oxide (GO) via a modified
Hummer’s method, then functionalizing it with alkyne and azide compounds via click
chemistry methodology over a copper sulphate catalyst. The physicochemical properties
of the functional potential lubricant additives were evaluated using Fourier Transform
Infrared Spectroscopy (FTIR), Raman Spectroscopy, X-ray Photoelectron Spectroscopy
(XPS), X-ray Diffractometry (XRD), Thermal Gravimetric Analyser (TGA), and Field
Emission Scanning Electron Microscopy (FESEM). The performance of the lubricant
additive, density, viscosity, total acid number (TAN) and four-ball tests were used to
determine the performance of the lubricant, while the Scanning Electron Microscope
(SEM) were used to generate the image the worn surfaces post-friction test. This indicates
the dispersibility and tribological properties of the F-rGO in base oil. Interestingly, the
organic moiety in the functionalized rGO was shown to improve its flexibility and
stability, while the rGO itself provides hardness. However, the dispersed F-rGO improved
the tribological properties of the resulting lubricant, which reduces both the friction
coefficient and wear by 36 % and 24 %, respectively. These values suggested that the
improved friction and antiwear properties are due to the functionalized rGO and the thin
laminated structure, which is duly confirmed by the XRD and FESEM, respectively.
These features also induce low shear stress and prevent direct contact between the metal
surfaces according to the friction and wear test.
Keywords: graphene oxide; click chemistry; antiwear additive; solid additive.

iv
GRAFENA OKSIDA TERKURANG YANG DIUBAHSUAI MELALUI KLIK
KIMIA SEBAGAI BAHAN TAMBAH ANTIHAUS UNTUK MINYAK
PELINCIR
ABSTRAK
Grafena oksida terkurang (rGO) memiliki ciri-ciri yang sangat sesuai untuk proses
penambahbaikan terutamanya sebagai bahan tambahan bagi minyak pelincir. Grafena
oksida (GO) dalam kajian ini disediakan menerusi proses Hummer yang telah diubahsuai,
kemudian bahan tersebut diubahsuai lagi dengan penambahan kumpulan alkina dan azida
menerusi kaedah kimia klik dengan menggunakan tembaga sulfat sebagai pemangkin.
Ciri-ciri fizikal dan kimia bahan tambah ini dianalisa menggunakan Spektroskopi
Inframerah Transformasi Fourier (FTIR), Spektroskopi Raman, X-ray Fotoelaktron
Spektroskopi (XPS), Pembelau X-ray (XRD), Thermal Gravimetric Analyser (TGA), dan
Mikroskop Bidang Pelepasan Elektron (FESEM). Seterusnya prestasi bahan tambah ini
dianalisa daripada aspek ketumpatan, kelikatan dan jumlah nombor asid. Ujian empat
bola telah digunakan bagi menentukan prestasi bahan pelincir tersebut, manakala
Mikroskop Pengibas Elektron (SEM) digunakan untuk pengimejan permukaan selepas
analisa. Hal ini menjadi penanda aras bagi tahap penyebaran dan ciri-ciri tribologi bagi
bahan tambahan tersebut. Penambahan kumpulan organik pada grafena oksida membawa
penambahbaikan kepada fleksibiliti dan kestabilan pada bahan tersebut yang secara
natural memberi keutuhan. Penambahan bahan ini membawa kepada pengurangan kepada
pekali geseran sebanyak 36 % dan pengurangan tahap kehausan sebanyak 24 %.
Pengurangan ini menjadi bukti bahawa bahan tambahan ini telah meningkatkan
keupayaan bahan ini sebagai bahan antihaus. Bahan berstruktur berlamina seperti yang
ditunjukkan dalam FESEM turut memberi pengurangan kepada tegasan ricih dan
menghalang hubungan terus antara dua permukaan.
Kata kunci: Grafena oksida; klik kimia; bahan tambah antihaus; bahan tambah pepejal

v
ACKNOWLEDGEMENTS
Alhamdulillah, praises to Allah SWT for giving me the strength to endure all the
challenges and complete this study within the time given. First and foremost, I would like
to express my outmost gratitude to my super kind-hearted supervisors, Dr Samira Bagheri
and the late Prof Sharifah Bee Abd Hamid for the useful comments, remarks, engagement,
patience, persistence encouragement and invaluable assistance through the learning
process of this study from the beginning till the end of this study. Thank you so much for
your time and hard work to guide me through this project and I am really glad and proud
to be under your supervision.
Special thanks also goes to the Ministry of Education Malaysia and University of
Malaya for financial support through MyMaster15 as well as Catalysis Research Centre
(NANOCAT), University of Malaya for laboratories and equipment facilities. A warmest
thankful also intended to all science officers who got involved in this project whether
directly or indirectly.
Love and thanks to my parents, brother and sisters for their love and constant supports.
I thank them for simply being there and loving me with all their hearts. Not forgetting,
my fellow course mates for their brilliant ideas, helping me putting pieces together as
well as their guidance and moral support. Thank you for the bond of friendship and for
making me stay in University of Malaya a bearable one with many unforgettable
memories and experiences.
May Allah bless all of you. Thank you so much.
vi
TABLE OF CONTENTS
Abstract ....................................................................................................................... iii
Abstrak ........................................................................................................................ iv
Acknowledgements ....................................................................................................... v
Table of Contents ......................................................................................................... vi
List of Figures ............................................................................................................... x
List of Tables .............................................................................................................. xii
List of Symbols and Abbreviations ............................................................................ xiii
List of Appendices ...................................................................................................... xv
CHAPTER 1: INTRODUCTION............................................................................... 1
1.1 Research background ........................................................................................... 1
1.2 Statement of the problem ..................................................................................... 3
1.3 Justification for the study ..................................................................................... 3
1.4 Aim and objective of the research ........................................................................ 4
1.5 Scope of the research ........................................................................................... 4
1.6 Outline of the dissertation .................................................................................... 4
CHAPTER 2: LITERATURE REVIEW ................................................................... 6
Introduction to Tribology ..................................................................................... 6
Friction ................................................................................................... 6
Mechanism of Wear ................................................................................ 7
2.1.2.1 Abrasive wear........................................................................... 7
2.1.2.2 Adhesive wear .......................................................................... 8
2.1.2.3 Corrosive wear ......................................................................... 9
2.1.2.4 Fatigue wear ............................................................................. 9

vii
Lubrication ........................................................................................... 10
Lubricants .......................................................................................................... 12
Base oil ................................................................................................. 12
2.2.1.1 Mineral Oil ............................................................................. 12
2.2.1.2 Synthetic Oil .......................................................................... 13
Lubricant Additive ................................................................................ 14
A journey from GO to graphene ......................................................................... 16
Properties of graphene........................................................................... 19
Functionalized rGO ............................................................................... 19
Functionalized rGO as an additive ......................................................... 20
An introduction to Click Chemistry ................................................................... 21
Mechanism of Copper-Catalyzed Azide-Alkene Cycloaddition ............. 22
CuAAC reaction with GO ..................................................................... 24
CHAPTER 3: RESEARCH METHODOLOGY ..................................................... 26
Materials ............................................................................................................ 27
Sample preparation ............................................................................................ 28
Synthesis of graphene oxide .................................................................. 28
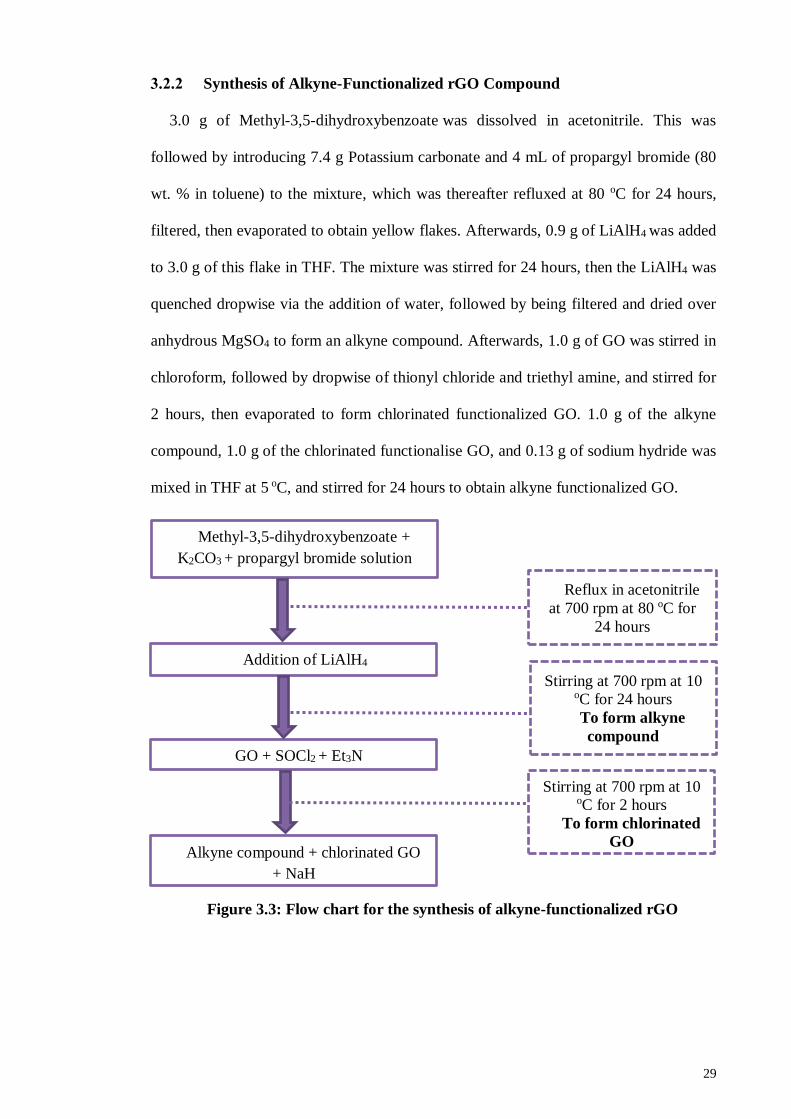
Synthesis of Alkyne-Functionalized rGO Compound ............................ 29
Synthesis of Azide Compound .............................................................. 30
Synthesis of Functionalized GO via Click Chemistry ............................ 30
Characterisation techniques................................................................................ 31
Fourier Transform Infrared (FTIR) Spectroscopy .................................. 32
Raman Spectroscopy ............................................................................. 33
X-ray Photoelectron Spectroscopy (XPS) .............................................. 34
X-Ray Diffraction (XRD) Analysis ....................................................... 35
Thermogravimetric Analysis (TGA) ...................................................... 36

viii
Field Emission Scanning Electron Microscopy (FESEM) ...................... 37
Physicochemical measurement of additives ........................................................ 38
Density Analysis ................................................................................... 39
Viscosity Analysis ................................................................................ 40
Total acid number (TAN) Analysis ....................................................... 41
Tribological analysis .......................................................................................... 42
Friction and wear test ............................................................................ 42
CHAPTER 4: RESULTS AND DISCUSSIONS ...................................................... 44
Sample characterization ..................................................................................... 44
Vibrational harmonic modes of F-rGO additive ..................................... 44
XRD analysis of F-rGO antiwear additive ............................................. 49
Thermal stability analysis of F-rGO ...................................................... 50
Morphology of F-rGO antiwear additive ............................................... 53
Mechanism of lubrication by Functionalized-rGO-Cn ............................ 55
Performance of different additive in lube oil ...................................................... 56
Physicochemical properties ................................................................... 56
4.2.1.1 Density Analysis .................................................................... 56
4.2.1.2 Viscosity Analysis .................................................................. 57
4.2.1.3 Total acid number Analysis .................................................... 58
Tribological study ................................................................................. 59
4.2.2.1 Friction coefficient ................................................................. 59
4.2.2.2 Wear Scar Analysis ................................................................ 60
Performance of optimised additive with different concentration in lube oil ........ 65
Physicochemical properties ................................................................... 65
4.3.1.1 Density Analysis .................................................................... 65
4.3.1.2 Viscosity Analysis .................................................................. 66

ix
4.3.1.3 Total acid number Analysis .................................................... 67
Tribological study ................................................................................. 69
4.3.2.1 Friction coefficient ................................................................. 69
4.3.2.2 Wear Scar Analysis ................................................................ 70
CHAPTER 5: CONCLUSION AND RECOMMENDATION ................................ 72
5.1 Conclusion ......................................................................................................... 72
5.2 Recommendations for future work ..................................................................... 74
References .................................................................................................................. 75
List of Publications and Papers Presented ................................................................... 84
Appendix .................................................................................................................... 85

x
LIST OF FIGURES
Figure 2.1: Schematic view of abrasive wear (Khruschov, 1974)................................... 7
Figure 2.2: Schematic of Adhesive wear (Rabinowicz, 1965) ........................................ 8
Figure 2.3: Schematic of Fatigue wear (Rabinowicz, 1965) ........................................... 9
Figure 2.4: Stribeck curve, dependence of the friction coefficient on viscosity, speed and
load for a lubricated sliding system (Sakamoto et al., 1985) ........................................ 11
Figure 2.5: Additive structure scheme ......................................................................... 15
Figure 2.6: (a) One atom thick graphene in honeycomb lattice (b) The d-spacing of
graphene (Novoselov & Geim, 2007) .......................................................................... 18
Figure 2.7: The sp2 hybridize orbitals between carbon atoms and the π bonds (Novoselov
& Geim, 2007) ............................................................................................................ 19
Figure 2.8: The Huisgen’s and CuAAC reaction (Liang & Astruc, 2011) .................... 21
Figure 2.9: Proposed catalytic cycle for the CuAAC reaction based on DFT calculations
(Hein & Fokin, 2010) .................................................................................................. 23
Figure 2.10: Alkyne-bridged bimetallic species (Hein & Fokin, 2010) ........................ 24
Figure 2.2.11: Research gap between literature studies and current research ................ 25
Figure 3.1: Research methodology design ................................................................... 26
Figure 3.2: Flow chart for the synthesis of GO ............................................................ 28
Figure 3.3: Flow chart for the synthesis of alkyne-functionalised rGO ........................ 29
Figure 3.4: Flowchart for the synthesis of azide compound ......................................... 30
Figure 3.5: Flowchart for the synthesis of F-rGO ........................................................ 30
Figure 3.6: General procedure for F-rGO .................................................................... 31
Figure 3.7: Perkin Elmer Instrument FTIR for chemical bonding studies (Elmer) ........ 32
Figure 3.8: Renishaw inVia Raman Microscope for structural characterisation (Renishaw,
2017) .......................................................................................................................... 33
Figure 3.9: ULVAC-PHI Quantera II for surface analysis (ULVAC-PHI, 2017) ......... 34

xi
Figure 3.10: Bruker D8 Advance diffractometer for crystal structure and composition
studies (Bruker, 2016) ................................................................................................. 36
Figure 3.11: Mettler Toledo, TGA/SDTA-851e thermal analyser to study the rate of
change in weight over temperature or time (Toledo, 2016) .......................................... 37
Figure 3.12: Quanta FEG 450 FESEM for morphology and structural study (Scientific,
2016) .......................................................................................................................... 38
Figure 3.13: Oil blending process ................................................................................ 39
Figure 3.14: SVM™ 3000 Stabinger Viscometer (Paar, 2017) ................................... 40
Figure 3.15: Metrohm potentiometric titration (Metrohm, 2017) ................................. 41
Figure 3.16: Coefficient of friction and ball wear mechanism...................................... 42
Figure 3.17: Four-ball tester (Instruments, 2017)......................................................... 43
Figure 4.1: FTIR spectra of the synthesized additives .................................................. 45
Figure 4.2: Raman spectra of GO and functionalized rGO ........................................... 46
Figure 4.3: XPS spectra of (a) GO and F-rGO in wide region; (b) C1s region of F-rGO; (c)
N1s region of F-rGO .................................................................................................... 47
Figure 4.4: XRD spectra of the synthesized GO and F-rGO samples ........................... 50
Figure 4.5: TGA and DTG traces of GO and its derivatives ......................................... 51
Figure 4.6: FESEM images of (a) GO; (b) F-rGO-C6; (c) F-rGO-C8; (d) F-rGO-C10; (e)
F-rGO-C12 ................................................................................................................. 53
Figure 4.7: Mechanism of antiwear additive in base oil ............................................... 55
Figure 4.8: Coefficient of friction of base oil and its functionalised additives .............. 60
Figure 4.9: Specific wear rate of base oil and its formulated lubricant oil .................... 61
Figure 4.10: Wear scar diameter of base oil without and with additives ....................... 63
Figure 4.11: VI of base oil and F-rGO-C10 additives with different concentration ...... 67
Figure 4.12: Comparison of CoF with different concentration of F-rGO-C10 .............. 69
Figure 4.13: Specific wear rate of lubricant oil with different additive concentration ... 71

xii
LIST OF TABLES
Table 2.1: Review on functionalization of GO via Click Chemistry ............................ 24
Table 3.1: List of chemicals used in this study ............................................................ 27
Table 3.2: Additives with different alkyl-chain........................................................... 38
Table 3.3: Formulation of lubricant oil with additive in varying concentration ............ 39
Table 4.1: FTIR band assignment for the synthesised additives ................................... 45
Table 4.2: Atomic concentration of F-rGO .................................................................. 48
Table 4.3: Summary of extract from XRD analysis ..................................................... 50
Table 4.4: Density of base oil and its F-rGO derivatives .............................................. 56
Table 4.5: Viscosity and viscosity index of base oil and F-rGO additives .................... 57
Table 4.6: Value of total acid number of base oil and F-rGO additives ........................ 58
Table 4.7: Specific wear rate of base oil and its formulated lubricant oil ..................... 61
Table 4.8: SEM images of wear scar diameter (WSD) ................................................. 64
Table 4.9: Density analysis of formulated lubricant oil ................................................ 66
Table 4.10: Viscosity of formulated lubricant oil ......................................................... 66
Table 4.11: TAN of base oil without additive and with different concentration of additives
................................................................................................................................... 68
Table 4.12: Specific wear rate of F-rGO-C10 with different concentration .................. 70
Table 5.1: Comparison of recent solid additives with present research on their tribological
properties .................................................................................................................... 72

xiii
LIST OF SYMBOLS AND ABBREVIATIONS
ASTM : American Society for Testing and Materials
C : Carbon
C10 : Ten carbon length
C12 : Twelve carbon length
C6 : Six carbon length
C8 : Eight carbon length
CNTs : Carbon nanotubes
CoF : Coefficient of friction
CSt : Centistokes
CuAAC : Copper-Catalyzed Azide-Alkyne Cycloaddition
DFT : Density Functional Theory
DMF : Dimethyl formamide
EDX : Electron Dispersive X-ray
EP : Extreme pressure
F-rGO : Functionalized reduced graphene oxide
FTIR : Fourier Transform Infrared Spectroscopy
GO : Graphene oxide
H : Hydrogen
h-BN : Hexagonal boron nitride
HFRR : High Frequency Reciprocating Rig
KBR : Potassium bromide
MoS2 : Molybdenum disulphite
MWCNTs : Multi-walled carbon nanotubes
N : Nitrogen

xiv
O : Oxygen
PAO : Polyalphaolefins
rGO : Reduced graphene oxide
SEM : Scanning Electron Microscope
TAN : Total acid number
TCP : Tricresyl phosphate
TGA : Thermogravimetric Analyser
THF : Tetrahydrofuran
WSD : Wear scar diameter
wt. % : Weight fraction
XPS : X-ray Photoelectron Spectroscopy
XRD : X-ray Diffractometer
ZDDP : Zinc dithiophosphate

xv
LIST OF APPENDICES
Table A-1: CoF value of 0.010 wt. % additives added in base oil………………… 85
Table A-2: CoF value for F-rGO-C10 added in base oil with concentration varies
from 0.005 wt. % - 0.050 wt. %............................................................
85
1
CHAPTER 1: INTRODUCTION
1.1 Research background
Mitigating the detrimental effect of frictional force upon two surfaces in motion with
respect to one another with the aid of additives helps increase the lifespan of working
tools and engineering machineries, as well as energy facilities. Many substances have
evolved as suitable additives for controlling friction. Liquid lubricants, for instance,
prevents sliding interfaces from severe damage by forming a boundary film with low
shear and high durability (Espinosa et al., 2016; Fajardo et al., 2015; Raghunanan &
Narine, 2016a, 2016b, 2016c). They limit wear due to the limited boundary surface
thickness and sensitivity towards surrounding heat energy. A solid additive that could
leverage the aforementioned lubricant challenge is molybdenum disulphide (MoS2),
which forms strong films on metallic surfaces and exhibit high lubricity and stability at a
temperature of less than 400 oC in a dry and vacuum-type environment. However, MoS2
loses its lubricity in oxygen or water environment (Huang et al., 2005; Rudnick, 2009;
Sunqing et al., 1999; Xiaodong et al., 2007). Graphite self-lubricating and dry lubricating
properties could be a better option due to its resistance to the detrimental effect of
prolonged exposure to continuous temperatures of up to 450 oC while being exposed to
oxidising agents. The advantage is that despite all this, graphite remains capable of
providing effective lubrication. However, it suffers from degraded functionality in the
event that its surroundings lack humidity (Rudnick, 2009). Another lubricant such as
boron nitride is a ceramic, with robust tolerance against high temperatures of up to 1200
oC, even in an oxidizing atmosphere (Kimura et al., 1999). Antiwear additives such as
Zinc dialkyldithiophosphate (ZDDP) is a valuable anti-oxidant and corrosion inhibitor.
Unfortunately, at 130-170 oC, it decomposes, and discharges phosphorus, which is
regarded as a poisonous substance (Kasrai et al., 1998; Unnikrishnan et al., 2002).
Tricresyl phosphate (TCP), on the other hand, has an activation temperature that typically

2
exceeds 200 oC, and it forms a chemical bond that acts as a lubricating film on the
surfaces. However, it is a health hazard, and is known to induce depression and
schizophrenia (Godfrey, 1965; Lu et al., 2009).
Against the preceding background and the disadvantages of the antiwear additives, we
developed an innovative antiwear additive via the click chemistry functionalisation of
reduced graphene oxide. This antiwear material possesses friction and antiwear properties
that are unique. Its inertness, high level of mechanical strength, and ease of shearing for
impressive tribological behaviour are some of its properties that warrant applications
(Berman, Erdemir, & Sumant, 2014; Dreyer, Park, Bielawski, & Ruoff, 2010; Stankovich
et al., 2007). When coupled with the intercalating attributes of reduced graphene, we
developed this material with the intention to minimise its tendency to precipitate, which
occurs when its mixed with water or any other organic solvents. Hitherto, reduced
graphene has found its place as an oil additive, usually with the intention of improving
lubricity and reducing wear (Lin et al., 2011). Evidence in previous tribological studies
show that reduced graphene has high self-lubricating potential that reduces friction and
wear on surfaces (Li et al., 2005; Shioyama & Akita, 2003), which is in line with that of
the edge plane of reduced graphene oxide in this study, where it was functionalized with
a highly electron-rich group to boost its tribological properties. We focussed on producing
a highly dispersed functionalized reduced graphene as a promising additive that enables
low resistance in sheared contact by means of weak van der Waals interaction, thus
bringing about a significant reduction of friction and wear between sliding surfaces.

3
1.2 Statement of the problem
In any form of mechanical construct, reducing the wear effect from friction remains
a challenge, even with our current access to modern technology, especially in the case of
extreme conditions (Berman et al., 2013). Henceforth, continuous studies on various new
materials for coating and lubrication that can potentially reduce friction and wear have
been conducted. Unique physicochemical properties of graphene makes it a potent
material for many tribological applications, where negating the effect of friction and wear
is paramount at different length scales (Berman et al., 2014). However, challenges include
dealing with graphene’s inherent tendency to agglomerate due to its strong intermolecular
interaction, and also its lack of solubility in base oil, which limits its effectiveness as an
additive. If not reduced or effectively controlled, high levels of friction will significantly
increase the level of losses due to wear, hence shortening the instrument’s life span and
reliability.
1.3 Justification for the study
Challenges include graphene’s tendency to aggregate due to the strong intermolecular
forces between the particles and its lack of solubility in base oil, which limits its
effectiveness as an additive, both of which are the main focus of this work. By chemically
introducing a new functional group onto the surface of graphene via click chemistry, the
negative aspects of graphene as an additive can be reprimanded. Functionalisation of
reduced graphene, specifically by click coupling, is able to tailor the properties to improve
its dispersive capability in base oil, which enhances the tribological properties of oil. This
is achieved by manipulating GO’s surface to obtain functional groups that serve as
precursors to anchor desirable molecules.

4
1.4 Aim and objective of the research
The main focus of this work is to determine the possible properties of functionalized
graphene for application in lube oil.
Specific objectives of this research are as follows:
1. To synthesise functionalized rGO (F-rGO) via Click Chemistry (Cu-Catalyzed
Azide-Alkyne Cycloaddition) with various aliphatic chains for high dispersity in
oil.
2. To determine and investigate the suitable type of F-rGO and its potential for use
as an antiwear additive for lube oil.
1.5 Scope of the research
The scope of this study is to synthesise functionalized rGO with different alkyl chains
and investigate its activity in base oil as an additive. The intention is to reduce the friction
and wear between metal-to-metal contact, which is mainly used in tribological industries.
The major theme of the present research is to synthesise antiwear additives that can be
used in base oil at a much lower cost.
1.6 Outline of the dissertation
This dissertation is divided into five sections, organised in the following order:
Chapter 1
This chapter introduces the study and provide a detailed background to the work, along
with the statement of research problem, justification for the study, the aim and objectives
of the study, and the scope of the research.
5
Chapter 2
This chapter starts with a literature survey on previous studies, which is intended to
provide an understanding of the knowledge and theories pertaining to tribology. The
tribological properties of different types of solid additives and the various mechanisms
that have been proposed to explain their tribological behaviours will also be discussed.
Chapter 3
This chapter will describe the synthesis procedure for the additives and the
experimental techniques used to characterise the additives and investigate the friction and
wear behaviours of the additives in base oil as alongside it’s working mechanism. The
testing materials used in this study will be introduced in this chapter.
Chapter 4
This chapter will present the experimental results and observations obtained from
tribological tests using functionalized reduced GO as an additive in base oil. The results
from both the additives’ characterisation and performance test will be presented. The
friction and wear reduction mechanisms of F-rGO will be discussed as well.
Chapter 5
This chapter summarises the main findings from the overall study, as well as
suggestions for future research in this area.

6
CHAPTER 2: LITERATURE REVIEW
Introduction to Tribology
Tribology is defined as the science and engineering of interacting surfaces in relative
motion, encompassing fields of friction, lubrication, and interactions between solids,
liquids, and gases (Handbook & Friction, 1992).
Friction
Amontons’ empirical laws of friction are comprised of four theorems. The first one
being that the maximum tangential force is proportional to the normal force when a static
body is subjected to an increasing tangential load. The second law describes the tangential
friction force, which is described to be proportionate to the perpendicular force during
sliding. The third and fourth laws describe the independence of the friction force to both
variables of apparent contact and sliding speed. These laws have been proven to be
applicable in a variety of material and tribosystems, with observed limitations when
polymers are involved (Sakamoto et al., 1985). Derivation from the second law resulted
in the following equation:
𝑭 = µ • 𝑷 (Equation 2.1)
where P is the normal load, F is the tangential force, while µ is the coefficient of friction.
In many ways, frictional force is necessary in our daily life, in fact, linear motion may not
be entirely possible without the existence of such force. Conversely, a motion will not be
able to be stopped without the existence of frictional force, which is how brakes actually
work in motor vehicles. In terms of gears and machinations, force is detrimental due to
surface wear, which reduces their efficiency. These laws of frictional force govern our
understanding of the mechanics of frictional force, which includes tribology.

7
Mechanism of Wear
The mechanical action of opposing surfaces will eventually result in the removal
and/or deformation of material from the surfaces, which is commonly known as wear.
This is undesired, especially in machineries, as it decreases efficiency (Suh, 1973). Wear
can be further categorised into four types, namely abrasive, adhesive, fatigue, and
corrosive, and each are differentiated by its material removal mechanisms from the
surface.
2.1.2.1 Abrasive wear
Abrasive wear is present between a rough and soft surface, where the asperity from
one surface, usually the rougher one, penetrates the other, resulting in material removal
(ASTM, 2013). The debris from the microcutting mechanism will be dislodged from its
original surface, producing ridges (Khruschov, 1974). Abrasive wear can be further
divided into two sub-categories, as shown in Figure 2.1. The first is a two-body mode,
where the abrasion of a soft surface takes place due to the penetration by a hard
counterpart, thus producing debris. The second mode is the three-body mode, where the
debris are free to slide along a surface, or in other cases, roll off of it.
Figure 2.1: Schematic view of abrasive wear (Khruschov, 1974)
8
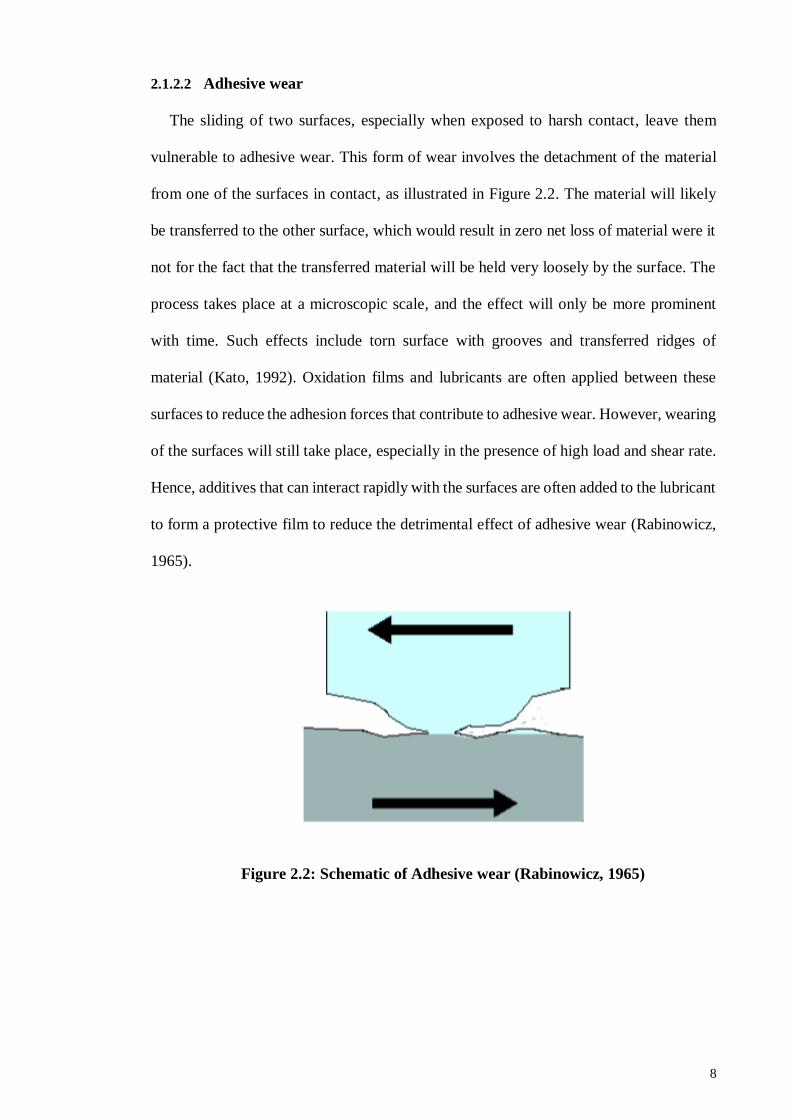
2.1.2.2 Adhesive wear
The sliding of two surfaces, especially when exposed to harsh contact, leave them
vulnerable to adhesive wear. This form of wear involves the detachment of the material
from one of the surfaces in contact, as illustrated in Figure 2.2. The material will likely
be transferred to the other surface, which would result in zero net loss of material were it
not for the fact that the transferred material will be held very loosely by the surface. The
process takes place at a microscopic scale, and the effect will only be more prominent
with time. Such effects include torn surface with grooves and transferred ridges of
material (Kato, 1992). Oxidation films and lubricants are often applied between these
surfaces to reduce the adhesion forces that contribute to adhesive wear. However, wearing
of the surfaces will still take place, especially in the presence of high load and shear rate.
Hence, additives that can interact rapidly with the surfaces are often added to the lubricant
to form a protective film to reduce the detrimental effect of adhesive wear (Rabinowicz,
1965).
Figure 2.2: Schematic of Adhesive wear (Rabinowicz, 1965)

9
2.1.2.3 Corrosive wear
A product of chemical reaction can be continuously removed when the reaction takes
place on two sliding surfaces. This repeated removal in the event of chemical reactions
process is known as corrosive wear, as it takes place in a corrosive surrounding. It is
relatively easier to chafe the product of the reaction compared to the starting material,
making this a continuous process, at least up till the point the substrate runs out, or is
removed from the corrosive environment. It should be pointed out that the wear rate is
proportional to the rate of the chemical reaction, which represents its main mechanism.
2.1.2.4 Fatigue wear
A material is in a rolling/sliding motion will generate local stress. Repeated contacts
between the aforementioned material with asperities will result in fatigue wear (Suh,
1973). This form of wear usually initiates other form of wears (abrasive and adhesive).
As shown in Figure 2.3, the top material will be removed, and catastrophic wear will take
place when these cracks reach a critical size (Suh, 1973). Within a system, the dominant
wear mode may not be constant. There are many factors influencing the transition of wear
modes, such as changes of contact geometry, by altering the properties of the rubbing
surfaces using lubricant additives (J. Xu et al., 1997) .
Figure 2.3: Schematic of Fatigue wear (Rabinowicz, 1965)

10
Lubrication
Introducing a film of lubricant between two in-contact surfaces in motion is often
employed to reduce wear of mechanical parts due to friction. The lubricant may be oil-
based or in some cases water-based. This thin layer is now vital towards ensuring the
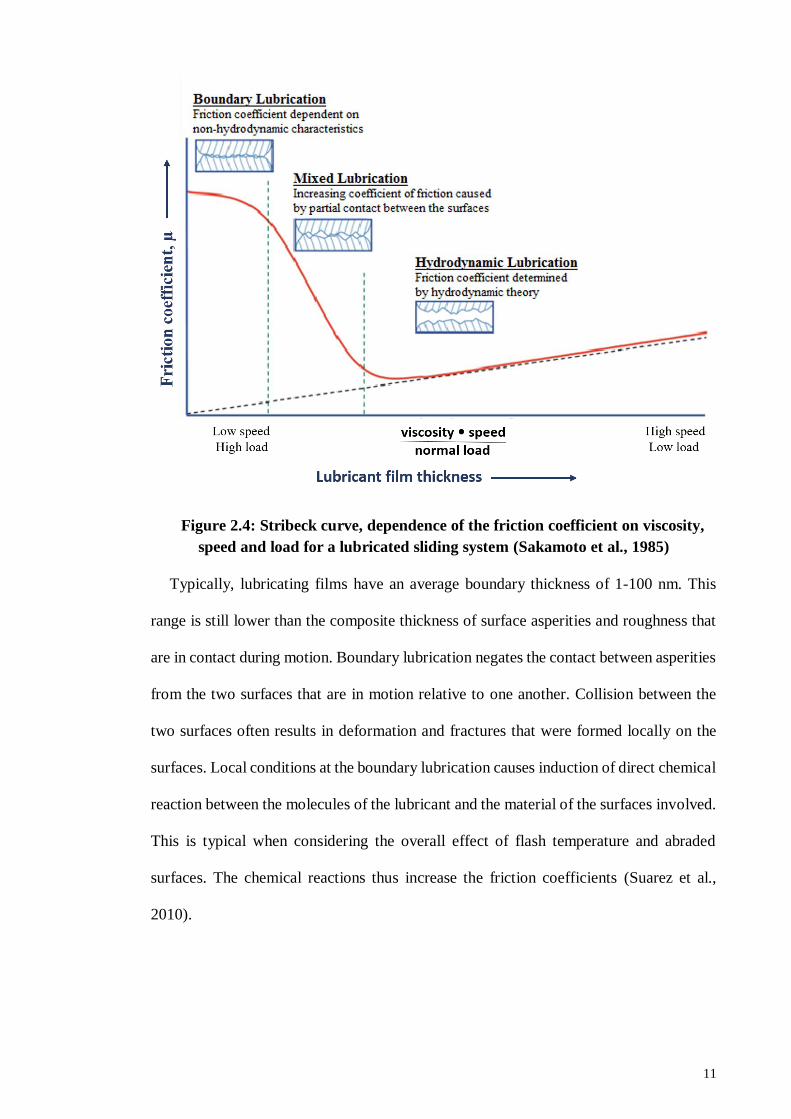
longevity of the mechanical parts. In case of lubricated systems, the Stribeck curve shown
in Figure 2.4 describes the dependence of the friction coefficient on the dynamic
viscosity, η, the speed, ν, and the normal load, L. There are three regime scan that are
apparent, which are hydrodynamic lubrication, mixed lubrication, and boundary
lubrication.
In the case of a hydrodynamic lubrication system, the adjacent surfaces are totally
separated by a thick lubricant film (1-1000 µm) preventing the sliding on surfaces, while
the load is supported by the lubricant film. The low coefficient of friction arises from the
shear forces in the viscous lubricant. The friction coefficient is calculated from Reynold’s
equation, where the friction coefficient is directly proportional to the load, while the
viscosity is inversely proportional to the sliding speed.
The mixed lubrication regime is where the lubricant films are thin (0.01-1 m) and some
asperities from the two surfaces are in contact. The load along the asperities in contact
are carried supported by the lubricant film. The two surfaces are separated from each
other partly by hydrodynamic forces and partly by thin layers of lubricant adhering to the
surface’s contours. It is an intermediate state where the strict laws of hydrodynamic
lubrication are no longer fully applicable.
11
Figure 2.4: Stribeck curve, dependence of the friction coefficient on viscosity,
speed and load for a lubricated sliding system (Sakamoto et al., 1985)
Typically, lubricating films have an average boundary thickness of 1-100 nm. This
range is still lower than the composite thickness of surface asperities and roughness that
are in contact during motion. Boundary lubrication negates the contact between asperities
from the two surfaces that are in motion relative to one another. Collision between the
two surfaces often results in deformation and fractures that were formed locally on the
surfaces. Local conditions at the boundary lubrication causes induction of direct chemical
reaction between the molecules of the lubricant and the material of the surfaces involved.
This is typical when considering the overall effect of flash temperature and abraded
surfaces. The chemical reactions thus increase the friction coefficients (Suarez et al.,
2010).

12
Lubricants
Lubricants are formulated products composed of a base oil (or base stock), and various
specialty additives designed for specific performance needs. They reduce friction and
wear, keep the components cool, and remove wear debris, while base oil functions as a
solvent for the additives as it controls the bulk and surface properties. Additive levels in
lubricants range from 1 - 25 wt.%, based on it intended applications (Jianqiang et al.,
2005).
Base oil
There are a few criteria when discussing a base oil as a foundation for lubricating
mixture. First, in order to maintain the lubrication film, the oil must be of a suitable
viscosity with respect to varying operating parameters. This ensures fluidity of the oil and
its ability to remove heat while congruently avoiding power loss. In this aspect, the
thermal stability of the oil is crucial. Simultaneously, the oil should also be stable against
oxidation, of low volatility, and capable of negating frictional forces that consequently
reduces wear. A good base oil is thos(Berman et al., 2014)e that can dissolve additives
while remaining inert vis-à-vis materials it comes into contact with.
2.2.1.1 Mineral Oil
Mineral oils make up the base stock in most formulation of lubricants. Straight and/or
branched carbon chains, made up of 20 - 40 carbon atoms in each molecule, are the main
composition of mineral oils. At times, the mineral oil may contain aromatic or aliphatic
rings. Sulphur, nitrogen, or oxygen found in a variety hydrocarbon structures, complete
the remainder of the oil’s composition. The heteroatoms influence the base oil’s stability
and can affect the lubricating properties, as they may interfere with the lubricant additives.
To distinguish between refined and crude oil, one may study the oil’s chemical form,
viscosity, and the amount of sulphur. Further categorisation of mineral oil comes in three

13
forms. Paraffinic oil is made up of straight or branched chain hydrocarbons, while
naphthenic oil is composed mainly of hydrocarbons containing cyclical carbon based
molecules with no saturated bonds. Finally, benzene type compounds generally make up
aromatic oil.
The origin of any crude oil is the main determinant of the sulphur content in the oil,
ranging from 0 – 8 wt. %. Sulphur, in moderate amounts in the oil, is desirable as it
improves resistance against oxidation and lubricating capabilities, both of which reduces
wear (J. Zhang et al., 1998). The viscosity of mineral oils is a function of the level of oil
refinement.
2.2.1.2 Synthetic Oil
The structure of synthetic oils, such as carbon chain and functional groups, can be
designed for specific properties. Synthetic oils are used for more demanding applications,
such as insulation, or thermal and chemical resistant lubricants (Boshui et al., 1996),
which makes them more expensive.
Polyalphaolefins
Polyalphaolefins are unsaturated carbon chain with an unsaturated carbon at the end.
The unsaturated carbons are the primary active site that initiates oligomerization to form
lubricants. Among its most important features are high viscosity index of 120 - 170, low
volatility, and stability against oxidative reactions. However, the lack of unsaturated
carbons in the form of functional groups, such as double bonds and aromatic containing
structures, render their solubility in additives quite low.
Esters
Esters are manufactured by reacting any form of alcohol with fatty acids. They are
classified based on the number of ester groups substituted in the fatty acid. For example,

14
an ester with single ester group is known as monoester. In term of viscosity, monoesters
tend to have lower viscosities compared to diesters or polyesters. Diesters have a good
viscosity index and good low temperature properties, but fairly low viscosities (7 - 46
cSt). The main distinguishing feature of a polyester compared to diesters is that the
viscosity lies in a wider range depending on factors such as the degree of esterification.
Lubricant Additive
Additives enhances the performance of lubricants in a variety of applications. These
additives can be further classified into those that are active or inert to further chemical
reactions. The former interface chemically with metals and polar oxidation and
degradation products, thus forming protective layers and making them innocuous. These
chemicals are often applied to improve the characteristics of the lubricant, such as
dispersants improving the dispersability and oxidative inhibitors prolong service life of
the lubricant. Chemically inert additives enhance the vital physical properties, without
which the performance of the lubricant has been shown to plummet significantly, such as
in the case of emulsifiers and demulsifiers (Jianqiang et al., 2005). Most lubricant
additives, except perhaps some viscosity improvers and pour-point depressants, consist
of an oleophilic hydrocarbon group and a hetero atom (N, O, S, and P)-based polar
functional group as illustrated in Figure 2.5. The hydrocarbon group must have a
sufficient length of chain carbon to achieve the required solubility characteristics of the
additive. The additives that require greater solubility in oil (dispersants, detergents, and
viscosity improvers) usually contain large hydrocarbon groups. Those that require either
lower solubility or greater surface activity (foam inhibitors and extreme-pressure) contain
small hydrocarbon groups. The performance of the additive is strongly dependent on a
proper balance of polar and non-polar characteristics (Jianqiang et al., 2005).

15
Figure 2.5: Additive structure scheme
To modify the properties of the lubricant, it needs many types of additives. Viscosity
modifiers, such as polymers, are often introduced to the fray with the intention of
positively altering the viscosity of the oil and improve the flow properties in cold
lubricants by decreasing the pour-point, which also decreases the crystallisation
temperature. Corrosion inhibitors protect the surfaces from harmful species that react
detrimentally with the aforementioned surfaces in the solution by adsorbing onto the
surface and sterically hindering interactions with the reactive species’ surface. Detergents
and dispersants, e.g. amphiphiles, are attached to oxidative or degradation products or dirt
particles, which results in oil-soluble species, preventing deposition on the surface. The
oil might oxidise via thermally activated dissociation of a hydrogen atom from the
hydrocarbon chain, or be induced by the presence of a nascent iron. The resulting radical
carbon chain reacts with dissolved oxygen to form peroxides, which in turn induce further
radical formation and oxidation. This leads to a higher acidity and lowered viscosity of
the lubricant. To prevent these effects, antioxidants such as metal deactivators, radical
inhibitors, or peroxide decomposers are added. Silicone polymers are added in very low
amounts to minimise foaming by decreasing surface tension.
The modifiers that combats frictional force and wear are vital additives when
accounting for economical and performance issues. In the boundary lubrication regime,
the surface asperities are in direct contact, promoting high level friction and increased
rate of wearing. This direct exposure of asperities on the surfaces have to be reduced,
16
which introduces a protective film on the surface. There are three types of additives: The
friction modifiers, also called adsorption or boundary additives, are used to inhibit
stick-slip via physical adsorption onto the surface, forming thin layers that prevent
adhesion and microwelding. Usually amphiphiles with polar head groups, such as
alcohols, esters, unsaturated and saturated acids bound on aliphatic chains are utilized.
They adsorb onto the surface and prevent direct contact. Usually these additives only
work at low loads and temperatures below 80 °C. At higher temperatures, the additives
desorb upon thermal activation. Another group of friction modifiers is that of
organomolybdenum compounds (e.g. molybdenum dithio-carbamates). The mixed and
boundary lubrication regimes introduce antiwear additives that are able to interact with
the surfaces involved to form a layer of protective film, which ensures that the sporadic
asperity on the surfaces do not lead to severe damage from wear. These additives are
phosphorus-based, with zinc dialkyl dithiophosphates (ZDDP) being the most
commercially applied in engine systems, which forms one of the major sources of
phosphorus and sulphur in engine oils. Other additives include tricresylphosphate (TCP)
and other phosphate esters or phosphorotionates. Microwelding becomes prominent only
under severe boundary lubrication conditions, such as in slowly moving and heavily
loaded gears. The additives react with the surface to prevent this from occurring. These
additives are sulphur-based, which includes dibenzylsulphide, phosphosulphurised
isobutene, trichloroacetone or molybdenum disulphide (MoS2), all of which are able to
withstand extreme pressure.
A journey from GO to graphene
One of the earliest research leading up to the discovery of graphene was carried out in
1859, where it was first known as graphitic acid due to its insolubility in acidic and
alkaline solutions, but it demonstrates high dispersability in aqueous solution. The core
of the method is oxidising graphite in an acidic mixture of potassium chlorate and nitric

17
acid. Further characterisation reveals molecular information of the material, including its
composition of mainly carbon, hydrogen, and oxygen, as yielding a molecular formula of
C2.19H0.80O1.00. The synthesized material laid the foundation for the modern synthesis of
graphene (Brodie, 1859).
This idea was expanded by Staudenmaier in 1898, who used concentrated sulphuric
and nitric acids with potassium chlorate to oxidise the graphite flakes. The gradual
increase of potassium chloride in this method was designed to accelerate the rate of
oxidation of graphite without having to repeat the same process reported by Brodie. As a
result of this, the degree of oxidation of graphite became similar to Brodie’s method,
where the ratio of carbon to oxygen is almost equal, at 2:1. This method, despite being
more practical, is inherently more dangerous. In 1958, Hummers and Offeman modified
this method by developing a safe procedure for oxidising graphite flakes that took less
than two hours. They treated graphite flakes with a water-free mixture of concentrated
sulfuric acid (H2SO4), sodium nitrate (NaNO3), and potassium permanganate (KMnO4),
resulting in the similar levels of oxidation (Hummers Jr & Offeman, 1958).
Since then, Hummers’ method was used to produce GO, with slight modifications in
order to avoid generating toxic gases and reduce processing time, which results in higher
levels of oxidation. In 2010, Marcano et al. described an improved method of synthesising
GO by excluding nitric acid, increasing the amount of KMnO4, and performing the
reaction in a 9:1 mixture of H2SO4/H3PO4. This procedure produced a large-scale
hydrophilic GO, with fewer defects in the basal planes (Marcano et al., 2010). This
process also did not generate toxic gases, and it improved the graphite oxidation
efficiency, increasing its oxidation levels compared to Hummers’ method.
Current researchers are more interested in producing graphene with the thinnest layer
possible, where the carbon atoms were arranged in lattices patterned not unlike

18
honeycombs as shown in Figure 2.6. This is to further enhance the material’s already
remarkable physical and electrical properties for applications in various fields. Andre
Geim and Konstantin Novoselov managed to produce graphene at millimetres via the
micromechanical cleavage method, which involves the peeling of individual graphene
layers from graphite synthesized from graphite flakes (Novoselov & Geim, 2007).
Figure 2.6: (a) One atom thick graphene in honeycomb lattice (b) The d-spacing
of graphene (Novoselov & Geim, 2007)
Various methods have been employed to synthesise an isolated layer of graphene,
such as chemical deposition (Bautista & Mendoza, 2011) and thermal reduction (Chen et
al., 2010). The research trends then began to focuses on hybridisation of these isolated
sheets of graphene with materials such as polymers (Carotenuto et al., 2015), metal (C.
Xu et al., 2008) and metal oxides (Zou & Wang, 2011) to further enhance the base
material’s applicability, such as electron transportation and thermal conductivity.
To combat graphene’s tendency to agglomerate irreversibly due to its hydrophobicity,
the material’s surface was functionalized. The simplest solution to agglomeration is
functionalising graphene with hydrophilic groups, yielding nano-composite materials
(Tantis et al., 2012). Overcoming the issue of hydrophobicity via surface functionalisation
also prevents the reformation of graphite.
(a) (b)

19
Properties of graphene
The building blocks of graphene are sp2 carbon atoms arranged in honeycomb-like 2D
lattices. Each individual carbon atoms form trigonal planar structures with their
neighbours, with each atom having a delocalised π orbital as in Figure 2.7.
Figure 2.7: The sp2 hybridize orbitals between carbon atoms and the π bonds
(Novoselov & Geim, 2007)
The strength of the C-C bonds between the atoms contribute to graphene’s mechanical
strength, while the delocalised orbitals make it an excellent material for electronic
applications with good electron transporting properties. As an added benefit, graphene
possesses very high specific surface area and is an excellent thermal conductor.
Functionalized rGO
Reacting graphene with organic and inorganic molecules, or even modifying the
surface of graphene oxide yield a functionalized form of rGO (Georgakilas et al., 2012).
The general idea is reacting the functional groups on the surface of graphene oxide with
compounds containing functional groups. These functional groups will then act as an
anchor for further modification with other molecules. The resulting material have been
shown to demonstrate improved dispersability in various solvents. These functionalized
materials lay the foundation for further nucleation of nanoparticles, promoting uniform
particle size and the dispersion of nanoparticles throughout the overall material (Marques
et al., 2011).

20
Functionalized rGO as an additive
As discovered by Peng et al., introducing diamond nanoparticles as an additive
improves its ability to prevent friction, and interestingly, the improvement becomes
increasingly prominent with decreasing particle sizes of the additive. Recently, GO was
used in the same manner as diamond nanoparticles as additives. The unique advantage
using GO is the customisability of the material due to presence of –OH and –COOH
groups on its surface. These groups allow for the functionalisation of either long chain
compounds, such as aliphatic amine or compounds containing more –OH and –COOH
groups. The first of these aforementioned functionalisation enhances GO’s dispersability
in non-polar solvents, while the latter increases its polarity to prevent GO from
undergoing chemical reactions, which also increases its stability (D. Peng et al., 2009).
The ability to functionalise an additive is particularly important when solid lubricants
are involved. These lubricants include graphite and MoS2 which are composed, at the
molecular level, of flat sheets of molecules, or in some cases, merely atoms. The sheets
make it easy for the material to shear parallel to the layers, which reduces the coefficient
of friction as it is proportional to the parallel layer’s shear stress. It should be noted that
this will only work if the lubrication layer is parallel to the sliding motion. Further
improvement could also be in the form of increased adherence of the solid lubricant to
the surfaces, which increases service life (Shankara et al., 2008).
This study focused on synthesising reduced graphene oxide and functionalising it via
click coupling to provide an alternative and a more efficient antiwear additive to lube oil,
which in turn enhances fuel economy.

21
An introduction to Click Chemistry
A “click” reaction binds two molecules in the presence of a catalyst. It is also a green
process, as per Kolb, Finn and Sharpless (2001). The study further showed that the
reaction is one that is highly selective and capable of producing high yield at mild
conditions with excellent water tolerance. The most commonly used catalyst for “click”
reaction is CuI, which usually involves azide/alkyne cycloaddition (CuAAC) (Iha et al.,
2009; Kolb et al., 2001). A good comparison to this reaction would be the Huisgen
reaction procedures, where no catalyst was used to combine acetylene dicarboxylate and
phenyl azide to produce 1, 2, 3-triazoles (Huisgen, 1963). Unlike CuAAC reactions,
which is selective to form 1,4-disubstituted triazoles, Figure 2.8 also shows Huisgen
reaction yield 1,4 and 1,5-disubstitution products (Rostovtsev et al., 2002; Tornøe et al.,
2002). The CuI catalysts lowers the activation energy barrier by changing the mechanism
of reaction, as in the case of reactions between propyne and methylazide (Himo et al.,
2005).
Figure 2.8: The Huisgen’s and CuAAC reaction (Liang & Astruc, 2011)
Being facile and selective, CuAAC reaction was found to be reliable (Bock et al., 2006;
Golas & Matyjaszewski, 2010; Hein & Fokin, 2010; Meldal & Tornøe, 2008; Rodionov
et al., 2007; Sumerlin & Vogt, 2009). The wide applicability of a wide range of CuI
precursors and solvents, including aqueous solvents, further promote the recognition

22
received by this reaction. It should be noted that there are other catalysts that can be used
for the azide/alkyne cycloaddition (AAC), such as ruthenium cyclopentadienyl
complexes (L. Zhang et al., 2005), Ni2+, Pd2+, Pt2+ and Au (I) (Liang & Astruc, 2011),
albeit with reduced overall efficiency. The traits of click chemistry, particularly its
stability from hydrolysis and dimerization, makes the reaction a viable method for
upgrading carbon-based materials, such as carbon nanotubes (CNTs) (Franc & Kakkar,
2008; Lutz & Zarafshani, 2008; Mansfeld et al., 2010) and graphene oxide (Lutz &
Börner, 2008; Mullen et al., 2011), which is essentially CNT’s 2D counterpart.
Mechanism of Copper-Catalyzed Azide-Alkene Cycloaddition
The mechanism of CuAAC reaction was the highlighted in the study conducted by The
Script group via kinetic studies using DFT calculations (Ahlquist & Fokin, 2007; Himo
et al., 2005). The first step was lowering alkyne’s pKa by 9.8 pH units during its
coordination. This lead to the deprotonation of 𝜋-alkyne-CuI intermediate by water to
form the 𝜎-alkynyl-CuI species (Straub, 2007). The rate of reaction was found to be
second order with respect to Cu+. The cations were found to aggregate at high
concentrations. There are two proposed ways by which alkynyl and azide reactants can
interact with the metal centre at different or similar metal sites as illustrated in Figure 2.9
(Rodionov et al., 2007).

23
Figure 2.9: Proposed catalytic cycle for the CuAAC reaction based on DFT
calculations (Hein & Fokin, 2010)
In the bimetallic route, the decreasing electron density on the sp carbon atoms lead
to the enhancement of the reactivity of the alkynyl ligand. This in turn leads to the
𝜎-alkynyl-CuI species to undergo 𝜋-complexation calculation from the DFT modelling,
conformed to a reaction between a second Cu+ atom and CuI-acetylide (Ahlquist & Fokin,
2007; Rodionov et al., 2007). This is then followed by an attack by the azide group, and
CuIII vinylidene metallacycle formed as a product of this. The crux of this mechanism is
the proposed formation of µ2-ligande 𝜎– 𝜋-alkynyl dicopper transition state, shown in
Figure 2.10 (Hein & Fokin, 2010).

24
Figure 2.10: Alkyne-bridged bimetallic species (Hein & Fokin, 2010)
CuAAC reaction with GO
Click chemistry has been widely used to introduce functional group to a material to
tailor its properties for specific tasks (Salvio et al., 2009; Sun et al., 2010). This provide
new platforms for improving the 2D macromolecule via the introduction of moieties,
which alters the physicochemical properties. Further probing is required to fully
understand the conditions and depth of this method’s applicability, especially in the
context of further improving GO. Table 2.1 tabulates reviews on functionalisation of GO
via click chemistry.
Table 2.1: Review on functionalization of GO via Click Chemistry
Year Review on click reaction with GO References
2010 Kou and co-worker reported the anchoring of poly
(ethylene glycol) on nanosheets of 2D graphene oxide
via click chemistry to improve solubility in organic
solvents.
(Kou et al.,
2010)
2011 Pan et al. demonstrated achieved the grafting a well-
defined poly(N-isopropylacrylamide) via click
chemistry as an effective transport for anticancer drug
delivery. The functionalized graphene sheets were
shown to have thermo-sensitivity post-grafting.
(Pan et al.,
2011)
2012 Ye et al. analysed variety of methods to graft dispersed
graphene nanosheets. The methods’ efficiency and
versatility were also presented.
(Ye et al.,
2012)

25
Year Review on click reaction with GO References
2014 Nia et al. reported the synthesis of a well dispersed
copper nanoparticles supported on layers of graphene
nanosheets. The material was then used as a catalyst to
achieve Cu(I)-catalyzed [3+2] cycloaddition with
commendable reactivity.
(Nia et al.,
2014)
2015 The synthesis of polypyrrole-grafted graphene sheets
with good conductivity was used in a resistive-memory-
based application, which involved compounds of low
volatility was reported by Ramasamy and co-worker.
(Ramasamy et
al., 2015)
2016 Han and Cho studies the click coupled stitched GO
sheets by using a click chemistry reaction. The
synthesized material was then used fillers for in
polymer nanocomposites. The material also
demonstrated capability as photothermal fillers.
(Han & Cho,
2016)
Figure 2.2.11: Research gap between literature studies and current research
Table 2.1, continued
26
CHAPTER 3: RESEARCH METHODOLOGY
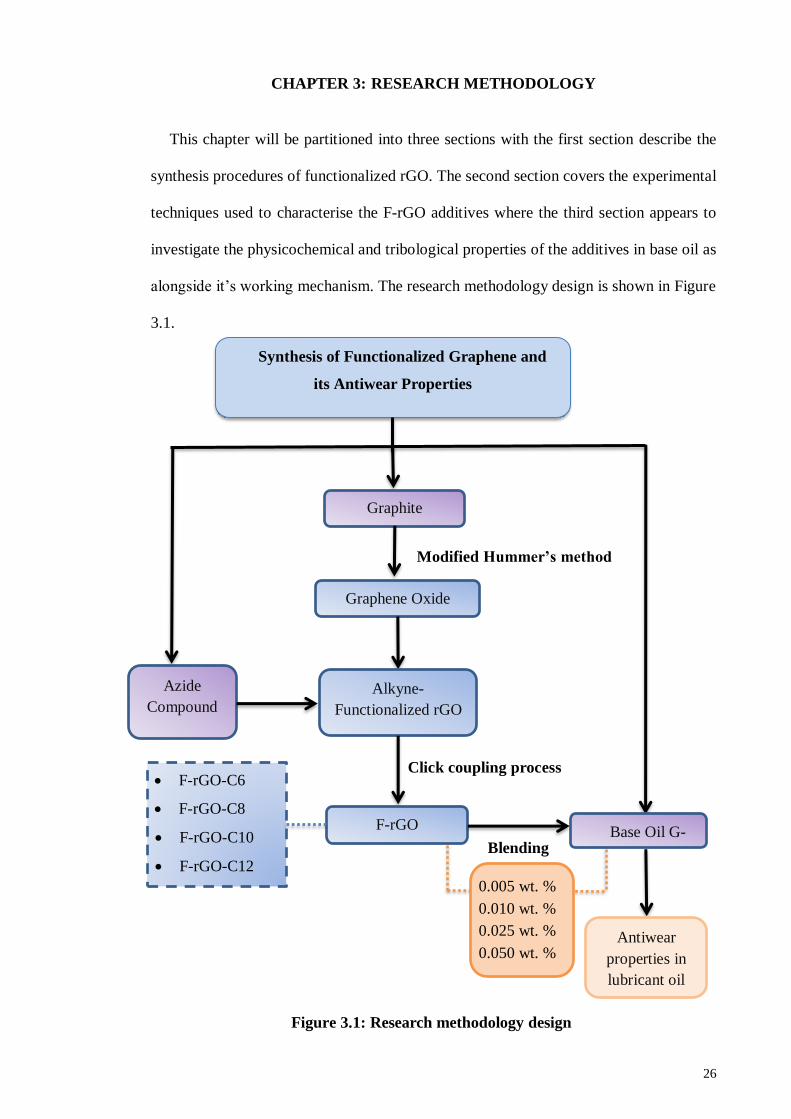
This chapter will be partitioned into three sections with the first section describe the
synthesis procedures of functionalized rGO. The second section covers the experimental
techniques used to characterise the F-rGO additives where the third section appears to
investigate the physicochemical and tribological properties of the additives in base oil as
alongside it’s working mechanism. The research methodology design is shown in Figure
3.1.
Synthesis of Functionalized Graphene and
its Antiwear Properties
Graphite
Graphene Oxide
Alkyne-
Functionalized rGO
Azide
Compound
F-rGO Base Oil G-
Antiwear
properties in
lubricant oil
Modified Hummer’s method
Click coupling process
Blending
• F-rGO-C6
• F-rGO-C8
• F-rGO-C10
• F-rGO-C12
Figure 3.1: Research methodology design
• 0.005 wt. %
• 0.010 wt. %
• 0.025 wt. %
• 0.050 wt. %

27
Materials
All of the chemical reagents used in this work were of analytical grade and utilised
without further purification. The materials used in this work are listed in Table 3.1.
Table 3.1: List of chemicals used in this study
Name Molar mass
(g/mol)
Brand
Flakes of graphite 12.00 Asbury Graphite Mills,
Inc.
Sulfuric acid (H2SO4) (98 %) 98.08 Sigma Aldrich
Phosphoric acid (85 %) (H3PO4) 98.00 Sigma Aldrich
Hydrochloric acid (HCl) (37 %) 36.460 Sigma Aldrich
Hydrogen peroxide (H2O2) (30 %) 34.01 Merck
Potassium permanganate (KMnO4) 158.03 Merck
Sodium azide (NaN3) 65.01 Sigma Aldrich
Dimethyl sulfoxide (DMSO) 78.13 Friendemann Schmidt
Tetrahydrofuran (THF) 72.11 Sigma Aldrich
Lithium aluminum hydride (LiAlH4) 37.95 Sigma Aldrich
1-bromohexane 165.07 Sigma Aldrich
1-bromooctane 193.12 Sigma Aldrich
1-bromodecane 221.18 Sigma Aldrich
1-bromododecane 249.23 Sigma Aldrich
Methyl-3,5-dihydroxybenzoate 168.15 Sigma Aldrich

28
Sample preparation
Synthesis of graphene oxide
The modified Hummer’s method was used to synthesise GO via exfoliation.
Exfoliation of the pre-oxidised graphite powders into sheets of GO was achieved using
the following approach: 120 mL of H2SO4 was mixed with 13 mL of concentrated H3PO4.
This was followed by the addition of 1.0 g graphite powder and continuous stirring. After
10 minutes, gradual addition of 6.0 g of KMnO4 was gradually added to the solution,
while the temperature was kept lower than 10 oC to prevent overheating. The mixture was
stirred at 10 oC for an hour. The newly formed solution was diluted and cooled, while
continuously stirred. The suspended material was then treated with a solution of 30 %
H2O2 (20 mL). The mixture was centrifuged thrice with HCl to remove any remaining
Mn2+ in the GO. Finally, the resultant GO was washed 6 times with DI water, then filtered,
sonicated, and dried to obtain graphene oxide sheets.
Graphite powder + H2SO4 + H3PO4
Addition of KMnO4
Drop-wise addition of 30 % H2O2
Centrifuging, washing with HCl and
deionized water and drying overnight at
80 oC
Stirring at 700 rpm at
room temperature for 10
minutes
Stirring at 700 rpm at
10 oC for 1 hour
Figure 3.2: Flow chart for the synthesis of GO
29
Synthesis of Alkyne-Functionalized rGO Compound
3.0 g of Methyl-3,5-dihydroxybenzoate was dissolved in acetonitrile. This was
followed by introducing 7.4 g Potassium carbonate and 4 mL of propargyl bromide (80
wt. % in toluene) to the mixture, which was thereafter refluxed at 80 oC for 24 hours,
filtered, then evaporated to obtain yellow flakes. Afterwards, 0.9 g of LiAlH4 was added
to 3.0 g of this flake in THF. The mixture was stirred for 24 hours, then the LiAlH4 was
quenched dropwise via the addition of water, followed by being filtered and dried over
anhydrous MgSO4 to form an alkyne compound. Afterwards, 1.0 g of GO was stirred in
chloroform, followed by dropwise of thionyl chloride and triethyl amine, and stirred for
2 hours, then evaporated to form chlorinated functionalized GO. 1.0 g of the alkyne
compound, 1.0 g of the chlorinated functionalise GO, and 0.13 g of sodium hydride was
mixed in THF at 5 oC, and stirred for 24 hours to obtain alkyne functionalized GO.
.
Methyl-3,5-dihydroxybenzoate +
K2CO3 + propargyl bromide solution
Addition of LiAlH4
GO + SOCl2 + Et3N
Alkyne compound + chlorinated GO
+ NaH
Reflux in acetonitrile
at 700 rpm at 80 oC for
24 hours
Stirring at 700 rpm at 10
oC for 24 hours
To form alkyne
compound
Stirring at 700 rpm at 10
oC for 2 hours
To form chlorinated
GO
Figure 3.3: Flow chart for the synthesis of alkyne-functionalized rGO

30
Synthesis of Azide Compound
The synthesis of Azide compound involved mixing 4.0 g of sodium azide and 4.2 mL
1-bromohexane in DMF. The reaction was conducted under reflux for 24 hours at 80 oC.
The product was then extracted with diethyl ether and washed with water. Excess water
was removed via the introduction of anhydrous MgSO4, which was then evaporated. The
reaction was repeated with 1-bromooctane, 1-bromodecane, and 1-bromododecane.
Synthesis of Functionalized GO via Click Chemistry
Functionalized GO was synthesized using Click Chemistry. 0.01 g of Alkyne-
functionalized GO, 0.02 g 1-azido hexane, 0.1 g of sodium ascorbate, and 0.2 g copper
(II) sulphate were dissolved in a mixture of DMSO and distilled water, then stirred
overnight. The mixture was then filtered and washed congruently with distilled water and
ethanol, and vacuum dried for 24 hours.
.
Alkyne-functionalized GO + 1-
azido hexane + sodium
ascorbate + CuSO4.5H2O
Filter, washing and drying
overnight
Stirring at 700 rpm for
24 hours
NaN3 + 1-bromohexane
Extract, washing and
evaporating
Reflux in DMF at 700
rpm at 80 oC for 24 hours
Figure 3.4: Flowchart for the synthesis of azide compound
Figure 3.5: Flowchart for the synthesis of F-rGO

31
Figure 3.6: General procedure for F-rGO
Characterisation techniques
This section describes the characterisation techniques used in this work, which
includes techniques such as Fourier Transform Infrared (FTIR), Raman, X-ray
Photoelectron Spectroscopy (XPS), Thermogravimetric Analysis (TGA), and X-ray
Diffraction (XRD) for analysing the elemental composition, TGA to study weight loss as
a function of temperature, and Field Emission Scanning Electron Microscopy (FESEM)
to determine the morphologies and dimensions of the nanocomposites. Each of these
studies combine to give an overall characterisation of the synthesized F-rGO along with
their variation of physicochemical properties with respect to one another as well as from
the base material, GO. This bring about the isolation of F-rGO with most desirable
features as well as highlighting their advantages in the tribology field.

32
Fourier Transform Infrared (FTIR) Spectroscopy
FTIR spectroscopy techniques utilises infrared wave bombardment to the material
under analysis. The absorbance or the emission wave will then be subjected to the
mathematical conversion known as Fourier Transformation to yield their respective
spectrum which can then be interpreted. This method of analysis allows for identification
of functional groups present in the sample under study and in this research the analysis
allowed identification of functional groups present in the GO and F-rGO. This allows the
distinction of the two materials from one another, as well as confirming the
functionalisation of the GO based on the functional groups present.
In this study, Perkin Elmer FTIR spectroscopy was used to identify the F-rGO
functional groups between 400 to 4000 cm -1 for each set of samples as shown in Figure
3.7. The samples were prepared using the potassium bromide (KBr) method, where 0.03
mg of F-rGO was mixed with 4 mg of KBr. The trituration of KBr helps prevent light
scattering due to the large size of the KBr crystals. The mixture was then formed into a
pellet, which was then held in place by a sample holder, which enables the uninterrupted
passage of the IR beam.
Figure 3.7: Perkin Elmer Instrument FTIR for chemical bonding studies
(Elmer, 2017)

33
Raman Spectroscopy
Raman spectroscopy applies similar concept as to FTIR analysis, except the scattered
energy is measured rather than the absorbed or emitted energy. Raman shifts come about
from the inelastic scattering of the incident energy wave which come in the form of Stokes
or anti-Stokes scattering. When the electromagnetic radiation interacts with polarisable
electron cloud in a molecule the excitation of the electron takes place which then lead to
the said energy scattering. The shift in the energy caused by the energy loss due to
inelastic scattering is measured as Raman shifts, which is unique from one molecule to
another.
The Raman spectra were obtained using a Renishaw inVia Raman microscope shown
in Figure 3.8, with a 514 nm laser as its excitation source within the range of 100 - 3000
cm-1. To obtain the F-rGO spectra, 0.05 g of F-rGO was tested using a 0.02 mV laser
power and 180 seconds of exposure time. The obtained Raman spectra was analysed to
determine the phases of the F-rGO.
Figure 3.8: Renishaw inVia Raman Microscope for structural characterisation
(Renishaw, 2017)

34
X-ray Photoelectron Spectroscopy (XPS)
The underlying concept behind this analysis is the quantisation of energy, which is
unique for bonded electron in different form of matter. Similar to other spectroscopy
method, the analysis begins with bombardment of the sample with electromagnetic
radiation, in this case X-ray. This leads to excitation of the electron, which also leads to
the emission of the electron. With the fact that the binding energy for each compound is
different, particularly if the atom is bonded differently, the energy can be used to identify
different atoms present on the surface of the sample.
X-ray photoelectron spectroscopy provides an in-depth information of the chemical
state of elements found on the surface of F-rGO. This pointed to the specific bonding of
the elements present on the surface of the said material. The analysis is carried out at an
average depth of 5 nm. Figure 3.9 shows the ULVAC-PHI Quantera II, with a 32-channel
spherical capacitor, analyses the energy re-emitted from the material after bombardment
by X-ray under vacuum condition (1 ×10⁻⁶ Pa). The process also utilises hemispherical
analyser with a natural width of 680 meV and monochromatic Al Kα sources (1,486.6
eV).
Figure 3.9: ULVAC-PHI Quantera II for surface analysis (ULVAC-PHI, 2017)
35
X-Ray Diffraction (XRD) Analysis
The crystallographic structure and phase of the F-rGO was investigated using X-ray
diffraction (XRD) analysis. In this research, the XRD diffractograms of the solid powder
was analysed using Bruker D8 Advance diffractometer as per Figure 3.10, equipped with
a quartz monochromatized Cu Kα radiation and wavelength, 𝜆 = 0.154059 𝑛𝑚.
Approximate 1 g of the sample was measured and placed into the sample holder. The
system operated at a scanning rate of 0.02⁰ per second to over a 2𝜃 range of 10⁰ to 80⁰.
Other frequent applications of XRD is to determine the crystallite size. The Debye-
Scherrer equation can be used to obtain an estimated nanoparticle size. There are several
studies on the determination of the crystallite size from XRD patterns using the Debye
Scherrer’s equation:
𝑫 =𝑲𝝀
𝜷𝒄𝒐𝒔𝜽 (Equation 3.1)
where;
K = shape factor,
𝜆 = wavelength of x-ray,
𝛽 = band broadening at half of the maximum intensity of each peak,
𝜃 = Bragg angle,
D = average diameter of the domains.

36
Figure 3.10: Bruker D8 Advance diffractometer for crystal structure and
composition studies (Bruker, 2016)
Thermogravimetric Analysis (TGA)
TGA elucidates the composition of F-rGO and thermal stability as a function of
temperature and time. It records the change in the weight of the F-rGO with increasing
temperature and time under the flow of Argon gas. For compositional analysis, TGA helps
estimate the amount of each component in the material by calculating the onset
temperature of degradation or volatilisation. In this work, TGA measurement was
performed using a Mettler Toledo, TGA/SDTA-851e shown in Figure 3.11 that operates
over the temperature range of 20 - 1000 °C and a scan rate of 20 °C/min. The sample was
in the powder form, as it has a larger surface area, which helps improve the weight loss
resolution and temperature reproducibility.

37
Figure 3.11: Mettler Toledo, TGA/SDTA-851e thermal analyser to study the
rate of change in weight over temperature or time (Toledo, 2016)
Field Emission Scanning Electron Microscopy (FESEM)
The surface features and particles sizes or shapes of the sample were analysed using a
high-resolution field emission scanning electron microscope. The process begins with the
irradiation of the samples with electrons and the reflected energy is used to image the
surface at microscopic level. In this research, the morphology of the F-rGO was
determined using a scanning electron microscope Quanta FEG 450 shown in Figure 3.12.
The field emission gun electron source of this model produces a high current, which
enables imaging up to 3 nm resolution and a magnification of up to 250,000 ×. All the
tested samples were in the powder form.

38
Figure 3.12: Quanta FEG 450 FESEM for morphology and structural study
(Scientific, 2016)
Physicochemical measurement of additives
F-rGO samples were introduced into the base oil via mechanical stirring, coupled with
sonication shown in Figure 3.12. Base fluid used in this research is base oil group 3 (G-
III) since it is the best grade and purer of petroleum base oil. Synthesize functionalized
rGO via click chemistry with different alkyl terminal chain with the concentration of
additives is 0.010 wt. % and formulate base oil lubricant using various additives
concentration are shown in Table 3.2 and Table 3.3.
Table 3.2: Additives with different alkyl-chain
Sample Additives (wt. %) Base oil G-III (wt. %)
Base Oil G-III 0.00 100
F-rGO-C6 0.010 99.99
F-rGO-C8 0.010 99.99
F-rGO-C10 0.010 99.99
F-rGO-C12 0.010 99.99

39
Table 3.3: Formulation of lubricant oil with additive in varying concentration
Additives (wt.%) Base Oil G-III (wt. %)
0.005 99.995
0.010 99.990
0.025 99.975
0.050 99.950
Figure 3.13: Oil blending process
Density Analysis
The density and/or relative density of distillates of the petroleum and oils of varying
viscosity were determined at test temperatures of 15 – 35 °C. The restriction imposed on
such application lies within vapour pressure of less than 600 mm Hg (80 kPa) and a
measured viscosity of less than 15,000 cSt (mm2/s) in terms of temperature during testing.

40
Viscosity Analysis
Viscometer is used to measure the viscosity of a fluid which measure under one flow
condition. The Anton Paar viscometer is a built-in density measurement based on the
oscillating U-tube principle that allows the determination of kinematic viscosity from the
measured dynamic viscosity employing the relation:
𝒗 = 𝜼
𝝆 (Equation 3.2)
where;
𝒗 = the kinematic viscosity (mm2/s)
𝜂 = the dynamic viscosity (mPa.s)
ρ = the density (g/cm3)
The viscosity analysis of functionalized rGO were carried out using SVM™ 3000
Stabinger Viscometer shown in Figure 3.14 from Anto Paar which determines dynamic
viscosity, kinematic viscosity and density of oil as well. The viscosity measurements were
conducted at 40 oC and 100 oC, while the viscosity index (VI) was determined based on
ASTM D445 and ASTM D2270. VI is used to measure the temperature dependence of
an oil’s kinematic viscosity, and the higher the VI, the lesser the change of viscosity of
the oil with temperature, and vice versa.
Figure 3.14: SVM™ 3000 Stabinger Viscometer (Paar, 2017)

41
Total acid number (TAN) Analysis
The standard method ASTM D664 (Javidialesaadi & Raeissi, 2013) was used in this
analysis. 0.1 M of potassium hydroxide (KOH) was used to neutralise acid component in
the samples for potentiometric titration as shown in Figure 3.15. Subsequent titrations
involving a mixture of toluene, isopropanol, and water (500:495:5) was carried out. The
obtained value of acidic constituents was collected and reported in terms of mg of KOH
for every gram of oil. Each analysis was repeated thrice to obtain an average.
Figure 3.15: Metrohm potentiometric titration (Metrohm, 2017)

42
Tribological analysis
Friction and wear test
The four-ball wear tester as shown in Figure 3.17 were utilised for testing the effect of
additives to the performance of the subsequent lubricants. A 27 mm diameter stainless-
steel ball bearings were exposed to the following conditions as illustrated in Figure 3.16:
1200 rpm speed under a constant load of 40 kg (392.266 N) at an elevated temperature of
35 oC. Readings were recorded every 30 seconds, and then averaged.
Figure 3.16: Coefficient of friction and ball wear mechanism
The four-ball test was performed thrice, and the average values of the tests are
reported. The sliding wear losses were measured using a highly precise digital weighing
machine. The weight losses of the test samples were then converted to volume losses. The
specific wear rates were calculated using the Archard equation:
𝑾 𝒔 = ∆𝑽 𝑳 • 𝒅 Equation 3.3
where;
Ws = specific wear rate (m2/N),
ΔV = loss of volume (m3),
L = normal load (N) and
d = distance during sliding motion (m).

43
Figure 3.17: Four-ball tester (Instruments, 2017)

44
CHAPTER 4: RESULTS AND DISCUSSIONS
This chapter will discuss the results of the research. The results for both additives
characterization and performance will be presented, analyzed, and compared with those
reported in literature.
Sample characterization
Vibrational harmonic modes of F-rGO additive
The vibrational mode of the synthesized additives was studied using the FTIR and
Raman spectroscopy method. The results detail the intrinsic properties of the materials.
Figure 4.1 shows the FTIR spectra of edge plane functionalized reduced Graphene oxide,
and show representative peaks centred at 3237, 1710, 1614, 1230 and 1044 cm-1,
corresponding to O–H stretching, C=O stretching, C=C stretching, epoxy C–O stretching,
and alkoxy C–O stretching functionalities of graphene oxide, respectively (Choi et al.,
2010; Jang et al., 2014). After the click coupling reaction, the vibration peak centred at
1710 cm-1, for C=O stretching disappeared; suggesting the incorporation of the alkyl
group at the edge plane (Sun et al., 2010). However, as shown in the region coloured red,
the intensity of the vibration peak at 3237 cm-1 decreased significantly, whereas two
prominent new peaks at ~2850 and ~2950 cm-1 appeared; this suggest C–H stretch in the
–CH2 of the alkyl. After click coupling, the attachment of azide groups to the surfaces of
F-rGO is confirmed from the appearance absorption peak of azide groups at 2098 cm-1 at
the region coloured yellow. The disappearing peak at 2098 cm-1 and the presence of the
at 1100 cm-1 is related to the stretching of C-O groups, which proves the successful azide-
alkyne coupling (Kou et al., 2010), as shown in the region coloured green.

45
Figure 4.1: FTIR spectra of the synthesized additives
Table 4.1: FTIR band assignment for the synthesized additives
Graphene Oxide Functionalized rGO
FTIR band
position (cm-1)
Assignment FTIR band
position (cm-1)
Assignment
3237 -OH 2850 C-H
2796 C-H 2098 N=N=N
1710 C=O 1590 -CONH
1614 C=C 1615 C=C
1230 C-O epoxy ring 1291 C-O epoxy ring
1044 Alkoxy C-O 1100 Alkoxy C-O

46
Figure 4.2: Raman spectra of GO and functionalized rGO
In Figure 4.2, each of the functionalized rGO samples were subjected to Raman
spectroscopy analysis. The results showed two peaks at ~1340 cm-1 and 1600 cm-1, each
of which were assigned to the D band; indicating the presence of defect; suggesting the
successful incorporation of the N-group and G band; E2g band with sp2 bonding attributes,
respectively (Jang et al., 2014; Kou et al., 2010). It is interesting to note the general
decrease in the intensity of these two peaks with increasing carbon chain length, up to 12.
This indicates that as the chain length grows, the degree of disorder and stretching of the
bonds decreases. This conforms to the observation from the XRD, where the alkyl group
acts as a bridge that increases the rigidity between the layers of sheets of the materials.
Furthermore, these trends resulted in amorphous carbon materials, which was also
confirmed by the XRD. However, the trend does not apply to F-rGO-C12, which has a
significantly longer carbon chain compared to the others. The intercalation between the
layers of the material is covered, which increases structural disorder and bond stretching.

47
Figure 4.3: XPS spectra of (a) GO and F-rGO in wide region; (b) C1s region of
F-rGO; (c) N1s region of F-rGO

48
Figure 4.3 shows further evidence of the chemical composition of the F-rGO by X-ray
photoelectron spectroscopy (XPS), where the peaks correspond to C1s (284 eV), N1s (400
eV), and O1s (531 eV), which agrees with the results reported by the FTIR. The N1s peak
clearly shows the nitrogen atoms as part of the formed triazole ring. The C1s spectra of F-
rGO in Figure 4.3(b) shows four different characteristics of carbon bonds. A broad peak
at 284.7 eV corresponds to sp2 and sp3 C-C carbon of non-oxygenated ring. Moreover,
the C-O of hydroxyl (285.9 eV), C=O of carboxyl group (286.2 eV), and O-C=O (287.1
eV) were also proven (Deetuam et al., 2014). Hence, these XPS data confirms the
attachment of alkyne compound on GO sheets.
Additionally, as shown in Figure 4.3(c), the N1s spectra shows a broad peak centred at
400.2 eV, which confirms the formation of triazole moiety. A well-resolved peak at ~405
eV, corresponding to the free azide group, unambiguously indicates that the azide
compound was covalently attached to the rGO surface via a triazole ring (H.-X. Wang et
al., 2011). We anticipated that click coupling between alkyne functionalized rGO and the
azide compound may not results in a 100 % conversion, since the residue of the azide
group can be detected by the FTIR measurement.
Table 4.2: Atomic concentration of F-rGO
Atomic concentration (%)
C1s N1s O1s
83.38 10.56 6.06

49
XRD analysis of F-rGO antiwear additive
Figure 4.4 and Table 4.3 showed the spectrum of GO observed two peaks at 9.158o
and 26.098o, which corresponds to the planes (001) and (022), respectively (Javed &
Hussain, 2015). The first of this set of peaks shows d-spacing of 9.4367 Å, while the
second shows a value of 3.4100 Å. The presence of these peaks, particularly the first one
is highly suggestive of the formation of GO as they are often regarded as characteristic
peaks of the material (D.-D. Zhang et al., 2009). With regards to all of the functionalized
sample, in general they all are amorphous in nature. This is to be expected when
considering that the presence of functional alkyl groups contribute in the disruption of the
structure of the base material (Marcano et al., 2010).
At a closer look, there is a significant shift in the first peak (~10o) in the F-rGO
compared to GO sample. This can be attributed to the amorphisation of the F-rGO,
indicated by the widening of the peak in functionalized samples. From these observations,
it is therefore highly indicative that functionalization of the alkyl groups between the
layers of the GO sheet had already taken place. Also noted is the decreased intensity of
the functionalized samples which points to the increased exfoliation of GO into singular
or multiple sheets (Cai & Song, 2007).
With regards to their crystallite size, the base material, GO has an average crystallite
size of 5.4 nm, while the functionalized materials are considered amorphous. This is
highly indicative of reduced crystallite size in the functionalized samples, which in turn
provide further proof of the increased disorderliness of the functionalized rGO’s structure
(Zhou et al., 2009). These evidences strengthen the postulation that the functionalization
of rGO was successful.

50
Figure 4.4: XRD spectra of the synthesized GO and F-rGO samples
Table 4.3: Summary of extract from XRD analysis
Sample 2𝜃 Phases d-spacing Crystallite size
(nm)
GO
9.158° 0 0 1 9.43767 8.4
26.098° 0 2 2 3.4100 2.4
Average 5.4
Thermal stability analysis of F-rGO
Figure 4.5 shows the thermal stability of functionalized rGO forms based on their
TGA plots. rGO’s functionalisation does not show significant loss between 50 - 150 oC
due to their hydrophobicity. Only an average of 3 % weight was lost during this period.
There is also a significant drop in the weight loss between 150 - 300 oC due to the
previously mentioned factor, which is attributed to oxygen based functional groups, such
as carbonyl, epoxy, and hydroxyl groups (Choi et al., 2010). These groups are commonly

51
found on the surface of the GO, which makes up for most of the material’s weight
functional groups being bonded to the alkyl functional groups. This moiety decomposes
between 300 - 460 oC. Grafting the alkyl functionalisation group was successfully carried
out for each of the functionalized rGO materials, due to the significantly smaller amount
of decomposition in the temperature range where free surface functional group were
known to decompose (Kou et al., 2010). The stability of F-rGO comes from the nitrogen
group decomposing at ≤ 370 oC, based on Figure 4.5. This functionalized rGO is capable
of withstanding high temperatures before it loses the highly electron rich N-group, which
makes it suitable for applications under 370 °C.
Figure 4.5: TGA and DTG traces of GO and its derivatives

52
Figure 4.5, continued

53
Morphology of F-rGO antiwear additive
Figure 4.6 showed the FESEM of functionalized rGO-C6, rGO-C8, rGO-C10, and
rGO-C12. The fluffy rGO nanosheets agglomerates exhibit a dense structure of curled
graphene stacking sheets (Senatore et al., 2013). The presence of these wrinkles and folds
are more than likely due to the presence of the alkyl functional groups, which distorts the
dense sheet found in the original structure of the GO.
Figure 4.6: FESEM images of (a) GO; (b) F-rGO-C6; (c) F-rGO-C8; (d) F-rGO-
C10; (e) F-rGO-C12

54
Figure 4.6, continued
The presence of the more pronounced layers in the functionalized materials also
corroborate the XRD results which point to the formation of sheets of functionalized
graphene due to exfoliation resulting from the presence of the functional groups. Further
evidenced here is the amorphous nature of the functionalized materials further
corroborating the postulation from XRD results. This further proves that these chain act
as a “spacer” that not only holds two sheets, but distorts it in a way that it folds into itself.
This demonstrates that the modified Hummer’s method is able to create two-dimensional
nanosheets from the exfoliated graphite precursor. The absence of Cu as indicated in the
EDX spectra points to the successful elimination of the catalyst used during this modified
Hummer’s method which provides further evidence to the practicality of the method.

55
Mechanism of lubrication by Functionalized-rGO-Cn
There are many evidence pertaining to the formation of graphene tribofilm when in
contact with surfaces forming the basis for tear and wear reduction. These justifications
only accounted for concentrations of graphene instead of the functionalized group, and it
was argued that graphene is easily agglomerated due to the weak shear strength of the
interlayer sliding plane disorders. These physical evidence guides the graphene- surface
contact throughout its deposition on steel via the micotribometric test. On the contrary
and accounting for the nanometric contacts where the contact stress is higher, it was
argued that graphene could not be deposited. Recent studies attempted to solve this
challenge using 100Cr6 steel ball against 316LN steel based on plastic deformation
assumptions. Plastic deformation releases energy that aid physiosorbtion/chemisorption
of graphene-dispersed molecules. These have been justified with the aid of hydrogen
bonding linkages and participation of π bonds in graphene (Berman et al., 2015; Charlier
et al., 1994; Mungse et al., 2015; A. Rasheed et al., 2016; A. K. Rasheed et al., 2015; L.-
F. Wang et al., 2012; Xia et al., 2016) and the participation of electron-rich nitrogen group
and alkyl chain length. This agrees with the combined effect of the π-electron. Therefore,
increased length of the alkyl chain creates more contact distance between the surface,
while the electron species (Nitrogen group) remain similar in all species.
Figure 4.7: Mechanism of antiwear additive in base oil
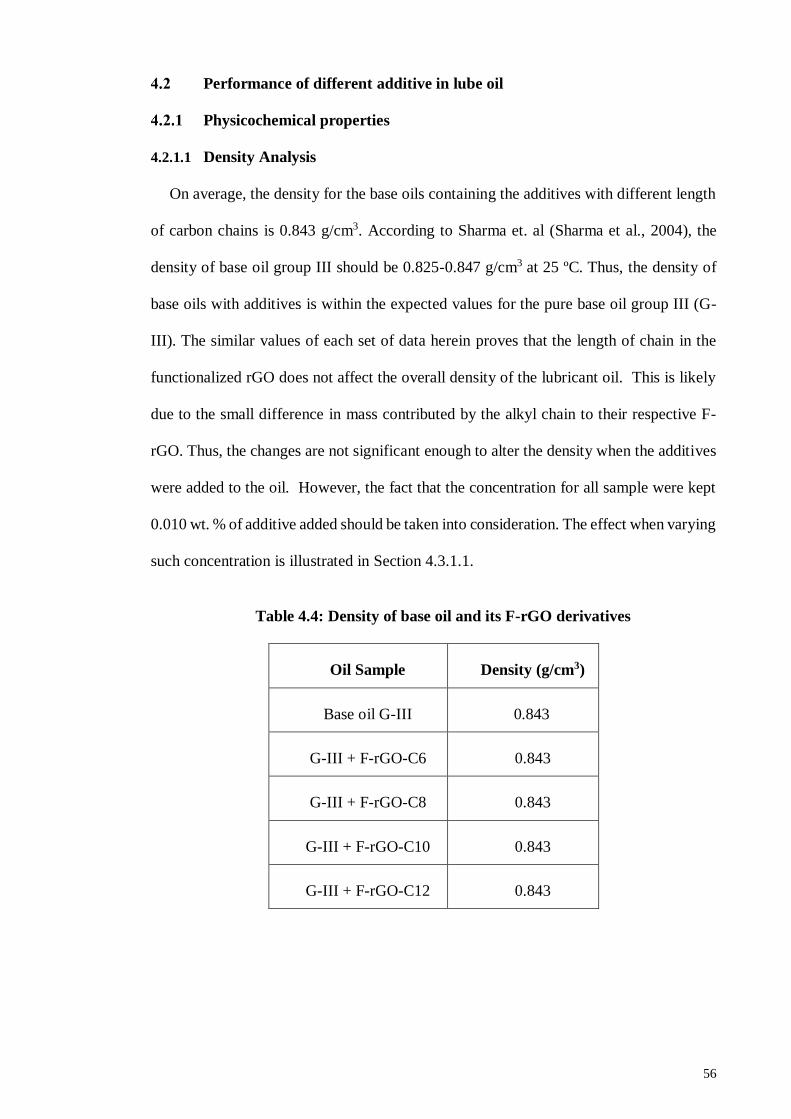
56
Performance of different additive in lube oil
Physicochemical properties
4.2.1.1 Density Analysis
On average, the density for the base oils containing the additives with different length
of carbon chains is 0.843 g/cm3. According to Sharma et. al (Sharma et al., 2004), the
density of base oil group III should be 0.825-0.847 g/cm3 at 25 ºC. Thus, the density of
base oils with additives is within the expected values for the pure base oil group III (G-
III). The similar values of each set of data herein proves that the length of chain in the
functionalized rGO does not affect the overall density of the lubricant oil. This is likely
due to the small difference in mass contributed by the alkyl chain to their respective F-
rGO. Thus, the changes are not significant enough to alter the density when the additives
were added to the oil. However, the fact that the concentration for all sample were kept
0.010 wt. % of additive added should be taken into consideration. The effect when varying
such concentration is illustrated in Section 4.3.1.1.
Table 4.4: Density of base oil and its F-rGO derivatives
Oil Sample Density (g/cm3)
Base oil G-III 0.843
G-III + F-rGO-C6 0.843
G-III + F-rGO-C8 0.843
G-III + F-rGO-C10 0.843
G-III + F-rGO-C12 0.843
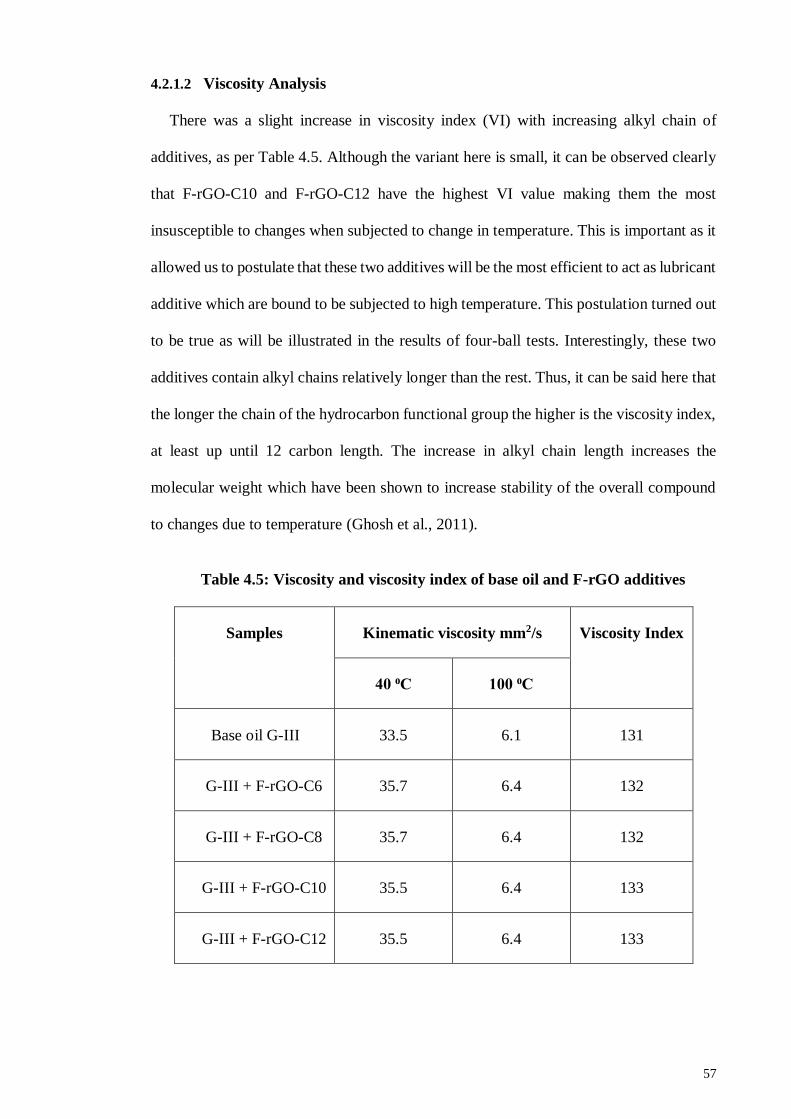
57
4.2.1.2 Viscosity Analysis
There was a slight increase in viscosity index (VI) with increasing alkyl chain of
additives, as per Table 4.5. Although the variant here is small, it can be observed clearly
that F-rGO-C10 and F-rGO-C12 have the highest VI value making them the most
insusceptible to changes when subjected to change in temperature. This is important as it
allowed us to postulate that these two additives will be the most efficient to act as lubricant
additive which are bound to be subjected to high temperature. This postulation turned out
to be true as will be illustrated in the results of four-ball tests. Interestingly, these two
additives contain alkyl chains relatively longer than the rest. Thus, it can be said here that
the longer the chain of the hydrocarbon functional group the higher is the viscosity index,
at least up until 12 carbon length. The increase in alkyl chain length increases the
molecular weight which have been shown to increase stability of the overall compound
to changes due to temperature (Ghosh et al., 2011).
Table 4.5: Viscosity and viscosity index of base oil and F-rGO additives
Samples Kinematic viscosity mm2/s Viscosity Index
40 ⁰C 100 ⁰C
Base oil G-III 33.5 6.1 131
G-III + F-rGO-C6 35.7 6.4 132
G-III + F-rGO-C8 35.7 6.4 132
G-III + F-rGO-C10 35.5 6.4 133
G-III + F-rGO-C12 35.5 6.4 133

58
4.2.1.3 Total acid number Analysis
The data pertaining to the TAN shown in Table 4.6 show that the pure base oil and
functionalized additives reported similar acid value and good results as the TAN is less
than 0.10. The data also illustrates the difference in acid value pre- and post- four ball test
in which all sample showed increase in the value. However, it must be noted that F-rGO-
C10 and F-rGO-C12 showed smaller increase in acid number compared to the others.
This is largely due to the increasing carbon chain portion of the additive, which also
happens to be less susceptible to oxidation compared to the carboxyl groups present in
the additive. Hence, the overall susceptibility of these two additives are lowered
compared to the others due to their larger portion of oxidatively stable alkyl chain present.
This confirms that there was less acidic contaminations and oxidation of the additives.
Table 4.6: Value of total acid number of base oil and F-rGO additives
Samples TAN (mg KOH/g)
Before four-ball test After four-ball test
Base oil G-III 0.07 0.11
G-III + F-rGO-C6 0.07 0.11
G-III + F-rGO-C8 0.07 0.10
G-III + F-rGO-C10 0.06 0.08
G-III + F-rGO-C12 0.06 0.08

59
Tribological study
4.2.2.1 Friction coefficient
A series of four-ball tests using base oil group III were carried out to study the
influence of base oil on the friction performance of F-rGO additives. In this case, Figure
4.8 shows the performance results of the functionalized rGO (C6, C8, C10 and C12)
material via the four-ball test analysis. F-rGO-C10 has shown superior and significant
reduction of friction from the profile of its coefficient of friction (CoF) with time against
others for 3600 seconds of operation. The observation therein suggests and confirms
ample stability for F-rGO-C10 in terms of thermal stresses. Unfortunately, materials F-
rGO-C6, F-rGO-C8, and F-rGO-C12 struggle to maintain stability within the operating
interval of time in reducing the friction. As shown in the region marked A (0 – 750 s), F-
rGO-C10 distinctly reveal reduced CoF against F-rGO-C6, F-rGO-C8 and F-rGO-C12
whose CoF falls within same limit. The attribute of F-rGO-C12 for reduced CoF falls
severely within 750 – 1800 s at region marked B while F-rGO-C6 and F-rGO-C8 displays
no significant activity in reduced CoF. Under these auspices, F-rGO-C10 maintains
superiority attribute of stability in the reduced CoF. Surprisingly, at around 1800 – 3250
s of operation, F-rGO-C6, F-rGO-C8 and F-rGO-C12 display similar observable activity
in reducing CoF less than F-rGO-C10 which still maintain its superior attribute of reduced
CoF. However, within 3250 - 3600 s of operation, F-rGO- C10 still maintain appreciable
and high stability for reduced CoF while F-rGO-C8 and F-rGO-C12 display no
observable activity and F-rGO-C6 reveal a slight increase in CoF.

60
Figure 4.8: Coefficient of friction of base oil and its functionalized additives
In terms of F-rGO-C6, the coefficient of friction increases by 0.39 % compared to the
base oil without additives. However, the coefficient of friction of F-rGO-C8 and F-rGO-
C12 started to decrease, at 6 %. Interestingly, F-rGO-C10 shows a very large decrease in
the coefficient of friction, at 36 %, which is a large leap compared to the other F-rGO
samples.
4.2.2.2 Wear Scar Analysis
Similar trend can be observed in the value of specific wear rate of the same set of
samples presented in Table 4.7 and Figure 4.9. Three sets for each sample were weighed
before and after the four-ball test, and the values averaged. The weight losses were
recorded as well.

61
Table 4.7: Specific wear rate of base oil and its formulated lubricant oil
Oil Sample Initial steel ball
weight (g)
Final steel ball
weight (g)
Weight loss (g)
Base oil G-III 8.3570 8.3534 0.0036
G-III + FG-C6 8.3572 8.3544 0.0028
G-III + FG-C8 8.3585 8.3567 0.0018
G-III + FG-C10 8.3585 8.3573 0.0012
G-III + FG-C12 8.3580 8.3565 0.0015
G-III FG-C6 FG-C8 FG-C10 FG-C120
2
4
6
8
10
3.824
3.059
4.589
7.138
Sp
ec
ific
we
ar
rate
x (
10-6
)(m
2/N
)
Type of addives
9.178
Figure 4.9: Specific wear rate of base oil and its formulated lubricant oil

62
It should be noted that F-rGO-C6, F-rGO-C8 and F-rGO-C10 shows similar limits.
This trend can be justified by the previously mentioned trend in the degree of disorder
and stretching of the bonds in the material, which decreases as the length of chain
increases. This is however not applicable to F-rGO-C12, where the effect of the chain
length outweighs the effect of this trend.
Four-ball tests were also performed to analyse the lubricating capabilities of the F-
rGOs, which is represented by the wear of the rotating and stationary balls. To give a
better picture of the wear on the balls’ surfaces, the post-analysis surfaces of each steel
ball was observed under SEM and the wear scar diameter (WSD) for each sample was
then measured. A stable value of the friction coefficient with low variance was
established through these experiments, with the value being in excellent agreement with
the WSD values, as shown in Figure 4.10 and Table 4.8. All of the formulated samples
decreased as the length of alkyl chain increases. However, F-rGO-C10 shows a large
reduction on ball wear scar diameter data of 24 % compared to the other functionalized
samples. The measurement of the wear scar diameters was obtained from the
measurement of the following two diameters: the diameter along the direction of friction
and the one perpendicular to the first one. This is in accordance to the standard (ISO,
2004) approved method.

63
G-III FG-C6 FG-C8 FG-C10 FG-C12
500
550
600
650
700
750
Wea
r S
ca
r D
iam
ete
r,
m
Type of additives
713700
655
540
611
Figure 4.10: Wear scar diameter of base oil without and with additives
This can be attributed to the degree of disorder and stretching of the bonds in the F-
rGO, which decreases as the length of chain increases. This is however not applicable to
F-rGO-C12, where the effect of the chain length outweighs the effect of this trend. With
the higher degree of order as the chain grows, the folding of the structure, as observed in
the FESEM, facilitates the lowering of frictional force between the surfaces of the steel
balls. This is largely due to the F-rGO in oil forming protective deposited films throughout
the alkyl chains. Thus, preventing the rubbing surfaces from coming into direct contact
improves the tribological behaviour of the oil. It should be pointed out that the prominent
effect of the alkyl chains facilitates the formation of strong folded structures, which in
turn lowers the coefficient of friction. However, there is a limit to this effect, as
demonstrated by the increase in frictional force when the chain contains 12 carbon atoms.

64
Table 4.8: SEM images of wear scar diameter (WSD)
Sample Wear scar diameter (µm) Difference
Base Oil G-III
713
Benchmark
F-rGO-C6
700
-1.8 %
F-rGO-C8
655
-8.1 %
F-rGO-C10
540
-24.3 %
F-rGO-C12
611
-14.3 %

65
All of the formulated samples decreased as the length of alkyl chain increases.
However, F-rGO-C12 shows a large reduction on ball wear scar diameter data of up to
24 % compared to other functionalized samples. The results proved that functionalized
rGO in oil form protective deposited films to prevent the rubbing surfaces from coming
into direct contact, which improves the tribological behaviour of the oil for F-rGO-C10.
Performance of optimised additive with different concentration in lube oil
Physicochemical properties
4.3.1.1 Density Analysis
Table 4.9 shows the result for effect of the additive F-rGO-C10 with different
concentration on the density of the oil blended at a particular temperature. The table
showed that the higher the concentration of the F-rGO-C10 in the oil blend, the higher
the density of oil. The test temperature for the density is 25 ºC, and the ASTM
specification for the density of base oil group III falls within the range of 0.825 - 0.847
g/cm3. The results reported in Table 4.9 conforms to this range. According to Eddy and
Ekop, the average molecular weight of the oil could be tailored to the density of the oil.
Therefore, the introduction of additives to the base oil can alter its molecular weight. The
differential increase in the concentration of additive in the oil brought about different
densities of pure base oil (Eddy & Ekop, 2007). This a significant change compared to
the similar values when only the carbon chain lengths were varied. This is largely due to
the higher number of particles present which accounts for the larger number of matter
present in the oil. Hence, it can be said here that altering the functional group will not
significantly change the density of lubricant formed as compared to the changing the
concentration of additive. When the concentration of additive is kept between 0.005 to
0.05 g/cm3 the density of the resultant lubricant oil will lie within the specified ASTM
value.

66
Table 4.9: Density analysis of formulated lubricant oil
Oil Sample Density (g/cm3)
Base Oil G-III 0.843
G-III + 0.005 wt.% 0.842
G-III + 0.01 wt.% 0.843
G-III + 0.025 wt.% 0.844
G-III + 0.05 wt.% 0.845
4.3.1.2 Viscosity Analysis
As observed from Table 4.10 and Figure 4.11, both viscosity and viscosity index
increased with increased concentrations of additives (Kole & Dey, 2011; Kulkarni et al.,
2006; Prasher et al., 2006). The increase in the concentration of nanoparticles increases
the internal shear stress of the lubricant and the viscosity.
Table 4.10: Viscosity of formulated lubricant oil
Samples Kinematic viscosity mm2/s
40 ⁰C 100 ⁰C
Base Oil G-III 33.3 6.1
G-III + 0.005 wt.% 35.3 6.5
G-III + 0.01 wt.% 36.5 6.7
G-III + 0.025 wt.% 37.9 7.0
G-III + 0.05 wt.% 39.1 7.3

67
Figure 4.11: VI of base oil and F-rGO-C10 additives with different concentration
The weakening of inter-particle and inter molecular adhesion forces are the driving
forces behind this observation (Kulkarni et al., 2006). This is also attributed to the
previously mentioned effect of increasing molecular weight which lead to higher stability
towards temperature (Ghosh et al., 2011). The viscosity and viscosity index of the F-rGO-
C10 with 0.050 wt. % nanoparticles based lubricant were found to be higher than pure
base oil and other functionalized additives. Thus, 0.050 wt. % of F-rGO-C10 would have
a better film forming tendency at higher temperatures compared to 0.005, 0.010 and 0.025
wt. %.
4.3.1.3 Total acid number Analysis
The data of the TAN are shown in Table 4.11. The data showed that the pure base oil
has no resistance to oxidation, but increasing the concentration of additives pass 0.010
wt. % resulted in increase of the total acid numbers. Interaction of the carbon component
of the additive and oxygen from surrounding lead to formation of carbonyl compounds
which further oxidises especially in the presence of heat to form carboxylic acids (Fox et
al., 1991). This chain of event lead to the observed increase in the total acid number of

68
the base oil. From the data in the table, it can be observed that past 0.010 wt. % of additive
added lead to significant increase to TAN, higher even than the base oil without any
additive added to it. At elevated temperature, the effect of this phenomenon is much more
prominent such that the formed carbonyl and carboxylic containing compounds may
polymerize leading to sludge being precipitated, thus increasing the wear (Fox et al.,
1991). Therefore, it is paramount to use 0.010 wt. % of additive as the threshold for the
amount to be added to the base oil to increase its lubricant properties without having
detrimental effect on the base oil, in this case increasing its corrosive property.
Table 4.11: TAN of base oil without additive and with different concentration of
additives
Samples TAN (mg KOH/g)
Before four-ball
test
After four-ball
test
Base oil G-III 0.07 0.11
G-III + 0.005 wt.% 0.07 0.12
G-III + 0.010 wt.% 0.06 0.08
G-III + 0.025 wt.% 0.12 0.25
G-III + 0.050 wt.% 0.32 0.48

69
Tribological study
4.3.2.1 Friction coefficient
F-rGO-C10 was selected as the best additive. As observed from Figure 4.12, the
coefficient of friction at different concentrations of F-rGO-C10 decreases as the
concentration decreases. The trend follows in the order 0.050 wt. % and 0.025 wt. %,
while 0.005 wt. % shows a slightly higher coefficient of friction than 0.010 wt. %. This
observation is very much due to the increment of particle in the oil present as the
concentration increases. As pointed out previously this increment lead to increasing
density, viscosity and acid number. The latter value in particular lead to corrosion in
between the surfaces, a phenomenon which is even more prominent at higher
temperatures. Thus 0.010 wt. % of additive is the threshold after which the coefficient
will increase due to prominent decrease in the efficiency of the lubricant.
Figure 4.12: Comparison of CoF with different concentration of F-rGO-C10

70
4.3.2.2 Wear Scar Analysis
Table 4.12 shows the value of specific wear rates of the same set of F-rGO-C10 at
different concentrations. There is a steady drop in the specific wear rate value of up to 67
% (0.010 wt. %). Although there are only 36 % and 6 % drop in the value for 0.005 wt.
% and 0.025 wt. %, these values are still considerably low when compared to pure oil.
These observations corroborate the observations on the increasing coefficient of friction
and further lend support to the postulation that 0.010 wt. % is the threshold value for the
efficiency of the lubrication.
Table 4.12: Specific wear rate of F-rGO-C10 with different concentration
Additive
concentration (wt. %)
Initial steel
ball weight (g)
Final steel ball
weight (g)
Weight loss
(g)
Base Oil G-III 8.3570 8.3534 0.0036
0.005 8.3578 8.3555 0.0023
0.010 8.3585 8.3573 0.0012
0.025 8.3602 8.3568 0.0034
0.050 8.3624 8.3585 0.0039
The results for both friction and wear analysis this time around indicates that
approximately 0.010 wt. % of additives yield the best lubrication effect. This is very much
due to overall better characteristic of the lubricant oil yielded from this particular
concentration specifically its density, viscosity and acid number. The density and
viscosity of the oil allows for proper lubrication boundary between the steel surfaces
while the stability of the oil towards oxidation prevents corrosion due to acidity to take
place on the surfaces involved.

71
Figure 4.13: Specific wear rate of lubricant oil with different additive
concentration

72
CHAPTER 5: CONCLUSION AND RECOMMENDATION
5.1 Conclusion
This study was successful in synthesizing F-rGO, which was then applied as an
additive in base oil. Table 5.1 below is a summary of the advancement in tribological
field as a result of this research in terms of the tribological properties and its applicability
in the field.
Table 5.1: Comparison of recent solid additives with present research on their
tribological properties
Solid
additive
Concentration
of additive
(wt. %)
Liquid
base
Wear
reduction
(%)
CoF
reduction
(%)
Reference
MWCNTs 0.10 PAO 16 14 (Y. Peng et
al., 2007)
MoS2 0.5 Liquid
Paraffin
7 54 (Hu et al.,
2009)
GO 0.10 SN 150 30 16 (Senatore et
al., 2013)
h-BN 1.0 water 7 15 (Cho et al.,
2013)
F-rGO 0.01 Base oil G-
III
24 36 In this work
The following can be concluded from the present work:
• The antiwear properties of base oils were enhanced by using synthesized
functionalized rGO.
• There was a reduction in both the coefficient of friction (36 %) and wear (24 %)
in the case of 0.01 wt. % F-rGO-C10 compared with the base oil and other F-
rGOs.

73
• The coefficient of friction in the case of 0.010 wt. % additive was lesser than
pure base oil and base oil containing 0.005 wt. %, 0.025 wt. %, and 0.050 wt.
%.
• The viscosity index increased as concentrations of additives increase. 0.050 wt.
% of F-rGO-C10 reported higher viscosity index compared to 0.025 wt. %,
0.010 wt. %, and 0.005 wt. %.
• In comparison with base oil, all synthesized additive showed better TAN, as the
TAN value is less than 0.01 mg KOH/g.
• Mechanisms such as rolling, mending, and protective layer formation of
nanoparticles between the mating surfaces could be responsible for reducing the
specific wear rate and CoF.
• As observed from the SEM images, the WSD of steel ball surfaces were
decreasing with increasing alkyl functionality compared to mineral oil.
• As observed from this work, a minimum of 0.010 wt. % F-rGO-C10 were
required to enhance the antiwear properties of the lubricant.

74
5.2 Recommendations for future work
This research could be extended into many practical applications of functionalized
reduced graphene oxide in tribological industries:
• Feasibility study on different temperature and different load to study the
extreme pressure additive used under heavier loads at high temperatures.
• Formulate lubricants with various concentration of additives to study the
optimisation of lube oil.
• Formulate the lubricant with different types of base oil to study the
compatibility of functionalized rGO with different base oil.
• Other types of mechanical characterisation for tribology, such as High
Frequency Reciprocating Rig (HFRR), ball-on-disc, and pin-on-disc can be
carried out to elucidate the performance of the additive.
• Study on separating the lubricant oil from the additives to improve the
reusability of the oil. The separation can be done via single or composite solvent
extraction and acid treatment.

75
REFERENCES
Ahlquist, M., & Fokin, V. V. (2007). Enhanced reactivity of dinuclear copper (I)
acetylides in dipolar cycloadditions. Organometallics, 26(18), 4389-4391.
ASTM, A. (2013). Standard Terminology Relating to Wear and Erosion. G40.
Bautista, C., & Mendoza, D. (2011). Multilayer graphene synthesized by CVD using
liquid hexane as the carbon precursor. arXiv preprint arXiv:1109.1318.
Berman, D., Erdemir, A., & Sumant, A. V. (2013). Few layer graphene to reduce wear
and friction on sliding steel surfaces. Carbon, 54, 454-459.
Berman, D., Erdemir, A., & Sumant, A. V. (2014). Graphene: a new emerging lubricant.
Materials Today, 17(1), 31-42.
Berman, D., Erdemir, A., Zinovev, A. V., & Sumant, A. V. (2015). Nanoscale friction
properties of graphene and graphene oxide. Diamond and Related Materials, 54,
91-96.
Bock, V. D., Hiemstra, H., & Van Maarseveen, J. H. (2006). CuI‐Catalyzed Alkyne–
Azide “Click” Cycloadditions from a Mechanistic and Synthetic Perspective.
European Journal of Organic Chemistry, 2006(1), 51-68.
Boshui, C., Junxiu, D., & Guoxu, C. (1996). Tribochemistry of gadolinium
dialkyldithiophosphate. Wear, 196(1-2), 16-20.
Brodie, B. C. (1859). On the atomic weight of graphite. Philosophical Transactions of
the Royal Society of London, 149, 249-259.
Bruker. (2016). D8 ADVANCE. Retrieved 17 February, 2017, from
https://www.bruker.com/products/x-ray-diffraction-and-elemental-analysis/x-
ray-diffraction/d8-advance/overview.html
Cai, D., & Song, M. (2007). Preparation of fully exfoliated graphite oxide nanoplatelets
in organic solvents. Journal of Materials Chemistry, 17(35), 3678-3680.
Carotenuto, G., Longo, A., Nicolais, L., De Nicola, S., Pugliese, E., Ciofini, M., Locatelli,
M., Lapucci, A., & Meucci, R. (2015). Laser-Induced Thermal Expansion of
H2SO4-Intercalated Graphite Lattice. The Journal of Physical Chemistry C,
119(28), 15942-15947.
Charlier, J.-C., Gonze, X., & Michenaud, J.-P. (1994). First-principles study of the
stacking effect on the electronic properties of graphite (s). Carbon, 32(2), 289-
299.
Chen, W., Yan, L., & Bangal, P. R. (2010). Preparation of graphene by the rapid and mild
thermal reduction of graphene oxide induced by microwaves. Carbon, 48(4),
1146-1152.

76
Cho, D.-H., Kim, J.-S., Kwon, S.-H., Lee, C., & Lee, Y.-Z. (2013). Evaluation of
hexagonal boron nitride nano-sheets as a lubricant additive in water. Wear,
302(1), 981-986.
Choi, E.-Y., Han, T. H., Hong, J., Kim, J. E., Lee, S. H., Kim, H. W., & Kim, S. O. (2010).
Noncovalent functionalization of graphene with end-functional polymers. Journal
of Materials Chemistry, 20(10), 1907-1912.
Deetuam, C., Samthong, C., Thongyai, S., Praserthdam, P., & Somwangthanaroj, A.
(2014). Synthesis of well dispersed graphene in conjugated poly (3, 4-
ethylenedioxythiophene): polystyrene sulfonate via click chemistry. Composites
Science and Technology, 93, 1-8.
Eddy, N., & Ekop, A. (2007). Effect of additives on some physical parameters of palm
oil. Journal of Chemistry, 4(3), 350-353.
Elmer, P. (2017). Spotlight 400 FT-IR Imaging System. Retrieved 17 February, 2017,
from
http://www.perkinelmer.com/searchresult?searchName=ftir&_csrf=fe347778-
c5f3-41dc-b2a5-7626cdafeca1
Espinosa, T., Sanes, J., & Bermúdez, M.-D. (2016). New Alkylether–Thiazolium Room-
Temperature Ionic Liquid Lubricants: Surface Interactions and Tribological
Performance. ACS Applied Materials & Interfaces, 8(28), 18631-18639. doi:
10.1021/acsami.6b05888
Fajardo, O. Y., Bresme, F., Kornyshev, A. A., & Urbakh, M. (2015). Electrotunable
Friction with Ionic Liquid Lubricants: How Important Is the Molecular Structure
of the Ions? The Journal of Physical Chemistry Letters, 6(20), 3998-4004. doi:
10.1021/acs.jpclett.5b01802
Fox, M., Pawlak, Z., & Picken, D. (1991). Acid-base determination of lubricating oils.
Tribology International, 24(6), 335-340.
Franc, G., & Kakkar, A. (2008). Dendrimer design using Cu I-catalyzed alkyne–azide
“click-chemistry”. Chemical Communications(42), 5267-5276.
Georgakilas, V., Otyepka, M., Bourlinos, A. B., Chandra, V., Kim, N., Kemp, K. C.,
Hobza, P., Zboril, R., & Kim, K. S. (2012). Functionalization of graphene:
covalent and non-covalent approaches, derivatives and applications. Chemical
reviews, 112(11), 6156-6214.
Ghosh, P., Das, T., & Nandi, D. (2011). Shear stability and thickening properties of homo
and copolymer of methyl methacrylate. American Journal of Polymer Science,
1(1), 1-5.
Godfrey, D. (1965). The lubrication mechanism of tricresyl phosphate on steel. ASLE
TRANSACTIONS, 8(1), 1-11.
Golas, P. L., & Matyjaszewski, K. (2010). Marrying click chemistry with polymerization:
expanding the scope of polymeric materials. Chemical Society Reviews, 39(4),
1338-1354.

77
Han, N. R., & Cho, J. W. (2016). Click coupled stitched graphene sheets and their
polymer nanocomposites with enhanced photothermal and mechanical properties.
Composites Part A: Applied Science and Manufacturing, 87, 78-85.
Handbook, A., & Friction, L. (1992). Wear Technology, vol. 18. ASM International, USA,
1482.
Hein, J. E., & Fokin, V. V. (2010). Copper-catalyzed azide–alkyne cycloaddition
(CuAAC) and beyond: new reactivity of copper (I) acetylides. Chemical Society
Reviews, 39(4), 1302-1315.
Himo, F., Lovell, T., Hilgraf, R., Rostovtsev, V. V., Noodleman, L., Sharpless, K. B., &
Fokin, V. V. (2005). Copper (I)-catalyzed synthesis of azoles. DFT study predicts
unprecedented reactivity and intermediates. Journal of the American Chemical
Society, 127(1), 210-216.
Hu, K., Liu, M., Wang, Q., Xu, Y., Schraube, S., & Hu, X. (2009). Tribological properties
of molybdenum disulfide nanosheets by monolayer restacking process as additive
in liquid paraffin. Tribology International, 42(1), 33-39.
Huang, H., Tu, J., Zou, T., Zhang, L., & He, D. (2005). Friction and wear properties of
IF–MoS2 as additive in paraffin oil. Tribology letters, 20(3-4), 247-250.
Huisgen, R. (1963). 1, 3‐dipolar cycloadditions. Past and future. Angewandte Chemie
International Edition in English, 2(10), 565-598.
Hummers Jr, W. S., & Offeman, R. E. (1958). Preparation of graphitic oxide. Journal of
the American Chemical Society, 80(6), 1339-1339.
Iha, R. K., Wooley, K. L., Nystrom, A. M., Burke, D. J., Kade, M. J., & Hawker, C. J.
(2009). Applications of orthogonal “click” chemistries in the synthesis of
functional soft materials. Chemical reviews, 109(11), 5620-5686.
Instruments, D. (2017). Four Ball Tester. Retrieved 17 February, 2017, from
http://ducom.com/test-instruments/lubricant-testers/four-ball-tester/
ISO, S. (2004). 20623: 2004: Petroleum and related products-Determination of the
extreme-pressure and anti-wear properties of fluids—Four ball method: European
conditions)(20623: 2003).
Jang, J., Pham, V. H., Hur, S. H., & Chung, J. S. (2014). Dispersibility of reduced
alkylamine-functionalized graphene oxides in organic solvents. Journal of colloid
and interface science, 424, 62-66.
Javed, S. I., & Hussain, Z. (2015). Covalently Functionalized Graphene Oxide–
Characterization and Its Electrochemical Performance. International Journal of
Electrochemical Science, 10, 9475-9487.
Javidialesaadi, A., & Raeissi, S. (2013). Biodiesel production from high free fatty acid-
content oils: experimental investigation of the pretreatment step. APCBEE
Procedia, 5, 474-478.

78
Jianqiang, H., Huanqin, Z., Li, W., Xianyong, W., Feng, J., & Zhiming, Z. (2005). Study
on tribological properties and action mechanism of organic cadmium compound
in lubricants. Wear, 259(1), 519-523.
Kasrai, M., Cutler, J., Gore, K., Canning, G., Bancroft, G., & Tan, K. (1998). The
chemistry of antiwear films generated by the combination of ZDDP and MoDTC
examined by X-ray absorption spectroscopy. Tribology transactions, 41(1), 69-
77.
Kato, K. (1992). Micro-mechanisms of wear—wear modes. Wear, 153(1), 277-295.
Khruschov, M. (1974). Principles of abrasive wear. Wear, 28(1), 69-88.
Kimura, Y., Wakabayashi, T., Okada, K., Wada, T., & Nishikawa, H. (1999). Boron
nitride as a lubricant additive. Wear, 232(2), 199-206.
Kolb, H. C., Finn, M., & Sharpless, K. B. (2001). Click chemistry: diverse chemical
function from a few good reactions. Angewandte Chemie International Edition,
40(11), 2004-2021.
Kole, M., & Dey, T. (2011). Effect of aggregation on the viscosity of copper oxide–gear
oil nanofluids. International Journal of Thermal Sciences, 50(9), 1741-1747.
Kou, L., He, H., & Gao, C. (2010). Click chemistry approach to functionalize two-
dimensional macromolecules of graphene oxide nanosheets. Nano-Micro Letters,
2(3), 177-183.
Kulkarni, D. P., Das, D. K., & Chukwu, G. A. (2006). Temperature dependent rheological
property of copper oxide nanoparticles suspension (nanofluid). Journal of
nanoscience and nanotechnology, 6(4), 1150-1154.
Li, J., Peng, Q., Bai, G., & Jiang, W. (2005). Carbon scrolls produced by high energy ball
milling of graphite. Carbon, 43(13), 2830-2833.
Liang, L., & Astruc, D. (2011). The copper (I)-catalyzed alkyne-azide cycloaddition
(CuAAC)“click” reaction and its applications. An overview. Coordination
Chemistry Reviews, 255(23), 2933-2945.
Lin, J., Wang, L., & Chen, G. (2011). Modification of graphene platelets and their
tribological properties as a lubricant additive. Tribology Letters, 41(1), 209-215.
Lu, R., Kobayashi, K., Nanao, H., & Mori, S. (2009). Deactivation effect of tricresyl
phosphate (TCP) on tribochemical decomposition of hydrocarbon oil on a nascent
steel surface. Tribology letters, 33(1), 1-8.
Lutz, J.-F., & Börner, H. G. (2008). Modern trends in polymer bioconjugates design.
Progress in Polymer Science, 33(1), 1-39.
Lutz, J.-F., & Zarafshani, Z. (2008). Efficient construction of therapeutics, bioconjugates,
biomaterials and bioactive surfaces using azide–alkyne “click” chemistry.
Advanced drug delivery reviews, 60(9), 958-970.

79
Mansfeld, U., Pietsch, C., Hoogenboom, R., Becer, C. R., & Schubert, U. S. (2010).
Clickable initiators, monomers and polymers in controlled radical
polymerizations–a prospective combination in polymer science. Polymer
Chemistry, 1(10), 1560-1598.
Marcano, D. C., Kosynkin, D. V., Berlin, J. M., Sinitskii, A., Sun, Z., Slesarev, A.,
Alemany, L. B., Lu, W., & Tour, J. M. (2010). Improved synthesis of graphene
oxide. ACS nano, 4(8), 4806-4814.
Marques, P., Sousa, A., Gonçalves, G., Grácio, J., Singh, M., Almeida, N., & Cruz, S.
(2011). Functionalized graphene nanocomposites: INTECH Open Access
Publisher.
Meldal, M., & Tornøe, C. W. (2008). Cu-catalyzed azide− alkyne cycloaddition.
Chemical reviews, 108(8), 2952-3015.
Metrohm. (2017). Titration. Retrieved 15 February, 2017, from
https://www.metrohm.com/en/products/titration/?gclid=Cj0KEQiAuJXFBRDirI
GnpZLE-N4BEiQAqV0KGgED42lj-9RzxtfDc0wleuT-
g_84se1yD36pR_EsIZIaAoNn8P8HAQ
Mullen, D. G., McNerny, D. Q., Desai, A., Cheng, X.-m., DiMaggio, S. C., Kotlyar, A.,
Zhong, Y., Qin, S., Kelly, C. V., & Thomas, T. P. (2011). Design, synthesis, and
biological functionality of a dendrimer-based modular drug delivery platform.
Bioconjugate chemistry, 22(4), 679-689.
Mungse, H. P., Kumar, N., & Khatri, O. P. (2015). Synthesis, dispersion and lubrication
potential of basal plane functionalized alkylated graphene nanosheets. RSC
Advances, 5(32), 25565-25571.
Nia, A. S., Rana, S., Döhler, D., Noirfalise, X., Belfiore, A., & Binder, W. H. (2014).
Click chemistry promoted by graphene supported copper nanomaterials.
Chemical Communications, 50(97), 15374-15377.
Novoselov, K., & Geim, A. (2007). The rise of graphene. Nature Materials, 6, 183-191.
Paar, A. (2017). Stabinger Viscometer™ Series. Retrieved 16 January, 2017, from
http://www.anton-paar.com/corp-en/products/details/svmTM-series/
Pan, Y., Bao, H., Sahoo, N. G., Wu, T., & Li, L. (2011). Water‐soluble poly (N‐
isopropylacrylamide)–graphene sheets synthesized via click chemistry for drug
delivery. Advanced Functional Materials, 21(14), 2754-2763.
Peng, D., Kang, Y., Hwang, R., Shyr, S., & Chang, Y. (2009). Tribological properties of
diamond and SiO 2 nanoparticles added in paraffin. Tribology International,
42(6), 911-917.
Peng, Y., Hu, Y., & Wang, H. (2007). Tribological behaviors of surfactant-functionalized
carbon nanotubes as lubricant additive in water. Tribology Letters, 25(3), 247-
253.

80
Prasher, R., Phelan, P. E., & Bhattacharya, P. (2006). Effect of aggregation kinetics on
the thermal conductivity of nanoscale colloidal solutions (nanofluid). Nano
letters, 6(7), 1529-1534.
Rabinowicz, E. (1965). Friction and wear of materials.
Raghunanan, L., & Narine, S. S. (2016a). Engineering Green Lubricants I: Optimizing
Thermal and Flow Properties of Linear Diesters Derived from Vegetable Oils.
ACS Sustainable Chemistry & Engineering, 4(3), 686-692. doi:
10.1021/acssuschemeng.5b01644
Raghunanan, L., & Narine, S. S. (2016b). Engineering Green Lubricants II: Thermal
Transition and Flow Properties of Vegetable Oil-Derived Diesters. ACS
Sustainable Chemistry & Engineering, 4(3), 693-700. doi:
10.1021/acssuschemeng.5b01708
Raghunanan, L., & Narine, S. S. (2016c). Engineering Green Lubricants IV: Influence of
Structure on the Thermal Behavior of Linear and Branched Aliphatic Fatty Acid-
Derived Diesters. ACS Sustainable Chemistry & Engineering, 4(9), 4868-4874.
doi: 10.1021/acssuschemeng.6b01144
Ramasamy, M. S., Mahapatra, S. S., & Cho, J. W. (2015). Functionalization of graphene
with self-doped conducting polypyrrole by click coupling. Journal of colloid and
interface science, 455, 63-70.
Rasheed, A., Khalid, M., Rashmi, W., Gupta, T., & Chan, A. (2016). Graphene based
nanofluids and nanolubricants–Review of recent developments. Renewable and
Sustainable Energy Reviews, 63, 346-362.
Rasheed, A. K., Khalid, M., Walvekar, R., Gupta, T. C. S. M., & Chan, A. (2015). Study
of graphene nanolubricant using thermogravimetric analysis. Journal of Materials
Research, 1-8.
Renishaw. (2017). inVia™ confocal Raman microscope. Retrieved 16 January, 2017,
from http://www.renishaw.com/en/invia-confocal-raman-microscope--6260
Rodionov, V. O., Presolski, S. I., Díaz Díaz, D., Fokin, V. V., & Finn, M. (2007). Ligand-
accelerated Cu-catalyzed azide− alkyne cycloaddition: A mechanistic report.
Journal of the American Chemical Society, 129(42), 12705-12712.
Rostovtsev, V. V., Green, L. G., Fokin, V. V., & Sharpless, K. B. (2002). A stepwise
huisgen cycloaddition process: copper (I)‐catalyzed regioselective “ligation” of
azides and terminal alkynes. Angewandte Chemie, 114(14), 2708-2711.
Rudnick, L. R. (2009). Lubricant additives: chemistry and applications: CRC press.
Sakamoto, T., Uetz, H., & Föhl, J. (1985). Reaction layer formation on bronze with an
SP extreme pressure additive in boundary lubrication under increasing load: I.
Wear, 105(4), 307-321.

81
Salvio, R., Krabbenborg, S., Naber, W. J., Velders, A. H., Reinhoudt, D. N., & van der
Wiel, W. G. (2009). The Formation of Large‐Area Conducting Graphene‐Like
Platelets. Chemistry–A European Journal, 15(33), 8235-8240.
Scientific, T. F. (2016). Scanning Electron Microscope. Retrieved 28 December, 2016,
from https://www.fei.com/products/sem/quanta-sem/
Senatore, A., D'Agostino, V., Petrone, V., Ciambelli, P., & Sarno, M. (2013). Graphene
Oxide Nanosheets as Effective Friction Modifier for Oil Lubricant: Materials,
Methods, and Tribological Results. ISRN Tribology, 2013.
Shankara, A., Menezes, P. L., Simha, K., & Kailas, S. V. (2008). Study of solid
lubrication with MoS2 coating in the presence of additives using reciprocating
ball-on-flat scratch tester. Sadhana, 33(3), 207-220.
Sharma, B. K., Adhvaryu, A., Sahoo, S. K., Stipanovic, A. J., & Erhan, S. Z. (2004).
Influence of chemical structures on low-temperature rheology, oxidative stability,
and physical properties of group II and III base oils. Energy & fuels, 18(4), 952-
959.
Shioyama, H., & Akita, T. (2003). A new route to carbon nanotubes. Carbon, 41(1), 179-
181.
Straub, B. F. (2007). µ-Acetylide and µ-alkenylidene ligands in “click” triazole syntheses.
Chemical Communications(37), 3868-3870.
Suarez, A. N., Grahn, M., Pasaribu, R., & Larsson, R. (2010). The influence of base oil
polarity on the tribological performance of zinc dialkyl dithiophospate additives.
Tribology International, 43(12), 2268-2278.
Suh, N. P. (1973). The delamination theory of wear. Wear, 25(1), 111-124.
Sumerlin, B. S., & Vogt, A. P. (2009). Macromolecular engineering through click
chemistry and other efficient transformations. Macromolecules, 43(1), 1-13.
Sun, S., Cao, Y., Feng, J., & Wu, P. (2010). Click chemistry as a route for the
immobilization of well-defined polystyrene onto graphene sheets. Journal of
Materials Chemistry, 20(27), 5605-5607.
Sunqing, Q., Junxiu, D., & Guoxu, C. (1999). A review of ultrafine particles as antiwear
additives and friction modifiers in lubricating oils. Lubrication Science, 11(3),
217-226.
Tantis, I., Psarras, G., & Tasis, D. (2012). Functionalized graphene–poly (vinyl alcohol)
nanocomposites: physical and dielectric properties. Express Polym Lett, 6(4), 283-
292.
Toledo, M. (2016). Thermogravimetric Analysis (TGA). Retrieved 28 December, 2016,
from
http://www.mt.com/gb/en/home/products/Laboratory_Analytics_Browse/TA_Fa
mily_Browse/TGA.html

82
Tornøe, C. W., Christensen, C., & Meldal, M. (2002). Peptidotriazoles on solid phase:[1,
2, 3]-triazoles by regiospecific copper (I)-catalyzed 1, 3-dipolar cycloadditions of
terminal alkynes to azides. The Journal of organic chemistry, 67(9), 3057-3064.
ULVAC-PHI, I. (2017). X-ray Photoelectron Spectroscopy / XPS. Retrieved 18 January,
2017, from https://www.ulvac-phi.com/en/products/xps/phi-quantera-ii/
Unnikrishnan, R., Jain, M., Harinarayan, A., & Mehta, A. (2002). Additive–additive
interaction: an XPS study of the effect of ZDDP on the AW/EP characteristics of
molybdenum based additives. Wear, 252(3), 240-249.
Wang, H.-X., Zhou, K.-G., Xie, Y.-L., Zeng, J., Chai, N.-N., Li, J., & Zhang, H.-L.
(2011). Photoactive graphene sheets prepared by “click” chemistry. Chemical
Communications, 47(20), 5747-5749.
Wang, L.-F., Ma, T.-B., Hu, Y.-Z., & Wang, H. (2012). Atomic-scale friction in graphene
oxide: an interfacial interaction perspective from first-principles calculations.
Physical Review B, 86(12), 125436.
Xia, Z., Leonardi, F., Gobbi, M., Liu, Y., Bellani, V., Liscio, A., Kovtun, A., Li, R., Feng,
X., & Orgiu, E. (2016). Electrochemical Functionalization of Graphene at the
Nanoscale with Self-Assembling Diazonium Salts. ACS nano, 10(7), 7125-7134.
Xiaodong, Z., Xun, F., Huaqiang, S., & Zhengshui, H. (2007). Lubricating properties of
Cyanex 302‐modified MoS2 microspheres in base oil 500SN. Lubrication
Science, 19(1), 71-79.
Xu, C., Wang, X., & Zhu, J. (2008). Graphene− metal particle nanocomposites. The
Journal of Physical Chemistry C, 112(50), 19841-19845.
Xu, J., Kato, K., & Hirayama, T. (1997). The transition of wear mode during the running-
in process of silicon nitride sliding in water. Wear, 205(1), 55-63.
Ye, Y.-S., Chen, Y.-N., Wang, J.-S., Rick, J., Huang, Y.-J., Chang, F.-C., & Hwang, B.-
J. (2012). Versatile grafting approaches to functionalizing individually dispersed
graphene nanosheets using RAFT polymerization and click chemistry. Chemistry
of Materials, 24(15), 2987-2997.
Zhang, D.-D., Zu, S.-Z., & Han, B.-H. (2009). Inorganic–organic hybrid porous materials
based on graphite oxide sheets. Carbon, 47(13), 2993-3000.
Zhang, J., Liu, W., Xue, Q., & Wang, Q. (1998). Investigation of the friction and wear
behaviors of Cu (I) and Cu (II) dioctyldithiophosphates as additives in liquid
paraffin. Wear, 216(1), 35-40.
Zhang, L., Chen, X., Xue, P., Sun, H. H., Williams, I. D., Sharpless, K. B., Fokin, V. V.,
& Jia, G. (2005). Ruthenium-catalyzed cycloaddition of alkynes and organic
azides. Journal of the American Chemical Society, 127(46), 15998-15999.
Zhou, Y., Bao, Q., Tang, L. A. L., Zhong, Y., & Loh, K. P. (2009). Hydrothermal
dehydration for the “green” reduction of exfoliated graphene oxide to graphene

83
and demonstration of tunable optical limiting properties. Chemistry of Materials,
21(13), 2950-2956.
Zou, Y., & Wang, Y. (2011). NiO nanosheets grown on graphene nanosheets as superior
anode materials for Li-ion batteries. Nanoscale, 3(6), 2615-2620.

84
LIST OF PUBLICATIONS AND PAPERS PRESENTED
Nadia Jamal, Samira Bagheri, Sharifah Bee Abd Hamid. (2016). Chemical
functionalization of graphene for lubricant oil. The 1st UKM-ISESCO-
COMSATS International Workshop on Nanotechnology for Young Scientists
(IWYS2016)
Jamal, N., Bagheri, S., Abd Hamid, S. B. Antiwear additive via click chemistry: Probing
effect of alkyl chain length, ID: LS-16-0147-RA-LS (UNDER REVIEW)

85
APPENDIX
Table A-1: CoF value of 0.010 wt. % additives added in base oil
Sample, wt. %
Load
(N)
Time
(second)
Maximum Minimum Mean
Standard
Deviation
(x10-3)
Base oil G-III 400 3600 0.119 0.014 0.066 10.683
FrGO-C6 400 3600 0.117 0.007 0.069 11.849
FrGO-C8 400 3600 0.125 0.019 0.061 11.794
FrGO-C10 400 3600 0.080 0.013 0.042 4.204
FrGO-C12 400 3600 0.112 0.011 0.062 8.979
Table A-2: CoF value for F-rGO-C10 added in base oil with concentration varies from
0.005 wt. % - 0.050 wt. %
FrGO-C10
(wt. %)
Load
(N)
Time
(second)
Maximum Minimum Mean
Standard
Deviation
(x10-3)
0.000 400 3600 0.119 0.014 0.066 10.683
0.005 400 3600 0.070 0.051 0.058 2.065
0.010 400 3600 0.080 0.013 0.042 4.204
0.025 400 3600 0.100 0.050 0.066 8.802
0.050 400 3600 0.216 0.014 0.096 4.059