functional properties and electrochemical performance of
TRANSCRIPT
Functional Properties and Electrochemical Performance of New Positrode Materials for Proton Ceramic Electrochemical Cells
Håkon Andersen
Thesis for the degree of Master of Science
Department of Chemistry Faculty of Mathematics and Natural Science UNIVERSITY OF
OSLO
June 2020

II
© Håkon Andersen
2019
Functional Properties and Electrochemical Performance of New Positrode Materials for
Proton Ceramic Electrochemical Cells
Håkon Andersen
http://www.duo.uio.no/
Trykk: Reprosentralen, Universitetet i Oslo

III

IV
“Water will be the coal of the future.”
- Jules Verne

V
Preface
This thesis represents part of the required work for the degree of Master of Science (M.Sc.) at
the Department of Chemistry, Faculty of Mathematics and Natural Sciences, University of Oslo.
The work was carried out at the group of Electrochemistry under supervision of Professor Truls
E. Norby and Dr Ragnar Strandbakke during the period from August 2018 to June 2020.
First of all, I would like to thank my main and co-supervisor Professor Truls E. Norby and Dr
Ragnar Strandbakke for their guidance, motivation and encouragement through the entire
process. I would also like to thank Kevin, Stian, Mikael and Tord for sharing an office with me
through this time. A big thank you to my fellow students and to the whole research group for
contributing to a great working environment. I would also like to thank everyone in the GoPHy
MiCO project for great discussions and insight that has made this work possible.
Lastly, I would like to thank my friends and family for their unending support.
Oslo, June 2020
Håkon Andersen

VI

VII
Summary
Proton Ceramic Electrochemical Cells (PCECs) exhibit high efficiency at lower temperatures
due to the low activation energy of proton transport. PCECs have also obtained a great interest
for its fuel utilisation, which result in a higher operating cell voltage and efficiency. However,
the development of efficient commercial PCECs has been held back by the lack of an efficient
electrode at the oxygen steam side, also known as positrode. BaGd0.8La0.2Co2O6-δ (BGLC82)
has shown to be a state of the art positrode, with Mixed Proton and Electronic Conductivity
(MPEC).
By using BGLC82 as a backbone in developing new and efficient electrode materials, the
primary object of this thesis is to study the functional properties of selected doped BGLC82
materials, with their focus as positrode materials for PCECs. BGLC82 was 10 % doped with
the chosen materials zinc, titanium and zirconia (BaGd0.8La0.2Co1.8X0.2O6-δ X=Zn, Ti, Zr).
The BGLC82 compositions were synthesised by solid-state reaction (SSR). BGLC82 Ti and Zn
showed to obtain single phases, whereas BGLC82: Zr exhibit a secondary phase of BaZrO3. To
try to obtain a single phase of BGLC82: Zr sol-gel (SG) synthesis was used. BGLC82: Zr still
exhibited the same secondary phase obtained for SSR, but with a lower amount. This implies
that the solubility of Zr in BGLC82 was exceeded.
BGLC82 Ti and Zn were tested for proton uptake by Thermogravimetric Analysis (TGA) at
300 – 500 ℃. The measurements showed that BGLC82: Ti exhibits a higher proton uptake than
BGLC82, whereas BGLC82: Zn obtain lower proton uptake than BGLC82. This implies that
the donor dopant stabilises the protonic defects in the BGLC82 structure, due to the basisety of
the cation.
For the experimental setup, small pellets of the BGLC82 composites were placed on top of a
BaZr0.7Ce0.2Y0.1O3-δ (BZCY72) at the same time and held in place by a spring load. To obtain
the best contact between the electrodes and the electrolyte, the surfaces in contact were
polished. Platinum was used as counter and reference electrode, placed on the opposite side of
the BGLC82 composite electrodes.

VIII
The activation energy for proton transport in the electrolyte exhibited the same value for all the
electrodes in OCV and bias measurements. This implies that the experimental setup works and
the electrodes do not interfere with each other during measurements.
From the OCV measurements, the different BGLC82 compositions were compared to literature
values for BGLC82. BGLC82: Zr made by SG exhibited close to the same performances as
reported for BGLC82. The BGLC82: Ti and Zn showed polarization resistances higher than
BGL82. The two polarisation resistances (Rp,2 and Rp,3) exhibited similar pH2O and pO2
dependencies for all the electrodes. The results indicate that the rate-limiting steps are red-ox
of absorbed oxygen for Rp,2 and the exchange of oxygen on the surface for Rp,3.
From the bias measurements, BGLC82: Zn exhibited the lowest total polarization resistance of
the electrodes at negative bias. For the positive bias measurements, BGLC82: Ti showed the
lowest total polarization resistance of the electrodes. These measurements indicate that
BGLC82: Zn is a more suited positrode for Proton Ceramic Fuel Cells (PCFC), and BGLC82:
Ti is a better positrode for Proton Ceramic Electrolysers (PCE), cathode and anode,
respectively. The electrodes obtained significantly different total polarization resistances from
the negative and positive bias. This indicates there is a change in the Rate-Determining Step
(RDS) for the electrodes at negative and positive bias.
IX
List of Abbreviations
BGCF BaGdCo1.8Fe0.2O6-δ
BGLC82 BaGd0.8La0.2Co2O6-δ
BGLC82: Ti BaGd0.8La0.2Co1.8Ti0.2O6-δ
BGLC82: Zn BaGd0.8La0.2Co1.8Zn0.2O6-δ
BGLC82: Zr SG BaGd0.8La0.2Co1.8Zr0.2O6-δ by sol-gel metode
BGLC82: Zr SSR BaGd0.8La0.2Co1.8Zr0.2O6-δ by solid-state reaction
BPC BaPrCo2O6-δ
BPCF BaPrCo1.4Fe0.6O6-δ
BZCY72 BaZr0.7Ce0.2Y0.1O3-δ
BZY Yttrium-doped BaZrO3
CE Counter electrode
CEC Ceramic Electrochemical cell
ct Charge transfer
EDS Energy Dispersive X-Ray Spectroscopy
EIS Electrochemical Impedance Spectrocopy
FEG Field Emission Gun
HER Hydogen Evolution Reaction
K-V Kröger-Vink
MOEC Mixed Oxygen ion and Electronic Conductor

X
MPEC Mixed Proton and Electronic Conductor
mt Mass transfer
OER Oxygen Evolution Reaction
PCE Proton Ceramic Electrolyt
PCEC Proton Ceramic Electrochemical Cell
PEME Proton Exchange Membrane Electrolyser
PEMFC Proton Exchange Membrane Fuel cell
RD Relative Density
RDS Rate Deterimg Step
SDC Samarium-doped ceria
SEM Scanning Electron Microscopy
SOE Solid Oxide Electrolyser
SOEC Solid Oxide Electrochemical Cell
SG Sol-Gel
SSR Solid State Reactin
TGA Thermogravimetric Analysis
TPB Triple Phase Boundary
WE Workin Electrode
XRD X-ray Diffraction

XI
Table of Contents
Preface ....................................................................................................................................... V
Summary ................................................................................................................................. VII
List of Abbreviations ................................................................................................................ IX
1 Introduction ..................................................................................................................... 1
1.1 Background and Motivation ........................................................................................ 1
1.2 Aims and Contents....................................................................................................... 4
2 Theory ............................................................................................................................. 5
2.1 Electrochemical Cells .................................................................................................. 5
2.1.1 Half-Cell Reaction ................................................................................................ 5
2.2 Defect Chemistry ......................................................................................................... 6
2.2.1 Kröger-Vink Notation .......................................................................................... 7
2.2.2 Defects in Oxides ................................................................................................. 7
2.3 Transport in Oxides ................................................................................................... 14
2.4 The Positrode ............................................................................................................. 18
2.4.1 Electrode Polarisation ........................................................................................ 18
2.4.2 Triple Phase Boundary ....................................................................................... 19
2.4.3 Positrode Processes ............................................................................................ 20
2.5 Kinetics of electrode reactions .................................................................................. 22
2.5.1 Activation Energy .............................................................................................. 22
2.5.2 Rate of Charge Transfer Electrode Processes .................................................... 23
2.5.3 Rate of Mass Transfer Electrode Processes ....................................................... 28
2.6 Electrochemical Impedance Spectroscopy (EIS) ...................................................... 29
2.6.1 Impedance and Admittance ................................................................................ 29
2.6.2 Equivalent Circuit and Circuit Elements ............................................................ 31
2.6.3 Impedance spectra .............................................................................................. 33
3 Literature ....................................................................................................................... 34
3.1 Ceramic Electrochemical Cells ................................................................................. 34
3.1.1 Proton Ceramic Electrolytes ............................................................................... 35
3.2 Positrode Materials for PCECs .................................................................................. 37
3.2.1 Mixed Protonic and Electronic Conductors (MPEC) ......................................... 38
3.2.2 BaGd0.8La0.2Co2O6-δ (BGLC) ............................................................................. 39
4 Experimental ................................................................................................................. 43

XII
4.1 Sample Preparation .................................................................................................... 43
4.1.1 Electrode materials ............................................................................................. 43
4.1.2 Electrolyte sample .............................................................................................. 45
4.2 Sample Characterisation ............................................................................................ 46
4.2.1 Scanning Electron Microscopy (SEM) .............................................................. 46
4.2.2 X-Ray Diffraction (XRD) .................................................................................. 46
4.2.3 Thermogravimetric Analysis (TGA) .................................................................. 46
4.3 Electrochemical Measurements ................................................................................. 47
4.3.1 Instrumental Setup .............................................................................................. 48
4.3.2 Measurement Series ........................................................................................... 50
4.4 Data Analysis ............................................................................................................. 50
4.4.1 Deconvolution .................................................................................................... 50
4.5 Electrochemical Analysis .......................................................................................... 51
4.6 Error and Uncertainty ................................................................................................ 51
5 Results ........................................................................................................................... 53
5.1 Characterisation ......................................................................................................... 53
5.1.1 Microstructure and Elemental Characterisation ................................................. 53
5.1.2 Crystal Structure ................................................................................................. 54
5.1.3 Hydration ............................................................................................................ 54
5.1.4 Post Electrochemical Characterisation ............................................................... 56
5.2 Electrochemical Characterisation .............................................................................. 58
5.2.1 Temperature Dependencies ................................................................................ 60
5.2.2 Partial pressure dependencies ............................................................................. 64
5.3 Bias Measurements .................................................................................................... 69
5.3.1 Negative Bias - Cathodic .................................................................................... 70
5.3.2 Positive Bias - Anodic ........................................................................................ 73
6 Discussion ..................................................................................................................... 76
6.1 Structural - Insight ..................................................................................................... 76
6.2 Proton Uptake ............................................................................................................ 76
6.3 Positrode at OCV – Insight ........................................................................................ 78
6.3.1 Electrolyte contribution ...................................................................................... 78
6.3.2 Positrode contribution ........................................................................................ 79
6.4 Positrode at Bias –Insight .......................................................................................... 84
XIII
6.4.1 Electrolyte at Bias .............................................................................................. 84
6.4.2 Positrode Behaviour at Negativ Bias ................................................................. 85
6.4.3 Positrode Behaviour at Positive Bias ................................................................. 86
6.4.4 Performance under Bias ..................................................................................... 88
6.5 Further Work ............................................................................................................. 92
7 Summarising conclusions .............................................................................................. 93
Bibliography ............................................................................................................................. 97
Appendix ................................................................................................................................ 103
A.1-Proton Uptake ............................................................................................................. 103
A.2 – OCV measurements .................................................................................................. 104
A.3 – Negativ Bias Measurements ..................................................................................... 106
A.4 – Positiv Bias Measurements ...................................................................................... 109

XIV

1
1 Introduction
1.1 Background and Motivation
With a growing population worldwide, energy demands are rapidly increasing. Energy from
fossil fuels, which at present is the most common source of energy, renders emission of
greenhouse gasses. As climate changes are affecting the worldwide population, efficient,
affordable, and clean energy sources are vital to minimise these changes for generations to
come.
New and efficient ways to produce clean energy utilizing solar cells and wind turbines are
becoming more common than ever before, with growing demands from the customers.
However, as the climate is changing, the demand and production ratio from clean energy
sources are too unstable for the energy grid used today, as the sun does not always shine or the
wind does not blow. A combination of both, production of energy by clean energy sources and
energy storage is required to provide on-demand energy without emitting greenhouse gasses.
Lithium-ion batteries have shown an increase in capacity and efficiency during recent years as
a result of moving away from fossil fuels as energy sources. However, these batteries suffer
from a rapid decrease in capacity over time while being used. This is unsuitable because energy
has to be stored over an extended time period, and charge-discharge cycles may occur in rapid
succession depending on production and demand. Within this scenario, fuel cell and
electrolyser technology are advocated to play a vital role in the future. For these types of
electrochemical cells, the energy is stored as chemical energy in the form of hydrogen gas and
then used to produce electricity whenever needed with the byproduct water. Unfortunately, the
production of hydrogen by electrolysis is not energy efficient due to the overpotential needed
to split water. Therefore, most hydrogen is produced from hydrocarbons with the emission of
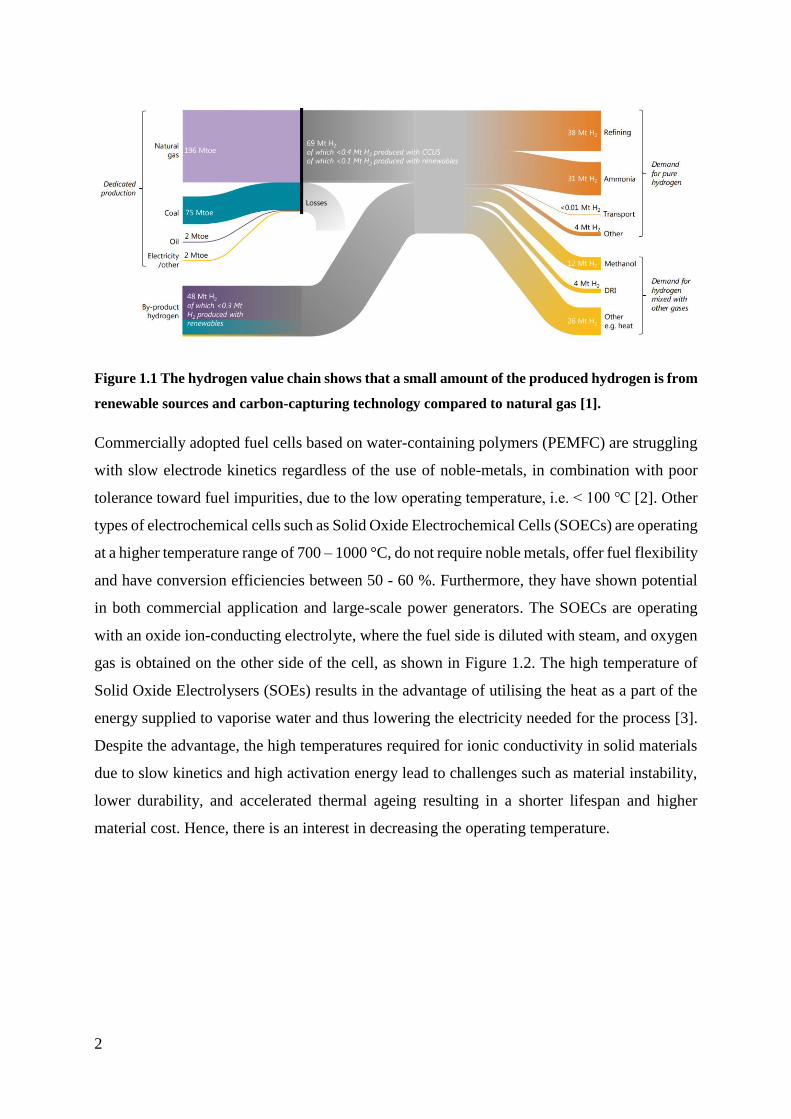
greenhouse gasses, as shown in Figure 1.1 [1].
2
Figure 1.1 The hydrogen value chain shows that a small amount of the produced hydrogen is from
renewable sources and carbon-capturing technology compared to natural gas [1].
Commercially adopted fuel cells based on water-containing polymers (PEMFC) are struggling
with slow electrode kinetics regardless of the use of noble-metals, in combination with poor
tolerance toward fuel impurities, due to the low operating temperature, i.e. < 100 ℃ [2]. Other
types of electrochemical cells such as Solid Oxide Electrochemical Cells (SOECs) are operating
at a higher temperature range of 700 – 1000 °C, do not require noble metals, offer fuel flexibility
and have conversion efficiencies between 50 - 60 %. Furthermore, they have shown potential
in both commercial application and large-scale power generators. The SOECs are operating
with an oxide ion-conducting electrolyte, where the fuel side is diluted with steam, and oxygen
gas is obtained on the other side of the cell, as shown in Figure 1.2. The high temperature of
Solid Oxide Electrolysers (SOEs) results in the advantage of utilising the heat as a part of the
energy supplied to vaporise water and thus lowering the electricity needed for the process [3].
Despite the advantage, the high temperatures required for ionic conductivity in solid materials
due to slow kinetics and high activation energy lead to challenges such as material instability,
lower durability, and accelerated thermal ageing resulting in a shorter lifespan and higher
material cost. Hence, there is an interest in decreasing the operating temperature.
3
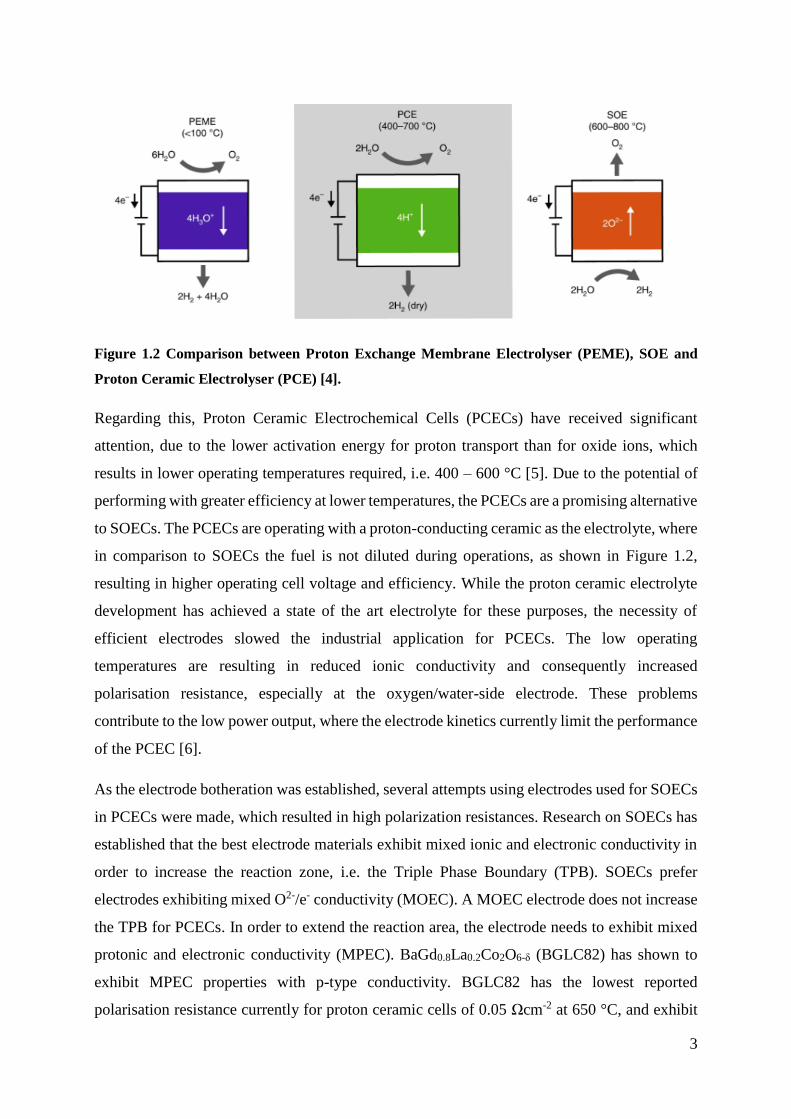
Figure 1.2 Comparison between Proton Exchange Membrane Electrolyser (PEME), SOE and
Proton Ceramic Electrolyser (PCE) [4].
Regarding this, Proton Ceramic Electrochemical Cells (PCECs) have received significant
attention, due to the lower activation energy for proton transport than for oxide ions, which
results in lower operating temperatures required, i.e. 400 – 600 °C [5]. Due to the potential of
performing with greater efficiency at lower temperatures, the PCECs are a promising alternative
to SOECs. The PCECs are operating with a proton-conducting ceramic as the electrolyte, where
in comparison to SOECs the fuel is not diluted during operations, as shown in Figure 1.2,
resulting in higher operating cell voltage and efficiency. While the proton ceramic electrolyte
development has achieved a state of the art electrolyte for these purposes, the necessity of
efficient electrodes slowed the industrial application for PCECs. The low operating
temperatures are resulting in reduced ionic conductivity and consequently increased
polarisation resistance, especially at the oxygen/water-side electrode. These problems
contribute to the low power output, where the electrode kinetics currently limit the performance
of the PCEC [6].
As the electrode botheration was established, several attempts using electrodes used for SOECs
in PCECs were made, which resulted in high polarization resistances. Research on SOECs has
established that the best electrode materials exhibit mixed ionic and electronic conductivity in
order to increase the reaction zone, i.e. the Triple Phase Boundary (TPB). SOECs prefer
electrodes exhibiting mixed O2-/e- conductivity (MOEC). A MOEC electrode does not increase
the TPB for PCECs. In order to extend the reaction area, the electrode needs to exhibit mixed
protonic and electronic conductivity (MPEC). BaGd0.8La0.2Co2O6-δ (BGLC82) has shown to
exhibit MPEC properties with p-type conductivity. BGLC82 has the lowest reported
polarisation resistance currently for proton ceramic cells of 0.05 Ωcm-2 at 650 °C, and exhibit
4
activation energies down to 0.5 eV at lower temperature range (450 – 350 °C) [7]. In addition
to showing Faradaic efficiency close to 100 % at 500 – 600 °C [4], BGLC can be considered as
a state of the art electrode for PCECs. However, BGLC82 has shown to experience phase
segregation at high water vapour pressure, as well as forming Co-oxides at the surface under
normal operating conditions.
1.2 Aims and Contents
As mention above, the lack of specialised electrodes for PCECs, hinders the development of
commercial PCECs. By using BGLC82 as a backbone in developing new and efficient
electrode materials, the primary object of this thesis is to study the functional properties of
selected doped BGLC82 materials, with their focus as electrode materials for PCECs.
BaGd0.8La0.2Co1.8X0.2O6-δ (X= Ti, Zn and Zr), with different cation substitutes for cobalt, will
be synthesised and characterized with respect to the crystal structure, hydration, and electrode
kinetics.
The crystal structure and morphology of the synthesised electrodes will be investigated through
X-ray Diffraction (XRD) together with Scanning Electron Microscopy (SEM) and Energy
Dispersive X-Ray Spectroscopy (EDS). The hydration properties of the electrodes will be
investigated by isotherm dry/wet switches in various temperatures by means of Thermogravimetric
Analysis (TGA). The electrochemical measurements will be conducted by a modified three-point
electrode setup, where all the electrodes are placed on a BaZr0.7Ce0.2Y0.1O3 (BZCY72) electrolyte
simultaneously, with the ability to measure on each electrode individually. The electrolyte will have
a counter- and a reference electrode made of platinum and the electrochemical measurements will
be realized by potentiostatic electrochemical impedance spectroscopy (EIS) under controlled
atmospheres and temperatures. The EIS is used to delineate the electrode responses into ohmic and
polarization contributions. The dependencies of the resistances and kinetic parameters will be
investigated concerning temperature, pO2 and pH2O. By evaluating all the parameters of the
electrodes, their performances will be compared to each other and with the literature results of pure
BGLC82. Additionally, the rate-limiting step for each of the electrode will be determined.
Furthermore, the different electrodes will be measured at different potentials, which will
enhance either the anodic or cathodic reaction. The measurements will yield a better
understanding of the electrode kinetics and of the behaviour as an electrode for PCECs, where
the cell is required to work both in fuel cell and electrolyser mode.
5
2 Theory
2.1 Electrochemical Cells
Electrochemical cells are systems that can use redox reactions to either, convert chemical
energy to electrical energy or convert electricity to drive a chemical reaction. These types of
cells are called galvanic- and electrolytic cells, respectively. The third type of electrochemical
cells are equilibrium cells which are used in sensors, and will not be discussed in this thesis.
When a current flows through an electrochemical cell, the potential will change from the
equilibrium potential also called null voltage. This change in potential is known as overpotential
(η) and is the difference between the standard electrode potential and the measured potential.
An electrochemical cell simply consists of two electrodes which are separated by an electrolyte.
The electrolyte is an ion conductor, and the electrodes are electron conductors, connected to an
external circuit.
2.1.1 Half-Cell Reaction
In this work, the electrode of interest is where the oxygen/steam half-cell reaction takes place.
When the electrochemical cell is set at fuel cell mode, the electrode of interest is reducing
oxygen, thus works as a cathode. When the cell switches to electrolyser mode, the electrode is
oxidising water to produce protons and oxygen gas, thus becomes an anode. Due to the standard
reduction potential being higher than for the hydrogen electrode in both of the cases, the
electrode is hereafter called positrode, whereas the hydrogen electrode is then referred to as
negatrode.
For a PCEC, the negatrode oxidises hydrogen gas to form protons and electrons in galvanic
mode. The protons migrate through a ceramic electrolyte to the positrode, while the electrons
flow through an external circuit. At the electrolyte/positrode interface, electrons and protons
react with oxygen gas to form water. In electrolyser mode, the reactions are reversed, and there
is a need for energy from an external source to drive the reactions.

6
The electrochemical reactions at each half-cell:
Hydrogen evolution reaction (HER) at the negatrode:
H2(g) ⇌ 2H+ + 2e− (2.1)
Oxygen evolution reaction (OER) at the positrode:
O2(g) + 4H+ + 4e− ⇌ 2H2O(g) (2.2)
The total cell reaction would then be:
2H2(g) + O2(g) ⇌ 2H2O(g) (2.3)
2.2 Defect Chemistry
Any imperfection or deviation from the ideal periodicity in a crystalline lattice is a defect. The
entropy favours the formation of defects at temperatures above 0 K to reduce Gibbs's energy.
There are primarily two main categories of defects: electronic defects and structural defects.
Electronic defects are electrons and holes which to some extend can move freely in the crystal.
These defects are either formed by internal excitation or related to structural defects in terms of
compensation. The structural defects are defects which are in fixed sites in the structure, which
either is formed intrinsically by internal reactions within the material, or extrinsically through
interaction with other phases.
Figure 2.1 Structural defects that can be present are a) vacancies, b) substitutional foreign atom,
c) interstitial host atom and d) interstitial foreign atom.

7
All types of defects that are mention above and shown in Figure 2.1 can be present
simultaneously, but often there will be some of the defects that dominate. Defect concentrations
and the dominating defect depend on the thermodynamic of defect equilibria. To understand
defect equilibria at different conditions, it is necessary to have a standard in formulating
chemical equations for defect reactions, which is expressed by using the Kröger-Vink notation
for point defects.
2.2.1 Kröger-Vink Notation
The Kröger-Vink notation (K-V) was proposed as a notation for point defects by Kröger and
Vink in 1956. This notation describes any structural element in a crystal, in terms of what their
chemical content is and what kind of structural position it occupies in the unit cell. The general
notation is Asc , where A refers to the element (H, O, Zn, Fe, etc.) or a vacancy (v). The subscript
s refers to a site in the crystal lattice, which is given by the element symbols or i for an interstitial
site. The superscript c refers to the effective charge for the defect. The notation for effective
charges are superscript •, / and x, for positive, negative and neutral defects, respectively. The
effective charge is defined as the difference between the actual charge of the species minus the
actual charge that the reference structure would have had on the same site. For example vO••, OO
x
or NO′ . Electrons and holes are written as e′ or n and h• or p, respectively. Defect reactions are
written in the same manner as ordinary chemical reactions and are balanced by conservation of
mass, charge, and ratios of sites [8].
2.2.2 Defects in Oxides
Thermodynamics determines the defects in oxides and favours a small concentration of defects.
Oxides in equilibrium with the surroundings are generally nonstoichiometric [9]. For oxides
under experimental conditions, the activity of a cation is imperceptibly compared to the activity
of the oxygen. Hence, the non-stoichiometry for oxides is, in general, determined by the oxygen
exchange between the oxide and the atmosphere. These materials have either an excess or a
deficiency of oxygen compared to their stoichiometry. This property is controllable by varying
the temperature and oxygen partial pressure of the system.

8
Figure 2.2 The unit cell of BaZrO3 [10].
Figure 2.2 shows the crystal structure of BaZrO3, which has shown properties of proton
conductivity. The formation of protonic defects occurs primarily due to the presence of oxygen
vacancies. These vacancies can be formed intrinsically by Schottky disorder or oxygen
deficiency, and charge compensated by metal vacancies (vBa′′ and vZr
′′′) or electrons. Commonly,
BaZrO3 is doped with a lower valent cation for Zr4+ to increase the stability of protonic defects,
which is known as acceptor doping. Y3+ is usually used as the dopant for BaZrO3, which gives
chemical formula BaZr1-xYxO3-δ (BZY). This dopant gives effectively negative sites (YZr′ ),
which may be charge compensated by oxygen vacancies.
2BaCO3 (s) + Y2O3 (s)
ZrO2↔ 2BaBa
x + 2YZr′ + vO
•• + 5OOx + 2CO2 (g)
(2.4)
Under dry conditions, the acceptors and oxygen vacancies are the dominating defects, while
electronic defects are minority defects. Even though electronic defects are minority defects,
BZY can exhibit a small concentration, which contributes to n- and p-type conductivities. These
defects may occur to charge compensate the deviation from the stoichiometry of the material
due to pressures, temperatures or doping.
Under high oxygen partial pressures, the oxygen gas reduces and forms electron holes within
the structure, which may lead to p-type conductivity [11]:
1
2O2 (g) + vO
•• = 2h• + OOx
(2.5)
9
Opposite under low oxygen partial pressures, oxygen vacancies are formed and compensated
by electrons:
OOx = vO
•• + 2e′ +1
2O2 (g)
(2.6)
From reaction 2.5 and 2.6 the equilibrium constant for oxidation (Ko′ ) and reduction (Kr
′ ),
respectively, can be determined:
Ko′ =
ah•2 aOOx
avO•• aO21/2
=p2 [OO
x ]
[vO••]
(𝑝O2
𝑝O20)
−12
= p2 [vO••]−1 𝑝O2
−1/2
(2.7)
Kr′ =
avO•• ae′2 aO2
1/2
aOOx=[vO
••] n2
[OOx ]
(𝑝O2
𝑝O20)
12
= [vO••] n2 𝑝O2
1/2
(2.8)
The standard pressure, 𝑝O20, is 𝑝O2
0 = 1, and the defect concentration [OOx ] is assumed to be
[OOx ] = 1 due to the domination of OO
x over other defects. Equation (2.7) and (2.8) show that the
concentration of electrons, holes, and oxygen vacancies is dependent on the oxygen partial
pressure. The equilibrium constants can be related to the standard Gibbs energy (ΔG ̊ ) of the
reaction:
Ki′ = e
(−Δ𝐺𝑖
𝑜
𝑅𝑇)= 𝑒
(Δ𝑆𝑖
𝑜
𝑅)𝑒(−
Δ𝐻𝑖𝑜
𝑅𝑇)
(2.9)
Furthermore, oxides often gain protonic defects when exposed to water-rich atmospheres. The
protonic defects occur by hydration, by the following defect reaction:
With the corresponding equilibrium constant:
Khyd′ = [OHO
• ]2[vO••]−1𝑝H2O
−1 (2.11)
H2O (g) + vO•• + OO
x ⇌ 2OHO• (2.10)
10
To calculate the dependency of each defect concentration, the electroneutrality conditions for
the oxide need to be established. The electroneutrality is written such that the concentration of
the effective negative and positive species are equal to each other. The total electroneutrality
for BZY becomes [12]:
n + [YZr′ ] = 2[vO
••] + [OHO• ] + p (2.12)
Except for the doping concentration in BZY, the defect concentration are affected by specific
partial pressures. The dopant is therefor a constant compensating defect for the opposite charge
defects, which will stabilise the concentration of the compensating defect.
When BZY is exposed to a water-rich atmosphere with changing oxygen partial pressures, the
electroneutrality can be rewritten to obtain boundary conditions at different pO2 conditions. For
low pO2 conditions, the dominating defects are electrons and oxygen vacancies. The other
defects can then be seen as minority defects, and the boundary condition becomes n = 2[vO••],
due to the concentration of the minor defects n ≫ [YZr′ ] and [vO
••] ≫ [OHO• ] + p. Hence, the
boundary condition for intermediate and high pO2 becomes [YZr′ ] = 2[vO
••] and p = 2[vO••],
respectively.
The pO2 dependency for each defect can then be determined by Equation 2.7, 2.8 and 2.11,
which is shown in the following table.
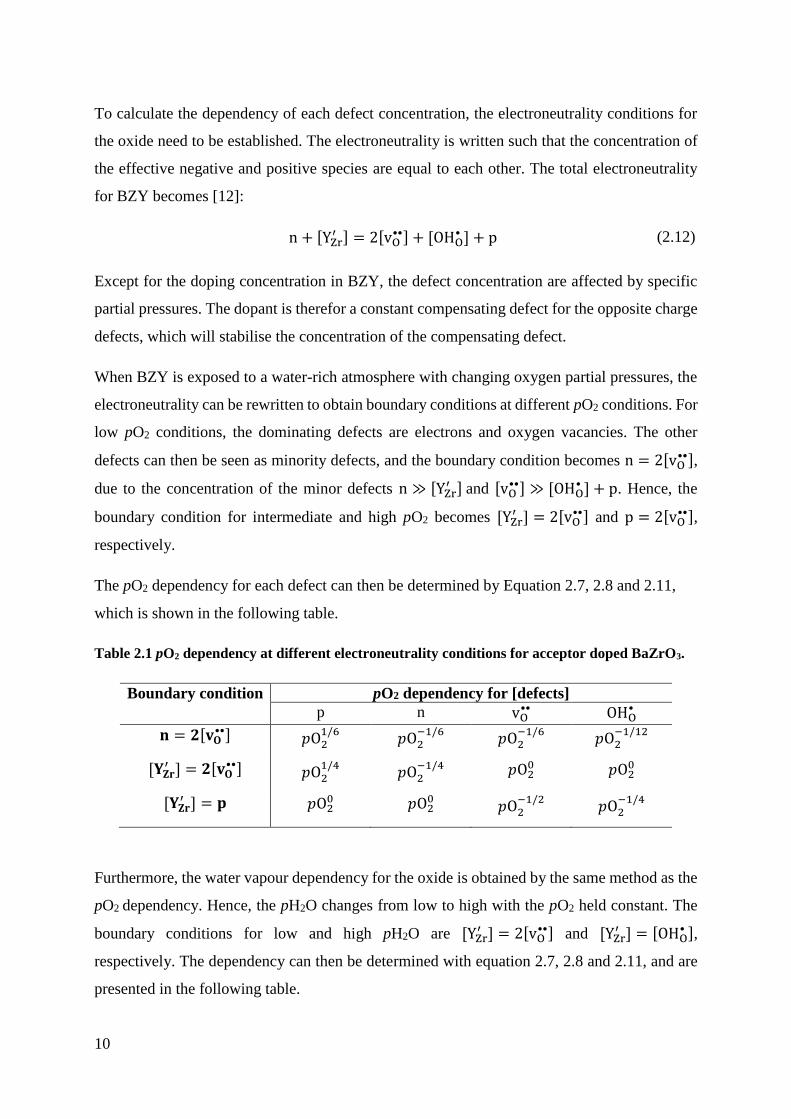
Table 2.1 pO2 dependency at different electroneutrality conditions for acceptor doped BaZrO3.
Boundary condition pO2 dependency for [defects]
p n vO•• OHO
•
𝐧 = 𝟐[𝐯𝐎••] 𝑝O2
1/6 𝑝O2
−1/6 𝑝O2
−1/6 𝑝O2
−1/12
[𝐘𝐙𝐫′ ] = 𝟐[𝐯𝐎
••] 𝑝O21/4
𝑝O2−1/4
𝑝O20 𝑝O2
0
[𝐘𝐙𝐫′ ] = 𝐩 𝑝O2
0 𝑝O20 𝑝O2
−1/2 𝑝O2
−1/4
Furthermore, the water vapour dependency for the oxide is obtained by the same method as the
pO2 dependency. Hence, the pH2O changes from low to high with the pO2 held constant. The
boundary conditions for low and high pH2O are [YZr′ ] = 2[vO
••] and [YZr′ ] = [OHO
• ],
respectively. The dependency can then be determined with equation 2.7, 2.8 and 2.11, and are
presented in the following table.
11
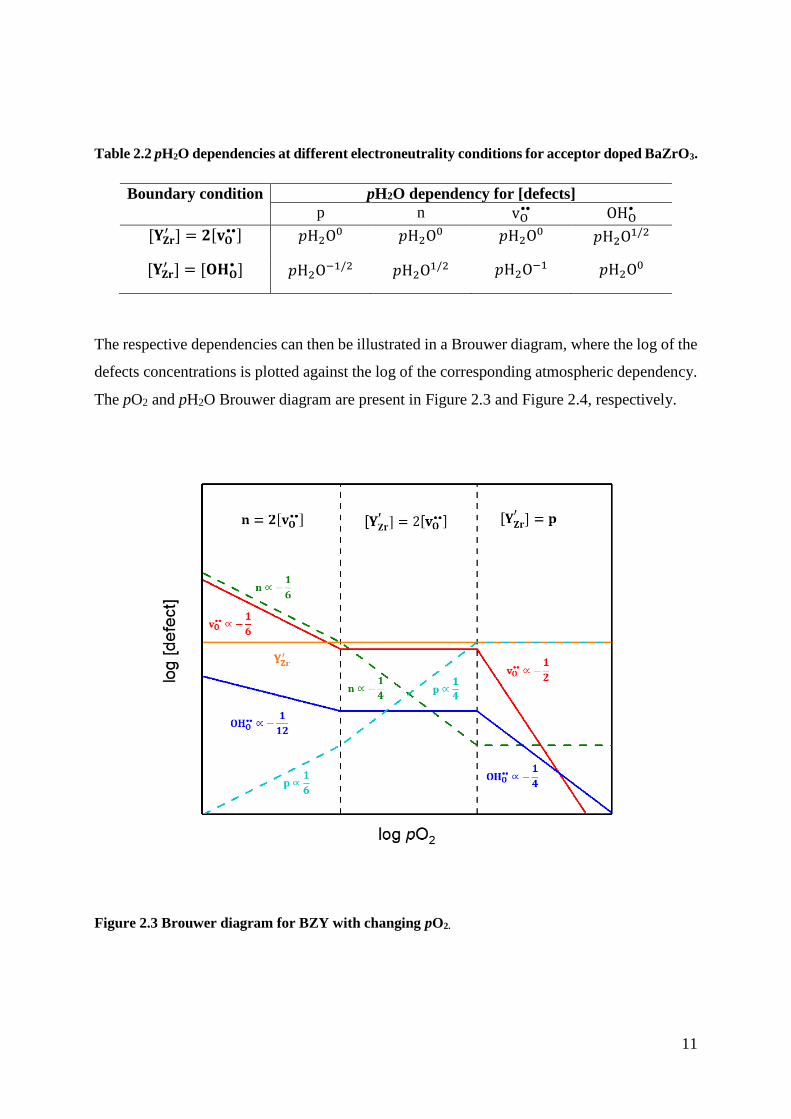
Table 2.2 pH2O dependencies at different electroneutrality conditions for acceptor doped BaZrO3.
Boundary condition pH2O dependency for [defects]
p n vO•• OHO
•
[𝐘𝐙𝐫′ ] = 𝟐[𝐯𝐎
••] 𝑝H2O0 𝑝H2O
0 𝑝H2O0 𝑝H2O
1/2
[𝐘𝐙𝐫′ ] = [𝐎𝐇𝐎
• ] 𝑝H2O−1/2 𝑝H2O
1/2 𝑝H2O−1 𝑝H2O
0
The respective dependencies can then be illustrated in a Brouwer diagram, where the log of the
defects concentrations is plotted against the log of the corresponding atmospheric dependency.
The pO2 and pH2O Brouwer diagram are present in Figure 2.3 and Figure 2.4, respectively.
Figure 2.3 Brouwer diagram for BZY with changing pO2.
12
Figure 2.4 Brouwer diagram for BZY with changing pH2O.
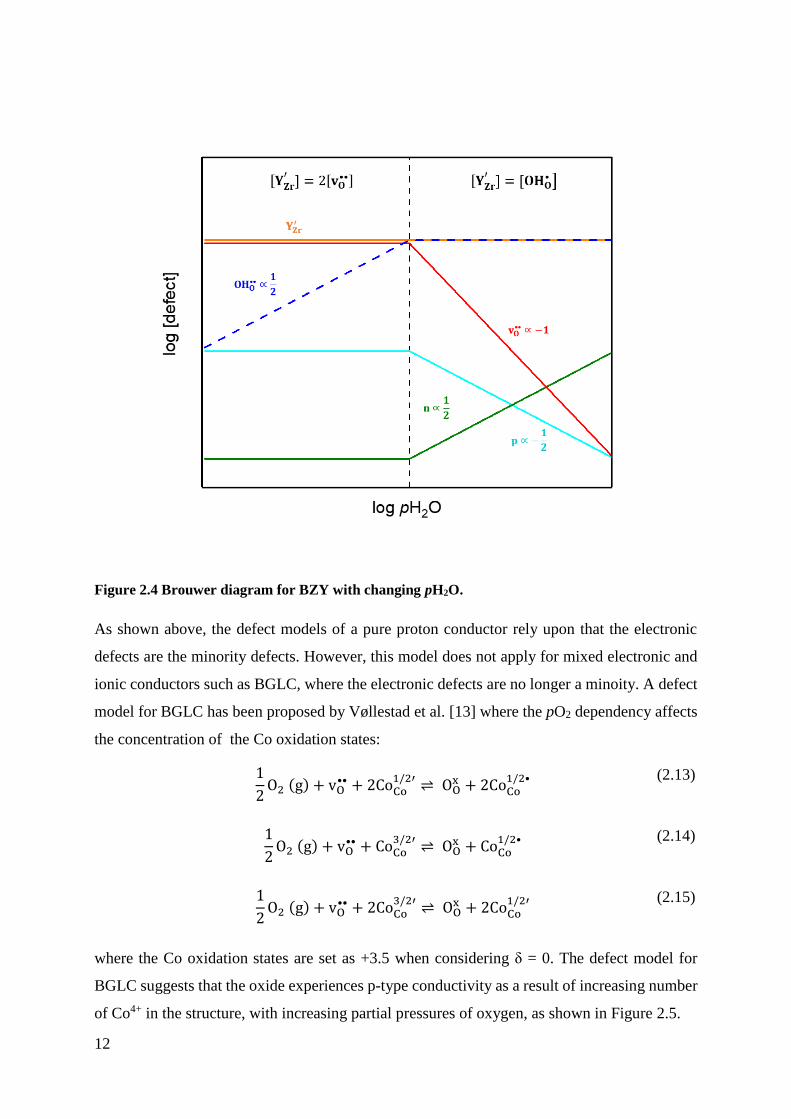
As shown above, the defect models of a pure proton conductor rely upon that the electronic
defects are the minority defects. However, this model does not apply for mixed electronic and
ionic conductors such as BGLC, where the electronic defects are no longer a minoity. A defect
model for BGLC has been proposed by Vøllestad et al. [13] where the pO2 dependency affects
the concentration of the Co oxidation states:
1
2O2 (g) + vO
•• + 2CoCo1/2′
⇌ OOx + 2CoCo
1/2•
(2.13)
1
2O2 (g) + vO
•• + CoCo3/2′
⇌ OOx + CoCo
1/2•
(2.14)
1
2O2 (g) + vO
•• + 2CoCo3/2′
⇌ OOx + 2CoCo
1/2′
(2.15)
where the Co oxidation states are set as +3.5 when considering δ = 0. The defect model for
BGLC suggests that the oxide experiences p-type conductivity as a result of increasing number
of Co4+ in the structure, with increasing partial pressures of oxygen, as shown in Figure 2.5.
13
Figure 2.5 Concentration of Co 2+, 3+ and 4+ vs. pO2 for 500 ℃ and 700 ℃ [13].
Due to the electronic defects not being minority defects, the way to produce protonic defects
change compared to the BZY model. As explained above, the protonic defects are created by
the hydration of the oxide by consuming oxygen vacancies. However, for oxides which are
considered as possible positrode materials with mixed-valent transition metals ions, the
situation is more complicated. For these materials, the protonic defect can also be obtained by
hydrogenation, where the mixed-valent transition metals change their oxidation state to form
protonic defects. For simplicity, reaction 2.10 and 2.13 are combined to describe the proton
uptake at the expense of a hydrogenation:
H2O (g) + 2OO
x + 2CoCo1/2•
⇌ 2CoCo1/2′
+ 2OHO• +
1
2O2(g)
(2.16)
The hydrogenation has been shown both theoretically and experimentally [14, 15] and the
conditions determine whether the proton uptake is from hydration or due to hydrogenation.
The electroneutrality for BGLC when hydrated can be expressed as:
2[vO
••] +1
2[Co
Co
12•] + [LaBa
• ] + [OHO• ] =
3
2[Co
Co
32′] +
1
2[Co
Co
12′]
(2.17)
14
2.3 Transport in Oxides
For most electrochemical cells, there needs to be movement of reactants to the reaction sites
and transport of products away from these sites to function. For PCECs, there are three types
of transport mechanisms; migration, diffusion and convection. The last transport mechanism
will not be discussed further in this thesis, due to the mobility of ions in solid oxides being
independent of convection. Movement of charged species which occurs in response to a
gradient of electrical potential is called migration. The following section is based on [8, 16].
The flow of particles is expressed through Fick's first law, where particles move from high to
low concentration:
𝐽 = −𝐷
𝛿𝑐
𝛿𝑥
(2.18)
The J is the particle flux density, D is the diffusion coefficient and 𝛿𝑐
𝛿𝑥 the concentration gradient
of the particles.
When transport of a species, i, is affected by a driving force Fi, the particle flux density Ji is
given by the product of the concentration of the particles (ci) and the average drift velocity (vi),
which is a product of the force exerted on the particles and the mechanical mobility Bi, (vi =
FiBi):
𝐽𝑖 = 𝑐𝑖𝑣𝑖 = 𝑐𝑖𝐹𝑖𝐵𝑖 (2.19)
When species i with a charge, zi, is exposed to an electric field E, the force on the particles is
given by:
𝐹𝑖 = −𝑧𝑖𝑒
𝛿𝜑
𝛿𝑥 = −𝑧𝑖𝑒𝐸
(2.20)
where e is the elementary charge.
By combining equation 2.19 and 2.20 the flux density becomes:
𝐽𝑖 = −𝑐𝑖𝐵𝑖𝑧𝑖𝑒𝐸 (2.21)
15
where the current density ji is given by:
𝑗𝑖 = −𝑧𝑖𝑒𝐽𝑖 = −(𝑧𝑖𝑒)2𝑐𝑖𝐵𝑖𝐸 (2.22)
The charge mobility (ui) for a species is a product of the mechanical mobility multiplied with
the magnitude of the charge of each particle (ui=|zi|eBi). Then equation 2.22 can be rewritten
as:
𝑗𝑖 = −|𝑧𝑖|𝑒𝑐𝑖𝑢𝑖𝐸 = −𝜎𝑖𝐸 (2.23)
Equation 2.23 gives rise to an essential definition of the partial electrical conductivity of a
species (σi = |zi|eciui). The partial electrical conductivity unit can be Scm-1 or Ω-1cm-1 and is an
essential component in the understanding of conducting behaviour in solid oxides.
The total electrical conductivity (σt) for a material is given by the sum of all the partial
conductivities of the charge carriers:
𝜎𝑡 =∑𝜎𝑖 = 𝜎𝑖𝑜𝑛 + 𝜎𝑒𝑙 (2.24)
In most cases, one of the charge carriers dominates the conductivity, and the minority charge
transport contributions are neglected. The mobility of electronic charge carriers is negligibly
higher compared to ions. As seen in Equation 2.23, there are two parameters to enhance ionic
conductivity: mobility and concentration. The mobility of species in a solid is increased by
temperature, due to the higher energy the species has, and the jump attempts over the energy
barrier that succeeds increases. The concentration of a species has been shown earlier to change
by different atmospheric conditions, as shown in Figure 2.3 and Figure 2.4.
Electronic conductivity (σel) is related to the motion of the electronic charge carrier electrons
and holes through, the substance. They are known as n- (σn) and p-type (σp) conductivity,
respectively. The conductivity for each charge carrier is expressed in terms of their
concentration and their corresponding mobilities (un and up):
𝜎𝑒𝑙 = 𝜎𝑛 + 𝜎𝑝 = 𝑒𝑛𝑢𝑛 + 𝑒𝑝𝑢𝑝 (2.25)
16
Ionic conductivity (σion) on the other hand, occurs in the presence of vacancy sites or interstitial
ions in the crystalline structure. The mobility of ions is due to the thermal activation of ion
hopping, which is related to diffusion and follows the Nernst-Einstein relationship:
𝐷𝑖 =
𝑘𝐵𝑇
𝑧𝑖𝑒𝑢𝑖 =
𝑘𝐵𝑇
𝑐𝑖(𝑧𝑖𝑒)2𝜎𝑖
(2.26)
In equation 2.26, the Di is the diffusion coefficient of charge species i, kB is the Boltzmann's
constant and T is the temperature in Kelvin.
Since the Nernst-Einstein relationship applies to jumping processes, the conductivity will have
a temperature dependency, where the conductivity can be written in the Arrhenius form
where Ea is the activation energy, that includes the enthalpy of formation and mobility of the
hopping defect. σ0 is the temperature-independent pre-exponential factor, which includes
entropy of formation and mobility of the defect.
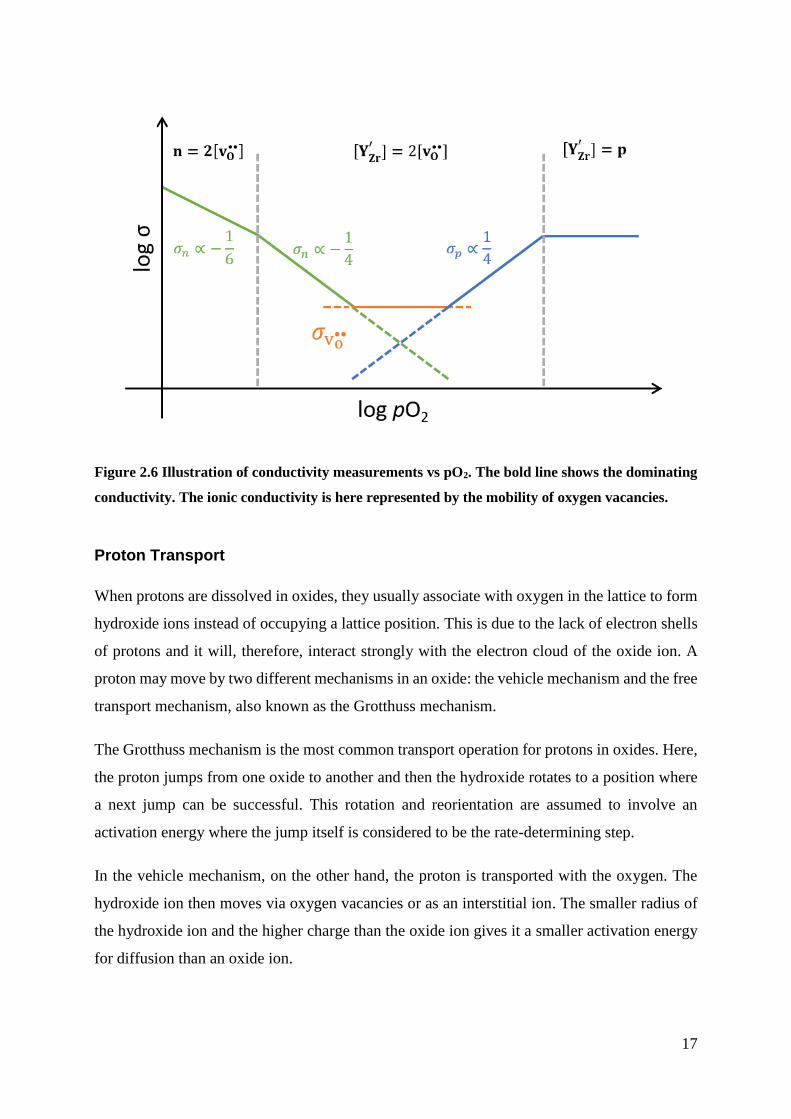
As mention previously, conductivity can be increased with the increase of defect concentration.
When using BZY as an example, the conductivity can be related to the defect concentration
through Equation 2.23 and 2.25. From the defect model of BZY, the pO2 dependency of the
defects is shown in Table 2.1. When combining the dependencies with Equation 2.23 and 2.25,
the conductive changes at different boundary conditions that apply for the BZY model. For
BZY, the total conductivity against pO2 can be plotted, as illustrated in Figure 2.6, with the
boundary condition represented in Table 2.1. From Figure 2.6, the ionic conductivity range can
be increased with an increasing concentration of oxygen vacancies as the ionic conductivity
would move with the y-axis in the illustration.
𝜎𝑖𝑇 = 𝜎0 𝑒
−𝐸𝑎𝑘𝑏𝑇
(2.27)
17
Figure 2.6 Illustration of conductivity measurements vs pO2. The bold line shows the dominating
conductivity. The ionic conductivity is here represented by the mobility of oxygen vacancies.
Proton Transport
When protons are dissolved in oxides, they usually associate with oxygen in the lattice to form
hydroxide ions instead of occupying a lattice position. This is due to the lack of electron shells
of protons and it will, therefore, interact strongly with the electron cloud of the oxide ion. A
proton may move by two different mechanisms in an oxide: the vehicle mechanism and the free
transport mechanism, also known as the Grotthuss mechanism.
The Grotthuss mechanism is the most common transport operation for protons in oxides. Here,
the proton jumps from one oxide to another and then the hydroxide rotates to a position where
a next jump can be successful. This rotation and reorientation are assumed to involve an
activation energy where the jump itself is considered to be the rate-determining step.
In the vehicle mechanism, on the other hand, the proton is transported with the oxygen. The
hydroxide ion then moves via oxygen vacancies or as an interstitial ion. The smaller radius of
the hydroxide ion and the higher charge than the oxide ion gives it a smaller activation energy
for diffusion than an oxide ion.

18
2.4 The Positrode
2.4.1 Electrode Polarisation
An electrode that remains at its null potential (En) while a current is applied to the electrode of
either sign and any magnitude, is said to be totally depolarised. In contrast, when no Faradaic
current passes at any potential, it is said to be totally polarised. When an electrode is totally
depolarised, the electrode behaves like a resistor. However, when an electrode is totally
polarised, the electrode behaves as a capacitor due to the double layer at the
electrode/electrolyte interface.
For an electrode, the typical case is that a current runs through the electrode, which yields a
potential loss or gain from En depending on the current direction. The difference between the
En and the yield potential is known as overpotential (η). The overpotential is calculated by the
difference between the null potential (En) and the measured potential (E):
η = |𝐸 − 𝐸𝑛| (2.28)
Figure 2.7 Illustration of electrode behaviour in the I-V curve when the electrode is totally
polarized or depolarised and typical case [16].
Electrode polarization can be associated with the respective overpotential [16]. Kinetic
polarisation is also known as charge transfer polarisation, which is due to the slow kinetics of
the electrochemical reaction taking place. This behaviour occurs typically at the TPB in a
PCEC, which contributes to a charge transfer overpotential (ηct). Charge transfer polarisation
can be seen in an I-V curve when the curve goes from a totally polarised behaviour to an
increase in current when the potential increases.

19
Ohmic polarisation, which leads to ohmic overpotential (ηohm), appears when a current flows
across a cell and arises due to the motion of electrons and ions through the electrolyte and the
electrodes. The ohmic overpotential can be seen as the linear part in an I-V curve and is related
to Ohm's law; ηohm = IRcell where Rcell represents the sum of resistance through the cell.
Transport or mass transport polarisation is due to the slowness of supply of the reactants or the
removal of products at the electrode/electrolyte interface. As a result of a current that flows
through the interface, a concentration gradient of reactants and products appears and leads to a
mass transport overpotential (ηmt). The mass transport polarisation can be seen as the limiting
current in an I-V curve.
2.4.2 Triple Phase Boundary
For PCEC, electrode reactions take typically place at the electrode/electrolyte interface, which
is in contact with the gas phase. These areas that connect all three phases are referred to as the
TPB, shown in Figure 2.8. The TPB allows the electrode reaction to occur due to the presence
of all the reactance at the same time [17]. Hence, expansion of the TPB to also becomes on the
positrode surface alone will increase the reaction rate as well as the cell performance.
Figure 2.8 Illustration of the TPB (blue circle) when the positrode is a pure electronic conductor.
20
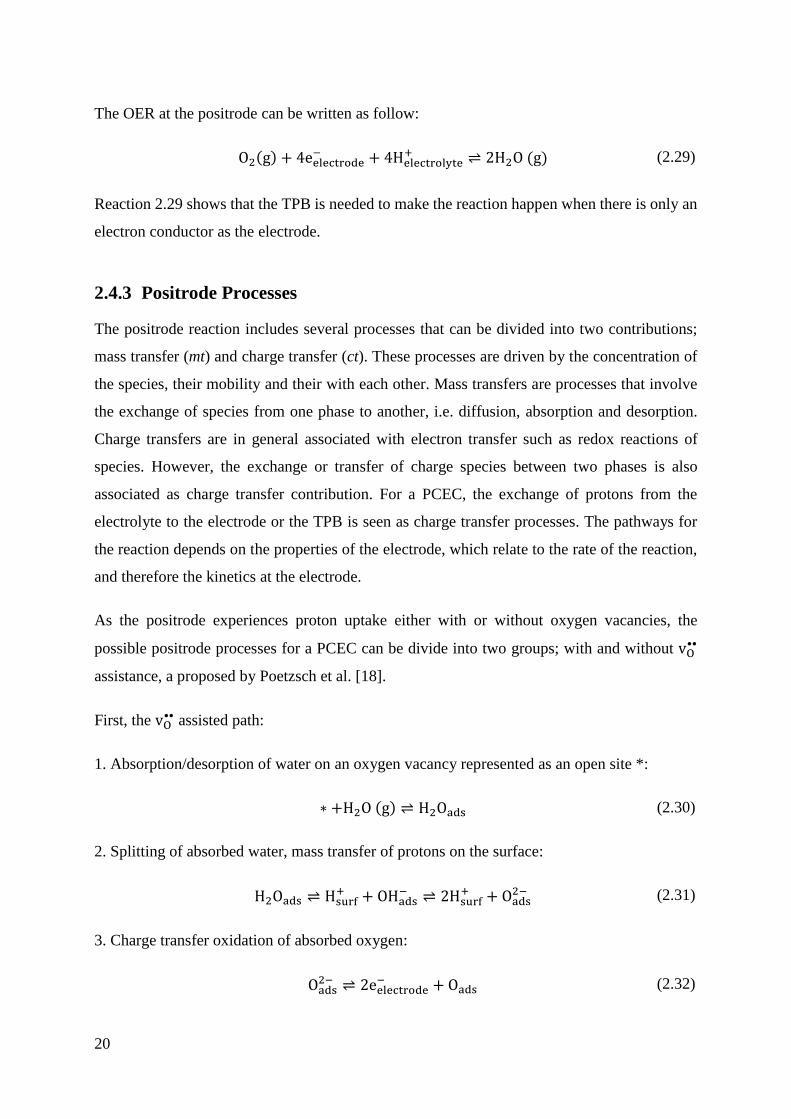
The OER at the positrode can be written as follow:
O2(g) + 4eelectrode− + 4Helectrolyte
+ ⇌ 2H2O (g) (2.29)
Reaction 2.29 shows that the TPB is needed to make the reaction happen when there is only an
electron conductor as the electrode.
2.4.3 Positrode Processes
The positrode reaction includes several processes that can be divided into two contributions;
mass transfer (mt) and charge transfer (ct). These processes are driven by the concentration of
the species, their mobility and their with each other. Mass transfers are processes that involve
the exchange of species from one phase to another, i.e. diffusion, absorption and desorption.
Charge transfers are in general associated with electron transfer such as redox reactions of
species. However, the exchange or transfer of charge species between two phases is also
associated as charge transfer contribution. For a PCEC, the exchange of protons from the
electrolyte to the electrode or the TPB is seen as charge transfer processes. The pathways for
the reaction depends on the properties of the electrode, which relate to the rate of the reaction,
and therefore the kinetics at the electrode.
As the positrode experiences proton uptake either with or without oxygen vacancies, the
possible positrode processes for a PCEC can be divide into two groups; with and without vO••
assistance, a proposed by Poetzsch et al. [18].
First, the vO•• assisted path:
1. Absorption/desorption of water on an oxygen vacancy represented as an open site *:
∗ +H2O (g) ⇌ H2Oads (2.30)
2. Splitting of absorbed water, mass transfer of protons on the surface:
H2Oads ⇌ Hsurf+ + OHads
− ⇌ 2Hsurf+ + Oads
2− (2.31)
3. Charge transfer oxidation of absorbed oxygen:
Oads2− ⇌ 2eelectrode
− + Oads (2.32)
21
3.1 Charge transfer oxidation of water:
Oads + H2O (g) ⇌ H2OOabs ⇌ O2𝑎𝑏𝑠 + 2H+ + 2e− (2.33)
4. Desorption/absorption of oxygen gas:
O2abs ⇌ O2(g) +∗ (2.34)
The second path without vO•• assistance:
1. Absorption/desorption of water on the surface that is chemisorption to the surface:
2H2O (g) ⇌ 2H2Och,abs (2.35)
2. Charge transfer, oxidation of water:
2H2Och,abs ⇌ 2Hsurf+ + 2OHch,abs + 2eelectrode
− (2.36)
2.1. Second charge transfer, oxidation of oxygen:
2OHch,abs ⇌ 2Hsurf+ + 2Och,abs + 2eelectrode
− (2.37)
3. Absorption/desorption of oxygen from the surface:
Och,abs ⇌ O2surf ⇌ O2(g) (2.38)
Furthermore, both of the pathways follow the same path of proton transportation:
1. Diffusion of protons, from the surface to bulk or surface to TPB:
Hsurf+ ⇌ Hbulk
+ or Hsurf+ ⇌ HTPB
+ (2.39)
2. Charge transfer of protons from the electrode to the electrolyte:
HBulk/TPB+ ⇌ HElectrolyte
+ (2.40)
22
The reaction rate for each process depends on different factors like involved species, electrode
properties, active reaction sites and geometry. All the reaction steps are considered to be in
equilibrium when a current flows through the electrochemical cell, except the rate-determining
step (RDS). The RDS is known to be the slowest step of the processes and cause an
overpotential with a related polarisation resistance, which determines the overall reaction rate.
2.5 Kinetics of electrode reactions
2.5.1 Activation Energy
Whenever a Faradaic reaction takes place on a surface, interface or in a solution, there is an
energy barrier to overcome. Furthermore, experiments have shown that most rate constants vary
with temperature. This behaviour was first recognised by Arrhenius, and the proposed that the
rate constant ofa reaction is dependent on the energy barrier and the temperature:
𝑘 = 𝐴0𝑒
−(𝐸A𝑅𝑇
)
(2.41)
The equation is known as the Arrhenius equation, where EA is the activation energy and A0 is
known as the pre-exponential factor. The exponential factor expresses the probability of
surmounting the activation energy, whereas the pre-exponential factor is related to the
frequency of attempts of the reaction, thus also known as the frequency factor.
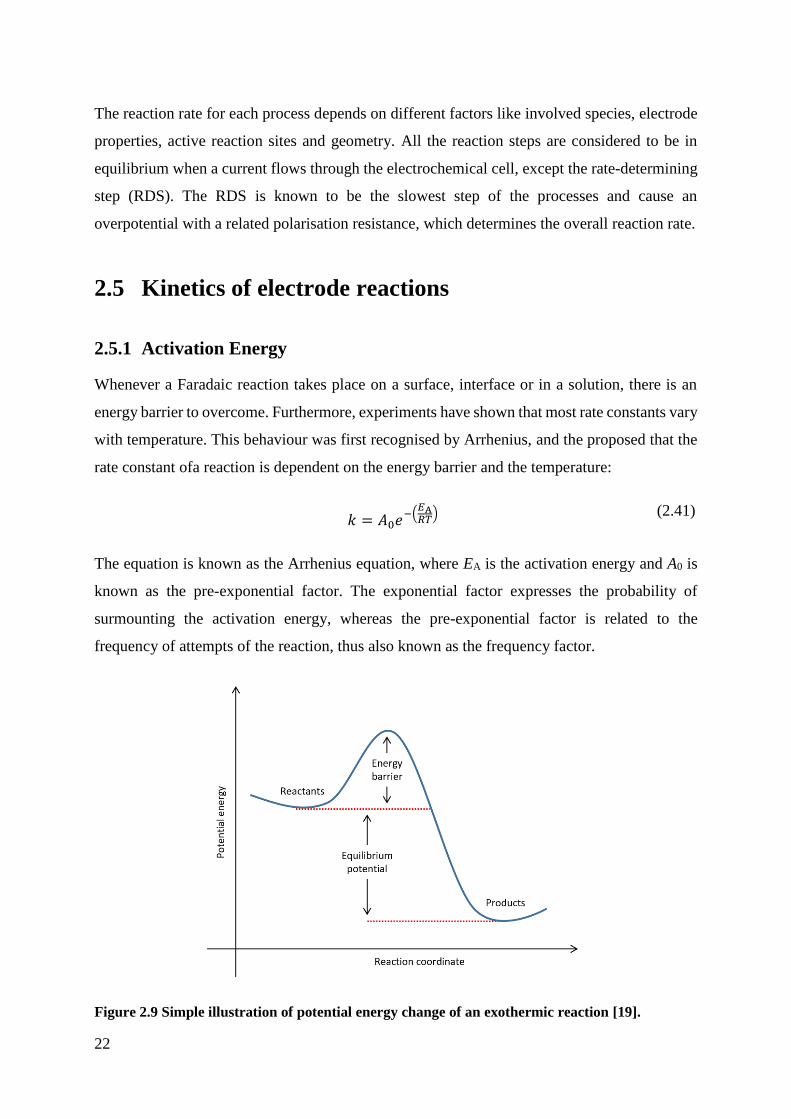
Figure 2.9 Simple illustration of potential energy change of an exothermic reaction [19].

23
The idea of activation energy has led to the illustration of reaction paths in terms of potential
energy along a reaction coordinate, as illustrated in Figure 2.9. The height of the energy barrier
is the activation energy of the reaction. In general, the reaction coordinate shows the progress
of a favoured path for a chemical reaction.
2.5.2 Rate of Charge Transfer Electrode Processes
The charge transfer processes, as mentioned earlier, include electron transfer and transfer of
charge species over an interface. The rate of the charge transfer processes is dependent on the
potential difference at the interface and can, therefore, be related to the Faraday current. This
section is based on [19] and [16].
Faradaic current is directly proportional to the rate of an electrochemical reaction. For
electrodes, the reactions are known to be heterogeneous, as the reaction occurs only at the
electrode surface or phase boundaries. Hence, the rate depends on the mass transfer to the
electrode, surface effects and kinetic limitations. Furthermore, the reaction rate (r) is described
in units of mol/s per unit area:
𝑟 =
𝑖
𝑛𝐹𝐴=
𝑗
𝑛𝐹
(2.42)
where j is the current density (A/cm2), n is the stoichiometric number of electrons consumed
in the reaction and F is the Faraday's constant.
When considering reversible electrochemical reactions, there is a forward and a backward
reaction, also known as a cathodic and anodic reaction depending on the reaction direction. The
reaction rate for the direction (d) can then be written as:
𝑟𝑑 = 𝑘𝑑𝑎𝑖 =
𝑗𝑑𝑛𝐹
(2.43)
where kd is the rate constant for the given direction, a is the activity of the species (i) and 𝑗𝑑 is
the current densite for the direction. The current density for the reaction can then be written as:
𝑗 = 𝑗𝑐 − 𝑗𝑎 = 𝑛𝐹(𝑘𝑐𝑎𝑖 − 𝑘𝑎𝑎𝑖) (2.44)
where a and c stands for anodic and cathodic direction, respectively.
24
The charge transfer reaction between the electrode and the electrolyte can be seen as a single
charge reaction, where the proton needs to overcome an energy barrier to move across the
interface. When the reaction is running in fuel cell mode, as shown in Reaction 2.40, the forward
reaction becomes where the proton moves from the electrolyte over to the TPB, which is the
cathodic reaction. Hence, the backward reaction becomes the anodic contributions, and the net
current density for the charge transfer reaction becomes:
𝑗𝑐𝑡 = 𝑗𝑐 − 𝑗𝑎 = 𝑛𝐹(𝑘𝑐𝑎Hely+ − 𝑘𝑎𝑎HTPB
+ ) (2.45)
Since the activity of protons is in equilibrium with the atmospheric pressure (pO2 and pH2O),
the rate depends on the potential difference between the TPB and electrolyte.
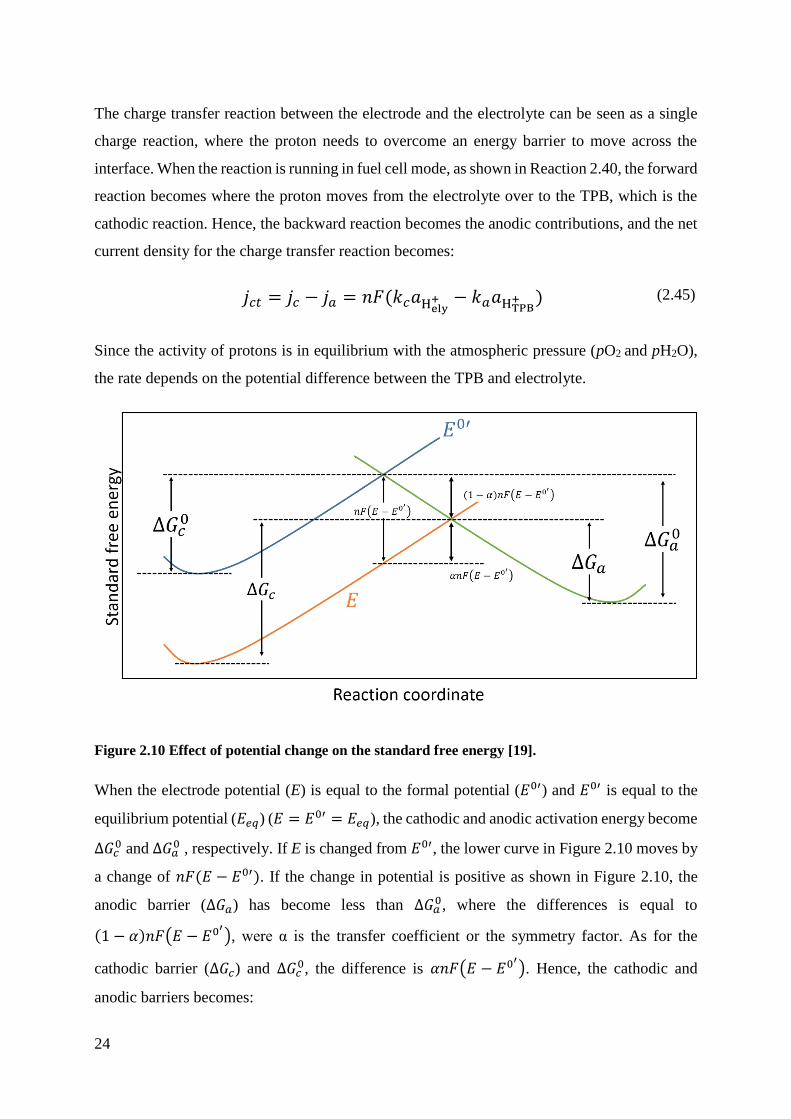
Figure 2.10 Effect of potential change on the standard free energy [19].
When the electrode potential (E) is equal to the formal potential (𝐸0′) and 𝐸0′ is equal to the
equilibrium potential (𝐸𝑒𝑞) (𝐸 = 𝐸0′ = 𝐸𝑒𝑞), the cathodic and anodic activation energy become
Δ𝐺𝑐0 and Δ𝐺𝑎
0 , respectively. If E is changed from 𝐸0′, the lower curve in Figure 2.10 moves by
a change of 𝑛𝐹(𝐸 − 𝐸0′). If the change in potential is positive as shown in Figure 2.10, the
anodic barrier (Δ𝐺𝑎) has become less than Δ𝐺𝑎0, where the differences is equal to
(1 − 𝛼)𝑛𝐹(𝐸 − 𝐸0′), were α is the transfer coefficient or the symmetry factor. As for the
cathodic barrier (Δ𝐺𝑐) and Δ𝐺𝑐0, the difference is 𝛼𝑛𝐹(𝐸 − 𝐸0
′). Hence, the cathodic and
anodic barriers becomes:
25
Δ𝐺𝑎 = Δ𝐺𝑎0 + 𝛼𝑛𝐹(𝐸 − 𝐸0′) (2.46)
Δ𝐺𝑎 = Δ𝐺𝑎0 − (1 − 𝛼)𝑛𝐹(𝐸 − 𝐸0′) (2.47)
The rate constant can then be assumed to have an Arrhenius form and be expressed as:
𝑘𝑐 = 𝐴0,𝑐 exp (−
Δ𝐺𝑐𝑅𝑇
) = 𝐴0,𝑐 exp (−Δ𝐺𝑐
0
𝑅𝑇) 𝑒𝑥𝑝 (
−𝛼𝑛𝐹(𝐸 − 𝐸0′)
𝑅𝑇)
(2.48)
𝑘𝑎 = 𝐴0,𝑎 exp (−
Δ𝐺𝑎𝑅𝑇
) = 𝐴0,𝑎 exp (−Δ𝐺𝑎
0
𝑅𝑇) 𝑒𝑥𝑝 (
(1 − 𝛼)𝑛𝐹(𝐸 − 𝐸0′)
𝑅𝑇)
(2.49)
The first part in these equations includes the pre-exponential and standard Gibbs free energy,
which are independent of potential changes and can be written as 𝑘𝑐0 and 𝑘𝑎
0. When considering
the interface is in equilibrium, 𝐸 = 𝐸0′ and 𝑘𝑐0 = 𝑘𝑎
0 = 𝑘𝑐𝑡0 , then by inserting these relations
into Equation 2.45, the net current density becomes:
𝑗𝑐𝑡 = 𝑗𝑐 + 𝑗𝑎 = 𝑛𝐹𝑘𝑐𝑡0 [𝑎Hely
+ 𝑒𝑥𝑝 (−𝛼𝑛𝐹(𝐸 − 𝐸0
′)
𝑅𝑇) − 𝑎HTPB
+ 𝑒𝑥𝑝 ((1 − 𝛼)𝑛𝐹(𝐸 − 𝐸0
′)
𝑅𝑇)]
(2.50)
In equilibrium, the net current density becomes zero, and the electrode is known to adopt a
potential based on the bulk concentration as imposed by the Nernst equation. The Equation 2.50
at zero current density and 𝑛 = 1 becomes:
𝐹𝑘𝑐𝑡
0 𝑎Hely+ 𝑒𝑥𝑝(
−𝛼𝐹(𝐸𝑒𝑞 − 𝐸0′)
𝑅𝑇) = 𝐹𝑘𝑐𝑡
0 𝑎HTPB+ 𝑒𝑥𝑝(
(1 − 𝛼)𝐹(𝐸𝑒𝑞 − 𝐸0′)
𝑅𝑇)
(2.51)
Since equilibrium applies, the bulk concentration of protons in the electrolyte (𝑎Hely+
∗ ) and TPB
(𝑎HTPB+
∗ ) are equal to the surface concentration:
𝑒𝑥𝑝 (𝐹(𝐸𝑒𝑞 − 𝐸0′)
𝑅𝑇) =
𝑎𝐻𝑒𝑙𝑦+
∗
𝑎𝐻𝑇𝑃𝐵+∗
(2.52)

26
However, there is still a Faradayc activity, which is known as the exchange current density (𝑗0),
which is equal in magnitude to 𝑗𝑐 or 𝑗𝑎. That is
𝑗0,𝑐𝑡 = 𝐹𝑘𝑐𝑡0 𝑎
Hely+
∗ exp(−𝛼𝐹 (𝐸𝑒𝑞 −𝐸0
′
)
𝑅𝑇)
(2.53)
When both sides of Equation 2.52 are raised to the power of – 𝛼 and substituted into 2.53, it
gives rise to:
𝑗0,𝑐𝑡 = 𝐹𝑘𝑐𝑡0 𝑎∗
Hely+
(1−𝛼)𝑎∗HTPB
+𝛼
(2.54)
The exchange current density is proportional to the standard rate constant 𝑘𝑐𝑡0 . Hence, a greater
value of 𝑗0 yields a small overpotential needed to reach a sizeable current flow. On the contrary,
a large overpotential is needed for small values of 𝑗0 for reaching a sizeable current flow. When
𝛼 = ½ in Equation 2.54, the exchange current density increases with an order of ½, with
increasing concentration (activity) of protons in the electrolyte and the TPB.
With 𝑗0 the current density can be described in terms of the potential difference from the
equilibrium potential, rather than the formal potential, by the following equation:
𝑗𝑐𝑡 = 𝑗0,𝑐𝑡 [𝑎Hely+
𝑎Hely+
∗ exp (−𝛼𝐹𝜂
𝑅𝑇) −
𝑎HTPB+
𝑎HTPB+
∗ exp ((1−𝛼)𝐹𝜂
𝑅𝑇) ]
(2.55)
where 𝜂 = 𝐸 − 𝐸𝑒𝑞.
If there are no mass transfer effects to the electrode, meaning the surface concentration does
not differ from the bulk, Equation 2.55 becomes
𝑗𝑐𝑡 = 𝑗0,𝑐𝑡 [exp (
−𝛼𝐹𝜂
𝑅𝑇) − exp (
(1 − 𝛼)𝐹𝜂
𝑅𝑇) ]
(2.56)
and gives the current-potential relation known as the Butler-Volmer equation. The Butler-
Volmer equation describes how the current density is proportional to the overpotential, which
is required to overcome the energy barrier.
27
If the overpotential is sufficiently small, a Taylor expansion of the exponential term of the
Butler-Volmer equation can be made, and the equation can be reexpressed as
𝑗𝑐𝑡 = −
𝑗0,𝑐𝑡𝐹𝜂
𝑅𝑇
(2.57)
The negative ratio between the overpotential and the charge transfer current density gives rise
to a resistance known as the charge transfer resistance
Rct = −
𝜂
𝑗𝑐𝑡=
𝑅𝑇
𝐹𝑗0,𝑐𝑡
(2.58)
The equation shows that the charge transfer resistance approaches zero at larger 𝑗0,𝑐𝑡, i.e. greater
charge transfer kinetics.
However, for large values of overpotential, either positive or negative, one of the exponential
terms becomes negligible. When a large cathodic overpotential arises (exp (−𝛼𝐹𝜂
𝑅𝑇) ≪
exp ((1−𝛼)𝐹𝜂
𝑅𝑇)), the Butler-Volmer equation becomes:
jct = 𝑗0,𝑐𝑡𝑒
((1−𝛼)𝐹𝜂
𝑅𝑇)
(2.59)
Or,
𝜂 =
𝑅𝑇
(1 − 𝛼)𝐹ln 𝑗𝑐𝑡 −
𝑅𝑇
(1 − 𝛼)𝐹ln 𝑗0,𝑐𝑡
(2.60)
The last equation is known as the Tafel equation, which gives raise for the Tafel slope trough
𝜂 = 𝑎 + 𝑏 log 𝑗, wherein here:
𝑎 = −
2.303𝑅𝑇
(1 − 𝛼)𝐹log 𝑗0𝑐𝑡 𝑏 =
2.303𝑅𝑇
(1 − 𝛼)𝐹
(2.61)
The flatter the Tafel-slope, the better electrode kinetics, and less overpotential needed to reach
mass transfer limitation, also known as mass transfer polarisation.
28
2.5.3 Rate of Mass Transfer Electrode Processes
As mentioned earlier, the mass transfer processes consist of diffusion of species and absorption
and desorption of them. The rate of mass transfer is dependent on the rate constant and
concentration of the different contribution that leading to mass transfer limitation for the
positrode.
For PCECs, the first step in the electrode reaction, as shown earlier, is the exchange of water
vapour (Reaction 2.30) on the surface. When expressing the rate of adsorption with Langmuir
isotherm, the surface is thought to have a certain amount of active sites per unit area. The
assumptions that all sites are equivalent and that adsorption only proceeds to a monolayer
coverage are needed for the Langmuir isotherm model to be valid.
The fraction coverage (θ) of the sites is the occupied sites divided by the viable sites on the
surface. When conditions are isotherm, the rate of assiociativ adsorption of water vapour on the
electrode surface becomes:
𝑟 = 𝑝H2O𝑘ads(1 − 𝜃) − 𝑘𝑑𝑒𝑠𝜃 (2.62)
When the system is in equilibrium, the absorption rate is equal to the desorption rate:
𝑝H2O𝑘ads(1 − 𝜃) = 𝑘𝑑𝑒𝑠𝜃 (2.63)
The equilibrium constant (Keq) for the reaction is known to be kads/kdes:
𝜃 = Keq𝑝H2O (2.64)
The equation above can be rewritten as:
𝜃 =
Keq𝑝H2O
1 + Keq𝑝H2O
(2.65)
Hence, when the surface is mostly covered 𝜃 ≈ 1. However, under diluted conditions, the
numbers of viable sites is known to by significant larger than the number of occupied sites, and
θ can be neglected.

29
After absorption, charge transfer follows and then diffusion of the species. However, diffusion
is a physical process caused by a concentration gradient, as mention earlier. Diffusion is,
therefore, not a chemical reaction as it is not affected by potential changes and the particle flux
of diffusion is given by Fick’s first law, shown in Equation 2.18.
2.6 Electrochemical Impedance Spectroscopy (EIS)
EIS is an analytical tool used to study electrochemical kinetics at electrode interfaces and
determination of conducting mechanisms in various materials. The following information in
this section is based on [20, 21].
2.6.1 Impedance and Admittance
Under experimental circumstances, impedance is measured by using an alternating current
(AC) voltage signal (U), which can be described as a sinusoidal function over time t:
U(t) = U0 sin(2𝜋𝑓t) = U0 sin(ωt) (2.66)
where U0 usually is a small amplitude given in volt, applied with a frequency f which can be
expressed as the angular frequency ω= 2πf. When a sinusoidal voltage is applied, the current
will response as a sinusoid function with the same frequency only with a phase shift (ϕ). The
current signal (I(t)) will, together with the phase shift, have a different amplitude, I0:
I(t) = I0 sin(2𝜋𝑓t + ϕ) = I0sin (ωt + ϕ) (2.67)
This phase shift is a result of capacitive and resistive components in the circuit.
With the ratio of input voltage and the measured current the complex impedance of the system
can be calculated by Ohm's law:
𝑍′ =
𝑈(𝑡)
𝐼(𝑡)=
U0 sin(ωt)
I0sin (ωt + ϕ)= 𝑍0
sin(ωt)
sin (ωt + ϕ)
(2.68)
By using Euler's relationship:
e𝑗ϕ = cosϕ + 𝑗sinϕ (2.69)
30
the impedance can be express a complex function, where the potential and current are described
as:
U(t) = U0e𝑗ωt (2.70)
I(t) = I0e𝑗ωt−𝑗ϕ (2.71)
By combining equation 2.68, 2.70 and 2.71:
Z′ = Z0e𝑗𝜙 = Z0(cosϕ + 𝑗sinϕ) = Zreal + 𝑗Zim (2.72)
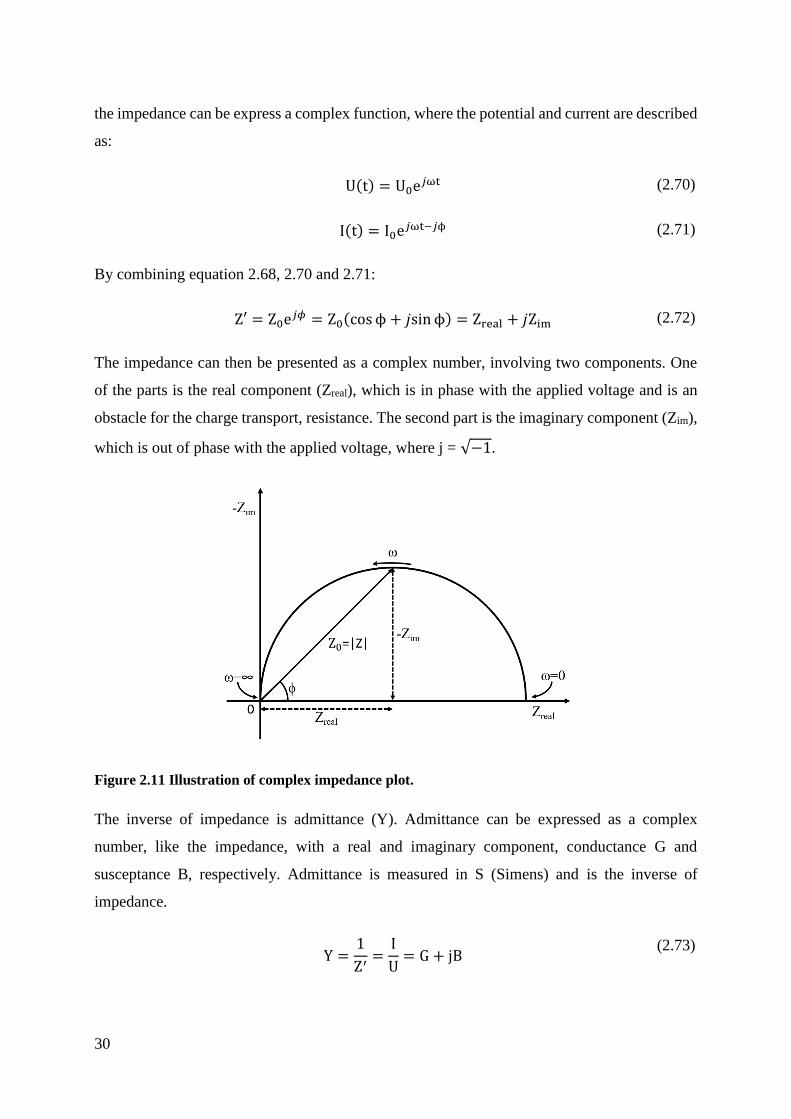
The impedance can then be presented as a complex number, involving two components. One
of the parts is the real component (Zreal), which is in phase with the applied voltage and is an
obstacle for the charge transport, resistance. The second part is the imaginary component (Zim),
which is out of phase with the applied voltage, where j = √−1.
Figure 2.11 Illustration of complex impedance plot.
The inverse of impedance is admittance (Y). Admittance can be expressed as a complex
number, like the impedance, with a real and imaginary component, conductance G and
susceptance B, respectively. Admittance is measured in S (Simens) and is the inverse of
impedance.
Y =
1
Z′=
I
U= G + jB
(2.73)
31
2.6.2 Equivalent Circuit and Circuit Elements
An equivalent circuit is a tool used to analyse the EIS measurements, which can describe the
electrochemical processes taking place. To describe EIS measurement with an equivalent
circuit, there are three circuit elements that are used: resistor, capacitor and inductor.
Resistor
For an ideal resistor, the voltage across it will give rise to a current instantly and therefore
considered to be in phase with each other (ϕ=0). Hence, the impedance can be described as a
real part (resistance) that is given by Ohm's law:
𝑍𝑅 = 𝑅 =
𝑈
𝐼=𝑈0sin (𝜔𝑡)
𝐼0sin (𝜔𝑡)=𝑈0𝐼0
(2.74)
Capacitor
A capacitor consists of two parallel plates, which are separated by a vacuum or a dielectric
material. When voltage is applied, charge is built up, and the ability to store charge depends on
the capacitance, C, where the general term of capacitance is:
C = 휀0휀𝑟
A
L
(2.75)
where A is the area of the plates, L is the distance between them and ε0 and εr are the vacuum
– and relative permittivity, respectively. When an alternating voltage is applied over an ideal
capacitor, a phase-shift current will be produced with 𝜙 = 𝜋/2. Therefore, the impedance of a
capacitor will consist of one frequency-dependent imaginary part:
Zc =
1
j𝜔C
(2.76)
where C is the capacitance of the capacitor with the units given in farad (F).

32
Inductor
In contrast to a capacitor, which is an ideal insulator, the inductor is an ideal conductor. When
an alternating voltage is applied over the inductor, a phase-shift current is produced with ϕ=π/2.
The impedance of an inductor consists then of one frequency-dependent imaginary part:
𝑍𝐿 = j𝜔𝐿 (2.77)
Where L is the inductance of the inductor and is given with the unit henry (H).
Constant Phase Element (CPE)
A constant phase element (CPE) is a model used to describe non-ideal capacitor behaviour. A
CPE can be recognised as a depressed semi-circle in the EIS measurements, and is a
combination of resistance and capacitance. The impedance of this element is:
ZCPE =
1
𝑌0(j𝜔)𝑛
(2.78)
where the parameter n is related to the phase angle, and typically 0 ≤ 𝑛 ≤ 1. When 𝑛 = 1,
Y0 acts like a pure capacitor, while for 𝑛 ≈ 0 the impedance acts as a pure resistor. The effective
capacitance is calculated by:
CCPE = 𝑌0
1𝑛𝑅𝑃
(1𝑛−1)
(2.79)
where the Rp is the corresponding polarisation resistance.
Randles circuit
The most common equivalent circuit used for simulating electrochemical interfaces is the
Randles circuit. The circuit typically consists of an electrolyte resistor (R1) with its
corresponding capacitor (CPE1) in series with the polarisation contribution from the electrode,
which is generally, charge transfer resistance (R2) and mass transfer resistance (R3), and CPE2
and CPE3 are then the respective capacitance, as seen in Figure 2.12.

33
Figure 2.12 Randles type of circuit used for determining electrolyte (R1) and electrode
contributions (R2 and R3).
2.6.3 Impedance spectra
EIS sweep contains information of the different contribution from the electrochemical cell. The
different contributions are effected at different frequencies. Hence, a sweep is measured over a
broad range of frequencies to cover all the contributions. The measurement is represented
graphically by a Nyquist plot. By using a suitable equivalent circuit, the Nyquist plot can be
simulated, and the values of interest can be extracted.
Nyquist plot
The most common graphical representation of impedance spectra is known as a Nyquist plot.
The plot presents a graphical representation of both real and imaginary components.
Figure 2.13 Illustration of a Nyquist plot, where the first semicircle is bulk or ohmic contribution
at the higher frequencies, while the second and third are electrode contributions.
34
3 Literature
3.1 Ceramic Electrochemical Cells
Ceramic electrochemical cells (CECs) have shown several attractive advantages such as fuel
flexibility, high fuel to electricity conversion, low environmental impact, and the absence of
precious-metal catalysts [22-25]. The first generation of conventional CECs, SOECs, based on
yttria-stabilised ZrO2 (YSZ) electrolyte have a high operating temperature between 700 ℃ and
1000 ℃. High operating temperatures of SOEC to achieve sufficient ionic conductivity and
fuel utilisation result in several challenges connected to thermal stressing and limited
compatible materials [3, 25, 26]. SOECs with samarium-doped ceria (SDC) electrolyte reported
performance temperatures as low as ~ 600 ℃ [27, 28], but the performance drops rapidly with
decreasing temperature due to the high activation energy for oxygen-ion conduction. In
comparison, PCECs offer higher performance at a lower operating temperature due to the low
Ea for proton conduction [29-31].
For SOECs, the fuel gas (H2, CH4) is diluted at the negatrode by the products or the reactants
when using it in a fuel cell - or electrolyse mode, respectively [17, 26, 32]. For PCECs, however,
the fuel at the negatrode will not be diluted, due to the production and usage of water happening
at the positrode side.
The negatrode half-cell reaction for PCECs:
H2 (g) ⇌ 2H+ + 2e− (3.1)
The positrode half-cell reaction for PCECs:
O2(g) + 4H+ + 4e− ⇌ 2H2O (g) (3.2)
This property of fuel consumption at the negatrode and production at the positrode facilitates a
higher fuel utilisation [33, 34], in comparison to SOECs.
35
3.1.1 Proton Ceramic Electrolytes
The first proton conduction at high temperatures was reported by Iwahara et al. [35] in a study
of SrCeO3-based oxides, in the early 1980s. From then on, perovskite-type oxides based on
ABO3 (A=Sr, Ba, Ca. B=Ce, Zr) [36-38] have been extensively studied for proton conduction
and electrochemical applications such as fuel cells, electrolysers, hydrogen separation, etc. [39].
BaCeO3- and BaZrO3-based materials have shown to be benchmark materials among numerous
of studied oxides [40-43], due to their high proton conductivity. Furthermore, these materials
have tendencies to become mixed ionic conductors (H+/O2-) when they are exposed to a
hydrogen-containing atmosphere and air on separate sides at high temperatures [44, 45].
The presence of oxygen vacancies (vO••) in the oxide structure promotes, to a small extent, proton
conduction in oxides. The presence of oxygen vacancies can be achieved by substitutional
acceptor doping (AB′ ) of the material structure, as in Equation 3.3. Often acceptor doped B-sites
are charge-compensated by oxygen vacancies, holes or both, depending on the atmosphere
constitution and temperature.
[AB′ ] = 2[vO
••] + p (3.3)
In a study by Iwahara et al. [46], BaCeO3 was acceptor doped with different trivalent cations,
to show the effect of proton transport compared to the ionic radius of dopant M in
(BaCe0.9M0.1O3-δ). This study shows that the proton transport decreased with the increase of the
ionic radius of M cation. The increase of the cation radius resulted in the orthorhombic structure
becoming asymmetric, which promotes oxide ion transport rather than proton transport.
Furthermore, Kreuer et al. [47, 48] studied the effect of M cation concentration and proton
transport. The study revealed that proton mobility was drastically reduced with the increase of
acceptor concentration, resulting in an increase of the basicity of the oxygens in the structure
and therefore to stronger binding of protons to the oxygens. Results form quasi-elastic neutron
scattering suggested that acceptor dopants may act as direct trap sites for protons [47].
Furthermore, proton conductivities for various oxides have been calculated from available data
by Norby & Larring [29]. These results were summarised and illustrated over a range of
temperatures by Kreuer [45], shown here in Figure 3.1.

36
Figure 3.1 Proton conductivities for various oxides as a function of temperature [45].
Based on these studies, BaCeO3- and BaZrO3-based oxides were identified to be the most
promising electrolyte for commercial usage, due to their high protonic conductivity. However,
BaCeO3-based oxides suffer from chemical instability when they are exposed to atmospheres
containing CO2 and water vapour, which react with the basic-cation to form BaCO3 and
Ba(OH)2 [49, 50]. Furthermore, BZY has shown poor proton conductivity due to high grain
boundary resistance and poor sinterability [51, 52]. In 2000 Katahira et al. [53] reported that
Zr-substituted BaCeO3 (BaCe0.9-xZrxY0.1O3-δ) (BZCY) improved the chemical stability against
CO2 when the Zr concentration was 40 % or higher (x ≥ 0.4). A later study has also shown
improved chemical stability in water vapour [54]. However, with an increase of Zr, the protonic
conductivity decreases, together with increasing mixed protonic, oxide and electronic
conduction at high temperatures [53, 54]. Despite the decreased protonic transport, BZCY has
enticed much interest as material for PCECs, SOECs and other applications due to its stability
[54-57].
37
3.2 Positrode Materials for PCECs
Although considerable research has been conducted in the development of materials as ceramic
electrolytes for PCECs, the development of positrode materials has lacked behind. Several
attempts to introduce positrode materials from SOECs have shown the necessity to take the
reaction occurring at the positrode (Equation 3.2) into account.
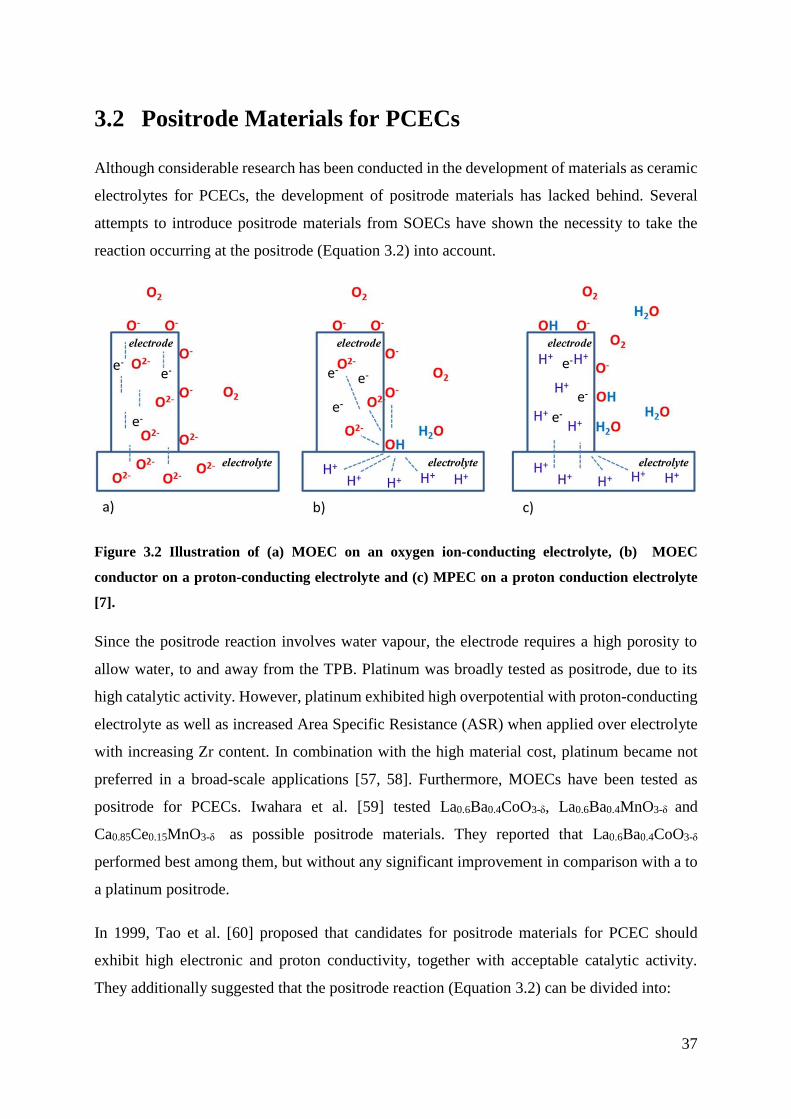
Figure 3.2 Illustration of (a) MOEC on an oxygen ion-conducting electrolyte, (b) MOEC
conductor on a proton-conducting electrolyte and (c) MPEC on a proton conduction electrolyte
[7].
Since the positrode reaction involves water vapour, the electrode requires a high porosity to
allow water, to and away from the TPB. Platinum was broadly tested as positrode, due to its
high catalytic activity. However, platinum exhibited high overpotential with proton-conducting
electrolyte as well as increased Area Specific Resistance (ASR) when applied over electrolyte
with increasing Zr content. In combination with the high material cost, platinum became not
preferred in a broad-scale applications [57, 58]. Furthermore, MOECs have been tested as
positrode for PCECs. Iwahara et al. [59] tested La0.6Ba0.4CoO3-δ, La0.6Ba0.4MnO3-δ and
Ca0.85Ce0.15MnO3-δ as possible positrode materials. They reported that La0.6Ba0.4CoO3-δ
performed best among them, but without any significant improvement in comparison with a to
a platinum positrode.
In 1999, Tao et al. [60] proposed that candidates for positrode materials for PCEC should
exhibit high electronic and proton conductivity, together with acceptable catalytic activity.
They additionally suggested that the positrode reaction (Equation 3.2) can be divided into:

38
1
2O2 (g) + 2e− ⇌ O2−
(3.4)
2H+ + O2− ⇌ H2O (g) (3.5)
Reaction 3.4 occurs at the surface of the positrode while Reaction 3.5 occurs at the TPB when
the positrode is a metal or MOEC. However, positrode materials that obtain MPEC properties
would extend the TPB zone to the surface area of the positrode and thus lead to faster kinetics
of the electrochemical processes, as shown in Figure 3.2 c). Hence, MPEC materials have
captured great interest, as promising positrode materials for PCECs.
3.2.1 Mixed Protonic and Electronic Conductors (MPEC)
In order for oxides to have proton conductivity, the oxide requires protonic defects in the lattice
structure. The concentration of these protonic defects is related to the ability of water uptake of
the oxide, i.e. hydration. Protonic defects in oxides are preferably not occupying a lattice site,
but rather to stick to an oxide ion to form hydroxides on oxygen sites (OHo•). Protonic defects
in oxides have shown to either appear due to hydration (Equation 2.11) or hydrogenation
(Equation 2.16).
Perovskite (ABO3) structured materials have shown to fulfil these properties, as the B-site
cations are generally mixed-valent transition metals which allow for oxygen flexibility,
electronic conductivity and catalytic activity. The A-site cations are usually alkaline earth or
rare earth metal, that provides the necessary basicity to stabalise protons together with
substantial higher valent cation to introduce oxygen vacancies [61-63]. Double perovskite
(AA/BB*O6) materials have shown to be sufficient positrode candidates as well, with the large
variety of cations on A-site and B-site cation redox capability. The different A-sites are
commonly a lanthanide and alkali earth mix, that form partial vacant oxygen sublattices [64-
68].
The study of Zohurian et al. [69] shows that the basicity of the oxides has a significant effect
on the proton uptake of oxides. In the study, several compositions in the perovskite family (Ba,
Sr, La)(Fe, Co, Zn, Y)O3-δ, which were thought to be potential positrode materials for PCFCs
were studied for their water uptake by Thermogravimetric Analysis (TGA). The study revealed
that an increase of Ba on A-site increased the proton concentration. However, a small amount

39
of substitutional La with Ba was necessary for the stability of the cubic perovskite structure.
The study also demonstrated that the basicity of the B-site cations is key for proton uptake for
the oxide, as shown in Figure 3.3.
Figure 3.3 Proton uptake for oxides shown in mol % (z-axis) at 250 ℃ and pH2O ≈ 0.016 atm. a)
Variation of La and Sr content on A-site. b) Effect of substitution of Zn and Co on the B-site [69].
3.2.2 BaGd0.8La0.2Co2O6-δ (BGLC)
In 2015 BaGd0.8La0.2Co2O6-δ (BGLC82) was proposed as a MPEC by Strandbakke et al. [7].
BGLC, together with BaPrCo2O6-δ (BPC), BaGdCo1.8Fe0.2O6-δ (BGCF) and BaPrCo1.4Fe0.6O6-δ
(BPCF) were tested for hydration properties, oxygen stoichiometry and performance as
positrodes on BaZr0.7Ce0.2Y0.1O3-δ (BZCY72) electrolyte. All of the samples have the same
crystal structure as a double perovskite illustrated in Figure 3.4.
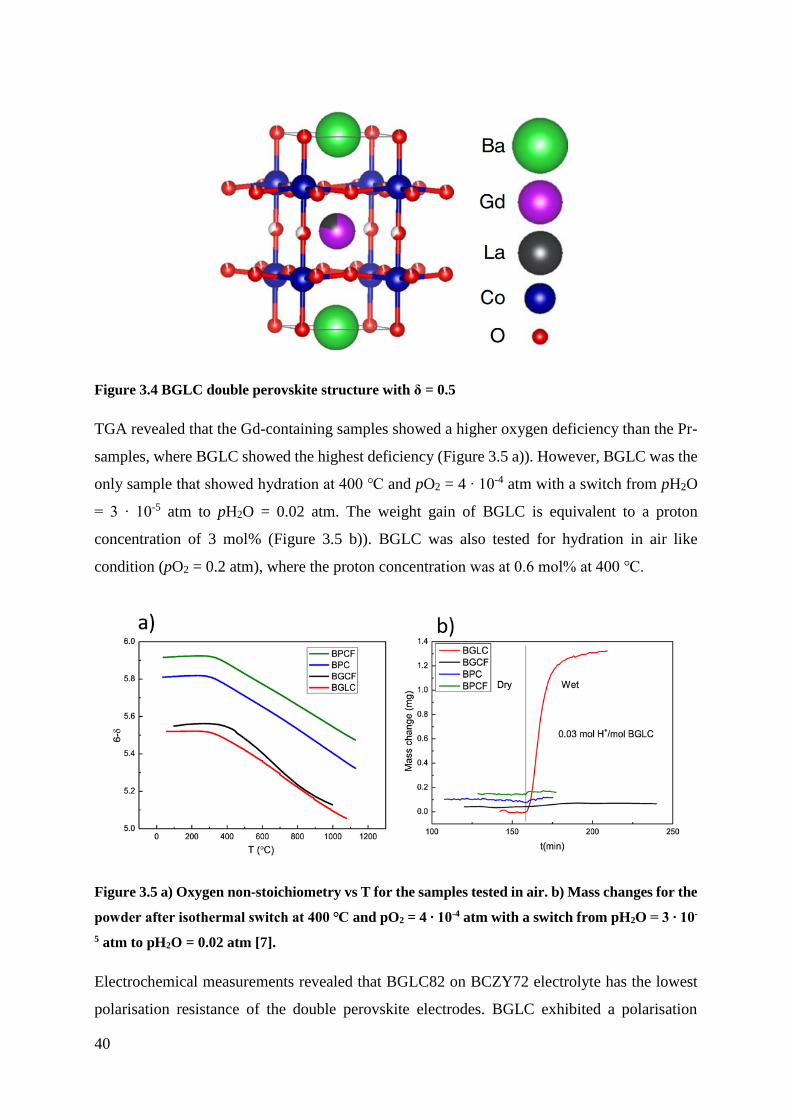
40
Figure 3.4 BGLC double perovskite structure with δ = 0.5
TGA revealed that the Gd-containing samples showed a higher oxygen deficiency than the Pr-
samples, where BGLC showed the highest deficiency (Figure 3.5 a)). However, BGLC was the
only sample that showed hydration at 400 ℃ and pO2 = 4 ‧ 10-4 atm with a switch from pH2O
= 3 ‧ 10-5 atm to pH2O = 0.02 atm. The weight gain of BGLC is equivalent to a proton
concentration of 3 mol% (Figure 3.5 b)). BGLC was also tested for hydration in air like
condition (pO2 = 0.2 atm), where the proton concentration was at 0.6 mol% at 400 ℃.
Figure 3.5 a) Oxygen non-stoichiometry vs T for the samples tested in air. b) Mass changes for the
powder after isothermal switch at 400 ℃ and pO2 = 4 ‧ 10-4 atm with a switch from pH2O = 3 ‧ 10-
5 atm to pH2O = 0.02 atm [7].
Electrochemical measurements revealed that BGLC82 on BCZY72 electrolyte has the lowest
polarisation resistance of the double perovskite electrodes. BGLC exhibited a polarisation
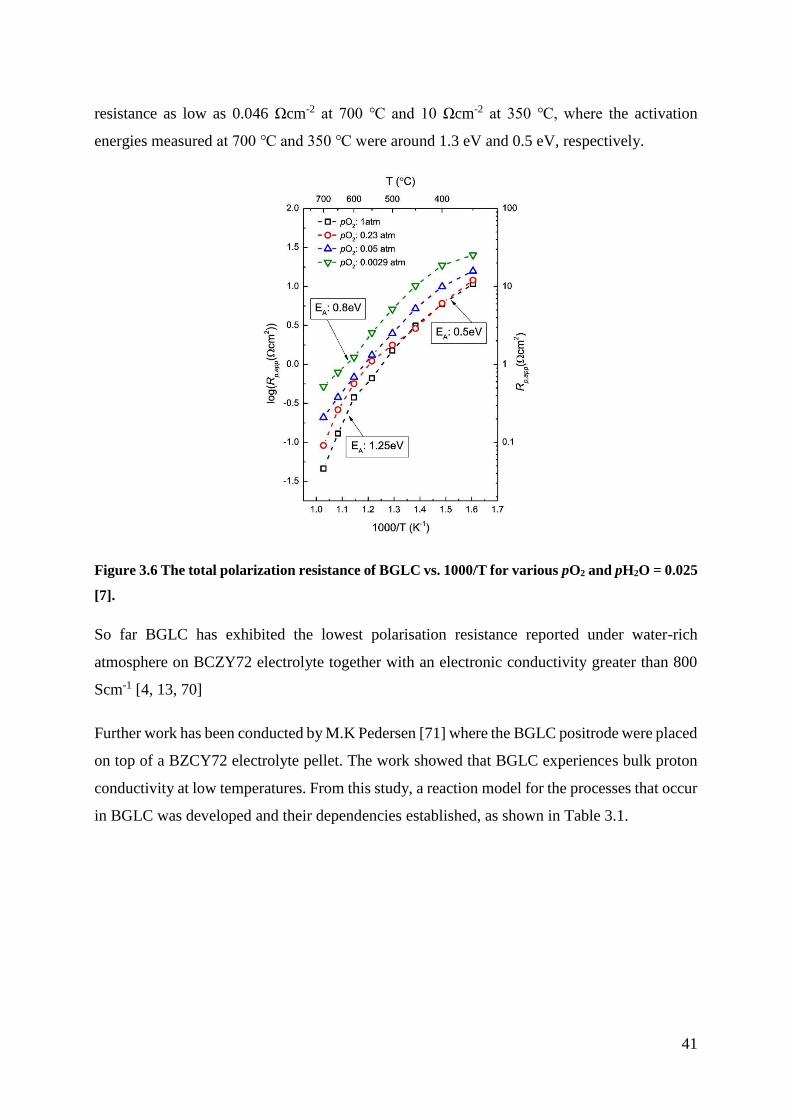
41
resistance as low as 0.046 Ωcm-2 at 700 ℃ and 10 Ωcm-2 at 350 ℃, where the activation
energies measured at 700 ℃ and 350 ℃ were around 1.3 eV and 0.5 eV, respectively.
Figure 3.6 The total polarization resistance of BGLC vs. 1000/T for various pO2 and pH2O = 0.025
[7].
So far BGLC has exhibited the lowest polarisation resistance reported under water-rich
atmosphere on BCZY72 electrolyte together with an electronic conductivity greater than 800
Scm-1 [4, 13, 70]
Further work has been conducted by M.K Pedersen [71] where the BGLC positrode were placed
on top of a BZCY72 electrolyte pellet. The work showed that BGLC experiences bulk proton
conductivity at low temperatures. From this study, a reaction model for the processes that occur
in BGLC was developed and their dependencies established, as shown in Table 3.1.

42
Table 3.1 Reaction model for BGLC as positrode with bulk diffusion of protons. The m and n are
the oxygen and water vapour dependency, respectively, if the reaction is rate-determining [71].
Step Elementary reaction Process m n
1 O2(g) + 2BGLC∗ ↔ 2OBGLC(ads) Exchange of oxygen gas 1 0
2 OBGLC(ad) + 2e− ↔ OBGLC(ads)2− Electron transfer ½ 0
3 HBZCY+ ↔ HBGLC(bulk)
+ Charge transfer 0 ¼
3a HBGLC(bulk)+ ↔ HBGLC(surf)
+ Bulk diffusion of protons -- --
4 OBGLC(ads)2− + HBGLC(surf)
+ ↔ OHBGLC(ads)− Proton exchange ¼ ½
5 OHBGLC(ads)− + HBGLC(surf)
+ ↔ H2OBGLC(ads) Water formation/split 0 1
6 H2OBGLC(ads) ↔ H2O (g)+ BGLC∗ Exchange of water vapour 0 1
Total reaction: O2(g) + 2BGLC∗ + 4e− + 4H+ ↔ 2H2O (g) + 2BGLC
∗
Nevertheless, BGLC has been observed to segregate into two phases under 1.5 atm of steam
and at 600 ℃ to BaCoO3 and Ba1-xGd0.8La0.2+xCo2O6-δ [70], and M.K Pedersen's study
experienced seconde phases of Co oxides at the surface [71]. Hence, the stability of BGLC
might be questionable under operating conditions.
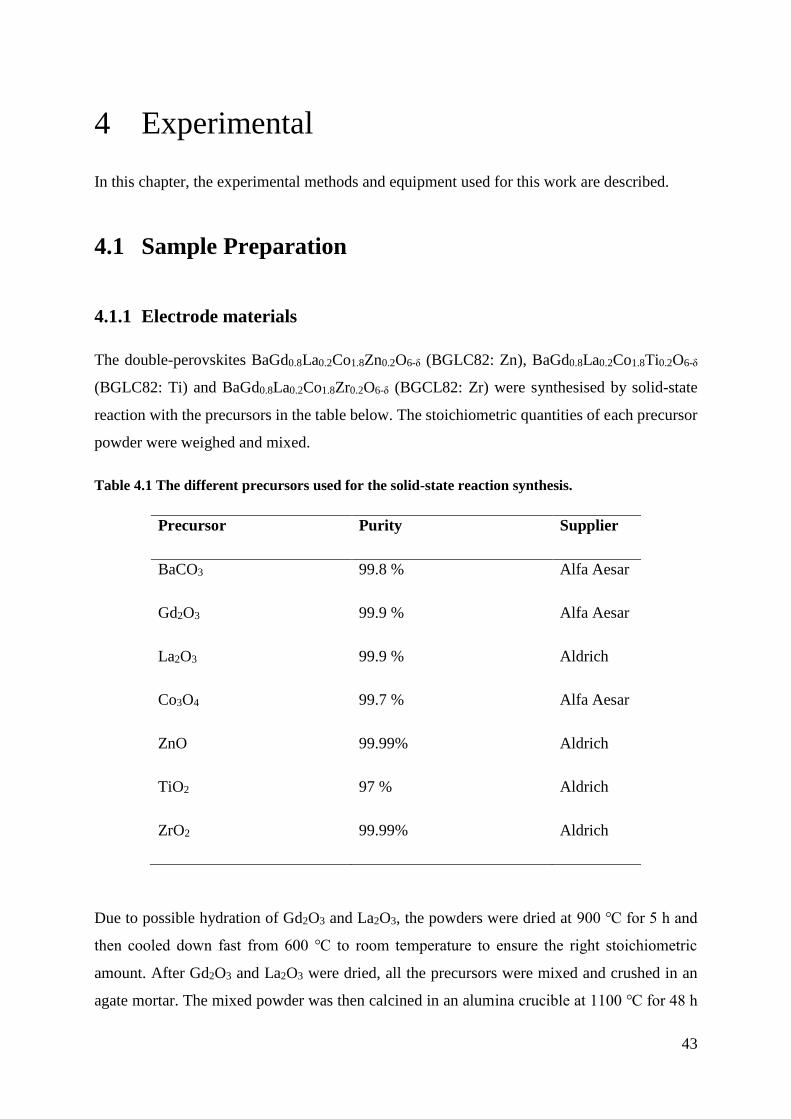
43
4 Experimental
In this chapter, the experimental methods and equipment used for this work are described.
4.1 Sample Preparation
4.1.1 Electrode materials
The double-perovskites BaGd0.8La0.2Co1.8Zn0.2O6-δ (BGLC82: Zn), BaGd0.8La0.2Co1.8Ti0.2O6-δ
(BGLC82: Ti) and BaGd0.8La0.2Co1.8Zr0.2O6-δ (BGCL82: Zr) were synthesised by solid-state
reaction with the precursors in the table below. The stoichiometric quantities of each precursor
powder were weighed and mixed.
Table 4.1 The different precursors used for the solid-state reaction synthesis.
Precursor Purity Supplier
BaCO3 99.8 % Alfa Aesar
Gd2O3 99.9 % Alfa Aesar
La2O3 99.9 % Aldrich
Co3O4 99.7 % Alfa Aesar
ZnO 99.99% Aldrich
TiO2 97 % Aldrich
ZrO2 99.99% Aldrich
Due to possible hydration of Gd2O3 and La2O3, the powders were dried at 900 ℃ for 5 h and
then cooled down fast from 600 ℃ to room temperature to ensure the right stoichiometric
amount. After Gd2O3 and La2O3 were dried, all the precursors were mixed and crushed in an
agate mortar. The mixed powder was then calcined in an alumina crucible at 1100 ℃ for 48 h

44
with a ramp rate of 150 ℃/h for heating and cooling. The calcined powder was then grinded
and calcined on more time.
The double–perovskite BGLC82: Zr was also synthesised by the sol-gel method with the
precursors in the table below. The stoichiometric quantities of each precursor powder were
weighed.
Table 4.2 The different precursors used for the sol-gel synthesis.
Precursor Purity Supplier
BaCO3 99.8 % Alfa Aesar
Gd(NO3)3·6H2O 99.99 % Aldrich
La(NO3)3·6H2O 98 % Fluka
Co(NO3)2·6H2O 99 % Sigma- Aldrich
Zn(NO3)2·6H2O 99 % Sigma- Aldrich
ZrO(NO3)2·XH2O 99 % AldrichI
Citric acid was used as a solvent and the amount of citric acid was 1:1 mol with mol cations.
The respective amount of citric acid was diluted with water before BaCO3 was added to the
solution. When all the BaCO3 was dissolved, the rest of the precursors were added to the
solution. This gave a clear purple solution. The water was boiled off, the solution formed a gel,
and it was placed in a heating cabinet at 250 ℃. The solution was left in the heating cabinet for
30 min for the combustion reaction to happen. The powder was then grinded and fired at 400
℃ for 1 h with a ramp rate of 300 ℃/h. Then the powder was grinded and calcined for 5 h at
1100 ℃ with a ramp rate of 250 ℃/h.
All powders were characterised by SEM and XRD after calcination. The calcined powders were
pressed to pellets with a diameter of 6 mm and a thickness between 1.0-2.8 mm by uniaxial
I The molar mass given by the producer was 231.23 g/mol.
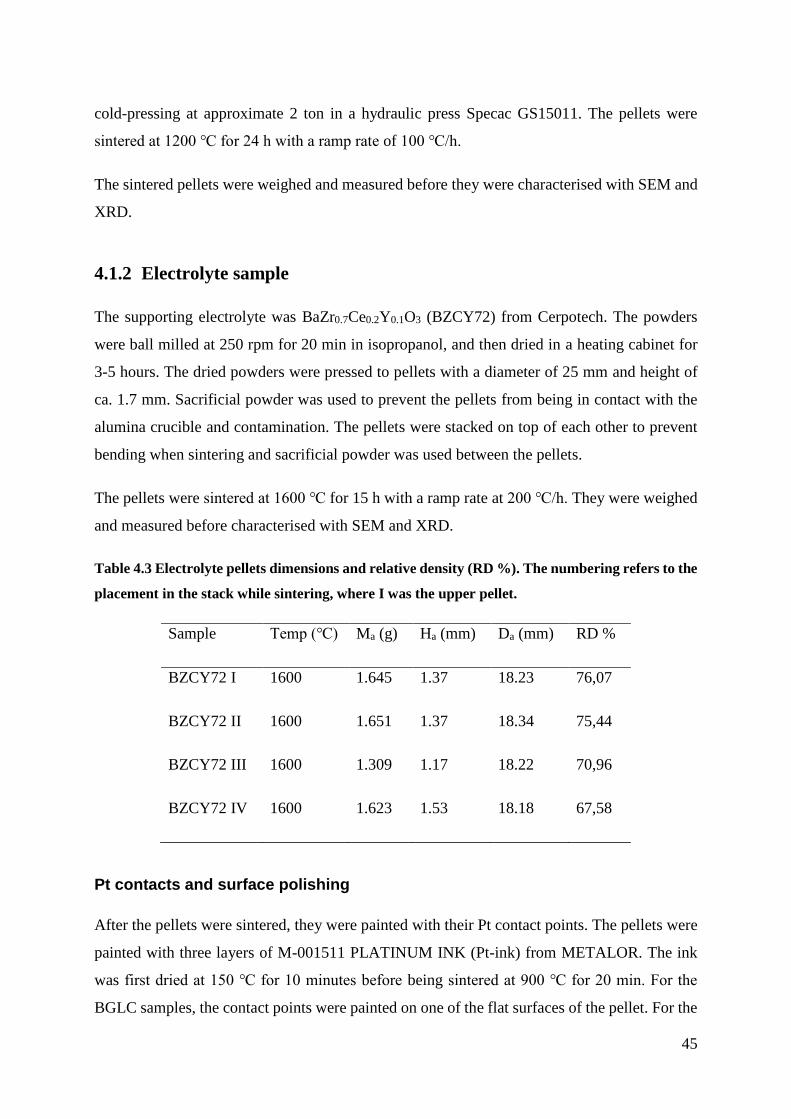
45
cold-pressing at approximate 2 ton in a hydraulic press Specac GS15011. The pellets were
sintered at 1200 ℃ for 24 h with a ramp rate of 100 ℃/h.
The sintered pellets were weighed and measured before they were characterised with SEM and
XRD.
4.1.2 Electrolyte sample
The supporting electrolyte was BaZr0.7Ce0.2Y0.1O3 (BZCY72) from Cerpotech. The powders
were ball milled at 250 rpm for 20 min in isopropanol, and then dried in a heating cabinet for
3-5 hours. The dried powders were pressed to pellets with a diameter of 25 mm and height of
ca. 1.7 mm. Sacrificial powder was used to prevent the pellets from being in contact with the
alumina crucible and contamination. The pellets were stacked on top of each other to prevent
bending when sintering and sacrificial powder was used between the pellets.
The pellets were sintered at 1600 ℃ for 15 h with a ramp rate at 200 ℃/h. They were weighed
and measured before characterised with SEM and XRD.
Table 4.3 Electrolyte pellets dimensions and relative density (RD %). The numbering refers to the
placement in the stack while sintering, where I was the upper pellet.
Sample Temp (℃) Ma (g) Ha (mm) Da (mm) RD %
BZCY72 I 1600 1.645 1.37 18.23 76,07
BZCY72 II 1600 1.651 1.37 18.34 75,44
BZCY72 III 1600 1.309 1.17 18.22 70,96
BZCY72 IV 1600 1.623 1.53 18.18 67,58
Pt contacts and surface polishing
After the pellets were sintered, they were painted with their Pt contact points. The pellets were
painted with three layers of M-001511 PLATINUM INK (Pt-ink) from METALOR. The ink
was first dried at 150 ℃ for 10 minutes before being sintered at 900 ℃ for 20 min. For the
BGLC samples, the contact points were painted on one of the flat surfaces of the pellet. For the

46
BZCY72 samples, the counter electrode was painted on first by masking an outcut of a circle
with tape. Accordingly, the reference electrode was painted on the edge at the same side as the
counter electrode, without connecting with the counter electrode.
Thereafter, the electrodes and electrolyte surfaces on the opposite side of the painted contacts
were grinded and polished to a mirror-like surface. This was performed to obtain the best
possible contact between the electrode and electrolyte. The surface polishing was done with a
MultiprepTM from Allied High Tech Products, with grinding paper down to 3μ.
4.2 Sample Characterisation
4.2.1 Scanning Electron Microscopy (SEM)
For the study of the cross-section, phase composition and surfaces of each sample, a FEI-SEM
(FEI Quanta 200 FEG-ESEM) with a field emission gun (FEG) was used. The microscope was
operated under high-vacuum (10-5 Pa) with acceleration voltages of 15-25 kV. Elemental spot
analysis was conducted by using an Energy Dispersive X-Ray Spectroscopy (EDS) Pegasus 2200
EDS detector coupled to the SEM.
4.2.2 X-Ray Diffraction (XRD)
The crystal structure and phase composition of all the samples were studied by XRD on a
Bruker AXS D8 Discover with CuKα1 λ = 1.54060 Å and CuKα2 λ = 1.54439 Å radiation. The
samples were scanned in the range 10° to 70° (2θ) with a step size of 0.02 ̊/s. The diffractograms
were analysed in DIFFRAC.EVA v4.3 by comparing tHem to the Powder Diffraction File
database from the International Centre for Diffraction Data and BGLC82 without dopants.
4.2.3 Thermogravimetric Analysis (TGA)
TGA was employed to study the properties of hydration OF the materials. The measurements
were carried out in a STA 499 F1 Jupiter, where powder samples of each material were
analysed. The powder samples were contained in alumina crucibles and placed on the sample
carrier for the TGA. The atmosphere in the TGA was controlled by the TGA gas controller and
a gas mixer with the ability to shift from dry to wet atmosphere and H2O to D2O shift. The

47
measurements were conducted in synthetic air (80% /20%, N2/O2), where the samples were
heated to 900 ℃ FOR 10 min with a ramp rate of 5 ℃/min before cooled to measurement
temperature with a ramp rate of 1 ℃/min. The desired temperatures for analysis were 300 ℃,
400 ℃ and 500 ℃. The samples were left in dry conditions at the desired temperature for no
less than 8 h to ensure equilibrium in oxygen stoichiometry. The atmosphere was then switched
from dry to wet conditions (pH2O ≈ 0.025 atm) and then switched from H2O to D2O. Before
each shift, the conditions were held constant until the scale had stayed at equilibrium for a
minimum of 45 minutes.
Figure 4.1 Overview over a TGA measurement setup.
4.3 Electrochemical Measurements
The electrochemical measurements were performed with a Gamry Reference 3000 instrument.
Potentistatic EIS measurements were performed with an AC amplitude of 30-70 mV, over a
frequency of 1 MHz to 0.01 Hz. The temperature was decreased from 650 ℃ to 350 ℃ with
50 ℃ steps.
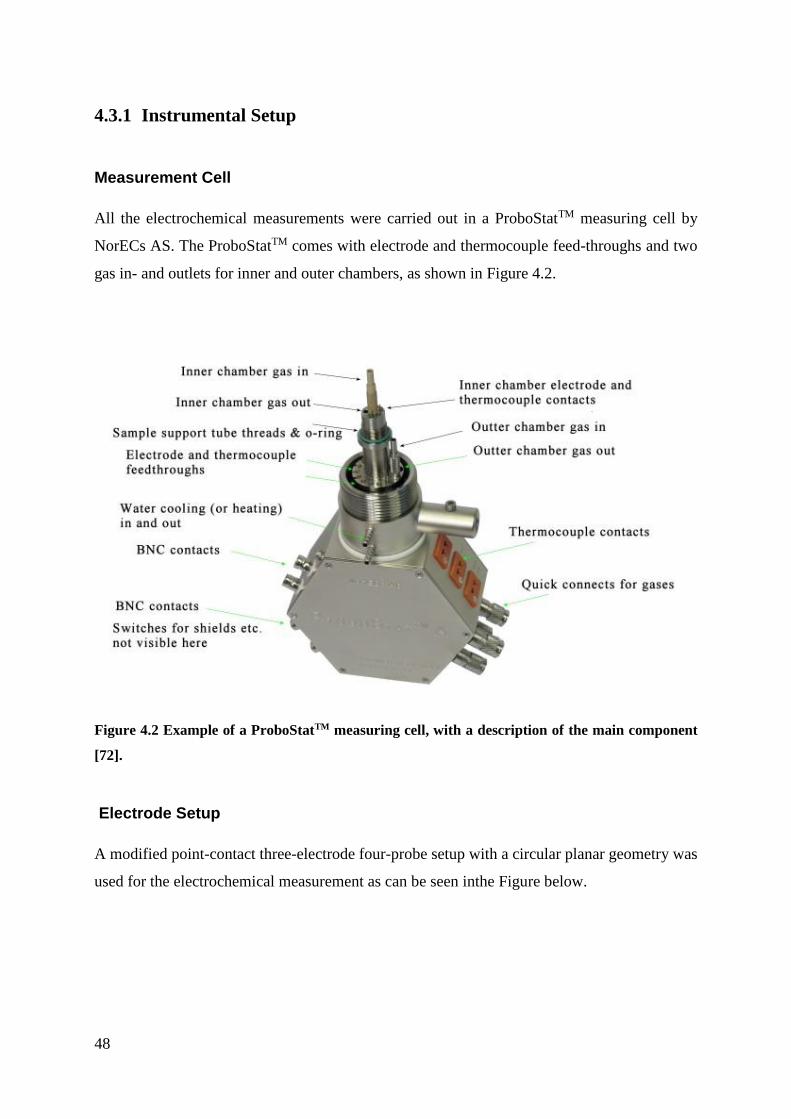
48
4.3.1 Instrumental Setup
Measurement Cell
All the electrochemical measurements were carried out in a ProboStatTM measuring cell by
NorECs AS. The ProboStatTM comes with electrode and thermocouple feed-throughs and two
gas in- and outlets for inner and outer chambers, as shown in Figure 4.2.
Figure 4.2 Example of a ProboStatTM measuring cell, with a description of the main component
[72].
Electrode Setup
A modified point-contact three-electrode four-probe setup with a circular planar geometry was
used for the electrochemical measurement as can be seen inthe Figure below.
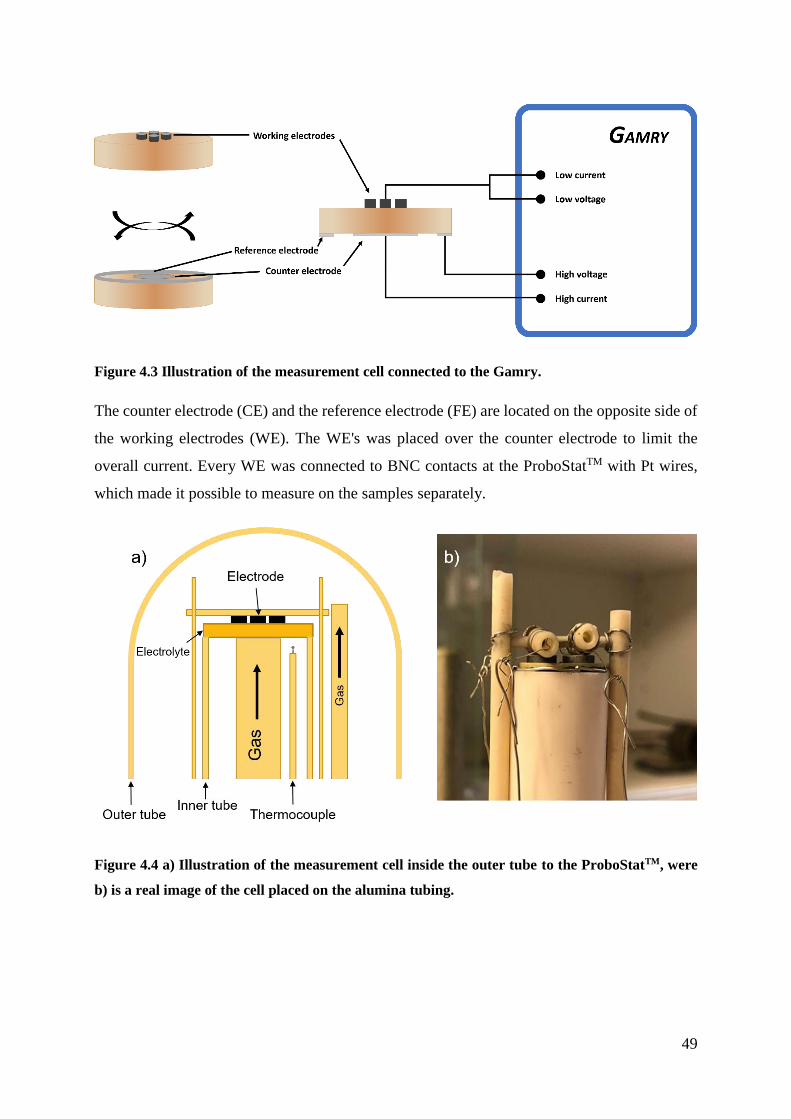
49
Figure 4.3 Illustration of the measurement cell connected to the Gamry.
The counter electrode (CE) and the reference electrode (FE) are located on the opposite side of
the working electrodes (WE). The WE's was placed over the counter electrode to limit the
overall current. Every WE was connected to BNC contacts at the ProboStatTM with Pt wires,
which made it possible to measure on the samples separately.
Figure 4.4 a) Illustration of the measurement cell inside the outer tube to the ProboStatTM, were
b) is a real image of the cell placed on the alumina tubing.

50
Gas Mixer
In order to obtain the desired atmosphere inside the measurement cell, the pO2 was controlled
by mixtures of O2 and Ar of different ratios. For the pH2O, synthetic air was used, and the
partial pressure was controlled by passing the gas stream through a saturated solution of
potassium bromide at room temperature, which provided a pH2O ≈ 0.027 atm, approximately.
The different gas mixtures were obtained by an in-house built gas mixer containing a series of
flow meters connected by Cu-tubing.
Figure 4.5 Schematics of the gas mixer and the ProboStatTM
4.3.2 Measurement Series
Partial pressures of oxygen and water vapour were adjusted systematically; pO2 of 0.0005,
0.003, 0.01, 0.25 and 0.97 atm, and pH2O of 0.0005, 0.001, 0.003, 0.01 and 0.027 atm were
measured at each temperature step. Every pO2 dependency was measured with a pH2O of 0.027
atm. For every change in either temperature or partial pressures, the system was relaxed in the
preferred conditions for 1 hour to reach equilibrium, and a single frequency measurement was
conducted to ensure equilibrium had been reached.
4.4 Data Analysis
4.4.1 Deconvolution
The impedance data were deconvoluted by using the analysis software ZView® v3.5e by
Scribner Associates, Inc.. Three semi-circles were observed in the Nyquist diagram, each was
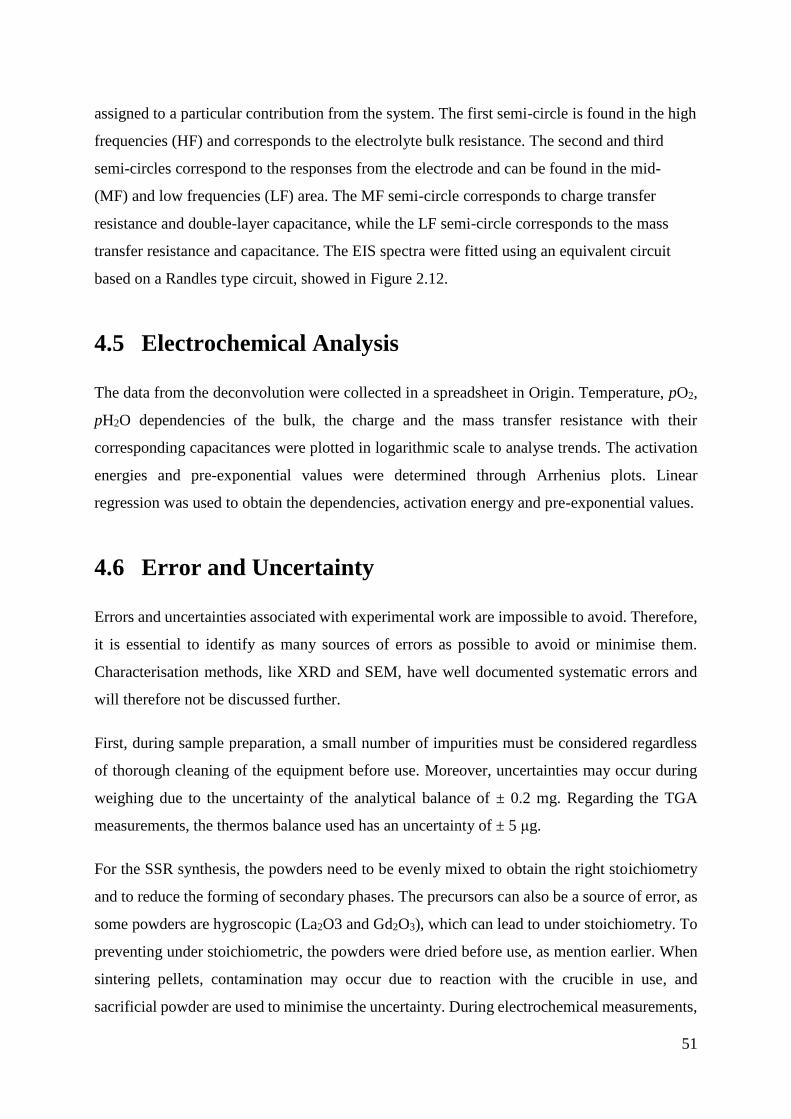
51
assigned to a particular contribution from the system. The first semi-circle is found in the high
frequencies (HF) and corresponds to the electrolyte bulk resistance. The second and third
semi-circles correspond to the responses from the electrode and can be found in the mid-
(MF) and low frequencies (LF) area. The MF semi-circle corresponds to charge transfer
resistance and double-layer capacitance, while the LF semi-circle corresponds to the mass
transfer resistance and capacitance. The EIS spectra were fitted using an equivalent circuit
based on a Randles type circuit, showed in Figure 2.12.
4.5 Electrochemical Analysis
The data from the deconvolution were collected in a spreadsheet in Origin. Temperature, pO2,
pH2O dependencies of the bulk, the charge and the mass transfer resistance with their
corresponding capacitances were plotted in logarithmic scale to analyse trends. The activation
energies and pre-exponential values were determined through Arrhenius plots. Linear
regression was used to obtain the dependencies, activation energy and pre-exponential values.
4.6 Error and Uncertainty
Errors and uncertainties associated with experimental work are impossible to avoid. Therefore,
it is essential to identify as many sources of errors as possible to avoid or minimise them.
Characterisation methods, like XRD and SEM, have well documented systematic errors and
will therefore not be discussed further.
First, during sample preparation, a small number of impurities must be considered regardless
of thorough cleaning of the equipment before use. Moreover, uncertainties may occur during
weighing due to the uncertainty of the analytical balance of ± 0.2 mg. Regarding the TGA
measurements, the thermos balance used has an uncertainty of ± 5 μg.
For the SSR synthesis, the powders need to be evenly mixed to obtain the right stoichiometry
and to reduce the forming of secondary phases. The precursors can also be a source of error, as
some powders are hygroscopic (La2O3 and Gd2O3), which can lead to under stoichiometry. To
preventing under stoichiometric, the powders were dried before use, as mention earlier. When
sintering pellets, contamination may occur due to reaction with the crucible in use, and
sacrificial powder are used to minimise the uncertainty. During electrochemical measurements,
52
the gas mixer and the ProboStatTM may be sources of several errors, including gas leakages.
From the manual, it is expected a certain pH2O is present after passing the drying stage of <
1·10-6 atm. However, due to leakages in the system, Kofstad and Norby estimated it to be
around 3·10-5 atm[73]. Additionally, each flow meter has an accuracy of ± 5 %, which leads to
an increase of uncertainty with the increases of flow meters used in the gas mixer. The
thermocouples that were used in furnaces, TGA and measurement cell have an uncertainty of
±1-2 K, depending on their age and degree of contamination. For the TGA and measurement
cell, the thermocouples were placed close to the sample without interfering with the sample, to
minimise the temperature gradient. For the furnace, the crucible was placed in the middle of the
furnace to counteract the temperature gradient best as possible.
Solid-state systems suffer from much higher resistances in the solid electrolyte, which may lead
to uncertainties . The placement of the RE and CE on the electrolyte can cause inaccuracy and
misleading results if incorrectly placed. For the RE, it should be placed such that the
equipotential lines do not change position when measuring from high to low frequencies.
Therefore, the RE is painted as a circle around the electrolyte. The CE should be symmetrically
aligned with the WE[74].
When studying sample composition with EDS, it is important to know that it is a semi-quantitative
technique and therefore only be used as an estimate. The uncertainty that's reported to EDS is 1-2
atomic mole per cent.
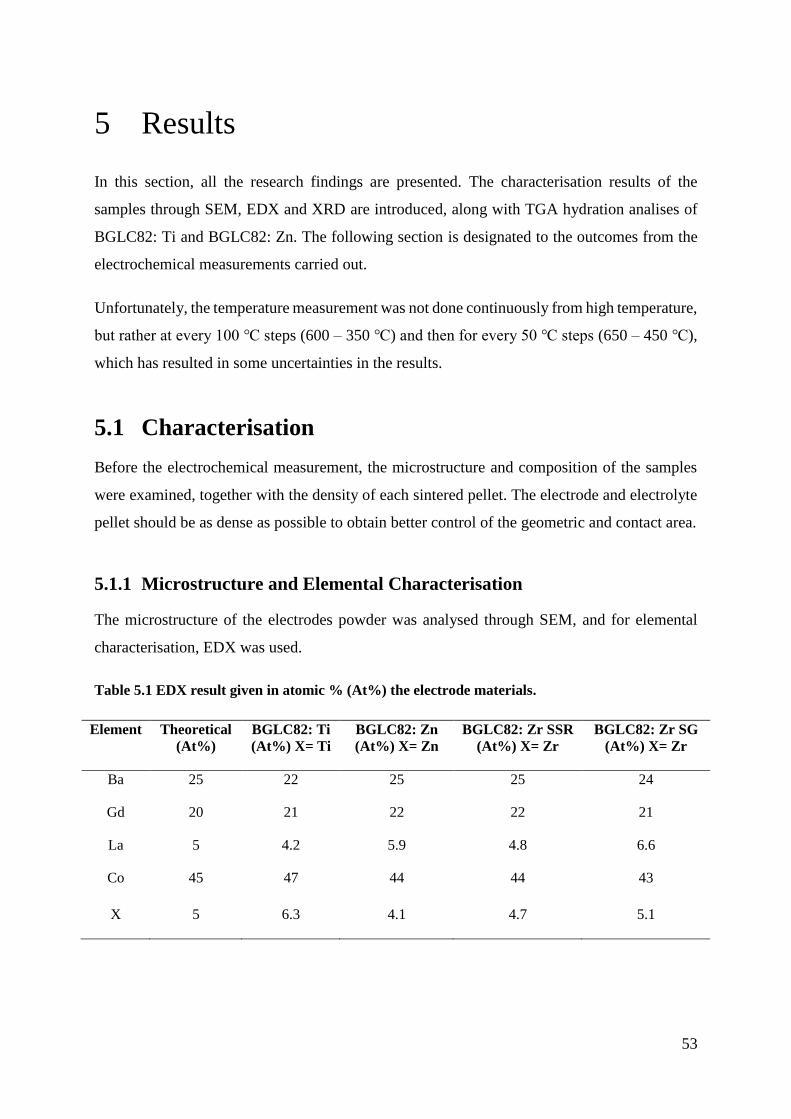
53
5 Results
In this section, all the research findings are presented. The characterisation results of the
samples through SEM, EDX and XRD are introduced, along with TGA hydration analises of
BGLC82: Ti and BGLC82: Zn. The following section is designated to the outcomes from the
electrochemical measurements carried out.
Unfortunately, the temperature measurement was not done continuously from high temperature,
but rather at every 100 ℃ steps (600 – 350 ℃) and then for every 50 ℃ steps (650 – 450 ℃),
which has resulted in some uncertainties in the results.
5.1 Characterisation
Before the electrochemical measurement, the microstructure and composition of the samples
were examined, together with the density of each sintered pellet. The electrode and electrolyte
pellet should be as dense as possible to obtain better control of the geometric and contact area.
5.1.1 Microstructure and Elemental Characterisation
The microstructure of the electrodes powder was analysed through SEM, and for elemental
characterisation, EDX was used.
Table 5.1 EDX result given in atomic % (At%) the electrode materials.
Element Theoretical
(At%)
BGLC82: Ti
(At%) X= Ti
BGLC82: Zn
(At%) X= Zn
BGLC82: Zr SSR
(At%) X= Zr
BGLC82: Zr SG
(At%) X= Zr
Ba 25 22 25 25 24
Gd 20 21 22 22 21
La 5 4.2 5.9 4.8 6.6
Co 45 47 44 44 43
X 5 6.3 4.1 4.7 5.1

54
5.1.2 Crystal Structure
Diffractograms of the sintered pellets were obtained from XRD at room temperature. The
diffractograms of each sample were compared to undoped BGLC82 and the Powder Diffraction
File database of the International Centre for Diffraction Data for the second phase that appear
for the Zr doped electrodes.
Figure 5.1 XRD of the electrode material, where a) is the electrode materials compared to
BGLC82 and b) shown the two Zr electrodes, which shows BaZrO3 as a second phase.
5.1.3 Hydration
The oxides were tested for hydration at various temperatures and with isotope exchange.
However, BGLC82: Zr SSR and Zr SG were not tested for hydration, due to the unknown phase
compositions of the oxides.
As explained earlier, oxides start to hydrate when exposed to water-rich atmospheres.
Hydration can be observed as weight gain for the oxides, as shown in Figure 5.2. However,
when changing the protons with deuterium, the weight gain increases further for some oxides,
and the proton uptake can be determined more accurately. The flowing defect reaction occurs
when pH2O/pD2O shift are exposed for an oxide.
D2O (g) + 2OHO• ⇌ 2ODO
• +H2O (g) (5.1)
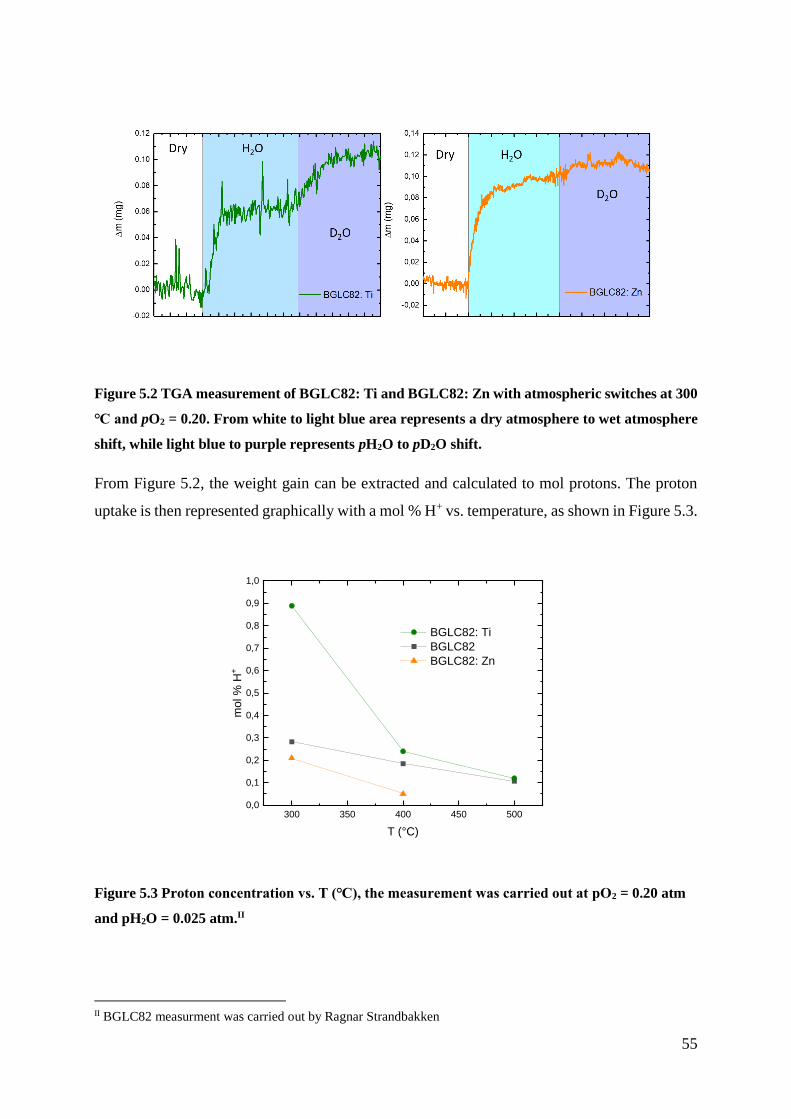
55
Figure 5.2 TGA measurement of BGLC82: Ti and BGLC82: Zn with atmospheric switches at 300
℃ and pO2 = 0.20. From white to light blue area represents a dry atmosphere to wet atmosphere
shift, while light blue to purple represents pH2O to pD2O shift.
From Figure 5.2, the weight gain can be extracted and calculated to mol protons. The proton
uptake is then represented graphically with a mol % H+ vs. temperature, as shown in Figure 5.3.
Figure 5.3 Proton concentration vs. T (℃), the measurement was carried out at pO2 = 0.20 atm
and pH2O = 0.025 atm.II
II BGLC82 measurment was carried out by Ragnar Strandbakken
300 350 400 450 5000,0
0,1
0,2
0,3
0,4
0,5
0,6
0,7
0,8
0,9
1,0
mol %
H+
T (°C)
BGLC82: Ti
BGLC82
BGLC82: Zn
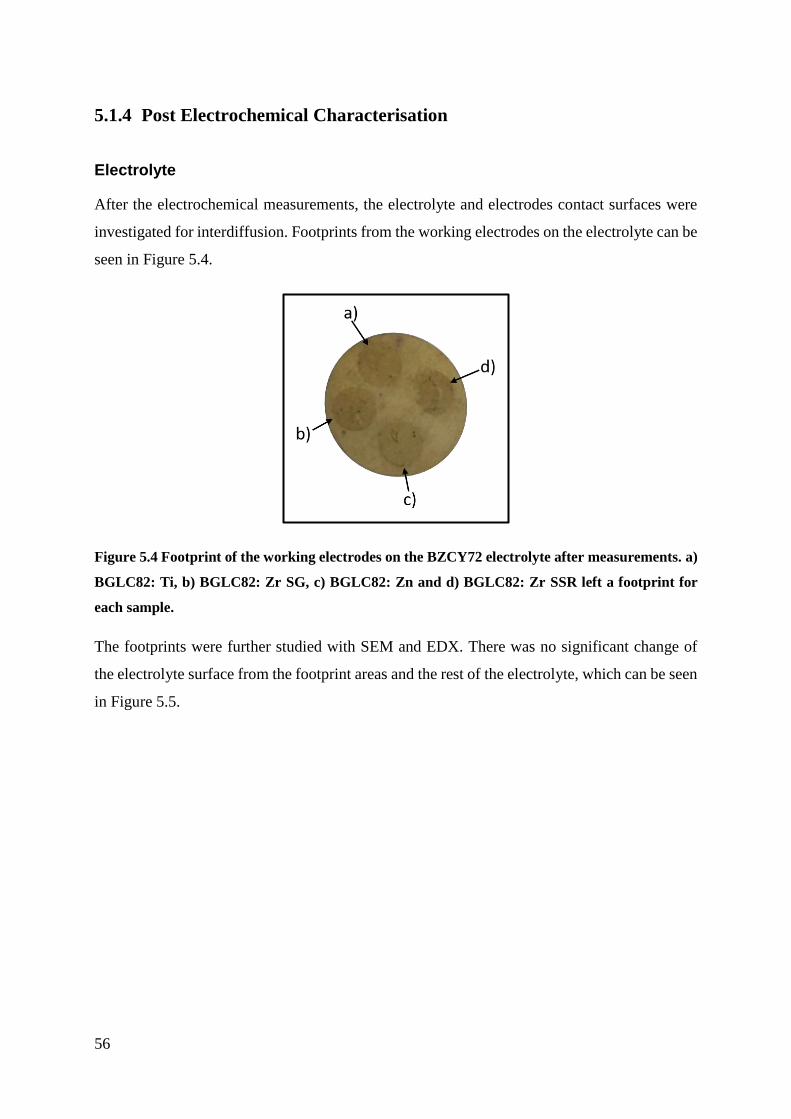
56
5.1.4 Post Electrochemical Characterisation
Electrolyte
After the electrochemical measurements, the electrolyte and electrodes contact surfaces were
investigated for interdiffusion. Footprints from the working electrodes on the electrolyte can be
seen in Figure 5.4.
Figure 5.4 Footprint of the working electrodes on the BZCY72 electrolyte after measurements. a)
BGLC82: Ti, b) BGLC82: Zr SG, c) BGLC82: Zn and d) BGLC82: Zr SSR left a footprint for
each sample.
The footprints were further studied with SEM and EDX. There was no significant change of
the electrolyte surface from the footprint areas and the rest of the electrolyte, which can be seen
in Figure 5.5.
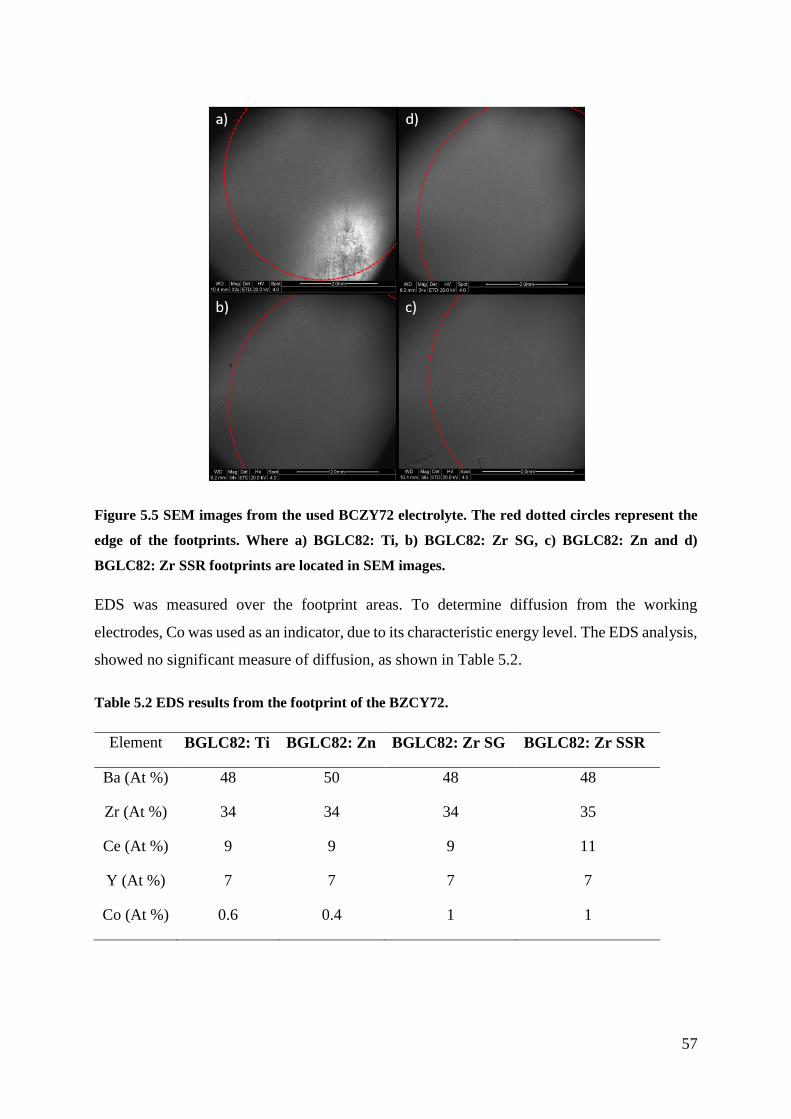
57
Figure 5.5 SEM images from the used BCZY72 electrolyte. The red dotted circles represent the
edge of the footprints. Where a) BGLC82: Ti, b) BGLC82: Zr SG, c) BGLC82: Zn and d)
BGLC82: Zr SSR footprints are located in SEM images.
EDS was measured over the footprint areas. To determine diffusion from the working
electrodes, Co was used as an indicator, due to its characteristic energy level. The EDS analysis,
showed no significant measure of diffusion, as shown in Table 5.2.
Table 5.2 EDS results from the footprint of the BZCY72.
Element BGLC82: Ti BGLC82: Zn BGLC82: Zr SG BGLC82: Zr SSR
Ba (At %) 48 50 48 48
Zr (At %) 34 34 34 35
Ce (At %) 9 9 9 11
Y (At %) 7 7 7 7
Co (At %) 0.6 0.4 1 1
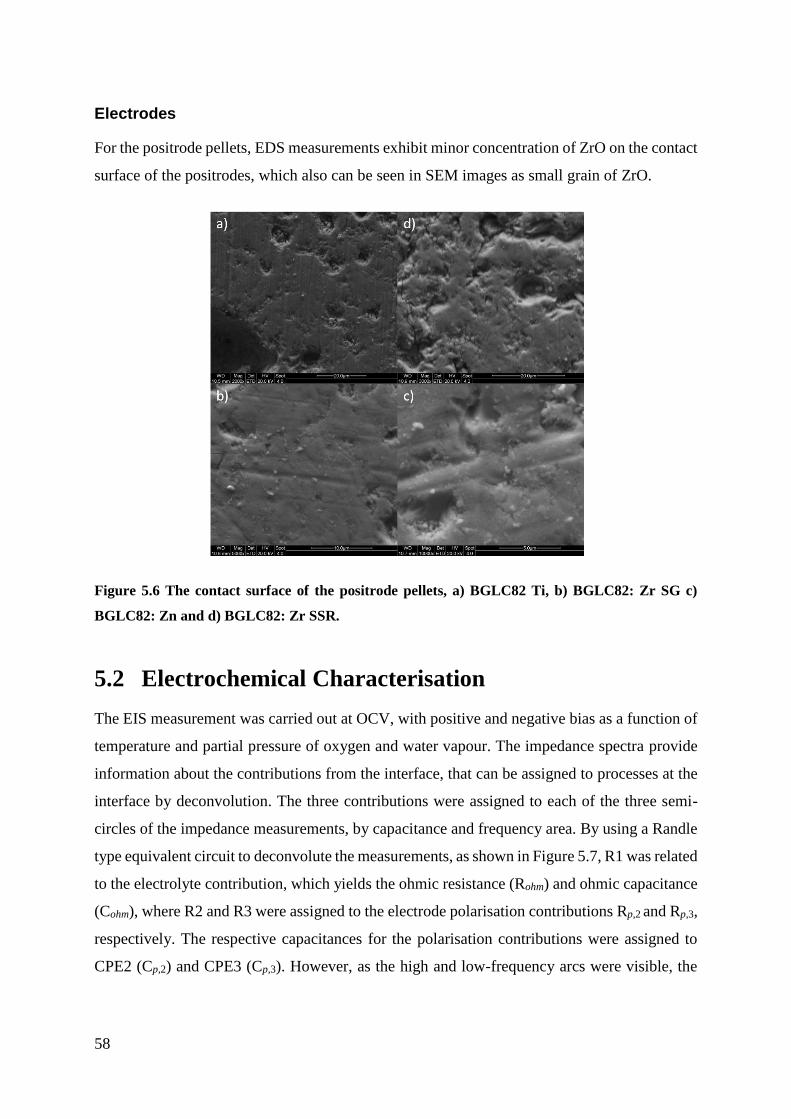
58
Electrodes
For the positrode pellets, EDS measurements exhibit minor concentration of ZrO on the contact
surface of the positrodes, which also can be seen in SEM images as small grain of ZrO.
Figure 5.6 The contact surface of the positrode pellets, a) BGLC82 Ti, b) BGLC82: Zr SG c)
BGLC82: Zn and d) BGLC82: Zr SSR.
5.2 Electrochemical Characterisation
The EIS measurement was carried out at OCV, with positive and negative bias as a function of
temperature and partial pressure of oxygen and water vapour. The impedance spectra provide
information about the contributions from the interface, that can be assigned to processes at the
interface by deconvolution. The three contributions were assigned to each of the three semi-
circles of the impedance measurements, by capacitance and frequency area. By using a Randle
type equivalent circuit to deconvolute the measurements, as shown in Figure 5.7, R1 was related
to the electrolyte contribution, which yields the ohmic resistance (Rohm) and ohmic capacitance
(Cohm), where R2 and R3 were assigned to the electrode polarisation contributions Rp,2 and Rp,3,
respectively. The respective capacitances for the polarisation contributions were assigned to
CPE2 (Cp,2) and CPE3 (Cp,3). However, as the high and low-frequency arcs were visible, the
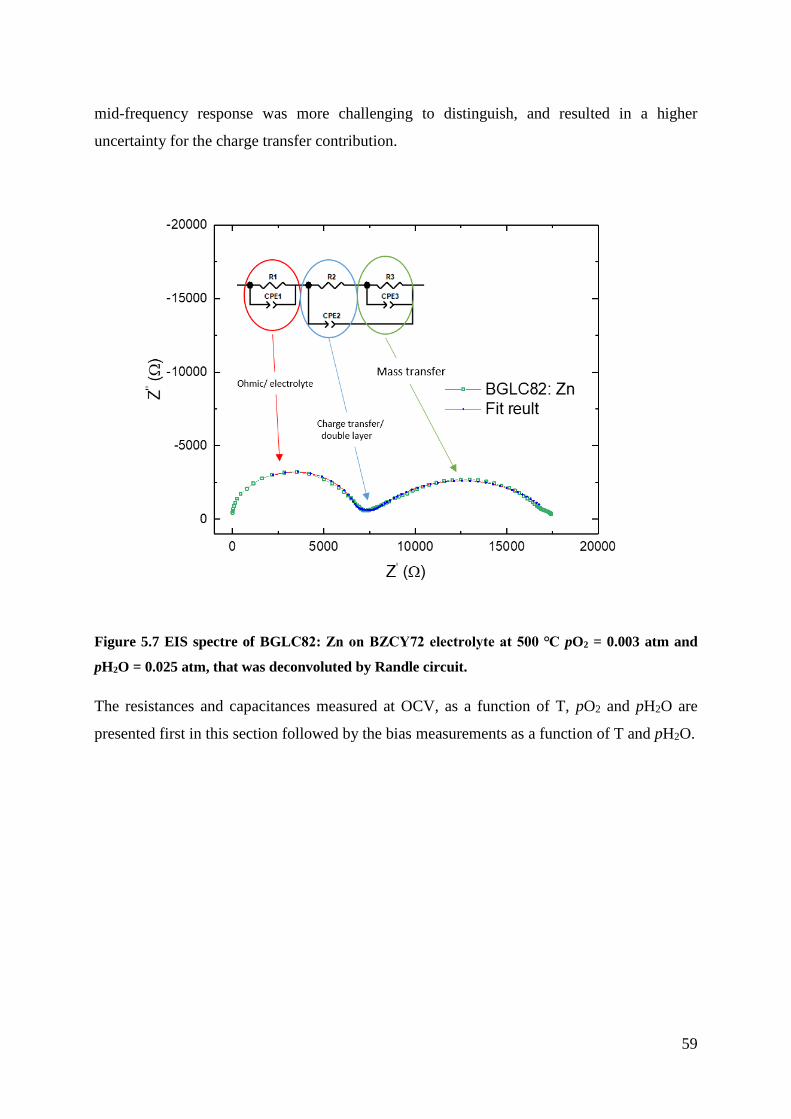
59
mid-frequency response was more challenging to distinguish, and resulted in a higher
uncertainty for the charge transfer contribution.
Figure 5.7 EIS spectre of BGLC82: Zn on BZCY72 electrolyte at 500 ℃ pO2 = 0.003 atm and
pH2O = 0.025 atm, that was deconvoluted by Randle circuit.
The resistances and capacitances measured at OCV, as a function of T, pO2 and pH2O are
presented first in this section followed by the bias measurements as a function of T and pH2O.
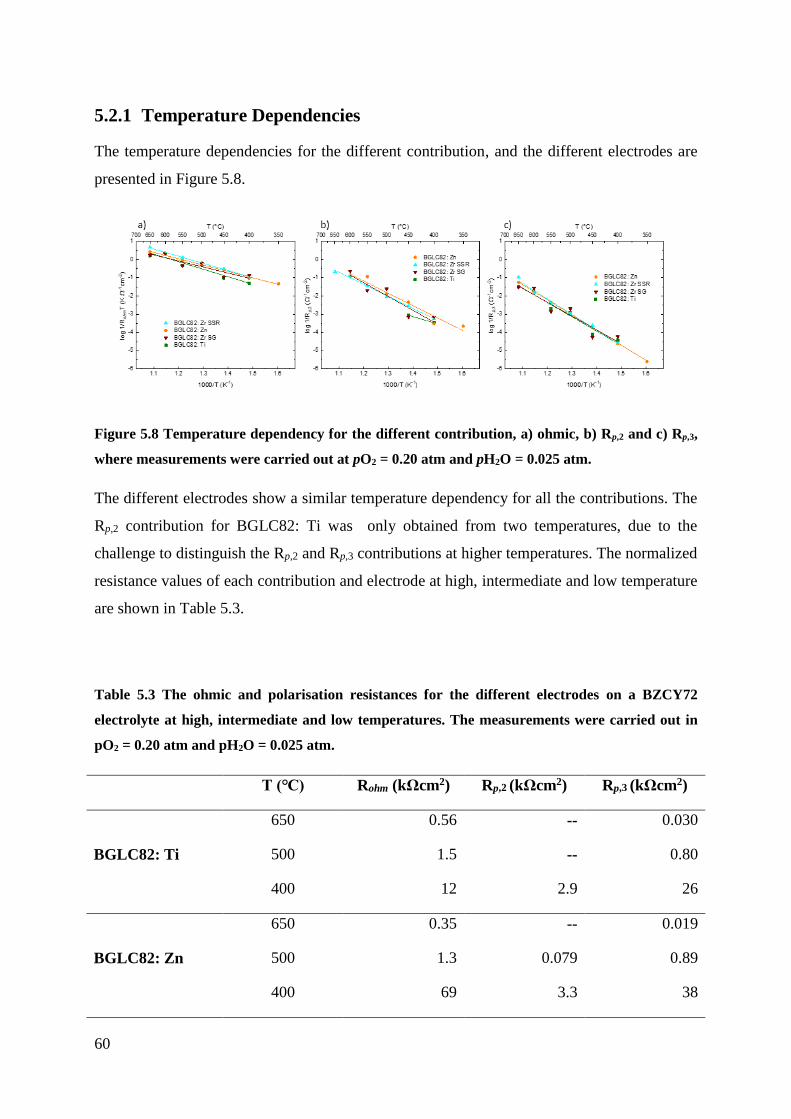
60
5.2.1 Temperature Dependencies
The temperature dependencies for the different contribution, and the different electrodes are
presented in Figure 5.8.
Figure 5.8 Temperature dependency for the different contribution, a) ohmic, b) Rp,2 and c) Rp,3,
where measurements were carried out at pO2 = 0.20 atm and pH2O = 0.025 atm.
The different electrodes show a similar temperature dependency for all the contributions. The
Rp,2 contribution for BGLC82: Ti was only obtained from two temperatures, due to the
challenge to distinguish the Rp,2 and Rp,3 contributions at higher temperatures. The normalized
resistance values of each contribution and electrode at high, intermediate and low temperature
are shown in Table 5.3.
Table 5.3 The ohmic and polarisation resistances for the different electrodes on a BZCY72
electrolyte at high, intermediate and low temperatures. The measurements were carried out in
pO2 = 0.20 atm and pH2O = 0.025 atm.
T (℃) Rohm (kΩcm2) Rp,2 (kΩcm2) Rp,3 (kΩcm2)
BGLC82: Ti
650 0.56 -- 0.030
500 1.5 -- 0.80
400 12 2.9 26
BGLC82: Zn
650 0.35 -- 0.019
500 1.3 0.079 0.89
400 69 3.3 38

61
BGLC82: Zr SSR
650 0.20 0.0048 0.0092
500 1.2 0.11 1.0
400 61 1.8 37
BGLC82: Zr SG
650 0.52 -- 0.034
500 1.2 0.041 0.49
400 51 1.4 16
As presented in Table 5.3, the samples exhibit close to the same ohmic resistance with some
deviation, which might come from the placement of the samples on the electrolyte.
The respective capacitances for the electrode contributions are shown in Figure 5.9.
Figure 5.9 Temperature dependencies for the electrodes capacitances, where (■) is from the ohmic
contribution, (●) from the Rp,2 and (▲) for the Rp,3 with pO2 = 0.20 atm and pH2O = 0.025 atm.
From Figure 5.9, the capacitance of the ohmic contribution is in range of ~10-10 - 10-9 Fcm-2.
For the two polarization contributions, the capacitance for Rp,2 are seen in a range of ~10-8 – 10-
6 Fcm-2 and for Rp,3 ~10-6 – 10-5 Fcm-2. The capacitance at high, intermediate and low
temperature are presented in Table 5.4 for all of the different electrodes.
62
Table 5.4 Capacitance values for the ohmic (Cohm) and polarization resistances (Cp,2 and Cp,3), at
high, intermediate and low temperatures. The measurements were carried out in pO2 = 0.20 atm
and pH2O = 0.025 atm.
T (℃) Cohm (Fcm-2) Cp,2 (Fcm-2) Cp,3 (Fcm-2)
BGLC82: Ti
650 9.4 · 10-10 -- 7.0 · 10-6
500 1.3 · 10-9 -- 2.5 · 10-6
400 1.6 · 10-9 1.1 · 10-7 1.7 · 10-6
BGLC82: Zn
650 1.4 · 10-9 -- 2.9 · 10-5
500 1.7 · 10-9 5.4· 10-7 4.3 · 10-5
400 1.9 · 10-9 5.1 · 10-7 3.1 · 10-5
BGLC82: Zr SSR
650 1.4 · 10-9 5.7 · 10-6 2.8 · 10-5
500 1.2 · 10-9 1.8 · 10-7 3.2 · 10-6
400 1.3 · 10-9 4.9 · 10-8 2.8 · 10-6
BGLC82: Zr SG
650 1.2 · 10-9 -- 3.3 · 10-5
500 8.3 · 10-10 7.9 · 10-7 1.7 · 10-5
400 8.9 · 10-10 1.2 · 10-6 3.3 · 10-5
Activation Energy
The activation energy and pre-exponetional factor (Ao) were determined by linear regression of
ln 1/Rohm‧T vs. 1/T for the electrolyte and ln 1/Rp vs. 1/T for the electrode process by the
following expression:
1
R𝑝= 𝐴0 exp (−
𝐸𝑎R𝑇
) (3.80)
where Rp is the polarisation resistance, R is the gas constant and T is the temperature in Kelvin.
The Arrhenius plots for the three contributions are shown in Figure 5.10 for the different
electrodes. The respective information extracted from each Arrhenius plot is shown in Table
5.5.
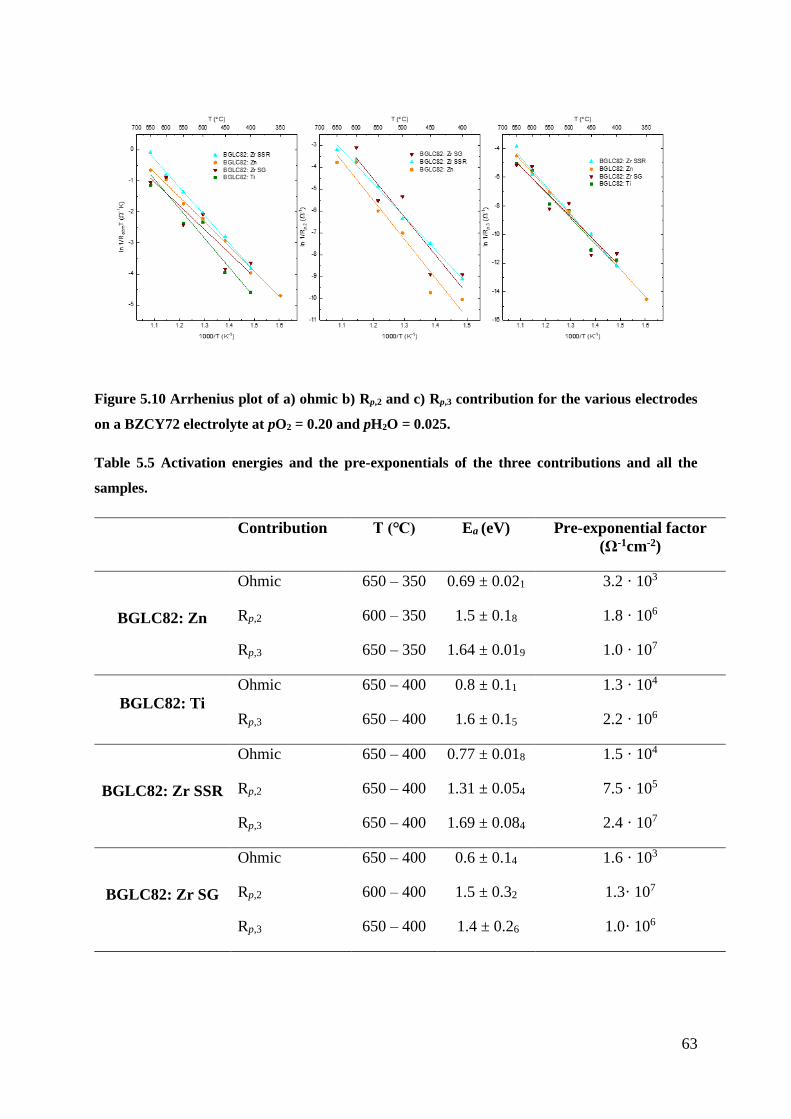
63
Figure 5.10 Arrhenius plot of a) ohmic b) Rp,2 and c) Rp,3 contribution for the various electrodes
on a BZCY72 electrolyte at pO2 = 0.20 and pH2O = 0.025.
Table 5.5 Activation energies and the pre-exponentials of the three contributions and all the
samples.
Contribution T (℃) Ea (eV) Pre-exponential factor
(Ω-1cm-2)
BGLC82: Zn
Ohmic 650 – 350 0.69 ± 0.021 3.2 · 103
Rp,2 600 – 350 1.5 ± 0.18 1.8 · 106
Rp,3 650 – 350 1.64 ± 0.019 1.0 · 107
BGLC82: Ti
Ohmic 650 – 400 0.8 ± 0.11 1.3 · 104
Rp,3 650 – 400 1.6 ± 0.15 2.2 · 106
BGLC82: Zr SSR
Ohmic 650 – 400 0.77 ± 0.018 1.5 · 104
Rp,2 650 – 400 1.31 ± 0.054 7.5 · 105
Rp,3 650 – 400 1.69 ± 0.084 2.4 · 107
BGLC82: Zr SG
Ohmic 650 – 400 0.6 ± 0.14 1.6 · 103
Rp,2 600 – 400 1.5 ± 0.32 1.3· 107
Rp,3 650 – 400 1.4 ± 0.26 1.0· 106
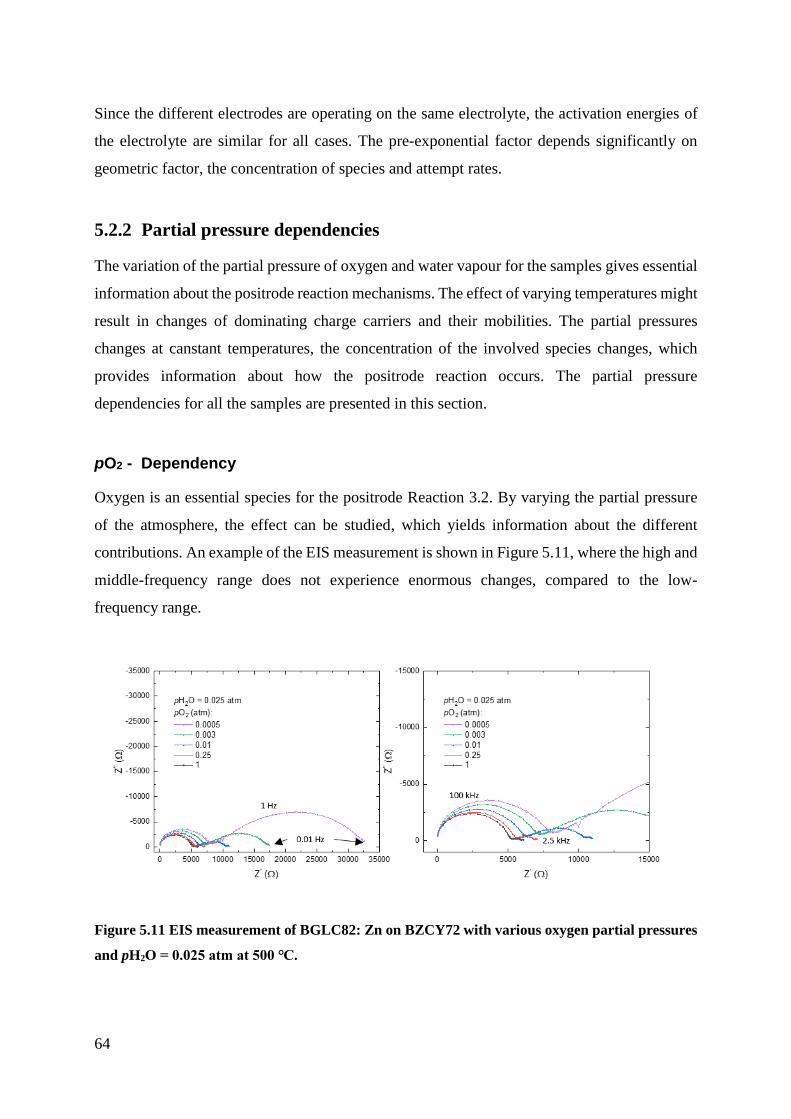
64
Since the different electrodes are operating on the same electrolyte, the activation energies of
the electrolyte are similar for all cases. The pre-exponential factor depends significantly on
geometric factor, the concentration of species and attempt rates.
5.2.2 Partial pressure dependencies
The variation of the partial pressure of oxygen and water vapour for the samples gives essential
information about the positrode reaction mechanisms. The effect of varying temperatures might
result in changes of dominating charge carriers and their mobilities. The partial pressures
changes at canstant temperatures, the concentration of the involved species changes, which
provides information about how the positrode reaction occurs. The partial pressure
dependencies for all the samples are presented in this section.
pO2 - Dependency
Oxygen is an essential species for the positrode Reaction 3.2. By varying the partial pressure
of the atmosphere, the effect can be studied, which yields information about the different
contributions. An example of the EIS measurement is shown in Figure 5.11, where the high and
middle-frequency range does not experience enormous changes, compared to the low-
frequency range.
Figure 5.11 EIS measurement of BGLC82: Zn on BZCY72 with various oxygen partial pressures
and pH2O = 0.025 atm at 500 ℃.

65
The resistances and capacitances were distinguished for every experimental matrix by
deconvolution. The pO2 dependencies of ohmic and polarization resistances for BGLC82: Zn
are presented in Figure 5.12, and a comparison of the dependency to the polarization resistances
between the electrodes of a selected temperature is presented in Figure 5.13. The full
dependency plot of the other electrodes are shown in the Appendix (Figure A.2.1). The
dependency values are presented in Table 5.6 for all of the electrodes.
Figure 5.12 pO2 dependencies for BGLC82: Zn on BZCY72, where the three contribution a)
ohmic, b) Rp,2 and c) Rp,3 are presented.
Figure 5.13 pO2 dependencies for the two polarization resistances, where a) Rp,2 for the electrodes
at 450 ℃ and b) Rp,3 for all the electrodes at 550 ℃, pH2O = 0.025 atm for all the measurements.

66
pH2O- Dependency
Water is the other species of the positrode Reaction 3.2, where the concentration can be changed
in the system and information for the contributions can be obtained. An EIS measurement is
shown in Figure 5.15, where the low-frequency range shows a change with changes in water
vapour pressures.
Figure 5.14 Impedance sweep for BGLC82: Zn on a BZCY72 electrolyte at 500 ℃ with pO2 =
0.20 and various pH2O.
The resistances and capacitances were distinguished for every experimental matrix by
deconvolution. The pH2O dependencies of ohmic and polarization resistances for BGLC82: Zn
are presented in Figure 5.15, and a comparison of the dependency to the polarization resistances
between the electrodes of a selected temperature is presented in Figure 5.16. The full
dependency plot for the other electrodes are shown in the Appendix (Figure A.2.2). The
dependency values are presented in Table 5.6 for each electrode.
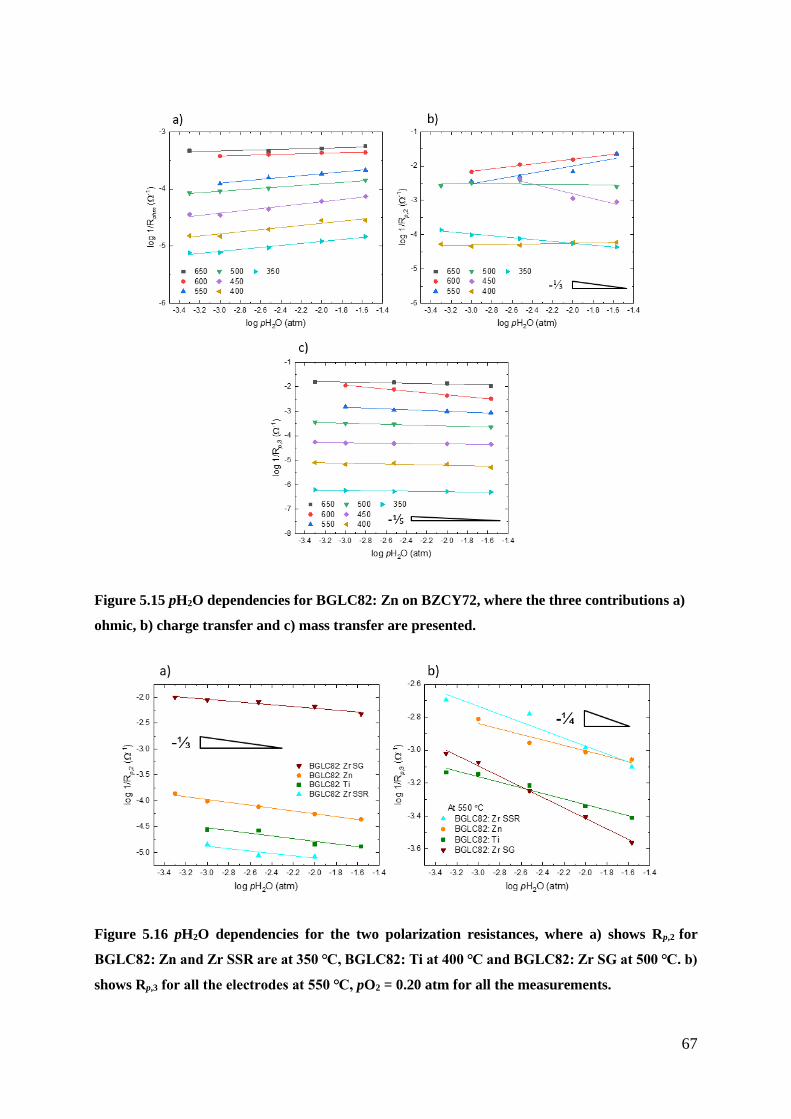
67
Figure 5.15 pH2O dependencies for BGLC82: Zn on BZCY72, where the three contributions a)
ohmic, b) charge transfer and c) mass transfer are presented.
Figure 5.16 pH2O dependencies for the two polarization resistances, where a) shows Rp,2 for
BGLC82: Zn and Zr SSR are at 350 ℃, BGLC82: Ti at 400 ℃ and BGLC82: Zr SG at 500 ℃. b)
shows Rp,3 for all the electrodes at 550 ℃, pO2 = 0.20 atm for all the measurements.
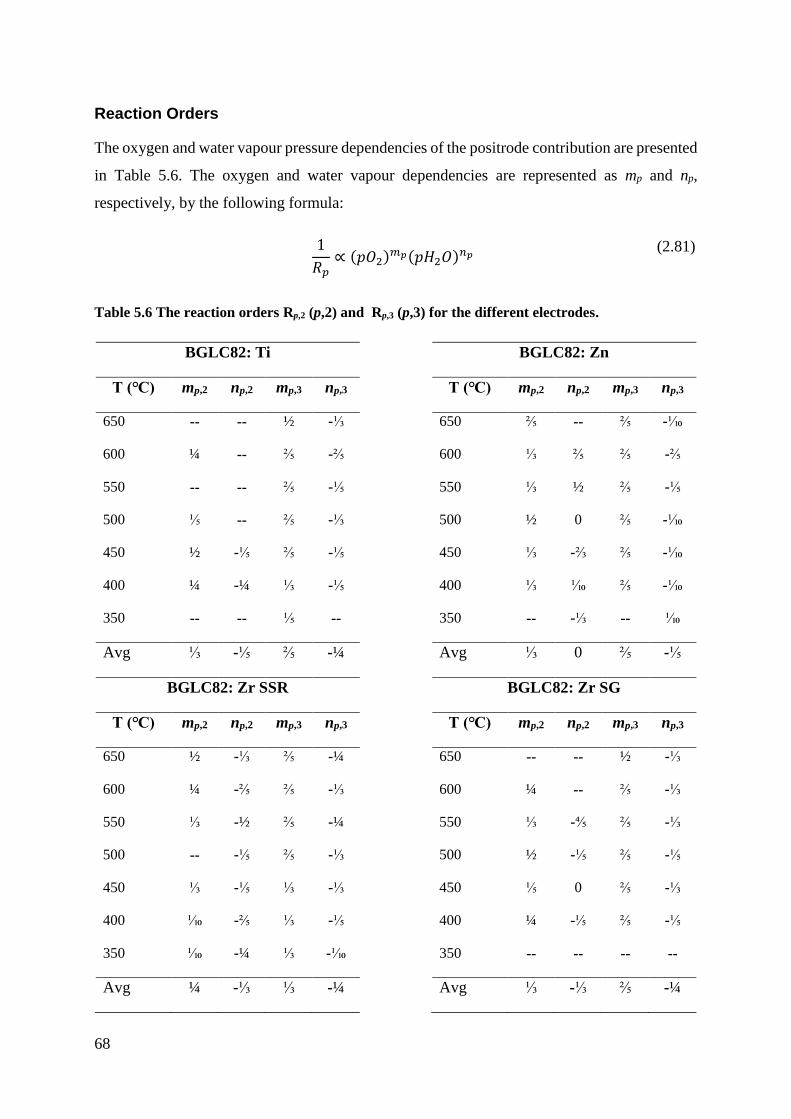
68
Reaction Orders
The oxygen and water vapour pressure dependencies of the positrode contribution are presented
in Table 5.6. The oxygen and water vapour dependencies are represented as mp and np,
respectively, by the following formula:
1
𝑅𝑝∝ (𝑝𝑂2)
𝑚𝑝(𝑝𝐻2𝑂)𝑛𝑝
(2.81)
Table 5.6 The reaction orders Rp,2 (p,2) and Rp,3 (p,3) for the different electrodes.
BGLC82: Ti BGLC82: Zn
T (℃) mp,2 np,2 mp,3 np,3 T (℃) mp,2 np,2 mp,3 np,3
650 -- -- ½ -⅓ 650 ⅖ -- ⅖ -⅒
600 ¼ -- ⅖ -⅖ 600 ⅓ ⅖ ⅖ -⅖
550 -- -- ⅖ -⅕ 550 ⅓ ½ ⅖ -⅕
500 ⅕ -- ⅖ -⅓ 500 ½ 0 ⅖ -⅒
450 ½ -⅕ ⅖ -⅕ 450 ⅓ -⅔ ⅖ -⅒
400 ¼ -¼ ⅓ -⅕ 400 ⅓ ⅒ ⅖ -⅒
350 -- -- ⅕ -- 350 -- -⅓ -- ⅒
Avg ⅓ -⅕ ⅖ -¼ Avg ⅓ 0 ⅖ -⅕
BGLC82: Zr SSR BGLC82: Zr SG
T (℃) mp,2 np,2 mp,3 np,3 T (℃) mp,2 np,2 mp,3 np,3
650 ½ -⅓ ⅖ -¼ 650 -- -- ½ -⅓
600 ¼ -⅖ ⅖ -⅓ 600 ¼ -- ⅖ -⅓
550 ⅓ -½ ⅖ -¼ 550 ⅓ -⅘ ⅖ -⅓
500 -- -⅕ ⅖ -⅓ 500 ½ -⅕ ⅖ -⅕
450 ⅓ -⅕ ⅓ -⅓ 450 ⅕ 0 ⅖ -⅓
400 ⅒ -⅖ ⅓ -⅕ 400 ¼ -⅕ ⅖ -⅕
350 ⅒ -¼ ⅓ -⅒ 350 -- -- -- --
Avg ¼ -⅓ ⅓ -¼ Avg ⅓ -⅓ ⅖ -¼
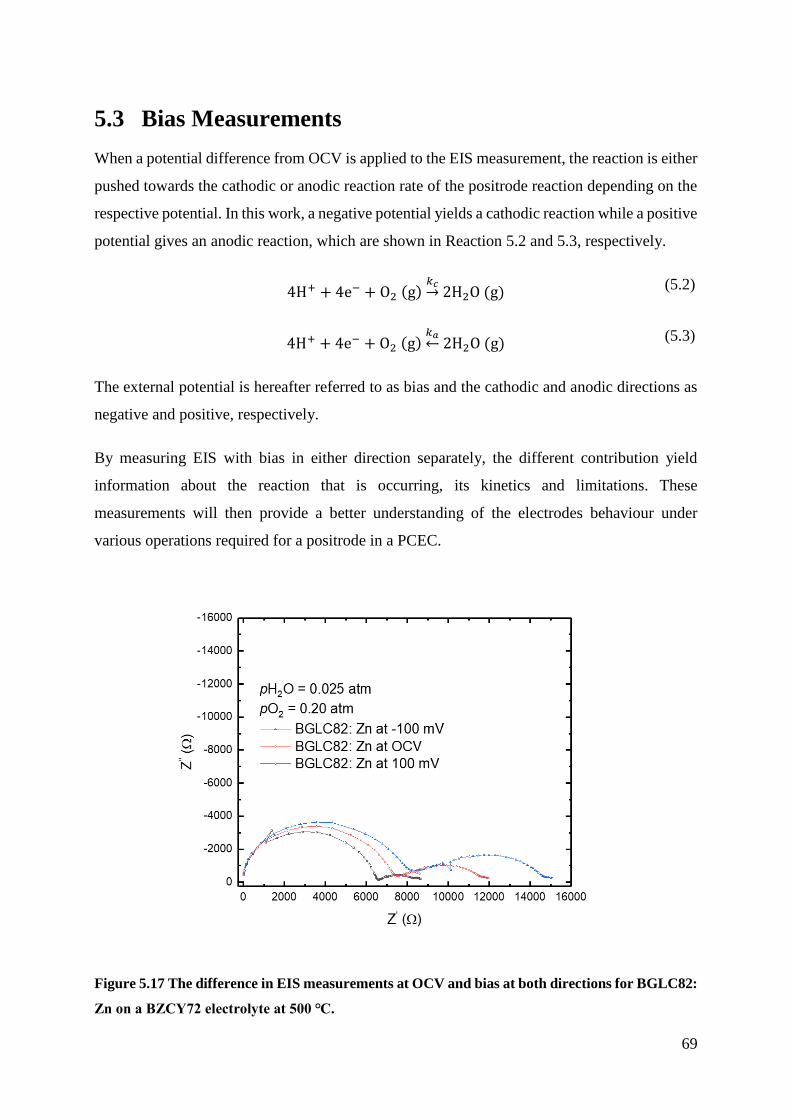
69
5.3 Bias Measurements
When a potential difference from OCV is applied to the EIS measurement, the reaction is either
pushed towards the cathodic or anodic reaction rate of the positrode reaction depending on the
respective potential. In this work, a negative potential yields a cathodic reaction while a positive
potential gives an anodic reaction, which are shown in Reaction 5.2 and 5.3, respectively.
4H+ + 4e− + O2 (g)𝑘𝑐→ 2H2O (g)
(5.2)
4H+ + 4e− + O2 (g)𝑘𝑎↔ 2H2O (g)
(5.3)
The external potential is hereafter referred to as bias and the cathodic and anodic directions as
negative and positive, respectively.
By measuring EIS with bias in either direction separately, the different contribution yield
information about the reaction that is occurring, its kinetics and limitations. These
measurements will then provide a better understanding of the electrodes behaviour under
various operations required for a positrode in a PCEC.
Figure 5.17 The difference in EIS measurements at OCV and bias at both directions for BGLC82:
Zn on a BZCY72 electrolyte at 500 ℃.
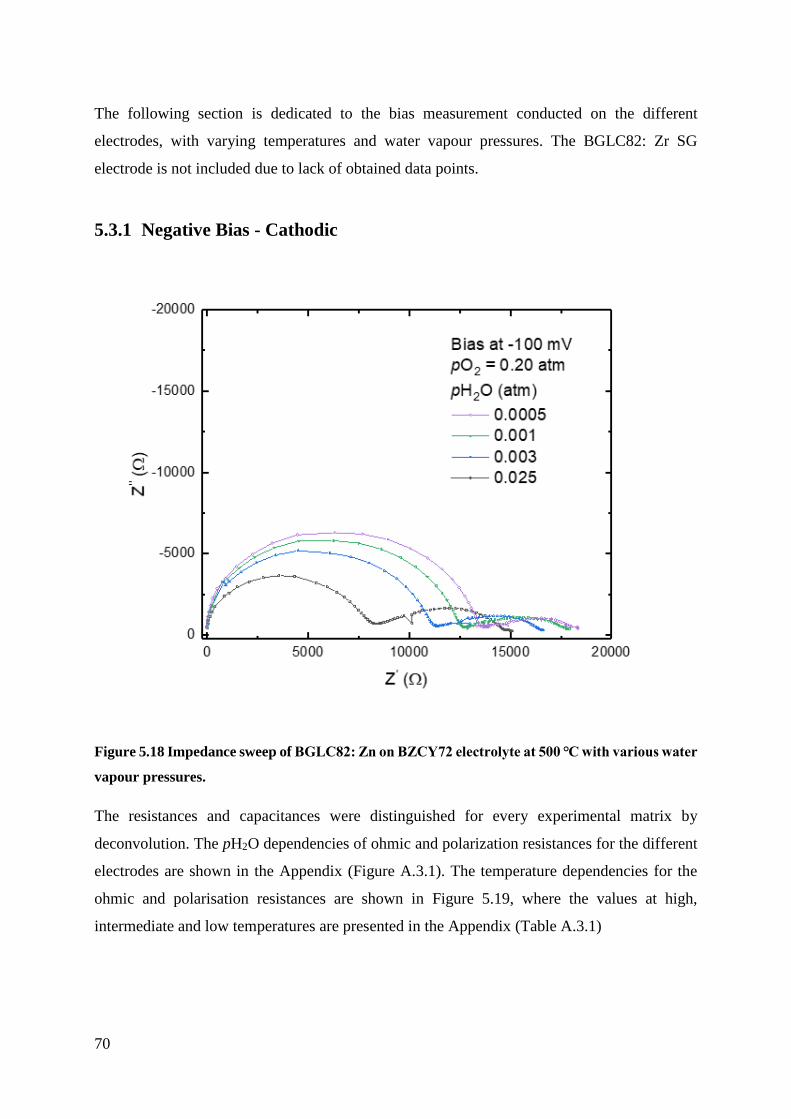
70
The following section is dedicated to the bias measurement conducted on the different
electrodes, with varying temperatures and water vapour pressures. The BGLC82: Zr SG
electrode is not included due to lack of obtained data points.
5.3.1 Negative Bias - Cathodic
Figure 5.18 Impedance sweep of BGLC82: Zn on BZCY72 electrolyte at 500 ℃ with various water
vapour pressures.
The resistances and capacitances were distinguished for every experimental matrix by
deconvolution. The pH2O dependencies of ohmic and polarization resistances for the different
electrodes are shown in the Appendix (Figure A.3.1). The temperature dependencies for the
ohmic and polarisation resistances are shown in Figure 5.19, where the values at high,
intermediate and low temperatures are presented in the Appendix (Table A.3.1)

71
Figure 5.19 Temperature dependencies for the ohmic and polarization resistances, where a)
ohmic, b) Rp,2 and c) Rp,3, for each of the electrodes.
The respective activation energies and pre-exponentials from Figure 5.19 are shown in the
Appendix in Table A.3.3.
Figure 5.20 Temperature dependencies for the respective capacitance for the resistance
contributions, where (■) are related to ohmic, (●) for Rp,2 and (▲) Rp,3, for each of the electrodes.
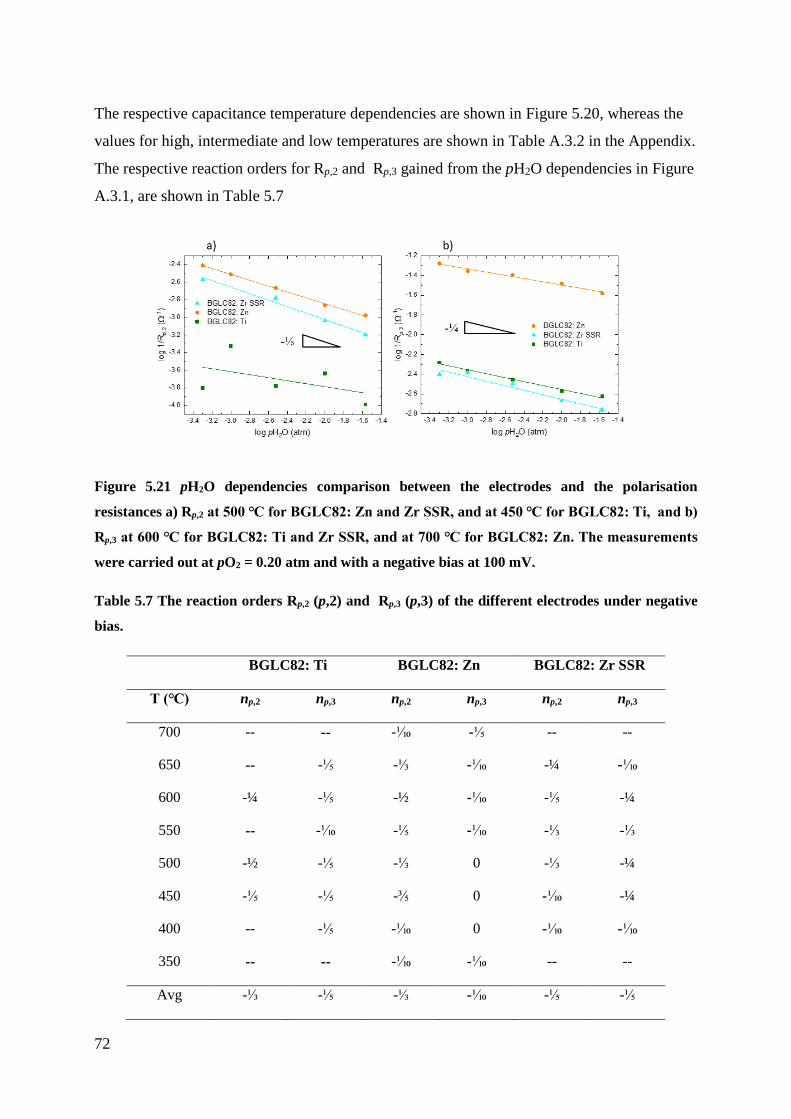
72
The respective capacitance temperature dependencies are shown in Figure 5.20, whereas the
values for high, intermediate and low temperatures are shown in Table A.3.2 in the Appendix.
The respective reaction orders for Rp,2 and Rp,3 gained from the pH2O dependencies in Figure
A.3.1, are shown in Table 5.7
Figure 5.21 pH2O dependencies comparison between the electrodes and the polarisation
resistances a) Rp,2 at 500 ℃ for BGLC82: Zn and Zr SSR, and at 450 ℃ for BGLC82: Ti, and b)
Rp,3 at 600 ℃ for BGLC82: Ti and Zr SSR, and at 700 ℃ for BGLC82: Zn. The measurements
were carried out at pO2 = 0.20 atm and with a negative bias at 100 mV.
Table 5.7 The reaction orders Rp,2 (p,2) and Rp,3 (p,3) of the different electrodes under negative
bias.
BGLC82: Ti BGLC82: Zn BGLC82: Zr SSR
T (℃) np,2 np,3 np,2 np,3 np,2 np,3
700 -- -- -⅒ -⅕ -- --
650 -- -⅕ -⅓ -⅒ -¼ -⅒
600 -¼ -⅕ -½ -⅒ -⅕ -¼
550 -- -⅒ -⅕ -⅒ -⅓ -⅓
500 -½ -⅕ -⅓ 0 -⅓ -¼
450 -⅕ -⅕ -⅗ 0 -⅒ -¼
400 -- -⅕ -⅒ 0 -⅒ -⅒
350 -- -- -⅒ -⅒ -- --
Avg -⅓ -⅕ -⅓ -⅒ -⅕ -⅕

73
5.3.2 Positive Bias - Anodic
Figure 5.22 Impedance sweep of BGLC82: Zn on BZCY72 electrolyte at 450 ℃ with various water
vapour pressures.
The electrode contributions were extracted from the EIS measurements, similar to what is
shown in Figure 5.22. The pH2O dependencies of the ohmic and polarization resistances are
shown in Figure A.4.1 in the Appendix. The temperature dependencies for each of the electrode
contributions are shown in Figure 5.23, where the respective values at high, intermediate and
low temperatures are present at Table A.4.1 in the Appendix.
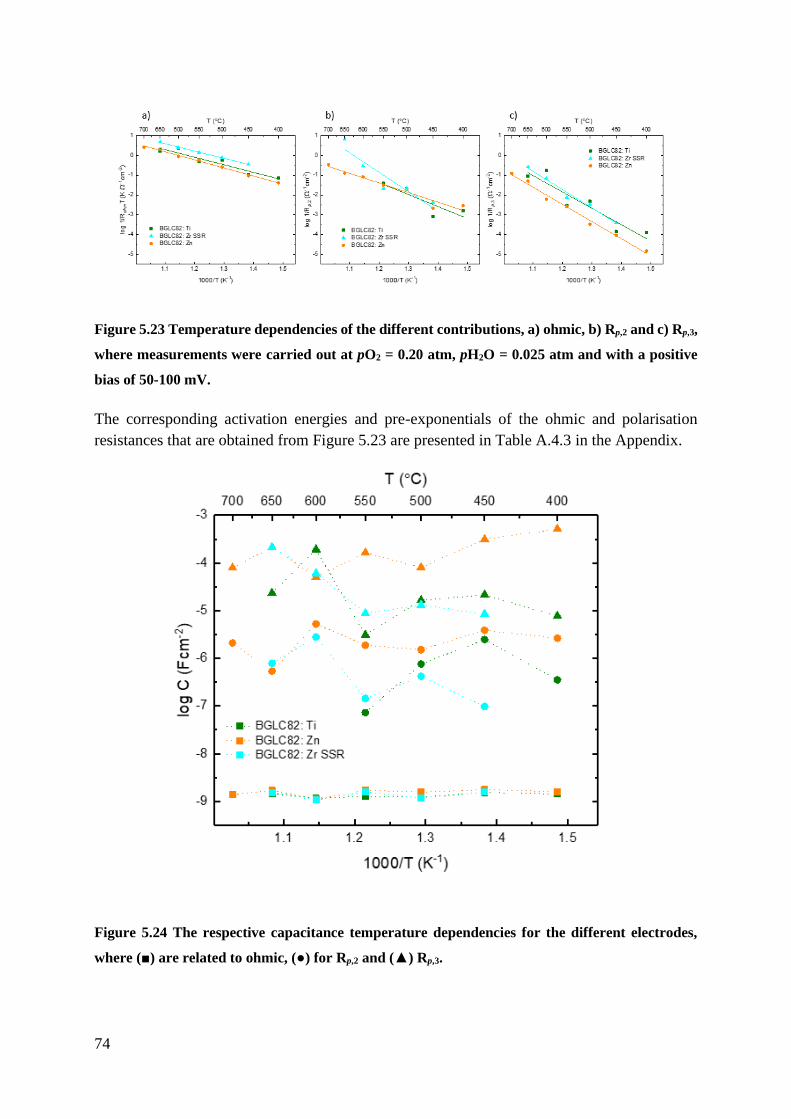
74
Figure 5.23 Temperature dependencies of the different contributions, a) ohmic, b) Rp,2 and c) Rp,3,
where measurements were carried out at pO2 = 0.20 atm, pH2O = 0.025 atm and with a positive
bias of 50-100 mV.
The corresponding activation energies and pre-exponentials of the ohmic and polarisation
resistances that are obtained from Figure 5.23 are presented in Table A.4.3 in the Appendix.
Figure 5.24 The respective capacitance temperature dependencies for the different electrodes,
where (■) are related to ohmic, (●) for Rp,2 and (▲) Rp,3.
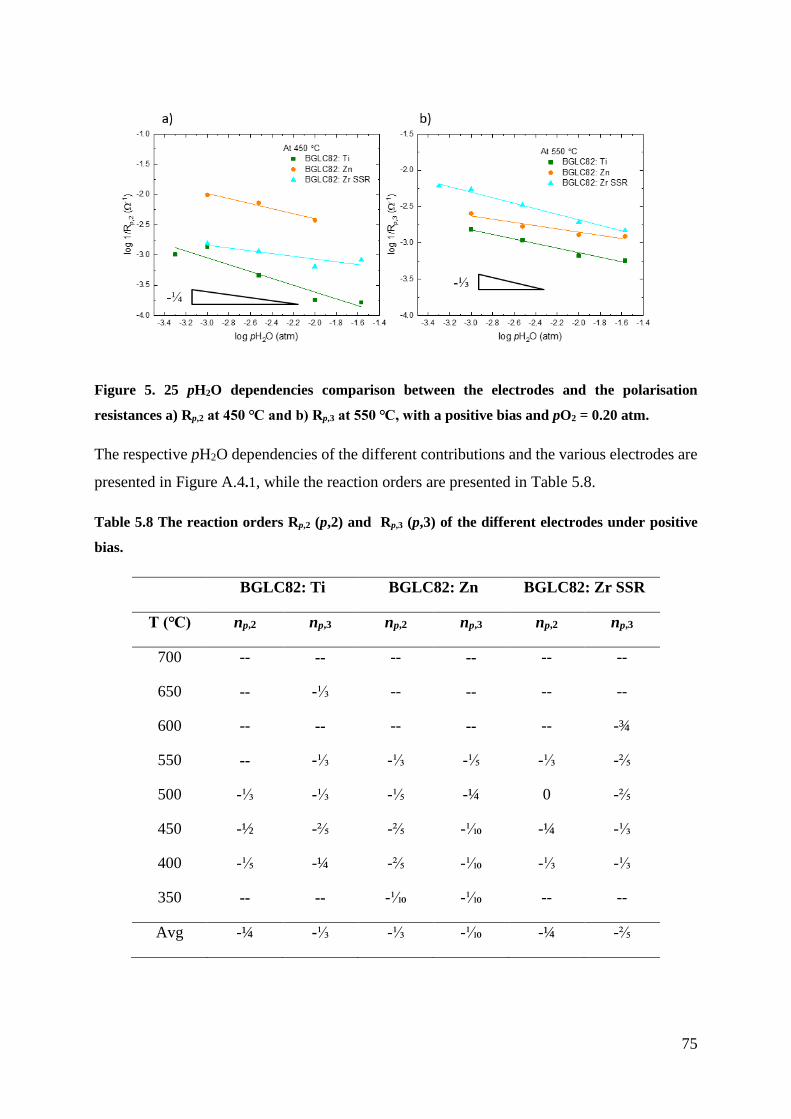
75
Figure 5. 25 pH2O dependencies comparison between the electrodes and the polarisation
resistances a) Rp,2 at 450 ℃ and b) Rp,3 at 550 ℃, with a positive bias and pO2 = 0.20 atm.
The respective pH2O dependencies of the different contributions and the various electrodes are
presented in Figure A.4.1, while the reaction orders are presented in Table 5.8.
Table 5.8 The reaction orders Rp,2 (p,2) and Rp,3 (p,3) of the different electrodes under positive
bias.
BGLC82: Ti BGLC82: Zn BGLC82: Zr SSR
T (℃) np,2 np,3 np,2 np,3 np,2 np,3
700 -- -- -- -- -- --
650 -- -⅓ -- -- -- --
600 -- -- -- -- -- -¾
550 -- -⅓ -⅓ -⅕ -⅓ -⅖
500 -⅓ -⅓ -⅕ -¼ 0 -⅖
450 -½ -⅖ -⅖ -⅒ -¼ -⅓
400 -⅕ -¼ -⅖ -⅒ -⅓ -⅓
350 -- -- -⅒ -⅒ -- --
Avg -¼ -⅓ -⅓ -⅒ -¼ -⅖

76
6 Discussion
The interpretation and discussion of the obtained results in this work are presented in this
chapter, with focus on clarifying the different behaviour between the electrodes at OCV and
bias, as well as comparing them to BGLC82. Proton uptake and structural properties are made
clear and are included in the analysis of the different electrode materials. Additionally, the
electrolyte contribution is interpreted to justify the experimental setup. Finally, possible
directions for further investigation of the prepared electrode are considered.
6.1 Structural - Insight
The electrode materials BGLC82: Ti and BGLC82: Zn were successfully synthesized by the
solid-state reaction, as shown by the XRD in Figure 5.1. The same synthesis approach was
unsuccessful in obtaining a pure single phase of BGLC82: Zr. The presence of a secondary
BaZrO3 phase was observed. The sol-gel approach of the BGLC82: Zr showed a decrease of
the secondary phase, but was not successful either in obtaining a pure single phase. The sol-gel
method has proven to yield a notably smaller amount of the secondary phase, indicating that
the solid-state reaction suffers from inhomogeneous distribution of precursors compared to the
sol-gel method, which has been reported when doping materials [75]. At the same time, the
small amount of the secondary phase obtained from the sol-gel method can be an indication
that the solubility limit of Zr in BGLC82 had been reached.
6.2 Proton Uptake
Due to the secondary phase in both BGLC:82 Zr, the proton uptake properties of these materials
were not tested, as the BaZrO3 might result in a higher proton uptake for the composite
electrode. The BGLC82: Ti and BGLC:82 Zn both exhibit water uptake from TGA
measurement, as shown in Figure 5.3. The two compositions of BGLC82 were exposed to D2O
vapour where BGLC82: Ti exhibited a second weight gain, as seen in Figure 5.2, which yielded
a higher proton uptake at 300 ℃ for BGLC82: Ti than BGLC82 and BGLC82: Zn. The
calculations is shown in the Appendix.

77
For materials with mixed valent cations (Co, Fe, Cu, etc.), like BGLC82, the electronic defects
are not minority defects, as explained in the theory part. This changes the proton uptake of
BGLC82: Zn and Ti. In addition, a proton uptake process for materials with mixed valent
cations, known as hydrogenation is reported in literature. The protonic defects are obtained
through hydrogenation, as shown below:
H2O (g) + 2OOx + 2MM
x ⇌ 2OHO• + 2MM
′ (6.1)
where M is a mixed valent cation.
By considering the defect model for mixed valent cations and the suggested defect model for
BGLC82 reported by Vøllestad et al. [13], the electroneutrality for BGLC82 acceptor doped
with zinc becomes
1
2[Co
Co
12′] +
3
2[Co
Co
32′] +
3
2[Zn
Co
32′] = 2[vO
••] +1
2[Co
Co
12•] + [OHO
• ] (6.2)
and for BGLC82 donor doped with titanium
1
2[Co
Co
12′] +
3
2[Co
Co
32′] = [OHO
• ] + 2[vO••] +
1
2[Ti
Co
12•]
(6.3)
TGA measurements, shows that BGLC82 acceptor-doped with zinc exhibits smaller proton
uptake than BGLC82, as shown in Figure 5.3. The acceptor-doped BGLC82 exhibit no weight
gain at the D2O shift as seen in Figure 5.2, indicating the proton uptake is too small to measure
with TGA, and the majority of the weight gain is from oxygen, as the material obtains protonic
defects through hydration. The proton uptake decreased upon acceptor doping suggesting that
the concentration of oxygen vacancies are not increased with the acceptor defect and the
increase of holes in the form of CoCo
1
2•
, is known to reduce proton stability, as seen in the
electroneutrality (Equation 6.2).
For the donor-doped sample with titanium, the electroneutrality (Equation 6.3) indicates that
the oxygen vacancies are not a compensating defect of titanium. This implies that the proton
uptake from hydration will not increase with the dopant. The donor-dopant is compensated by
electrons in the form of CoCo
1
2′
and CoCo
3
2′
and strengthen the proton stability as seen in the
electroneutrality (Equation 6.3). BGLC82: Ti exhibits a weight increase with the D2O shift, as
78
seen in Figure 5.2. The increase observed was ⅔ of the H2O shift, making the proton uptake too
significant to only be related to hydration and indicating that hydrogenation occurs for the
material. The weight gain obtained from D2O implies that 94 % of the protons are obtained by
hydrogenation, whereas the rest of the protons (6 %) are obtained by hydration. The higher
temperatures measurements indicate that more oxygen vacancies occur as the ratio between
hydrogenation and hydration becomes 65 % and 35 %. The TGA measurements of BGLC82:
Ti correspond to reported observations in the literature where the basicity of the dopant
stabilises the protonic defect in the oxides [47, 48, 69].
6.3 Positrode at OCV – Insight
One of the main objectives of this work is to understand the effect of dopants on B-site for
BGLC82. In this section, behaviours and results obtained from OCV measurement of the
different electrodes will be compared to literature values, and each other to understand the effect
of substitution on B-site for BGLC82. First, insight into the values from the electrolyte
behaviour to validate the experimental setup.
6.3.1 Electrolyte contribution
The measurement setup allowed a large variety of electrodes to be tested over a short amount
of time by placing them on the same electrolyte. The question if the measurements obtained by
the experimental setup are comparable with each other and documented work has to be
discussed.
An attempt to justify the experimental setup is made by looking at the activation energy values
obtained from the different electrodes. From Table 5.5, the activation energies for the ohmic
contribution measured at the different electrodes are similar to each other, with an average of
0.71 eV ± 0.089. The average activation energy is similar to the reported value in M.K. Pedersen
work [71] where the BGLC82 pellet was placed on a BZCY72 electrolyte pellet, with an
activation energy of 0.785 eV ± 0.065. However, the values are higher than other reported
literature values of 0.4 – 0.6 eV [38, 76]. The discrepancy between the values might originate
due to grain boundary resistance in the measured resistance. The grain boundary has shown to
affect the proton conductivity through oxides [52], which results in an average conductivity of
protons described by Equation 2.24. The average activation energy for protons moving through

79
the grain boundary regions and grain boundary-free regions is given by the total conductivity
of protons defined by the Arrhenius equation for jumping mechanisms (Equation 2.27).
Furthermore, the electrolyte capacitances obtained at OCV were measured to be in a range of
~10-10–10-9 Fcm-2 for all the electrodes, which implies that the same process occurs for the
different measurements. The consistency of capacitances and activation energies for the
electrolyte implies that the experimental setup provided acceptable data for each of the
electrodes.
6.3.2 Positrode contribution
As mentioned earlier, the values for the Rp,2 and Rp,3 exhibit scattering of the data points for the
temperature dependencies, as the measurements were carried out in the following temperature
order 600 – 350, 650, 550, and 450, which led to some inaccuracy in the data. The data points
are still included, as there is no significant change in the results by not including them.
The question if there is a Rp,2 contributions that can be seen in the impedance measurement
remains, as there is no notable semicircle at the mid-frequency range like for Rohm and Rp,3.
However, deconvolution of the different impedances implies that there is a contribution, but
masked by the two significant contributions Rohm and Rp,3. The masking of the Rp,2 contributions
results in challenges in obtaining acceptable data points, which can be seen in the pO2 and pH2O
dependencies in Figure 5.12 b) and Figure 5.15 b).
Rp,2 contribution
The Rp,2 contributions are observed in the mid-frequency range in the impedance, where the
charge transfer processes appear. The obtained values of the capacitances were in a range of
~10-8 – 10-6 Fcm-2 for all the electrodes, as seen in Figure 5.9 and Table 5.4.

80
Figure 6.1 Temperature dependencies of Rp,2 for the different electrodes.
The activation energies of Rp,2 average around 1.4 eV ± 0.2 for all the electrodes, as shown in
Table 5.5. BGLC82 seems to exhibit a similar activation energy at temperatures between 700 –
500 ℃ [71]. BGLC82 exhibits a lower activation energy for Rp,2 of 0.85 eV at 500 – 350 ℃
[71]. This change in activation energy was not observed for any of the tested electrodes in this
work. The similar capacitances and activation energies for the tested electrodes imply that the
same type of process is measured over the temperatures range and the different electrodes.
Table 6.1 The Rp,2 resistance at 400 ℃ for the different BGLC82 compositions and BGLC82.
BGLC82: Zn BGLC82: Ti BGLC82: Zr SSR BGLC82: ZR SG BGLC82[71]
Rp,2 at 400 ℃ 3.2 kΩcm2 2.9 kΩcm2 1.7 kΩcm2 1.4 kΩcm2 2.3 kΩcm2
The Rp,2 values at 400 ℃ for all the electrodes are seen in Table 6.1. BGLC82: Zr SG obtained
the lowest resistance of all the electrodes tested and the literature value of BGLC82. The
BGLC82: Zr SSR exhibit similar resistance as the BGLC82: Zr SG electrode, where BGLC82:
Ti and Zn obtain a similar resistance ~ 3 kΩcm2.
1.1 1.2 1.3 1.4 1.5 1.6-4
-3
-2
-1 BGLC82: Zn
BGLC82: Zr SSR
BGLC82: Zr SG
BGLC82: Ti
log
1/R
p,2
(
-1cm
-2)
1000/T (K-1)
700 650 600 550 500 450 400 350
T (C)
81
Table 6.2 The pre-exponential factor (A0) of Rp,2 for the tested electrodes and BGLC82.
BGLC82: Zn BGLC82: Ti BGLC82: Zr SSR BGLC82: ZR SG BGLC82[71]
A0 for Rp,2
(Ω-1cm-2)
1.7 · 106 -- 7.4 · 105 1.2 · 107 7.2 · 106
For the pre-exponential factor, BGLC82: Zr SG exhibit the highest values of all the electrode
and BGLC82, as seen in Table 6.2. The high value indicates that BGLC82: Zr SG has more
active sites for the charge transfer reaction than the other electrodes. The pre-exponential and
the low Rp,2 resistance indicates that BGLC82: Zr SG performed better than BGLC82.
For the Rp,2, the different electrodes exhibit pO2 dependencies close to ⅓ and a negative water
vapour dependencies between 0 and -⅓. The dependencies indicate that the redox reaction of
absorbed oxygen, Reaction 2.32, is the rate-limiting step for the Rp,2 contributions. This step
has also been suggested as a possible RDS by Poetzsch et al. [18]. The Rp,2 exhibited negative
water dependencies at all the electrodes. This can be an indication that the electrode surface is
saturated with OH- and H2O. This means that the electrodes are not operating in dilute
conditions. This implies that the Langmuir isotherm model is not valid, as there is too few no
open sites at the electrode surface
An explanation for the performance of the BGLC82: Zr SG electrode is that at a lower
temperature, proton uptake for the electrode increases, as shown for BGLC82: Ti. This
behaviour suggests that BGLC82: Zr can exhibit higher proton uptake than BGLC82 and
BGLC82: Ti. However, BGLC82: Zr SSR showed similar performance as BGLC82: Zr SG,
but XRD showed a higher amount of BaZrO3 than the sol-gel method and therefore experienced
the similar performance as it is seen as a composite electrode.
Rp,3 contribution
The Rp,3 polarisation resistance exhibit capacitances in a range of ~10-6-10-5 Fcm-2, which is
close to the capacitance of Rp,2. However, the Rp,3 are seen as the third semicircle in the Nyquist
plot, which is the low-frequency range where the mass transfer contribution appears.
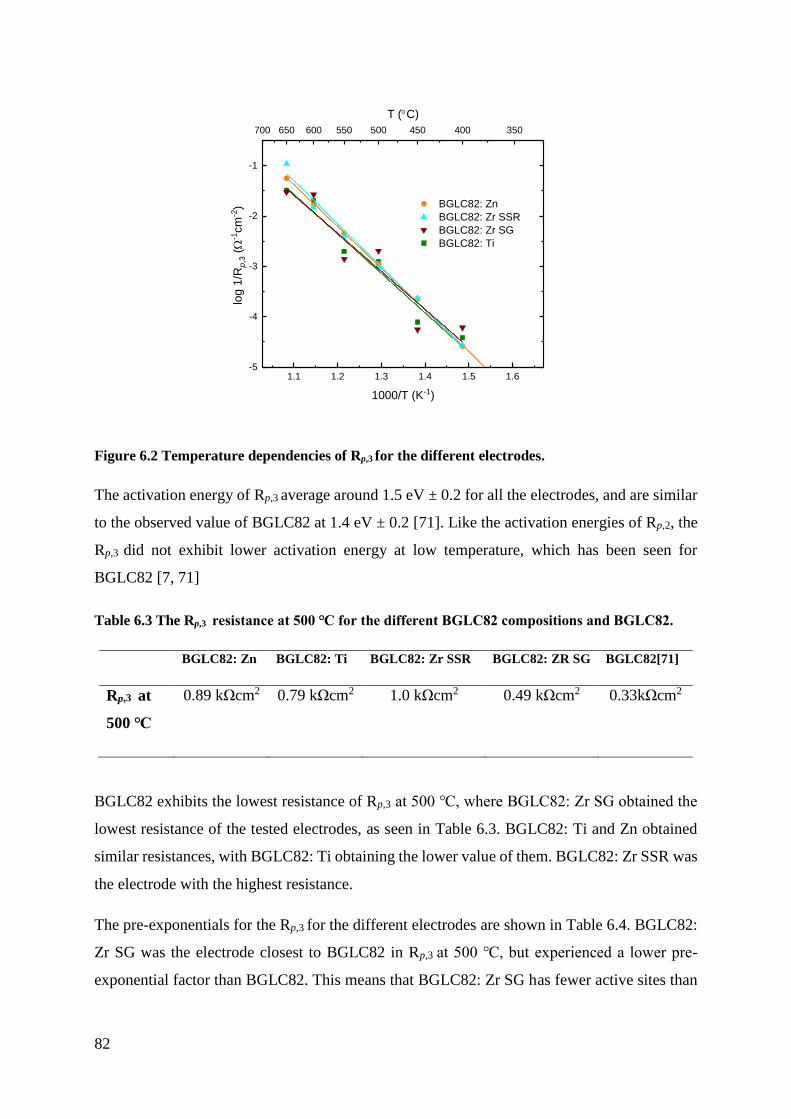
82
Figure 6.2 Temperature dependencies of Rp,3 for the different electrodes.
The activation energy of Rp,3 average around 1.5 eV ± 0.2 for all the electrodes, and are similar
to the observed value of BGLC82 at 1.4 eV ± 0.2 [71]. Like the activation energies of Rp,2, the
Rp,3 did not exhibit lower activation energy at low temperature, which has been seen for
BGLC82 [7, 71]
Table 6.3 The Rp,3 resistance at 500 ℃ for the different BGLC82 compositions and BGLC82.
BGLC82: Zn BGLC82: Ti BGLC82: Zr SSR BGLC82: ZR SG BGLC82[71]
Rp,3 at
500 ℃
0.89 kΩcm2 0.79 kΩcm2 1.0 kΩcm2 0.49 kΩcm2 0.33kΩcm2
BGLC82 exhibits the lowest resistance of Rp,3 at 500 ℃, where BGLC82: Zr SG obtained the
lowest resistance of the tested electrodes, as seen in Table 6.3. BGLC82: Ti and Zn obtained
similar resistances, with BGLC82: Ti obtaining the lower value of them. BGLC82: Zr SSR was
the electrode with the highest resistance.
The pre-exponentials for the Rp,3 for the different electrodes are shown in Table 6.4. BGLC82:
Zr SG was the electrode closest to BGLC82 in Rp,3 at 500 ℃, but experienced a lower pre-
exponential factor than BGLC82. This means that BGLC82: Zr SG has fewer active sites than
1.1 1.2 1.3 1.4 1.5 1.6-5
-4
-3
-2
-1
BGLC82: Zn
BGLC82: Zr SSR
BGLC82: Zr SG
BGLC82: Tilo
g 1
/Rp
,3 (
-1cm
-2)
1000/T (K-1)
700 650 600 550 500 450 400 350
T (C)

83
BGLC82. For the other electrodes BGLC82: Ti obtained a pre-exponential close to BGLC82:
Zr SG. BGLC82: Zn and Zr SSR obtained a similar pre-exponential as BGLC82.
Table 6.4 The pre-exponential factor (A0) of Rp,3 for the tested electrodes and BGLC82.
BGLC82: Zn BGLC82: Ti BGLC82: Zr SSR BGLC82: ZR SG BGLC82[71]
A0 for Rp,3
(Ω-1cm-2)
1.0 · 107 2.2 · 106 2.4 · 107 1.0 · 106 1.2 · 107
For the oxygen and water vapour dependencies, the electrodes exhibit a positive pO2
dependency of ⅖ and a negative water vapour dependency of - ¼. The dependencies indicate
that the rate-limiting step is the dissociative exchange of oxygen (Reaction 2.34) [18]. The
negative pH2O dependency for Rp,3, indicates that the electrode surface is saturated as
mentioned for Rp,2.
The Rp,3 resistances of the electrodes exhibit to be higher compared to BGLC82. Previous work
has shown that BGLC82 exhibit polarization resistance down to 0.5 Ωcm2 at 650 ℃ [7] and 5.2
kΩcm2 at 350 ℃ [71]. This difference might be due to the size of the working electrodes and
microstructure, as the mass transfer processes will vary with electrode size because the
processes that yield polarisation resistance are absorption and desorption of species. Other
studies have shown low polarisation resistance in large-area PCFC [77, 78]. This indicates that
the normalizing area should be different for the charge transfer and mass transfer processes
when presented.

84
6.4 Positrode at Bias –Insight
Positrode materials for PCEC should exhibit high performances in both directions of the
positrode reaction. EIS measurements at OCV yield an average performance of the positrode
as both direction equally dominates. By applying either a negative or positive bias, one of the
direction will dominate and provide specialised results for the positrode. These results will
disclose whether the positrode performers best as an anode or cathode.
6.4.1 Electrolyte at Bias
The obtained data from the ohmic contributions is shown in Table A.3.1-Table A.3.3 for the
negative bias, and Table A.4.1 – Table A.4.3 for the positive bias measurements.
The validity of the experimental setup can be determined by comparing the results of the
electrolyte OCV and bias measurements. The jumping mechanism determines the movement
of protons in the electrolyte according to the Nernst-Einstein relationship (Equation 2.26). This
means that the proton should experience the same energy barrier for different potentials, as the
potential gradient does not affect the diffusion of species. The activation energies for the
electrolyte are presented in Table 6.5 for both positive and negative bias and OCV.
Table 6.5 Activation energies (Ea) for the proton jumping at different bias and OCV, with the
different BGLC82 composition as the working electrode. The obtained Ea of the bias
measurements are found in the Appendix.
Ea at Positive-bias (eV) Ea at OCV (eV) Ea at Negative-bias (eV)
BGLC82: Zn 0.70 ± 0.02 0.69 ± 0.02 0.74 ± 0.03
BGLC82: Ti 0.7 ± 0.1 0.8 ± 0.1 0.8 ± 0.1
BGLC82: Zr SSR 0.73 ± 0.02 0.77 ± 0.01 0.74 ± 0.02
BGLC82: Zr SG -- 0.6 ± 0.2 --
Avg 0.7 ± 0.1 0.7 ± 0.3 0.8 ± 0.1
The activation energies for proton jumping obtained from the electrochemical measurements
are similar to each other, despite the different potentials. The results imply that the same
85
mechanism occurs in the electrolyte, independent of change in the potential gradient. This
compliance with the theory means that the jumping mechanism is not affected by a potential
gradient.
The capacitances from both the positive and negative bias measurements obtained similar
values as the OCV measurements, of ~10-9 Fcm-2. This suggests that the same process occurs
in the electrolyte during all the measurement with different working electrodes and different
biases.
6.4.2 Positrode Behaviour at Negativ Bias
When the electrochemical cell is exposed to a negative bias under impedance measurements,
the positrode reaction moves towards the cathodic reaction. The positrodes then become
cathodes, and the positrode reaction becomes:
O2(g) + 4e− + 4H+ → H2O (g) (6.4)
Capacitances for the two electrode polarization resistances are seen in Table A.3.2 in the
Appendix. The obtained values were in a range of ~10-8-10-6 Fcm-2 for Rp,2, and ~10-6-10-4 Fcm-
2 for Rp,3. The capacitances for Rp,2 and Rp,3 indicate that the same positrode process takes place
when measuring at OCV and negative bias.
The activation energies of Rp,2 average around 1.3 eV ± 0.1 for all the electrodes, and are similar
to the obtained values of the OCV measurements, as seen in the previous section. For the Rp,3,
the activation energies of BGLC82: Ti and Zn are similar and average around 1.52 eV ± 0.07.
For the BGLC82: Zr SSR electrode, the activation energy was 1.84 eV ± 0.09.
The activation energies of Rp,3 for BGLC82: Ti and Zn at negative bias are similar to the OCV
measurements. However, BGLC82: Zr SSR exhibits higher activation energy than the OCV
measurements. This change in activation energy proposes that a different process occurs for the
BGLC82: Zr SSR electrode.
The obtained values for capacitances and activation energies imply that the same process is
measured for Rp,2 at negative bias as for OCV. The Rp,3 values were similar to what was
observed at OCV for BGLC82: Ti and Zn. As mention above, BGLC82: Zr SSR exhibits a
higher activation energy than at OCV and proposes that a different process occurs. However,
pH2O dependencies, from Table 5.7, implies that the rate-limiting step is the same.

86
Table 6.6 Polarisation resistances for the different electrodes at negative bias.
T (℃) Rp,2 at negative bias
(kΩcm2)
Rp,3 at negative bias
(kΩcm2)
BGLC82: Ti 500 0.21 1.3
400 6.3 44
BGLC82: Zn 500 0.18 1.2
400 2.6 23
BGLC82: Zr SSR 500 0.31 1.9
400 2.1III 41IV
The Rp,2 and Rp,3 values in Table 6.6 show that BGLC82: Zn exhibits the lowest resistance of
all the electrodes under negative bias. The pre-exponential of BGLC82: Zn is also similar to
what is observed at OCV. BGLC82: Ti and BGLC82: Zr SSR electrodes exhibit similar values,
as seen in Table 6.6. However, BGLC82: Zr SSR obtained a higher pre-exponential factor than
at OCV. The increase implies that there are more active sites for the reaction, but the electrode
obtained higher resistance than BGLC82: Zn, as shown in Table A.3.3. This suggests that there
is a change in the rate-limiting step that defines Rp,3 for BGLC82: Zr SSR. The lack of pO2
dependency with negative bias measurements makes it difficult to propose a different rate-
limiting step for the electrode. The resistances obtained by the negative bias measurement
indicate that BGLC82: Zn is the best performing positrode as a cathode.
6.4.3 Positrode Behaviour at Positive Bias
When the electrochemical cell is exposed to a positive bias, the positrode reaction moves
towards the anodic reaction. The positrodes then become an anode, and the positrode reaction
becomes:
O2(g) + 4e− + 4H+ ← H2O (g) (6.5)
III The value is an estimate from the linear regression in Figure 5.19 b) IV The value is an estimate from the linear regression inFigure 5.19 c).
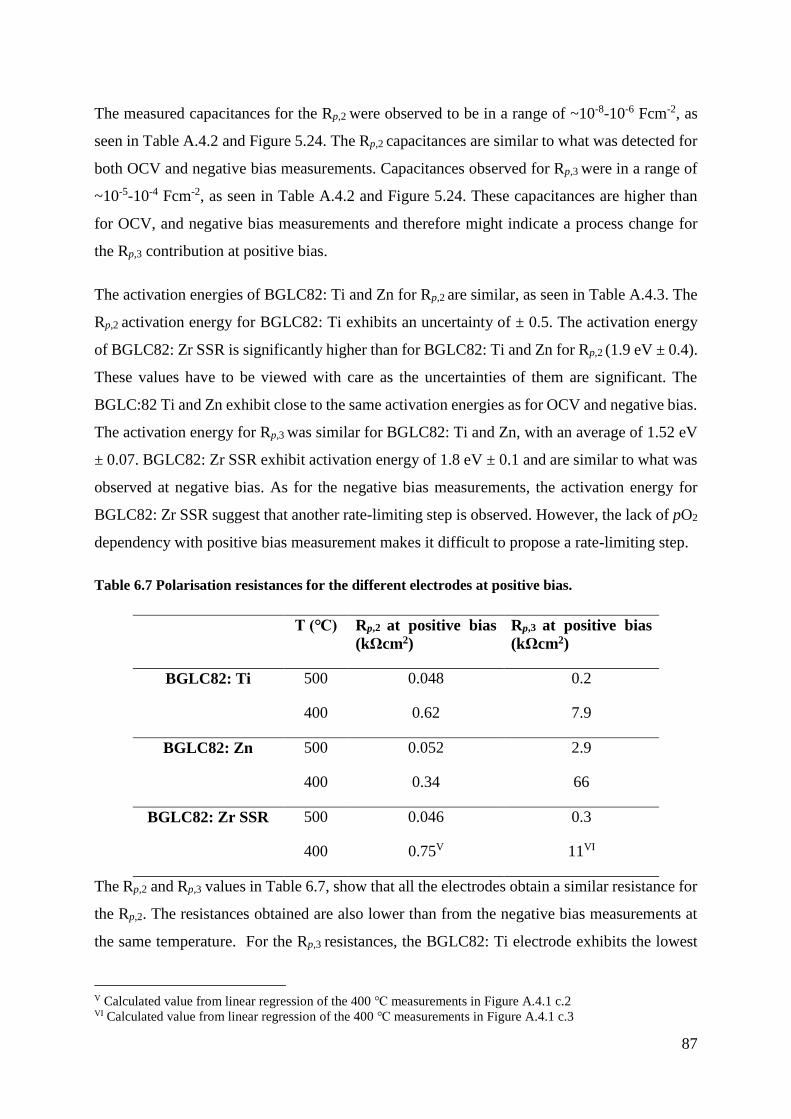
87
The measured capacitances for the Rp,2 were observed to be in a range of ~10-8-10-6 Fcm-2, as
seen in Table A.4.2 and Figure 5.24. The Rp,2 capacitances are similar to what was detected for
both OCV and negative bias measurements. Capacitances observed for Rp,3 were in a range of
~10-5-10-4 Fcm-2, as seen in Table A.4.2 and Figure 5.24. These capacitances are higher than
for OCV, and negative bias measurements and therefore might indicate a process change for
the Rp,3 contribution at positive bias.
The activation energies of BGLC82: Ti and Zn for Rp,2 are similar, as seen in Table A.4.3. The
Rp,2 activation energy for BGLC82: Ti exhibits an uncertainty of ± 0.5. The activation energy
of BGLC82: Zr SSR is significantly higher than for BGLC82: Ti and Zn for Rp,2 (1.9 eV ± 0.4).
These values have to be viewed with care as the uncertainties of them are significant. The
BGLC:82 Ti and Zn exhibit close to the same activation energies as for OCV and negative bias.
The activation energy for Rp,3 was similar for BGLC82: Ti and Zn, with an average of 1.52 eV
± 0.07. BGLC82: Zr SSR exhibit activation energy of 1.8 eV ± 0.1 and are similar to what was
observed at negative bias. As for the negative bias measurements, the activation energy for
BGLC82: Zr SSR suggest that another rate-limiting step is observed. However, the lack of pO2
dependency with positive bias measurement makes it difficult to propose a rate-limiting step.
Table 6.7 Polarisation resistances for the different electrodes at positive bias.
T (℃) Rp,2 at positive bias
(kΩcm2)
Rp,3 at positive bias
(kΩcm2)
BGLC82: Ti 500 0.048 0.2
400 0.62 7.9
BGLC82: Zn 500 0.052 2.9
400 0.34 66
BGLC82: Zr SSR 500 0.046 0.3
400 0.75V 11VI
The Rp,2 and Rp,3 values in Table 6.7, show that all the electrodes obtain a similar resistance for
the Rp,2. The resistances obtained are also lower than from the negative bias measurements at
the same temperature. For the Rp,3 resistances, the BGLC82: Ti electrode exhibits the lowest
V Calculated value from linear regression of the 400 ℃ measurements in Figure A.4.1 c.2 VI Calculated value from linear regression of the 400 ℃ measurements in Figure A.4.1 c.3

88
resistance of all the electrodes. For the pre-exponential factor, BGLC82: Ti obtain a higher
value than BGLC82: Zn, and it implies that BGLC82: Ti has more active sites than BGLC82:
Zn. For the BGLC82: Zr SSR, the pre-exponential is higher than BGLC82: Ti and Zn. However,
the higher activation energy and high Rp,3 implies that another rate-limiting step causes the
electrode to perform worse than BGLC82: Ti. This implies that BGLC82: Ti is the best
performing positrode as an anode.
6.4.4 Performance under Bias
BGLC82: Ti exhibit the lowest resistance at the positive bias of all the electrode. As mention
above, this implies that BGLC82: Ti is the best positrode used as an anode. When a positrode
is used as an anode, the PCEC are in electrolyser mode (Reaction 6.5). In Figure 6.3, the total
polarization resistance (Rp,T = Rp,2 + Rp,3) at OCV and for bias measurements are presented.
Figure 6.3 Total polarization resistance (Rp,T) of BGLC82: Ti at OVC and bias.
1.1 1.2 1.3 1.4 1.5 1.6-5.0
-4.5
-4.0
-3.5
-3.0
-2.5
-2.0
-1.5
-1.0
BGLC82: Ti at Positive bias
BGLC82: Ti at Negativ bias
BGLC82: Ti at OCV
log
1/R
p,T
(
-1cm
-2)
1000/T (K-1)
650 600 550 500 450 400
T (C)
1E-5
1E-4
0.001
0.01
0.1
1/R
p,T
(
-1cm
-2)

89
The Rp,T of positive bias measurements is seen lower than the OCV and negative bias
measurement. This implies that the electrode performs better at positive bias. However, for an
ideal electrode, the Rp,T should be the same for negative and positive bias, as seen in Figure 2.7.
BGLC82: Zn was the electrode that exhibited the best performance at negative bias, thus as a
cathode. In Figure 6.4 the similar behaviour as for BGLC82: Ti is observed only reversed. The
Rp,T for negative bias is lower than for the positive bias.
Figure 6.4 Total polarization resistance (Rp,T) for BGLC82: Zn at OVC and bias.
In Figure 6.5, the Rp,T exhibit the same behaviour as for BGLC82: Ti, with Rp,T of the positive
measurement lower than OCV and negative bias, for BGLC82: Zr SSR.
1.1 1.2 1.3 1.4 1.5 1.6 1.7
-5
-4
-3
-2
-1
BGLC82: Zn at Positive bias
BGLC82: Zn at Negativ bias
BGLC82: Zn at OCV
log
1/R
p,T
(
-1cm
-2)
1000/T (K-1)
700 650 600 550 500 450 400 350
T (C)
1E-5
1E-4
0.001
0.01
0.1
1/R
p,T
(
-1cm
-2)
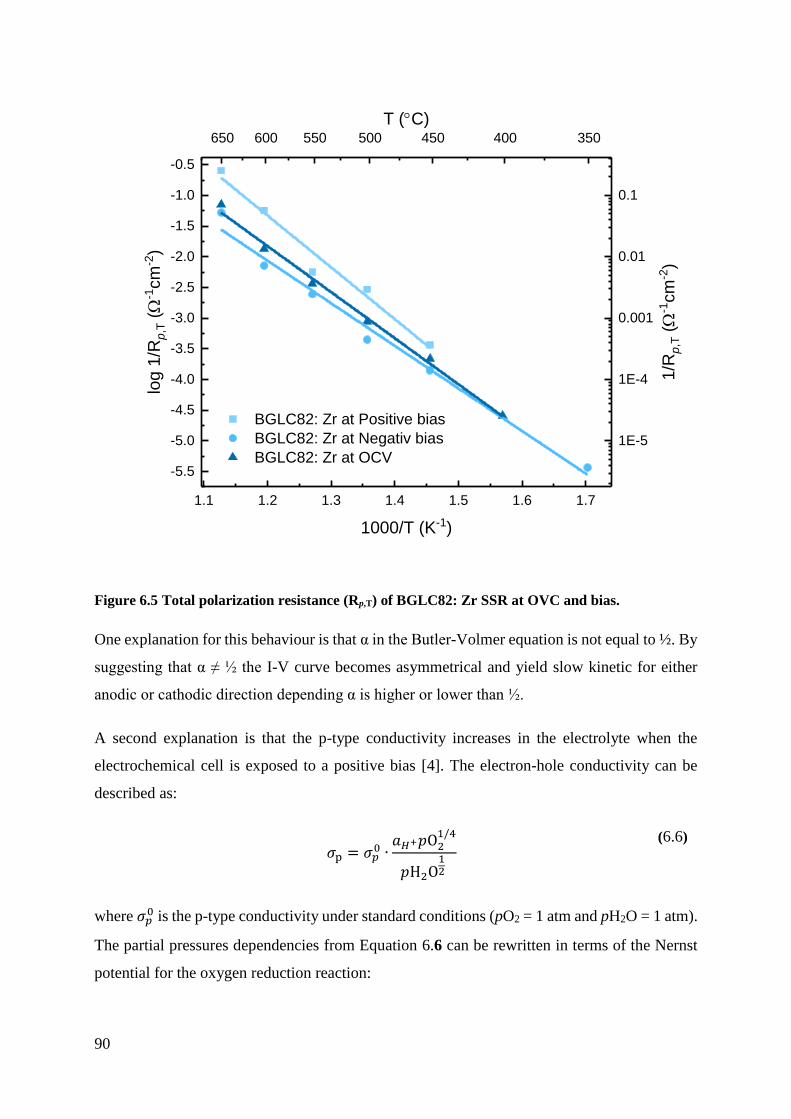
90
Figure 6.5 Total polarization resistance (Rp,T) of BGLC82: Zr SSR at OVC and bias.
One explanation for this behaviour is that α in the Butler-Volmer equation is not equal to ½. By
suggesting that α ≠ ½ the I-V curve becomes asymmetrical and yield slow kinetic for either
anodic or cathodic direction depending α is higher or lower than ½.
A second explanation is that the p-type conductivity increases in the electrolyte when the
electrochemical cell is exposed to a positive bias [4]. The electron-hole conductivity can be
described as:
𝜎p = 𝜎𝑝
0 ∙𝑎𝐻+𝑝O2
1/4
𝑝H2O12
(6.6)
where 𝜎𝑝0 is the p-type conductivity under standard conditions (pO2 = 1 atm and pH2O = 1 atm).
The partial pressures dependencies from Equation 6.6 can be rewritten in terms of the Nernst
potential for the oxygen reduction reaction:
1.1 1.2 1.3 1.4 1.5 1.6 1.7
-5.5
-5.0
-4.5
-4.0
-3.5
-3.0
-2.5
-2.0
-1.5
-1.0
-0.5
BGLC82: Zr at Positive bias
BGLC82: Zr at Negativ bias
BGLC82: Zr at OCV
log
1/R
p,T
(
-1cm
-2)
1000/T (K-1)
650 600 550 500 450 400 350
T (C)
1E-5
1E-4
0.001
0.01
0.1
1/R
p,T
(
-1cm
-2)
91
E = E0 +𝑅𝑇
2𝐹ln(
𝑎𝐻+𝑝𝑂2
12
𝑝𝐻2𝑂)
(6.7)
By combining Equation 6.6 and 6.7, gives the p-type conductivity in terms of potential changes:
𝜎p = 𝜎p
0 ∙ exp (𝐹(𝐸 − 𝐸0)
𝑅𝑇)
(6.8)
From the equation above, the p-type conductivity increases with the increasing potential E for
the electrolyte. This implies that the increase of the potential increases the pO2. From Figure
2.3 and Figure 2.5, the hole concentration for both BZY and BGLC82 increases with increasing
pO2. This increase the p-type conductivity in the materials and results in lower measured
resistances by electronic leakage through the electrolyte [4, 7]. From Equation 6.6, the p-type
conductivity is decreasing by an increase of the pH2O. This can also be an explanation for the
negative water dependencies for the polarization resistances.
The third explanation is that the rate-limiting step changed for the electrode when it is exposed
to different bias. By changing the rate-limiting step for the different bias measurement, the
exchange current density (𝑗0) changes. From the theory in Section 2.5.2, the exchange current
density includes the rate of both the anodic and cathodic direction of a process. The anodic and
cathodic rate of a process includes concentrations of the involved species and partial pressures
of oxygen and water vapour. When the electrode rate-limiting step changes as a consequence
of the potential direction. The exchange current density is different for the different potential
and yield a different resistance for the polarization resistances.

92
6.5 Further Work
A natural continuation of this work is to investigate the electrodes more thoroughly at
temperatures between 300 – 500 ℃. This will give a better understanding of whether the
electrodes experience proton conductivity through bulk or surface.
Furthermore, the oxygen nonstoichiometry for the different BGLC82 compositions should be
investigated. This will give a broader understanding of doping in BGLC82 related to proton
uptake. Different quantities of the dopants in BGLC82 should be investigated to get a greater
understanding of the effect of doping.
The study of the size differences of the same working electrode would give insight into the
change in Rp. This might result in a novel way to compare different electrodes Rp.
The sol-gel synthesis of BGLC82: Zr revealed that the solubility limit of zirconia in BGLC82
might have been reached. The synthesis of a single phase of BGLC82: Zr and the subsequent
testing of the material in the same manner as in this work would reveal whether BGLC82: Zr
performs better than the tested electrode in this work or not.
As mentioned in the introduction, a PEMFC is struggling with slow electrode kinetics. From
recent work, double-perovskites like BGLC82 have shown to obtain close to similar
performances as noble metals [79]. Testing BGLC82 with and without different dopants at room
temperature will clarify whether BGLC82 exhibits the same behaviour with the dopants as in
the high-temperature measurement. Additionally, it would provide more research into the
development of electrodes with multi-usage.
93
7 Summarising conclusions
In the presented work, functional properties and performances of BaGd0.8La0.2Co1.8X0.2O6-δ (X
= Zn, Ti and Zr) as PCECs positrodes were investigated. The Ti and Zn compositions were
successfully synthesized with solid-state reaction. The Zr composition was synthesized with
both solid-state reaction and sol-gel methods but was not obtained as a single phase of BGLC82:
Zr. The sol-gel method implies that solubility of Zr in BGLC82 was reached. The materials
were pressed to pellets and sintered to a density of around 80 %.
Powders of the Ti and Zn compositions were tested for proton uptake with TGA at 300-500 ℃.
BGLC82: Ti exhibits a higher proton concentration than BGLC82: Zn and for BGLC82. The
proton uptake indicated that hydrogenation occurs for the Ti composition at all the tested
temperatures. The high proton uptake related to what has been reported on materials doped with
more basic cations [69].
The experimental setup was obtained by placing the different electrodes on a BZCY72
electrolyte pellet. The electrode surface that were in contact with the electrolyte and the
electrolyte surface were polished to obtain an acceptable contact. The reference and counter
electrode were made of platinum, placed on the opposite side of the working electrodes.
Electrochemical impedance spectroscopy was measured at OCV and negative and positive bias.
The measurements were carried out under controlled atmospheres and varying temperatures.
All of the measurements were successfully carried out for all the electrodes.
The electrolyte contribution exhibit similar activation energy for all the measurements from the
different electrodes. The obtained activation energies averaged around 0.7 eV ± 0.4 for all the
measurements and electrodes. This result justifies the experimental setup as the activation
energy for the electrolyte contribution should be the same independent of the working electrode.
From the OCV measurement, the polarization resistances were compared with literature values
for BGLC82. The BGLC82: Zr SG was the electrode that exhibited close to the same
performance as reported for BGLC82 for both Rp,2 and Rp,3. For the two electrodes that exhibit
a single-phase (BGLC82: Ti and Zn), it was the Ti composition that obtained the best
performance. This indicates that doping BGLC82 with a more basic cation increases the
performance of the electrode.
94
For the oxygen and water vapour pressure dependencies, Rp,2 and Rp,3 Exhibited for all the
electrodes dependencies on both pO2 and pH2O. From the dependencies, the rate-limiting step
was determined to be red-ox of absorbed oxygen for Rp,2, and the dissociative exchange of
oxygen for Rp,3. The higher resistances obtained for all the measurements for Rp,3 indicate that
the RDS for the electrodes is the dissociative exchange of oxygen.
For BGLC82: Zn, the lowest total polarization resistance was seen under negative bias
measurement. The Rp,2 exhibits similar pre-exponential factors for both positive and negative
bias. For Rp,3, the highest factor value was obtained at the negative bias measurement. This
implies that the electrode has more active sites when it is operating as a cathode.
BGLC82: Ti obtained the lowest total polarization resistance of all the electrodes at positive
bias. The electrode exhibits also more active sites during positive bias measurement than at
negative bias. This implies that the electrode is a better anode than cathode for a PCEC.
Zinc and titanium are acceptor and donor dopant for BGLC82, respectively. BGLC82: Ti and
Zn exhibit lower resistances at different biases, which indicates that the electrodes performed
better in the different directions of the positrode reaction. This implies more proton uptake for
the oxide, resulting in a better positrode for proton ceramic electrolyser. Less stability of protons
in the positrode results in a positrode more suited for proton ceramic fuel cell.
The three suggested explanations for the different obtained values for the polarization
resistances at positive and negative bias can all occur at the same time with high or low
contributions on the resistance. However, some of the results from the measurement can imply
to what extent they influence the results. Assuming that the second explanation has a high
impact on the polarisation residences, all of the electrodes should exhibit lower resistances
under positive bias measurements, as all the electrode is on the same electrolyte. BGLC82: Ti
was the electrode with the largest difference between the total polarisation resistance obtained
from negative and positive bias. This implies that the increase in p-type conductivity under
positive bias did not affect the polarization resistances significantly for the electrodes.
Concerning the first and third explanation, when the electrode exhibits the same RDS at both
positive and negative bias, the exchange current density should be the same. This implies that
the difference in the anodic and cathodic resistance is obtained by 𝛼 ≠ ½. When the RDS is
observed to be different for the electrode at negative and positive bias, the difference in

95
resistance can come from the exchange current density. This implies that there are different
exchange current densities at negative and positive bias, due to the change in rate-limiting step
for the same electrode. From the observed capacitances, capacitances, activation energies, and
water dependencies indicate that there is a change of the RDS for negative and positive bias.
This indicates that the exchange current density leads to the difference in polarization
resistance.

96

97
Bibliography
1. Agency, I.E., The Future of Hydrogen. 2019.
2. Bellows, R.J., E.P. Marucchi-Soos, and D.T. Buckley, Analysis of Reaction Kinetics for
Carbon Monoxide and Carbon Dioxide on Polycrystalline Platinum Relative to Fuel
Cell Operation. Industrial & Engineering Chemistry Research, 1996. 35(4): p. 1235-
1242.
3. Adams, T.A., et al., Energy Conversion with Solid Oxide Fuel Cell Systems: A Review
of Concepts and Outlooks for the Short- and Long-Term. Industrial & Engineering
Chemistry Research, 2013. 52(9): p. 3089-3111.
4. Vøllestad, E., et al., Mixed proton and electron conducting double perovskite anodes
for stable and efficient tubular proton ceramic electrolysers. Nature Materials, 2019.
18(7): p. 752-759.
5. Shim, J.H., Ceramics breakthrough. Nature Energy, 2018. 3(3): p. 168-169.
6. Fabbri, E., D. Pergolesi, and E. Traversa, Materials challenges toward proton-
conducting oxide fuel cells: a critical review. Chemical Society Reviews, 2010. 39(11):
p. 4355-4369.
7. Strandbakke, R., et al., Gd- and Pr-based double perovskite cobaltites as oxygen
electrodes for proton ceramic fuel cells and electrolyser cells. Solid State Ionics, 2015.
278: p. 120-132.
8. Norby, T., Defects and Transport in Crystalline Materials. 2015: University of Oslo.
195.
9. Karen, P., Nonstoichiometry in oxides and its control. Journal of Solid State Chemistry,
2006. 179(10): p. 3167-3183.
10. Megaw, H.D., Crystal structure of double oxides of the perovskite type. Proceedings of
the Physical Society, 1946. 58(2): p. 133-152.
11. Kuz’min, A.V., et al., Total and hole conductivity in the BaZr1 − xYxO3 − α system (x
= 0.02−0.20) in oxidizing atmosphere. Russian Journal of Electrochemistry, 2009.
45(12): p. 1351-1357.
12. Yamazaki, Y., P. Babilo, and S.M. Haile, Defect Chemistry of Yttrium-Doped Barium
Zirconate: A Thermodynamic Analysis of Water Uptake. Chemistry of Materials, 2008.
20(20): p. 6352-6357.
13. Vøllestad, E., et al., Relating defect chemistry and electronic transport in the double
perovskite Ba1−xGd0.8La0.2+xCo2O6−δ (BGLC). Journal of Materials Chemistry A,
2017. 5(30): p. 15743-15751.
14. Poetzsch, D., R. Merkle, and J. Maier, Proton uptake in the H+-SOFC cathode material
Ba0.5Sr0.5Fe0.8Zn0.2O3−δ: transition from hydration to hydrogenation with
increasing oxygen partial pressure. Faraday Discussions, 2015. 182(0): p. 129-143.
15. Poetzsch, D., R. Merkle, and J. Maier, Stoichiometry Variation in Materials with Three
Mobile Carriers—Thermodynamics and Transport Kinetics Exemplified for Protons,
Oxygen Vacancies, and Holes. Advanced Functional Materials, 2015. 25(10): p. 1542-
1557.
16. Oldham, K.B., et al., Electrochemical science and technology : fundamentals and
applications. 2013, John Wiley & Sons, Ltd., Publication: Chichester, West Sussex,
England.

98
17. Adler, S.B., Factors Governing Oxygen Reduction in Solid Oxide Fuel Cell Cathodes.
Chemical Reviews, 2004. 104(10): p. 4791-4844.
18. Poetzsch, D., R. Merkle, and J. Maier, Oxygen Reduction at Dense Thin-Film
Microelectrodes on a Proton-Conducting Electrolyte. Journal of The Electrochemical
Society, 2015. 162(9): p. F939-F950.
19. Bard, A.J. and L.R. Faulkner, Electrochemical methods : fundamentals and
applications. 2nd ed. ed. 2001, New York: Wiley.
20. Lvovich, V.F., Impedance Spectroscopy: Applications to Electrochemical and
Dielectric Phenomena. 2012.
21. Orazem, M.E. and B. Tribollet, Front Matter. 2017, Hoboken, NJ, USA: John Wiley &
Sons, Inc.: Hoboken, NJ, USA. p. i-xlvii.
22. Murray, E.P., T. Tsai, and S.A. Barnett, A direct-methane fuel cell with a ceria-based
anode. Nature, 1999. 400(6745): p. 649-651.
23. Park, S., J.M. Vohs, and R.J. Gorte, Direct oxidation of hydrocarbons in a solid-oxide
fuel cell. Nature, 2000. 404(6775): p. 265-267.
24. Lo Faro, M., et al., Fuel flexibility: A key challenge for SOFC technology. Fuel, 2012.
102: p. 554-559.
25. Stambouli, A.B. and E. Traversa, Solid oxide fuel cells (SOFCs): a review of an
environmentally clean and efficient source of energy. Renewable and Sustainable
Energy Reviews, 2002. 6(5): p. 433-455.
26. Minh, N.Q., Ceramic Fuel Cells. Journal of the American Ceramic Society, 1993. 76(3):
p. 563-588.
27. Jacobson, A.J., Materials for Solid Oxide Fuel Cells. Chemistry of Materials, 2010.
22(3): p. 660-674.
28. Chen, D., et al., Intermediate-temperature electrochemical performance of a
polycrystalline PrBaCo2O5+δ cathode on samarium-doped ceria electrolyte. Journal
of Power Sources, 2009. 188(1): p. 96-105.
29. Norby, T. and Y. Larring, Concentration and transport of protons in oxides. Current
Opinion in Solid State and Materials Science, 1997. 2(5): p. 593-599.
30. Kreuer, K.D., On the development of proton conducting materials for technological
applications. Solid State Ionics, 1997. 97(1): p. 1-15.
31. Fabbri, E., D. Pergolesi, and E. Traversa, Electrode materials: a challenge for the
exploitation of protonic solid oxide fuel cells. Science and Technology of Advanced
Materials, 2010. 11(4): p. 044301.
32. Cowin, P.I., et al., Recent Progress in the Development of Anode Materials for Solid
Oxide Fuel Cells. Advanced Energy Materials, 2011. 1(3): p. 314-332.
33. Dubois, A., S. Ricote, and R.J. Braun, Benchmarking the expected stack manufacturing
cost of next generation, intermediate-temperature protonic ceramic fuel cells with solid
oxide fuel cell technology. Journal of Power Sources, 2017. 369: p. 65-77.
34. Matsuzaki, Y., et al., Effect of proton-conduction in electrolyte on electric efficiency of
multi-stage solid oxide fuel cells. Scientific Reports, 2015. 5(1): p. 12640.
35. Iwahara, H., et al., Proton conduction in sintered oxides and its application to steam
electrolysis for hydrogen production. Solid State Ionics, 1981. 3-4: p. 359-363.
36. Iwahara, H., et al., Protonic conduction in calcium, strontium and barium zirconates.
Solid State Ionics, 1993. 61(1): p. 65-69.
37. Bonanos, N., K.S. Knight, and B. Ellis, Perovskite solid electrolytes: Structure,
transport properties and fuel cell applications. Solid State Ionics, 1995. 79: p. 161-170.
38. Kreuer, K.D., et al., Proton conducting alkaline earth zirconates and titanates for high
drain electrochemical applications. Solid State Ionics, 2001. 145(1): p. 295-306.
99
39. Iwahara, H., Technological challenges in the application of proton conducting
ceramics. Solid State Ionics, 1995. 77: p. 289-298.
40. Iwahara, H., High temperature proton conducting oxides and their applications to solid
electrolyte fuel cells and steam electrolyzer for hydrogen production. Solid State Ionics,
1988. 28-30: p. 573-578.
41. Iwahara, H., Proton Conduction in Sintered Oxides Based on BaCeO[sub 3]. Journal of
The Electrochemical Society, 1988. 135(2): p. 529.
42. Yamazaki, Y., R. Hernandez-Sanchez, and S.M. Haile, High Total Proton Conductivity
in Large-Grained Yttrium-Doped Barium Zirconate. Chemistry of Materials, 2009.
21(13): p. 2755-2762.
43. Pergolesi, D., et al., High proton conduction in grain-boundary-free yttrium-doped
barium zirconate films grown by pulsed laser deposition. Nature Materials, 2010. 9(10):
p. 846-852.
44. Iwahara, H., Oxide-ionic and protonic conductors based on perovskite-type oxides and
their possible applications. Solid State Ionics, 1992. 52(1): p. 99-104.
45. Kreuer, K.D., Proton-Conducting Oxides. Annual Review of Materials Research, 2003.
33(1): p. 333-359.
46. Iwahara, H., T. Yajima, and H. Ushida, Effect of ionic radii of dopants on mixed ionic
conduction (H++O2−) in BaCeO3-based electrolytes. Solid State Ionics, 1994. 70-71:
p. 267-271.
47. Kreuer, K.D., Aspects of the formation and mobility of protonic charge carriers and the
stability of perovskite-type oxides. Solid State Ionics, 1999. 125(1): p. 285-302.
48. Kreuer, K.D., et al., Defect interactions in proton conducting perovskite-type oxides.
Berichte der Bunsengesellschaft/Physical Chemistry Chemical Physics, 1997. 101(9):
p. 1344-1350.
49. Bhide, S.V. and A.V. Virkar, Stability of BaCeO3‐Based Proton Conductors in Water‐
Containing Atmospheres. Journal of The Electrochemical Society, 1999. 146(6): p.
2038-2044.
50. Zakowsky, N., S. Williamson, and J.T.S. Irvine, Elaboration of CO2 tolerance limits of
BaCe0.9Y0.1O3–δ electrolytes for fuel cells and other applications. Solid State Ionics,
2005. 176(39): p. 3019-3026.
51. Babilo, P. and S.M. Haile, Enhanced Sintering of Yttrium-Doped Barium Zirconate by
Addition of ZnO. Journal of the American Ceramic Society, 2005. 88(9): p. 2362-2368.
52. Bohn, H.G. and T. Schober, Electrical Conductivity of the High-Temperature Proton
Conductor BaZr0.9Y0.1O2.95. Journal of the American Ceramic Society, 2000. 83(4):
p. 768-772.
53. Katahira, K., et al., Protonic conduction in Zr-substituted BaCeO3. Solid State Ionics,
2000. 138(1): p. 91-98.
54. Zuo, C., et al., Effect of Zr-Doping on the Chemical Stability and Hydrogen Permeation
of the Ni−BaCe0.8Y0.2O3-α Mixed Protonic−Electronic Conductor. Chemistry of
Materials, 2006. 18(19): p. 4647-4650.
55. Dubal, S.U., et al., Proton conducting BaCe0.7Zr0.1Y0.2O2.9 thin films by spray
deposition for solid oxide fuel cell. Applied Surface Science, 2015. 324: p. 871-876.
56. Yoo, Y. and N. Lim, Performance and stability of proton conducting solid oxide fuel
cells based on yttrium-doped barium cerate-zirconate thin-film electrolyte. Journal of
Power Sources, 2013. 229: p. 48-57.
57. Fabbri, E., et al., Tailoring the chemical stability of Ba(Ce0.8−xZrx)Y0.2O3−δ protonic
conductors for Intermediate Temperature Solid Oxide Fuel Cells (IT-SOFCs). Solid
State Ionics, 2008. 179(15): p. 558-564.

100
58. Uchida, H., S. Tanaka, and H. Iwahara, Polarization at Pt electrodes of a fuel cell with
a high temperature-type proton conductive solid electrolyte. Journal of Applied
Electrochemistry, 1985. 15(1): p. 93-97.
59. Iwahara, H., Performance of Solid Oxide Fuel Cell Using Proton and Oxide Ion Mixed
Conductors Based on BaCe[sub 1−x]Sm[sub x]O[sub 3−α]. Journal of The
Electrochemical Society, 1993. 140(6): p. 1687.
60. Tao, S.W., et al., Electrode materials for intermediate temperature proton-conducting
fuel cells. Journal of Applied Electrochemistry, 2000. 30(2): p. 153-157.
61. Kim, J., et al., Triple-Conducting Layered Perovskites as Cathode Materials for Proton-
Conducting Solid Oxide Fuel Cells. ChemSusChem, 2014. 7(10): p. 2811-2815.
62. Duan, C., et al., Zr and Y co-doped perovskite as a stable, high performance cathode
for solid oxide fuel cells operating below 500 °C. Energy & Environmental Science,
2017. 10(1): p. 176-182.
63. Duan, C., et al., Readily processed protonic ceramic fuel cells with high performance
at low temperatures. Science, 2015. 349(6254): p. 1321.
64. Téllez Lozano, H., et al., Double perovskite cathodes for proton-conducting ceramic
fuel cells: are they triple mixed ionic electronic conductors? Science and Technology
of Advanced Materials, 2017. 18(1): p. 977-986.
65. Lin, Y., et al., Performance of PrBaCo2O5+δ as a Proton-Conducting Solid-Oxide Fuel
Cell Cathode. The Journal of Physical Chemistry A, 2010. 114(11): p. 3764-3772.
66. Zhang, K., et al., Synthesis, characterization and evaluation of cation-ordered
LnBaCo2O5+δ as materials of oxygen permeation membranes and cathodes of SOFCs.
Acta Materialia, 2008. 56(17): p. 4876-4889.
67. Tarancón, A., et al., GdBaCo2O5+x layered perovskite as an intermediate temperature
solid oxide fuel cell cathode. Journal of Power Sources, 2007. 174(1): p. 255-263.
68. Zhu, C., et al., Electrochemical performance of PrBaCo2O5+δ layered perovskite as
an intermediate-temperature solid oxide fuel cell cathode. Journal of Power Sources,
2008. 185(1): p. 193-196.
69. Zohourian, R., et al., Mixed-Conducting Perovskites as Cathode Materials for Protonic
Ceramic Fuel Cells: Understanding the Trends in Proton Uptake. Advanced Functional
Materials, 2018. 28(35): p. 1801241.
70. Strandbakke, R., et al., Ba0.5Gd0.8La0.7Co2O6-δInfiltrated in Porous
BaZr0.7Ce0.2Y0.1O3Backbones as Electrode Material for Proton Ceramic
Electrolytes. Journal of The Electrochemical Society, 2017. 164(4): p. F196-F202.
71. Pedersen, M.K., Fundamentals of Positrodes for Proton Ceramic Electrochemical
Cells. 2019.
72. ProboStat, overview. [cited 2020 02.06]; Available from:
www.norecs.com/index.php?page=Overview.
73. NORBY, T. and P. KOFSTAD, Electrical Conductivity and Defect Structure of Y2O3
as a Function of Water Vapor Pressure. Journal of the American Ceramic Society, 1984.
67(12): p. 786-792.
74. Winkler, J., Geometric Requirements of Solid Electrolyte Cells with a Reference
Electrode. Journal of The Electrochemical Society, 1998. 145(4): p. 1184.
75. Schubert, U. and N. Hüsing, Synthesis of inorganic materials. 3rd compl. rev. and enl.
ed. 2012, Weinheim: Wiley.
76. Kochetova, N., et al., Recent activity in the development of proton-conducting oxides
for high-temperature applications. RSC Advances, 2016. 6(77): p. 73222-73268.
77. Bae, K., et al., High-Performance Protonic Ceramic Fuel Cells with 1 µm Thick
Y:Ba(Ce, Zr)O3 Electrolytes. Advanced Energy Materials, 2018. 8(25): p. 1801315.

101
78. An, H., et al., A 5 × 5 cm2 protonic ceramic fuel cell with a power density of 1.3 W cm–
2 at 600 °C. Nature Energy, 2018. 3(10): p. 870-875.
79. Andersen, H., et al., A highly efficient electrocatalyst based on double perovskite
cobaltites with immense intrinsic catalytic activity for water oxidation. Chemical
Communications, 2020. 56(7): p. 1030-1033.

102

103
Appendix
A.1-Proton Uptake
Calculation of mol % H+ for BGLC82: Ti at 300 ℃ can be calculated from the mass change at
D2O shift. The amount of deuterium in the change is double than the observed change due to
deuterium is double the weight of protons.
The amount of mol of deuterium becomes:
𝑛D =
2(𝑚D/1000)
𝑀D=2(0.043 mg/1000)
2.016 g/mol= 4.3 ∙ 10−5 mol
(A.1.1)
The mol % of H+ is then given by:
mol % H+ =𝑛𝐷
𝑛D + 𝑛𝐵𝐺𝐿𝐶82:𝑇𝑖∙ 100 =
4.5 ∙ 10−5 mol
4.5 ∙ 10−5 mol + 0.048 mol∙ 100 = 0.89
(A.1.2)
For the ratio of hydration and hydrogenation, the mass difference between the obtained mass at
H2O atmosphere and the obtained mass at D2O atmosphere is the mass of oxygen. The amount
of oxygen is assumed to come from hydration. The mol of protons from hydration is then two
times the mol of oxygen. The mol of protons from hydration becomes:
𝑛H = 2 ∙ 𝑛O = 2 ∙(𝑚H2O −𝑚D
1000 )
𝑀O= 2 ∙
(0.063 mg − 0.043 mg
1000 )
16 g/mol= 2.5 ∙ 10−6 mol
(A.1.3)
The ratio between hydration and hydrogenation becomes:
% hydration =
𝑛H𝑛D
∙ 100 =2.5 ∙ 10−6 mol
4.3 ∙ 10−5 mol∙ 100 = 6 %
(A.1.4)
% hydrogenation =𝑛D − 𝑛H
𝑛D∙ 100 =
(4.3 ∙ 10−5 − 2.5 ∙ 10−6 ) mol
4.3 ∙ 10−5 mol∙ 100 = 94 %
(A.1.5)

104
A.2 – OCV measurements
Figure A.2.1 pO2 dependencies for a) BGLC82: Ti, b) BGLC82: Zr SSR and c) BGLC82: Zr SG,
where the number represents the different contributions, 1) ohmic, 2) Rp,2 and 3) Rp,3. All
measurements were carried out with pH2O = 0.025 atm.
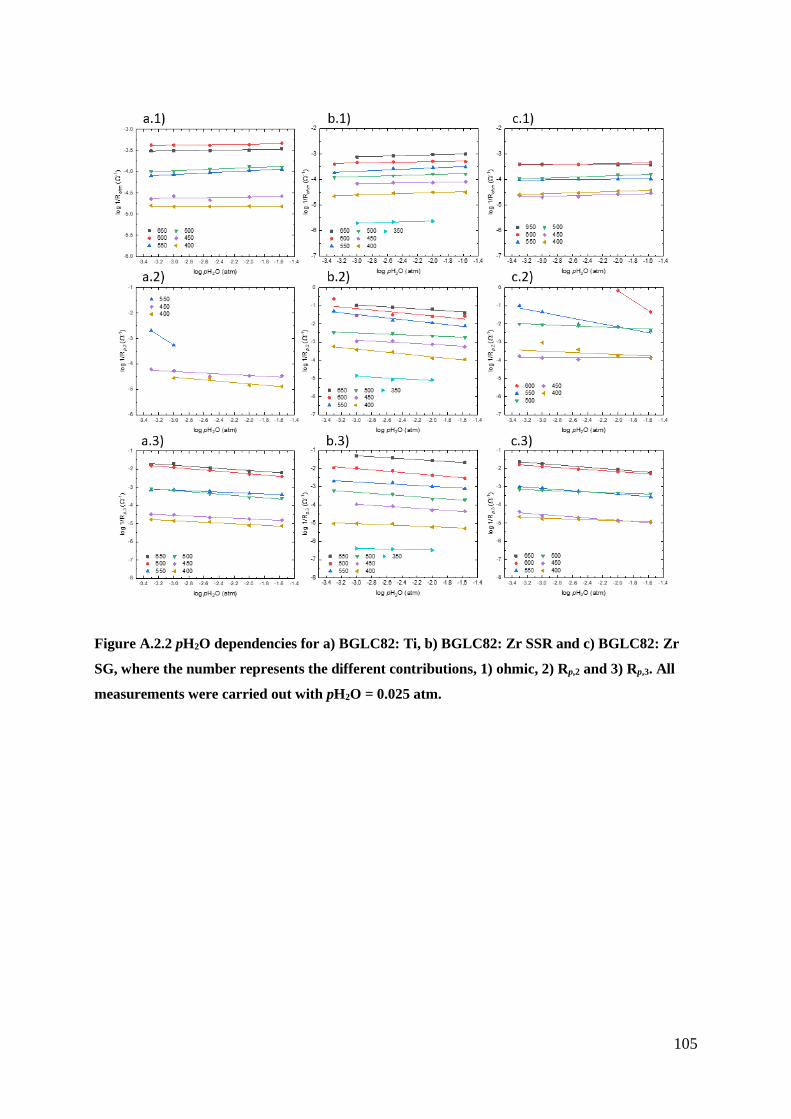
105
Figure A.2.2 pH2O dependencies for a) BGLC82: Ti, b) BGLC82: Zr SSR and c) BGLC82: Zr
SG, where the number represents the different contributions, 1) ohmic, 2) Rp,2 and 3) Rp,3. All
measurements were carried out with pH2O = 0.025 atm.
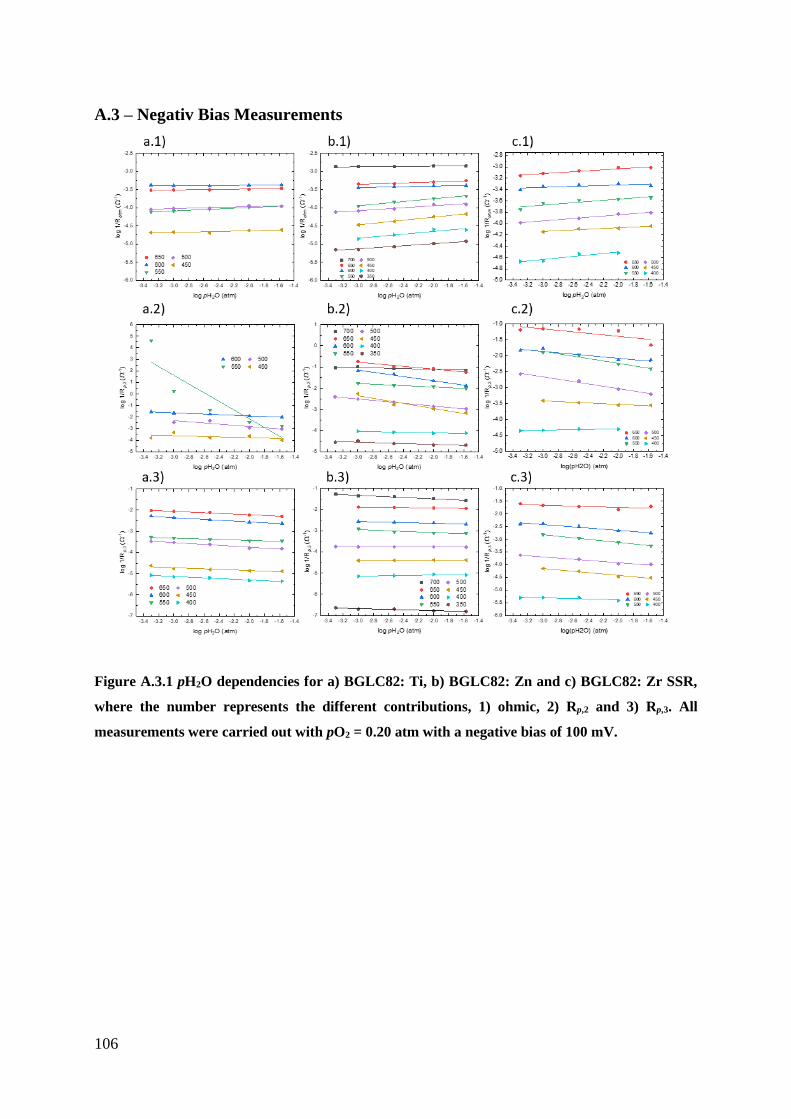
106
A.3 – Negativ Bias Measurements
Figure A.3.1 pH2O dependencies for a) BGLC82: Ti, b) BGLC82: Zn and c) BGLC82: Zr SSR,
where the number represents the different contributions, 1) ohmic, 2) Rp,2 and 3) Rp,3. All
measurements were carried out with pO2 = 0.20 atm with a negative bias of 100 mV.
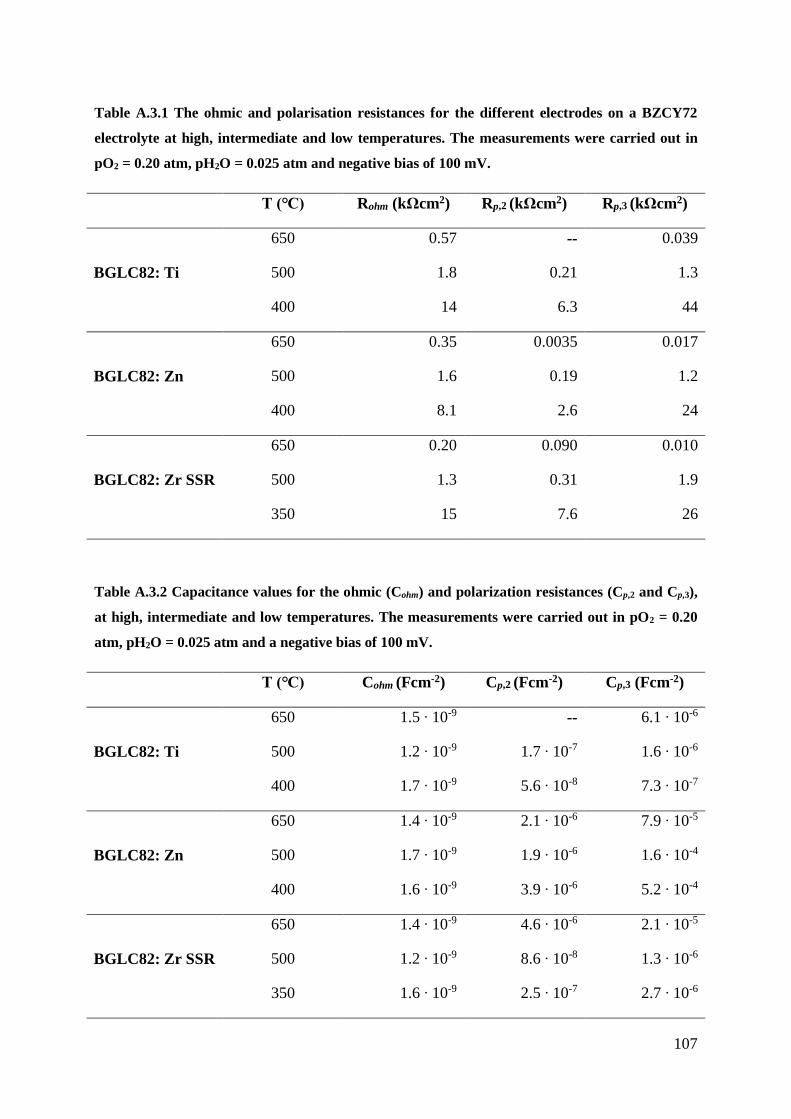
107
Table A.3.1 The ohmic and polarisation resistances for the different electrodes on a BZCY72
electrolyte at high, intermediate and low temperatures. The measurements were carried out in
pO2 = 0.20 atm, pH2O = 0.025 atm and negative bias of 100 mV.
T (℃) Rohm (kΩcm2) Rp,2 (kΩcm2) Rp,3 (kΩcm2)
BGLC82: Ti
650 0.57 -- 0.039
500 1.8 0.21 1.3
400 14 6.3 44
BGLC82: Zn
650 0.35 0.0035 0.017
500 1.6 0.19 1.2
400 8.1 2.6 24
BGLC82: Zr SSR
650 0.20 0.090 0.010
500 1.3 0.31 1.9
350 15 7.6 26
Table A.3.2 Capacitance values for the ohmic (Cohm) and polarization resistances (Cp,2 and Cp,3),
at high, intermediate and low temperatures. The measurements were carried out in pO2 = 0.20
atm, pH2O = 0.025 atm and a negative bias of 100 mV.
T (℃) Cohm (Fcm-2) Cp,2 (Fcm-2) Cp,3 (Fcm-2)
BGLC82: Ti
650 1.5 ‧ 10-9 -- 6.1 ‧ 10-6
500 1.2 ‧ 10-9 1.7 ‧ 10-7 1.6 ‧ 10-6
400 1.7 ‧ 10-9 5.6 ‧ 10-8 7.3 ‧ 10-7
BGLC82: Zn
650 1.4 ‧ 10-9 2.1 ‧ 10-6 7.9 ‧ 10-5
500 1.7 ‧ 10-9 1.9 ‧ 10-6 1.6 ‧ 10-4
400 1.6 ‧ 10-9 3.9 ‧ 10-6 5.2 ‧ 10-4
BGLC82: Zr SSR
650 1.4 ‧ 10-9 4.6 ‧ 10-6 2.1 ‧ 10-5
500 1.2 ‧ 10-9 8.6 ‧ 10-8 1.3 ‧ 10-6
350 1.6 ‧ 10-9 2.5 ‧ 10-7 2.7 ‧ 10-6
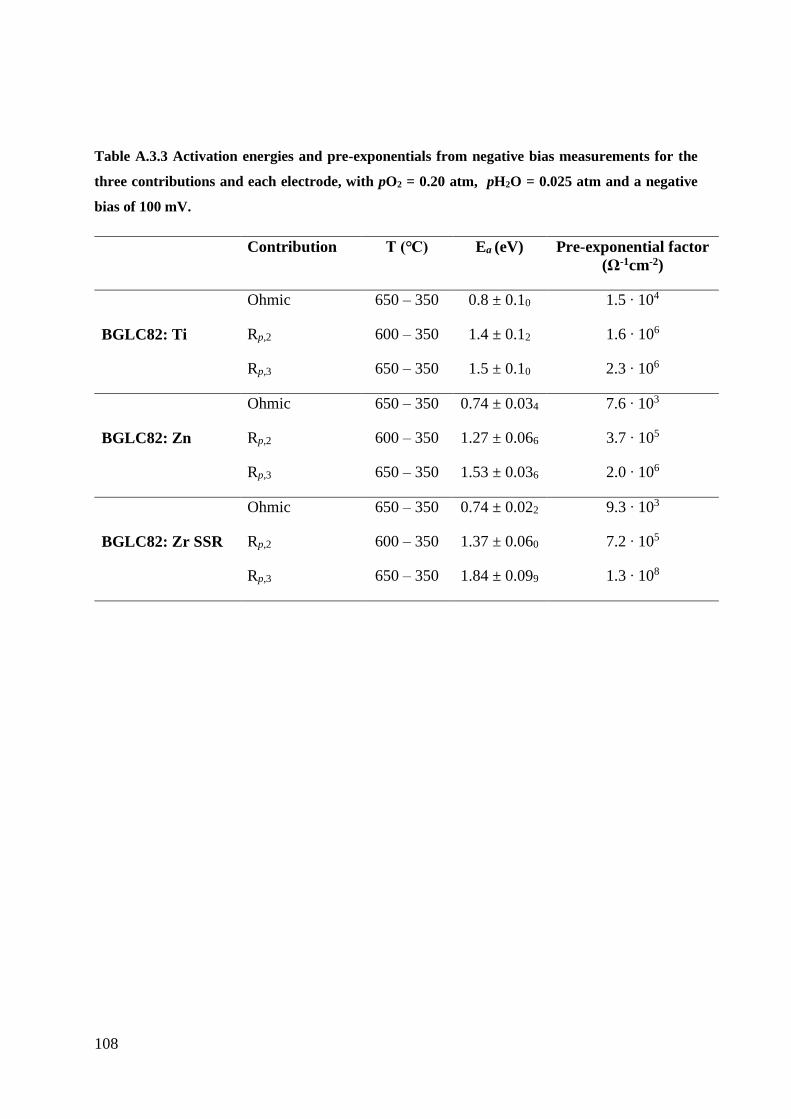
108
Table A.3.3 Activation energies and pre-exponentials from negative bias measurements for the
three contributions and each electrode, with pO2 = 0.20 atm, pH2O = 0.025 atm and a negative
bias of 100 mV.
Contribution T (℃) Ea (eV) Pre-exponential factor
(Ω-1cm-2)
BGLC82: Ti
Ohmic 650 – 350 0.8 ± 0.10 1.5 ‧ 104
Rp,2 600 – 350 1.4 ± 0.12 1.6 ‧ 106
Rp,3 650 – 350 1.5 ± 0.10 2.3 ‧ 106
BGLC82: Zn
Ohmic 650 – 350 0.74 ± 0.034 7.6 ‧ 103
Rp,2 600 – 350 1.27 ± 0.066 3.7 ‧ 105
Rp,3 650 – 350 1.53 ± 0.036 2.0 ‧ 106
BGLC82: Zr SSR
Ohmic 650 – 350 0.74 ± 0.022 9.3 ‧ 103
Rp,2 600 – 350 1.37 ± 0.060 7.2 ‧ 105
Rp,3 650 – 350 1.84 ± 0.099 1.3 ‧ 108

109
A.4 – Positiv Bias Measurements
Figure A.4.1 pH2O dependencies for a) BGLC82: Ti, b) BGLC82: Zn and c) BGLC82: Zr SSR,
where the number represents the different contributions, 1) ohmic, 2) Rp,2 and 3) Rp,3. All
measurements were carried out with pO2 = 0.20 atm with a positive bias of 50-100 mV.
Table A.4.1 The ohmic and polarisation resistances for the different electrodes on a BZCY72
electrolyte at high, intermediate and low temperatures. The measurements were carried out in
pO2 = 0.20 atm, pH2O = 0.025 atm and a positive bias of 50-100 mV.
T (℃) Rohm (kΩcm2) Rp,2 (kΩcm2) Rp,3 (kΩcm2)
BGLC82: Ti
650 0.55 -- 0.011
500 1.3 0.049 0.21
400 9.1 0.62 7.9

110
BGLC82: Zn
650 0.35 0.0029 0.0079
500 1.3 0.032 0.038
400 7.1 0.46 11
BGLC82: Zr SSR
650 0.019 0.00015 0.0038
500 1.0 0.046 0.29
450 2.0 0.24 2.5
Table A.4.2 Capacitance values for the ohmic (Cohm) and polarization resistances (Cp,2 and Cp,3),
at high, intermediate and low temperatures. The measurements were carried out in pO2 = 0.20
atm, pH2O = 0.025 atm and a positive bias of 50-100 mV.
T (℃) Cohm (Fcm-2) Cp,2 (Fcm-2) Cp,3 (Fcm-2)
BGLC82: Ti
650 1.5 ‧ 10-9 -- 2.4 ‧ 10-5
500 1.2 ‧ 10-9 7.6 ‧ 10-7 1.6 ‧ 10-5
400 1.4 ‧ 10-9 3.5 ‧ 10-7 7.7 ‧ 10-6
BGLC82: Zn
650 1.4 ‧ 10-9 3.8 ‧ 10-6 4.2 ‧ 10-5
500 1.7 ‧ 10-9 9.4 ‧ 10-7 1.9 ‧ 10-5
400 1.8 ‧ 10-9 5.8 ‧ 10-7 1.2 ‧ 10-5
BGLC82: Zr SSR
650 1.5 ‧ 10-9 7.9 ‧ 10-7 2.1 ‧ 10-4
500 1.2 ‧ 10-9 4.2 ‧ 10-7 1.3 ‧ 10-5
450 1.6 ‧ 10-9 9.7 ‧ 10-8 8.5 ‧ 10-6
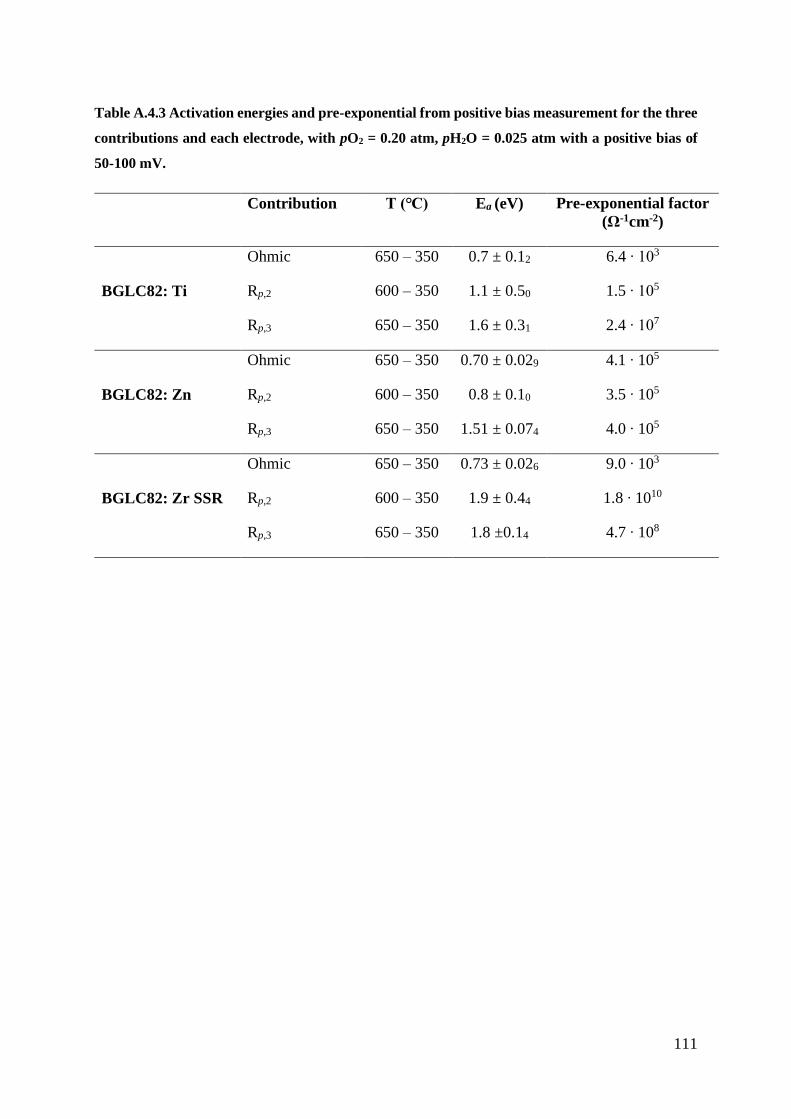
111
Table A.4.3 Activation energies and pre-exponential from positive bias measurement for the three
contributions and each electrode, with pO2 = 0.20 atm, pH2O = 0.025 atm with a positive bias of
50-100 mV.
Contribution T (℃) Ea (eV) Pre-exponential factor
(Ω-1cm-2)
BGLC82: Ti
Ohmic 650 – 350 0.7 ± 0.12 6.4 ‧ 103
Rp,2 600 – 350 1.1 ± 0.50 1.5 ‧ 105
Rp,3 650 – 350 1.6 ± 0.31 2.4 ‧ 107
BGLC82: Zn
Ohmic 650 – 350 0.70 ± 0.029 4.1 ‧ 105
Rp,2 600 – 350 0.8 ± 0.10 3.5 ‧ 105
Rp,3 650 – 350 1.51 ± 0.074 4.0 ‧ 105
BGLC82: Zr SSR
Ohmic 650 – 350 0.73 ± 0.026 9.0 ‧ 103
Rp,2 600 – 350 1.9 ± 0.44 1.8 ‧ 1010
Rp,3 650 – 350 1.8 ±0.14 4.7 ‧ 108