functional capacity in schizophrenia: relationship among
TRANSCRIPT
UNLV Theses, Dissertations, Professional Papers, and Capstones
5-1-2015
Functional capacity in schizophrenia: Relationship among effort, Functional capacity in schizophrenia: Relationship among effort,
reinforcement learning and self-beliefs reinforcement learning and self-beliefs
Sally J. Vogel University of Nevada, Las Vegas
Follow this and additional works at: https://digitalscholarship.unlv.edu/thesesdissertations
Part of the Medical Neurobiology Commons, Mental and Social Health Commons, Neuroscience and
Neurobiology Commons, Neurosciences Commons, and the Psychology Commons
Repository Citation Repository Citation Vogel, Sally J., "Functional capacity in schizophrenia: Relationship among effort, reinforcement learning and self-beliefs" (2015). UNLV Theses, Dissertations, Professional Papers, and Capstones. 2441. http://dx.doi.org/10.34917/7646084
This Dissertation is protected by copyright and/or related rights. It has been brought to you by Digital Scholarship@UNLV with permission from the rights-holder(s). You are free to use this Dissertation in any way that is permitted by the copyright and related rights legislation that applies to your use. For other uses you need to obtain permission from the rights-holder(s) directly, unless additional rights are indicated by a Creative Commons license in the record and/or on the work itself. This Dissertation has been accepted for inclusion in UNLV Theses, Dissertations, Professional Papers, and Capstones by an authorized administrator of Digital Scholarship@UNLV. For more information, please contact [email protected].

FUNCTIONAL CAPACITY IN SCHIZOPHRENIA: RELATIONSHIP AMONG
EFFORT, REINFORCEMENT LEARNING, AND SELF-BELIEFS
By
Sally J Vogel
!
Bachelor of Arts in Psychology University of Nevada, Las Vegas
2009
Master of Arts in Psychology University of Nevada, Las Vegas
2012
A dissertation submitted in partial fulfillment of the requirements for the
Doctor of Philosophy in Psychology
Department of Psychology College of Liberal Arts The Graduate College
University of Nevada, Las Vegas
May 2015 ! !

Copyright by Sally J. Vogel, 2014
All Rights Reserved

ii
We recommend the dissertation prepared under our supervision by
Sally Vogel
entitled
Functional Capacity in Schizophrenia: Relationship among Effort, Reinforcement Learning, and Self-Beliefs
is approved in partial fulfillment of the requirements for the degree of
Doctor of Philosophy - Psychology Department of Psychology Daniel N. Allen, Ph.D., Committee Chair
Jefferson Kinney, Ph.D., Committee Member
Murray Millar, Ph.D., Committee Member
Merrill Landers, Ph.D., Graduate College Representative
Kathryn Hausbeck Korgan, Ph.D., Interim Dean of the Graduate College
May 2015

! iii
ABSTRACT
Functional capacity in schizophrenia: Relationship among effort, reinforcement learning and self-beliefs
by
Sally J. Vogel
Dr. Daniel N. Allen, Examination Committee Chair Lincy Professor of Psychology
University of Nevada, Las Vegas
Individuals with schizophrenia exhibit a wide range of complex neurocognitive,
psychiatric and behavioral impairments. Recent research suggests that this complex array
of symptoms can be at least partially accounted for by dysfunction in more basic
mechanisms, such as the ability to learn from positive and negative reinforcement, or the
ability to exert adequate effort when completing simple tasks. Evidence also suggests that
deficits in these basic mechanisms may contribute to more complex symptoms, such as
functional impairment. Also, the relationship between neurocognitive deficits and
functional impairment has been found to be mediated by defeatist performance beliefs.
However, studies have not examined the relationships among these various constructs so
it is not clear how impairment in more basic processes relate to the development or
maintenance of complex psychological and behavioral disturbances. The current study
addresses these matters by examining effort, reinforcement learning, defeatist
performance beliefs and functional capacity in individuals with schizophrenia and
controls using a path analysis. After examining a number of competing models, the best
fitting model was one in which defeatist performance beliefs were predicting effort,
reinforcement learning, and functional capacity while effort and reinforcement learning
were also predicting functional capacity. This model depicted the opposite relationship

! iv
among the variables than was expected. The current study suggests that defeatist
performance beliefs have a more predictive and potentially causal influence on complex
neurocognitive abilities related to learning and reward, as well as functional capacity.
Results of this study support the use of therapeutic strategies aimed at reducing cognitive
distortions, e.g. defeatist performance beliefs, and that these therapeutic strategies may be
impacting neurocognitive abilities and functional outcome more directly than previously
believed.

! v
ACKNOWLEDGEMENTS
First, I would like to acknowledge and thank my advisor and dissertation
committee chair, Dr. Daniel Allen, as well as committee members Drs. Jefferson Kinney,
Murray Millar, and Merrill Landers for their feedback, time, and effort. Additionally, I
would like to thank Dr. Greg Strauss for his continued support and assistance. I would
also like to thank Jason Schwartz and the staff at Mojave Mental Health for providing
office space and their time and effort in securing participants.
I would like to thank Erik Ringdahl, Amy Freeman, Laura Cooper, Steve Sisk,
Faviola Dadis, and the rest of the Neuropsychology Research Team for their invaluable
assistance at all stages of this project. Furthermore, I greatly appreciate my husband, Nic
Vogel, for his unwavering support and understanding.
I would also like to acknowledge the Graduate and Professional Student
Association for providing funding to aid in purchasing equipment for this project. In
addition to his guidance, I would like to thank Dr. Allen for his financial contribution to
fund subject payments. A special thank you goes to the participants for their willingness
to share their stories and the many hours they spent participating.
Each individual mentioned plus many more dedicated their time in different ways
and I cannot express how grateful I am for the support and guidance throughout this
process.

! vi
TABLE OF CONTENTS
ABSTRACT ....................................................................................................................... iii! ACKNOWLEDGEMENTS ................................................................................................ v! LIST OF TABLES ............................................................................................................ vii! LIST OF FIGURES ......................................................................................................... viii! CHAPTER 1 INTRODUCTION ................................................................................... 1! CHAPTER 2! LITERATURE REVIEW ........................................................................ 4!
Reinforcement Learning ................................................................................................. 4!Effort ............................................................................................................................. 11!Defeatist-Performance Beliefs ...................................................................................... 17!Functional Outcome and Capacity ................................................................................ 23!Research Aims and Study Hypotheses ......................................................................... 24!
CHAPTER 3! METHOD .............................................................................................. 27!
Participants .................................................................................................................... 27!Measures ....................................................................................................................... 28!Procedure ...................................................................................................................... 38!Data Analysis ................................................................................................................ 40!
CHAPTER 4! RESULTS .............................................................................................. 45!
Data Screening .............................................................................................................. 45!Preliminary Analyses .................................................................................................... 47!Primary analyses ........................................................................................................... 52!
CHAPTER 5! DISCUSSION ........................................................................................ 63!
Conclusion .................................................................................................................... 70! REFERENCES ................................................................................................................. 72! VITA ................................................................................................................................. 83!

! vii
LIST OF TABLES
Table 1 Skewness and Kurtosis Values for the Primary Variables .............................. 46!Table 2! Correlations among Variables to Examine Multicollinearity ......................... 47!Table 3! Demographic Information by Group .............................................................. 48!Table 4! Symptom Ratings by Group ........................................................................... 50!Table 5! Correlations among Demographic and Illness with Primary
Variables in Schizophrenia ............................................................................. 51!Table 6! Medication Information for the Schizophrenia Group .................................... 52!Table 7! Main Variable Information by Group ............................................................. 54!Table 8! Factors Potentially Impacting Effort Choice and Trial
Completion in Schizophrenia .......................................................................... 55!Table 9! Primary Variable Correlations in the Schizophrenia and
Total Samples .................................................................................................. 56!Table 10! Path Analysis Model Statistics........................................................................ 60!

! viii
LIST OF FIGURES
Figure 1 Model 1. Model Reflecting Direct Contributions of Reinforcement Learning and Effort on Defeatist Performance Beliefs ................................... 43!
Figure 2! Model 2. Model Reflecting Direct Contributions of Defeatist Performance Beliefs on Reinforcement Learning and Effort ......................... 43!
Figure 3! Model 3. Complete Model Reflecting Direct Contributions of Defeatist Performance Beliefs on Reinforcement Learning, Effort, and Functional Capacity ...................................................................... 44!
Figure 4! Model 4. Standard Regression Model ............................................................. 44!Figure 5! Model 1. Model Reflecting Direct Contributions of
Reinforcement Learning and Effort on Defeatist Performance Beliefs with Path Coefficients ........................................................................ 61!
Figure 6! Model 2. Model Reflecting Direct Contributions of Defeatist Performance Beliefs on Reinforcement Learning and Effort with Path Coefficients ..................................................................................... 61!
Figure 7! Model 3. Complete Model Reflecting Direct Contributions of Defeatist Performance Beliefs on Reinforcement Learning, Effort, and Functional Capacity with Path Coefficients ................................. 62!
Figure 8! Model 4. Standard Regression Model with Beta Coefficients ........................ 62!

! 1
CHAPTER 1
INTRODUCTION
Schizophrenia is a debilitating disorder that entails cognitive impairments and
often leads to functional impairment (MacDonald & Schulz, 2009). Schizophrenia has
high heritability rates (Cardno, Rijsdijk, Sham, Murray, & McGuffin, 2002; Hughes et
al., 2005; MacDonald & Schulz, 2009), genetic factors have been found to be associated
with the presence of the disorder (MacDonald & Schulz, 2009), and pharmacological
medications are a first line of treatment for the most debilitating symptoms of the
disorder (MacDonald & Schulz, 2009; Rector & Beck, 2001). Thus, it is no surprise that
leading frameworks of the disease are biological. It is also well understood that having
genetic risk factors alone will not result in the disorder (Beck, 2004; MacDonald &
Schulz, 2009). In addition to genetic risk factors, environmental risk factors constitute an
additive effect and must also be present in order to “push” someone into psychosis. Beck
(2004) proposed a cognitive model of both positive and negative symptoms of
schizophrenia that could serve as one explanation for additional factors necessary to
develop or perpetuate the disorder. He states that many of the symptoms of
schizophrenia are more extreme versions of thoughts and experiences that many people
without the disorder will experience. What differentiates these normal experiences and
the experiences present in schizophrenia is the level of distress caused, the intensity, and
the certainty of the beliefs.
Studies examining the treatment of schizophrenia have provided evidence
supporting the beneficial effects of cognitive behavioral therapy (CBT) on positive and
negative symptoms of schizophrenia as well as functional outcome (Gould, Mueser,
! 2
Bolton, Mays, & Goff, 2001). Some symptoms of schizophrenia that are addressed by
CBT are cognitive distortions based on defeatist beliefs regarding oneself, ones
capabilities, and ones environment. Furthermore, defeatist performance beliefs have
been found to mediate the relationship between neurocognitive impairment and
functional outcome (Grant & Beck, 2008). Specifically, Grant and Beck (2008)
examined the performance of traditional measures of neurocognitive function in
schizophrenia, such as attention and executive functioning, in relation to defeatist
performance beliefs and functional outcome and found the mediating effect of defeatist
performance beliefs. Multiple neurocognitive functions have been found to be impaired
in schizophrenia, including the basic neurocognitive abilities of reinforcement learning
(Prentice, Gold, & Buchanan, 2008; Strauss et al., 2011; Waltz, Frank, Robinson, &
Gold, 2007) and effort (Avery, Startup, & Calabria, 2009; Lafargue & Franck, 2009).
Reinforcement learning is the ability to learn from positive and negative outcomes
in the environment (Schultz, 2002). Reinforcement learning is associated with midbrain
dopaminergic areas and areas within the prefrontal cortex (Barch & Dowd, 2010). Effort
is a cost-benefit analysis between energy expended and benefit gained (Merriam-
Webster, 2012). Rewards/reinforcements are one potential source of benefits gained for
the cost of effort. Thus, brain areas associated with the evaluation of reward would be
suggested to contribute to effort. Research has in fact suggested that midbrain
dopaminergic areas and prefrontal areas are involved in effort decisions (Botvinick,
Huffstetler, & McGuire, 2009; Croxson, Walton, O’Reilly, Behrens, & Rushworth,
2009). It seems then that similar dysfunctional brain areas in schizophrenia may impact

! 3
both reinforcement learning and effort, an idea supported by the impairment in both of
these abilities in schizophrenia.
The causal relationship between reinforcement learning, effort, defeatist
performance beliefs, and functional capacity has not yet been examined, despite the fact
that they have been found to be associated with one another. The following study
examined the causal relationship between these variables. It is hypothesized that the
more basic neurocognitive abilities, reinforcement learning and effort, will have an
additive and causal effect on the more complex behavior of defeatist performance beliefs,
which will then exerts a causal and additive effect on functional capacity.
In order to implement effective treatments that target these functional abilities and
outcomes, one must understand what components of a disorder are contributing to the
problems. Identifying specific components of a disorder that contribute to poor outcome
allows treatments to be tailored to changing those aspects. The results of this study could
provide direction for both pharmacological and cognitive behavioral treatments for
schizophrenia.

! 4
CHAPTER 2
LITERATURE REVIEW
In the following sections, each of the areas involved in the current study are
reviewed with regard to recent and relevant literature. Specifically, effort and suggested
brain regions associated with the evaluation and allocation of effort are reviewed.
Reinforcement learning and brain regions associated with this task are also reviewed.
Defeatist performance beliefs in general, in schizophrenia, and some of the potential
sources for these beliefs are reviewed. Finally, functional outcome and capacity are
reviewed.
Reinforcement Learning
Reinforcement learning has been conceptualized as a result of the difference or
error between what an animal or human predicts will occur and the actual outcome
(Dayan & Daw, 2008; Hollerman & Schultz, 1998). Hollerman & Schultz (1998) state
that learning ensues if the outcome or reward is better than what was expected or
predicted by the animal. Learning tapers off as the outcome and prediction equal one
another. Extinction will occur if the outcome or reward is worse that what was expected
or predicted by the animal. This theory of reinforcement-based learning has been termed
temporal difference error learning, with the error being the difference between outcome
and prediction. Midbrain dopamine activity has been implicated in the coding of error
signals, with increases and decreases in dopamine activity coding for positive and
negative temporal difference errors, respectively. Specifically, Hollerman & Schultz
(1998) studied the activity of dopamine neurons in the pars compacta and ventral
tegmental area in monkeys in response to reward. They found that dopamine neurons in
! 5
these areas responded to reward during initial learning trials but rarely responded to
reward in later trials following familiar pictures that had previously been rewarded.
During learning trials, dopamine neurons in these areas would respond to reward initially
and taper off responding as the association was learned (i.e., the prediction matched the
outcome). Additionally, they found that dopamine activity was significantly depressed
when an incorrect choice was made and no reward was delivered. If reward delivery was
delayed, significant depressions in dopamine activity were found at the time the reward
was expected but were significantly activated when the reward was then administered.
These transient increases and decreases in dopamine are thought to facilitate
reinforcement learning via two separate pathways originating in the basal ganglia (Waltz
et al., 2007). The direct “Go” pathway is excited by D1 receptors and facilitates
responding to reinforced, rewarding stimuli by enhancing activity and plasticity. The
indirect “NoGo” pathway is inhibited by D2 receptors and suppresses responding to
negatively reinforced or punished stimuli by increasing inhibition and further decreasing
activity in the Go pathway. These pathways are connected to the prefrontal cortex and aid
in the acquisition and update of reinforcement learning.
Midbrain dopamine areas are not the only regions thought to be responsible for
reinforcement-based learning. In addition, areas of the prefrontal cortex have been
implicated (Barch & Dowd, 2010; Waltz et al., 2007). The orbitofrontal cortex is one
area of the prefrontal cortex thought to be involved in reinforcement learning.
Specifically, it is though to be involved in the working memory of reward, such as the
ability to maintain, update, and integrate the expected values of a reward (Barch &
Dowd, 2010). Such working memory aspects of reinforcement learning suggest that the

! 6
orbitofrontal cortex is responsible for immediate reward evaluations (Waltz et al., 2007).
Additionally, the working memory of reward component of the orbitofrontal cortex is
thought to be connected to the midbrain dopamine areas. The orbitofrontal cortex updates
the basal ganglia providing a top-down evaluation of reward (Gold et al., 2012). The
orbitofrontal cortex is also thought to be updated by the transient increases and decreases
of dopamine activity in response to reward prediction error in midbrain dopamine areas
providing bottom-up processing of reward, specifically from the basal ganglia (Waltz et
al., 2007).
Animal and human studies of dopamine cell activity have sparked interest in
studying temporal difference error learning in humans with deficits in dopamine activity,
including Parkinson’s disease (Frank, Seeberger, & Reilly, 2004) and schizophrenia
(Prentice et al., 2008; Waltz et al., 2007).
Reinforcement-Learning Deficits in Schizophrenia. Dopamine’s role in
schizophrenia was implicated following the realization that antipsychotic medications
acted on dopamine systems, a theory confirmed by imaging studies (Kapur, Mizrahi, &
Li, 2005). Given that individuals with schizophrenia display both learning deficits and
abnormal dopamine function (Kapur et al., 2005), reinforcement learning has been
examined in these individuals (Prentice et al., 2008; Waltz et al., 2007).
Waltz and colleagues (2007) examined reinforcement learning in individuals with
schizophrenia using a probabilistic selection task that had previously been used to
examine reinforcement learning deficits in Parkinson’s disease (Frank et al., 2004). This
type of measure is commonly used in both human and animal studies of reinforcement
learning and can differentiate the use of positive and negative feedback. The specific

! 7
probabilistic selection task used in this study requires participants to learn the most
frequently positively reinforced stimulus within three stimulus pairs of variable
reinforcement schedules (i.e., 80:20, 70:30, 60:40). Once learned, the original stimuli are
presented in novel pairings and the selection of the most frequently rewarded stimulus
and avoidance of the least frequently rewarded stimulus is examined. They found a
general impairment in individuals with schizophrenia’s acquisition of probabilistic
contingencies, although they demonstrated eventual learning of the easiest contingencies
(80:20). In addition to overall task performance, they also examined the use of positive
and negative feedback and found that patients were significantly less able to maintain a
correct response after being positively reinforced and significantly less able to shift a
response after receiving negative feedback. These results suggest that individuals with
schizophrenia are impaired on their use of rapid trial-by-trial feedback to guide behavior,
but after many presentations gradual learning is intact. The authors suggest that this
pattern of performance can be explained by dopamine hypofunction in the prefrontal
cortex, negatively effecting rapid reward evaluations, but a less impaired dopamine
dysregulation in the basal ganglia, supporting gradual and eventual reinforcement-
learning. They also found that control subjects were significantly better than individuals
with schizophrenia at choosing the most frequently positively reinforced stimuli,
suggesting an impairment in Go learning in individuals with schizophrenia. In contrast,
no difference was found between control and schizophrenia groups on their ability to
avoid the least frequently rewarded (i.e. most often punished) stimuli, suggesting an
intact NoGo pathway. Patients were medicated with antipsychotics at the time of testing.
Antipsychotic medications are D2 antagonists, which have been suggested to enhance

! 8
NoGo learning (Strauss et al., 2011). Notably, measures of cognitive functioning were
not associated with any variable of reinforcement learning and when included as a
covariate did not change the results. This could suggest that the more basic
neurocognitive process of reinforcement learning exerts a unique contribution to higher
order/more complex cognitions and behaviors, such as defeatist performance beliefs and
functional capacity.
Additionally, Prentice, Gold & Buchanan (2008) evaluated individuals with
schizophrenia on the ability to utilize negative and positive feedback using the Wisconsin
Card Sorting Test (WCST). The WCST is traditionally used as a task of executive
functioning, but has been used in both animal and human studies evaluating
reinforcement learning (Montague, Hyman, & Cohen, 2004; Schultz, 2002). Initial
WCST trials can be conceptualized from a temporal difference error standpoint, with
responses resulting in outcomes better than expected being associated with increases in
dopamine activity and responses resulting in outcomes worse than expected being
associated with decreases in dopamine activity. Prentice and colleagues (2008) found
that individuals with schizophrenia had greater deficits than controls in using rapid trial-
by-trial feedback to guide behavior. This impairment was attributable to patients’
impaired ability to shift responses following negative feedback. Patient’s demonstrated
no significant impairment in their ability to maintain a positively reinforced response. A
general reinforcement learning impairment is consistent with Waltz et al., (2007),
however, disparate findings were found between the two studies on patient’s use of rapid
trial-by-trial use of positive and negative feedback. As mentioned, Waltz et al, (2007)
found an impaired ability to shift a response following negative feedback as well as an

! 9
impaired ability to maintain a response following positive feedback in individuals with
schizophrenia, while Prentice et al., (2008) found individuals with schizophrenia to be
impaired only on their use of negative feedback demonstrated by an impaired ability to
shift a response following negative feedback. Both studies evaluated reinforcement
learning in individuals with schizophrenia and did not evaluate performance based on
specific symptoms of schizophrenia.
Strauss and colleagues (2011) examined reinforcement learning using a
probabilistic selections task in individuals with schizophrenia. They expanded on the
Waltz et al., (2007) study in several ways. First, they divided the schizophrenia group
into those with high negative symptoms and low negative symptoms. Additionally,
reward probabilities and magnitudes varied as a function of response time, rather than
having constant reward probabilities. They found that individuals with schizophrenia
were impaired in their ability to increase response time in order to maximize reward but
showed no impairment on their ability to slow down in response to negative prediction
errors. These findings are consistent with Waltz et al. (2007) impaired Go learning but
intact NoGo learning in individuals with schizophrenia. Additionally, Go learning
deficits were found to be more severe in patients with high negative symptoms.
Participant’s willingness to explore novel options when uncertain about the value of
reward was also examined. They found that anhedonia was significantly related to novel
exploration such that individuals with higher anhedonia explored less. Dopamine
dysregulation in the prefrontal cortex is thought to contribute to impairments in
exploration during uncertainty as well as negative symptoms (Carter, 2007). Also of

! 10
note, general cognitive functioning did not relate to or alter the performance on these
reinforcement learning measures.
Gold and colleagues (2012) argue that it is unclear whether previous findings in
reward-learning impairments in schizophrenia are due to dysfunction in the prediction
error system (bottom-up processing mediated by the basal ganglia) or the valuation of
reward (top-down processing mediated by the orbitofrontal cortex). In order to evaluate
this distinction they used a probabilistic selection task in which monetary gains, losses, or
neither a gain nor loss were probabilistically presented. The task was set up in such a
way that with some stimuli pairings a no gain or loss response would result in positive
prediction errors (paired with monetary loss), while on other pairings no gain or loss
would result in negative prediction errors (paired with monetary gain). Stimuli
associated with monetary gain and those associated with no gain or loss but positive
prediction errors were paired, as well as stimuli associated with monetary loss and those
associated with no gain or loss but negative prediction errors. Because they were
associated with the same prediction error, they would be equally likely to be selected
when paired together if the value of the reward was not taken into consideration (i.e.
choice related to basal ganglia function rather than orbitofrontal cortex). Consistent with
previous research, they found that individuals with high negative symptoms had the most
substantial deficits in reinforcement learning. Patients were also found to have no deficit
in their ability to avoid losses. Additionally, they found that individuals with
schizophrenia with high negative symptoms did not show a preference for stimuli that
were associated with a higher reward over those with no monetary gain that were
associated with positive prediction errors. These results suggest that the dysfunction in

! 11
the orbitofrontal cortex resulting in impaired valuations or reward is the primary
mechanism for previous reward-learning impairments found in individuals with
schizophrenia and high negative symptoms.
Barch ad Dowd (2010) examined motivation with regard to goal representations
in individuals with schizophrenia. They proposed that individuals with schizophrenia
exhibit impairment in the evaluation of reward, related to reward prediction and mediated
in the midbrain dopaminergic areas. The impaired evaluation of reward results in an
impairment in future goal representation and lack of motivation. Studies have not yet
examined the relationship between reinforcement learning and effort. As discussed by
Barch and Dowd, these actions share similar midbrain and prefrontal pathways,
suggesting their performance may be related.
Effort
Effort is a conscious exertion of power or energy (Merriam-Webster, 2012).
Typically effort is thought of in terms of physical exertion but can also be applied to
cognitive exertion. When considering effort in the realm of neuroeconomics, the
allocation of effort is an adaptive mechanism (Kool, McGuire, Rosen, & Botvinick,
2010). Deciding how much effort to exert requires a cost-benefit analysis, often
completed below conscious awareness. The cost is the amount of exertion or energy
required and the benefit is the gain achieved as a result of the effort. The law of less
work is a behavioral and economic theory which states that an action chosen will and
should be the one which requires the least amount of effort or work (Kool et al., 2010).
When given the choice between two actions, both resulting in the same reward, people
tend to choose the action that requires the least amount of effort. The law of less work

! 12
applies to physical as well as cognitive actions. Kool and colleagues (2010) tested the
law of less work with regard to cognitive demand in healthy individuals. They used a
series of demand selection tasks, requiring participants to repeatedly choose between two
actions, each requiring different levels of cognitive demand. It was not explicitly stated
which option was low demand and which was high demand or that this difference existed
between the options. Across six experiments with different demand selection tasks, but
all involving a low demand and a high demand option, participants chose the low
cognitive demand task significantly more often than the high cognitive demand task.
Besides cognitive demand, the tasks did not differ in relation to amount of time the task
took or incentive value. They were also able to establish that the choice for less cognitive
demand was not in order to minimize the number of errors. Also, participants were
unable to explain any difference between the two options or recognize that they had
preferred one task over another. A seventh task was included that was similar to the
previous six tasks in relation to low and high cognitive demand options, but an additional
incentive value/reward was added to the tasks. Participants were given $0.01 or $0.10 for
completing the tasks, regardless of whether they chose the low demand or high demand
task. Again, participants were not aware of the difference in cognitive demand between
the tasks. With the addition of reward, the difference between selection of the low and
high cognitive demand tasks reduced, suggesting that cognitive demand is less aversive
when a benefit is available to offset the cost of cognitive demand. They found no
difference between high or low cognitive demand selection between the participants in
the $0.01 and the $0.10 incentive trials group, suggesting that even a very small reward
offsets the aversiveness of cognitive demand.
! 13
Effort and reward evaluation have both been found to be associated with midbrain
dopaminergic activity (Barch & Dowd, 2010; Botvinick et al., 2009; Botvinick & Rosen,
2009; Croxson et al., 2009). In a theory known as effort discounting, the same midbrain
dopaminergic areas implicated in reward evaluation have been implicated in effort.
Effort discounting suggests that the same reward in two situations would be more
valuable in the situation that required the least amount of effort to obtain it. Effort
discounting also considers the choices made between less energy and less reward versus
more energy and more reward. Thus, effort discounting is often measured using choice
responses between a low effort, low reward and high effort, high reward option. Studies
have demonstrated that dopamine antagonists decrease the amount of effort and wait time
a rat is willing to endure for a reward, demonstrated by rats preferring a lesser reward and
effort (Floresco, Tse, & Ghods-Sharifi, 2008). Similarly, studies have demonstrated that
dopamine agonists increase the amount of effort and wait time a rat is willing to endure
for a larger reward, demonstrated by rats preferring a larger reward even when requiring
more effort (Floresco et al., 2008). There is a similar theory, called delay discounting,
which takes into account the amount of time an organism is willing to wait for a reward.
In studies of delay discounting, tasks involve a larger reward following a longer delay or
a smaller reward following a shorter delay. Many of the same brain areas are implicated
in effort and delay discounting. It is possible that the results in prior studies of effort
discounting are a by-product of delay discounting, because typically the more effortful
task takes longer, thus increasing the delay for the reward as compared to the simpler,
less effortful task. Floresco and colleagues (2008) examined this possibility in rats. They
manipulated effort and reward in a typical manner to examine effort, but they included a

! 14
condition that equalized the delay for reward between less and more effortful tasks. They
found that dopamine antagonists in rats still reduce the choice of high effort, high reward,
even though the wait for the small reward is the same length. Additionally, for the equal
wait times they found that dopamine agonists in rats still increased the high effort, high
reward choice. They also examined the effect of NMDA antagonists on delay and effort
discounting. They found that NMDA effected effort choices when the delay between the
high and low effort tasks were different, but the effect disappeared when equal delays
were incorporated. These results suggest that brain areas associated with dopamine are
more involved in effort discounting, while NMDA associated areas are involved in delay
discounting.
It is worthwhile to evaluate effort discounting in the absence of choice between
effort and reward, specifically, neural responses to varying levels of reward and
effort/cognitive demand. This would also aid in the distinction between effort and delay
discounting. Botvinick, Huffstetler and McGuire (2009) evaluated effort and reward
evaluation in the nucleus accumbens (NAcc) and other brain areas implicated in both
reward and effort processing or only reward but not effort processing using fMRI. High
and low cognitive demand tasks were paired with high and low reward values.
Participants were not told the differences between the tasks in effort levels and were
notified of reward following the completion of the task. They found an effort discounting
reaction in the NAcc, as anticipated. More specifically, NAcc response was stronger for
high reward as compared to low reward and reward activation was reduced when the task
just completed required a higher level of effort, discounting the reward response and
supporting the neural cost of effort expenditure. They also found the dorsal anterior

! 15
cingulate cortex (ACC), an area implicated in both reward and effort processing, to be
activated during effort processing but not reward processing. The orbitofrontal cortex
and the medial prefrontal cortex, areas both implicated in reward processing but not
effort, were both activated in response to reward evaluation, but were not effected by
level of effort required. Croxson and colleagues (2009) also examined reward and effort
evaluation in humans using an fMRI. They had participants complete a task at 4 different
effort levels, and each level of effort was paired with 2 levels of reward. Participants
again made no choice between tasks, but simply completed the one presented following a
cue indicting which level of effort and reward task they were about to complete. They
found ACC activation in response to both reward and effort evaluation. They also found
activation in the ventral striatum and midbrain in response to both reward and effort
evaluation, although they did not specify what aspect of the midbrain had been evaluated,
simply that it was calculated as a region of interest based on prior research examining
reward. In contrast to Botvinick et al. (2009) and other research implicating the
orbitofrontal cortex in reward, they found no activation in the orbitofrontal cortex for
either reward or effort processing. The orbitofrontal cortex is implicated in the working
memory of reward (reviewed above). It is possible that Croxson and colleagues did not
find an effect in the orbitofrontal cortex because the task did not require participants to
make a choice in effort or reward or to evaluate the level of reward, but simply respond to
varying levels of both after being told what level of reward they would be performing for.
Effort in Schizophrenia. While it is adaptive to expend less effort for the same
reward, it is theorized that some individual’s are willing to expend more effort in general
(Eisenberger, 1992). Eisenberger stated that some individual’s exhibit ‘learned
! 16
industriousness’ and are more willing to expend effort because they have been internally
or environmentally reinforced for their effort, making effort less aversive. It seems
plausible then, that there would in turn be ‘learned passivity’. In other words, individuals
may have been either punished for expending effort, or reinforced for not expending
effort, by both internal and external means. These individuals would exhibit a
willingness to take a lesser reward in order to expend less effort, or an unwillingness to
expend effort regardless of reward. Considering that individuals with schizophrenia often
do not believe they are capable or worthy of rewards, they may opt not to expend effort
because they belief that they are incapable of expending more effort or unworthy of the
reward that more effort may bestow. This view is consistent with the ‘why try’ effect
discussed below with regard to internalized stigma and defeatist performance beliefs
(Corrigan, Larson, & Rüsch, 2009). Individuals with schizophrenia then accept that they
have lesser rewards in life and less fulfilling lives because of their illness, perpetuating
the lack of effort and functional impairments.
Research has been conducted in individuals with schizophrenia evaluating
whether they put forth less effort than healthy individuals and whether the level of effort
expended is related to neurocognitive performance or specific symptoms of schizophrenia
(Barch & Dowd, 2010; Gorissen, Sanz, & Schmand, 2005). Gorissen and colleagues
(2005) examined effort and neurocognitive performance in individuals with
schizophrenia. Their performance was compared with a group of neurological patients
with confirmed structural brain damage due to head injury and healthy controls. A larger
percentage of the schizophrenia group put forth insufficient effort, as determined by a
common neuropsychology recognition memory task designed to determine insufficient

! 17
effort/malingering, than either the neurologic or healthy control groups. The
schizophrenia group was then divided into two groups based on effort, an insufficient
effort group, comprised of those individuals that failed the effort measure, and a normal
effort group, comprised of those that passed the effort measure. The insufficient effort
group performed significantly worse on the neurocognitive measures than the normal
effort group. Negative symptoms were found to be associated with insufficient effort.
One limitation of this study was that the effort measure used can only be evaluated on a
pass/fail basis and interpretations cannot be made on a continuum of effort. Furthermore,
they found a much higher rate of low effort than other studies that have used the same
effort measure in individuals with schizophrenia (Avery et al., 2009).
Based on the fact that brain areas associated with effort have been found to be
dysfunctional in individuals with schizophrenia, cognitive impairment may be partially
responsible for less effort expenditure. Also, defeatist performance beliefs have been
theorized to be associated with a lower willingness to expend effort (the ‘why try’ effect),
although it has not been formally tested.
Defeatist-Performance Beliefs
Individuals with schizophrenia experience stigma within their environments. This
cultural stigma against those with mental illnesses, including schizophrenia, is present
and known prior to the individual’s symptom presentation and subsequent diagnosis.
Once the diagnosis occurs, the cultural stigma often becomes internalized. Holding the
belief that individuals with mental illness are weak or incapable, and then becoming a
part of that group can result in then applying that stigma or stereotype to oneself.

! 18
Internalizing stigma has been found to be associated with low self-esteem, low self-
efficacy, dysfunctional attitudes, and poor functional outcome.
Beck’s (2004) cognitive model of schizophrenia outlines how cognitive
distortions and biases result in psychotic symptoms. A component of these biases are
dysfunctional attitudes and beliefs about oneself and the environment.
Stigma. Individuals with mental illnesses, including schizophrenia, experience a
large amount of stigma from others because of their illness (Angermeyer, Beck, Dietrich,
& Holzinger, 2004; Dickerson, Sommerville, Origoni, Ringel, & Parente, 2002; Link,
Struening, Neese-Todd, Asmussen, & Phelan, 2001; Wright, Gronfein, & Owens, 2000).
In fact, schizophrenia has been considered one of the most stigmatizing mental illnesses
(Angermeyer & Schulze, 2001). A study conducted in Germany found that the most
common perceptions by the public of schizophrenia were that of incompetence,
unpredictability, and dangerousness (Angermeyer & Matschinger, 2004). Stigma that is
both perceived/anticipated and stigma that is actually experienced has been found to
negatively impact self-esteem, social relationships, employment, quality of life, and result
in increased demoralization and depressiveness (Angermeyer et al., 2004; Corrigan et al.,
2009; Link et al., 2001; Lysaker, Tsai, Yanos, & Roe, 2008). Self-esteem is a person’s
appraisal or attitude of him/herself, which is often contributed to by perceived group
membership (Lysaker et al., 2008). Orth, Robins, and Widaman (2012) conducted an
analysis of self-esteem on life outcomes across the lifespan. Using growth curve analyses
they concluded that self-esteem is not merely a by-product or result of success or failure
but that it is better conceptualized as a cause of life outcomes, such as psychological
symptoms, relationships, and job satisfaction. One aspect of self-esteem that has been

! 19
found to be impacted from stigmatization is self-deprecation (Wright et al., 2000).
Wright and colleagues (2000) evaluated self-esteem in a group of individuals diagnosed
with various mental illnesses that had recently been deinstitutionalized due to a hospital
closure and followed them longitudinally for 2 years. Participants in this study had been
institutionalized at the same hospital for an average of 8 years before being discharged
due to the hospitals closure. They found that both perceived and experienced
stigmatization led to self-deprecation, which led to feelings of loss of mastery and control
over the environment.
Internalized Stigma. Internalized stigma, or self-stigma, is one means that
stigmatization leads to low self-esteem and poorer outcomes (Cavelti, Kvrgic, Beck,
Rüsch, & Vauth, 2012; Park, Bennett, Couture, & Blanchard, 2012; Vauth, Kleim, Wirtz,
& Corrigan, 2007). Self-stigma involves being aware of the cultural stigma that is
present against a particular group, believing or agreeing with it, and, if it is a group that
one belongs to, internalizing or applying it to oneself (Cavelti et al., 2012; Corrigan et al.,
2009). Corrigan and colleagues (2009) described an effect of self-stigma they labeled the
“why try” effect. Self-esteem and self-efficacy are thought to be mediators between self-
stigmatization and life goal attainments, such as employment and quality of life. Self-
efficacy is an individual’s belief that he/she can successfully act on situations (Corrigan
et al., 2009). Similar to low self-esteem, low self-efficacy has been found to be
associated with unemployment, poor functional outcome and lower quality of life
(Corrigan et al., 2009; Vauth et al., 2007). Individuals with mental illness that experience
self-stigma which result in low self-efficacy and self-esteem may think that they are
unworthy or unable to succeed in basic life functions, such as living independently. In

! 20
other words, they may adopt an attitude that is consistent with the notion “why try”.
Lysaker and colleagues (2008) found that individuals with schizophrenia that internalize
stigma view themselves as less competent, which is a component of self-esteem that is
related to self-efficacy. Similarly, Vauth and colleagues (2007) examined the
relationship between self-stigma, self-efficacy, depression, and quality of life in
individuals with schizophrenia. Using structural equation modeling, they found that self-
stigmatization led to decreased self-efficacy and empowerment, which led to increased
depression and decreased quality of life.
Dysfunctional Attitudes. Applying stigma to oneself involves negative or
dysfunctional self-statements and self-schemas (Park et al., 2012). One commonly
researched type of dysfunctional beliefs is defeatist performance beliefs. Defeatist
performance beliefs are overly negative and generalized beliefs about one’s ability to
perform tasks and the likelihood of succeeding (Beck & Grant, 2008; Couture,
Blanchard, & Bennett, 2011; Grant & Beck, 2008; Park et al., 2012). Individuals with
schizophrenia report higher levels of defeatist performance beliefs than controls (Horan
et al., 2010) and similar levels of dysfunctional attitudes as individuals with depression
(Zimmerman, Coryell, Corenthal, & Wilson, 1986). Park and colleagues (2012) found a
significant correlation between defeatist performance beliefs and internalized stigma in
individuals with schizophrenia.
Cognitive Model of Psychosis. Beck (2004) proposed a cognitive model of
schizophrenia to understand and explain both positive and negative symptoms of
schizophrenia. Beck explained that all symptoms of schizophrenia, such as
hallucinations, delusions, disorganization, and negative symptoms are experienced along

! 21
a continuum throughout the population. The symptoms experienced by individuals with
schizophrenia are on the severe end of this continuum. On the more severe end of the
spectrum, these symptoms become more consuming, debilitating, and more firmly held.
The delusional content once becoming psychotic is usually held prior to psychosis. If an
individual’s delusion involves mind reading, he/she likely believed that was possible
prior to his/her psychosis. Similarly, research has found that individual’s delusions are
culturally relevant (Suhail & Cochrane, 2002). A person would not have a delusion of
something he/she had never heard of or been exposed to in some way.
Beck (2004) further explained that psychotic symptoms can be evaluated in terms
of three biases in attention and misattribution of thinking. The first two biases,
egocentric and externalizing biases, are related to the development of positive symptoms,
such as hallucinations and delusions. The egocentric/self-centered bias results in
individuals ascribing personal significance to a host of irrelevant environmental stimuli
and events. This then creates a hyper-attentiveness to the environment, which
perpetuates the personal attribution of irrelevant details within the environment. The
externalizing bias involves over attributing one’s distress to external causes. Distress
could be physical or psychological, but the distress is attributed to external factors, such
as God, government agencies, or unknown entities. The third bias is dysfunctional
attitudes. It involves the first two biases and further creates distress, resulting in negative
symptoms. Dysfunctional attitudes ultimately reinforce the cognitive, biological, and
environmental impairments that are present because of the disorder. Beck recognizes that
not all aspects of schizophrenia can be accounted for by cognitions. The model is an
extension of existing biological models and provides an explanation for why some
! 22
individuals with biological risk factors or predispositions go on to develop the disorder.
Dysfunctional attitudes are created and perpetuated by combinations of
biological/neurocognitive deficits and cognitive biases/misattributions of the self (e.g.
defeatist performance beliefs; internalized stigma) and environment. One source of
dysfunctional attitudes is the real, such as stigma, or perceived negative judgments of
others. As a result of fear of these judgments and negative beliefs about their abilities,
individuals voluntarily disengage from social relationships and interactions.
Disengagement and withdrawal from social interactions can include decreased
communication, expressive gestures and motivation. Social disengagement is a form of
safety mechanism and becomes automatic.
Some evidence exists to support this model. Low self-esteem has been found to
be present in individuals with schizophrenia in their first episode of psychosis (Vracotas,
Iyer, Joober, & Malla, 2010). Also, low self-esteem at the time of the first psychotic
episode was related to global functioning as measured by the Global Assessment of
Functioning (GAF) at six-months follow-up (Vracotas et al., 2010). Low self-esteem has
been found to be associated with paranoid delusions in individuals with schizophrenia
and depression (Bentall et al., 2008). Bentall and colleagues (2008) suggested that the
explanation for this connection is that constant low self-esteem, dysfunctional attitudes,
and fear of negative appraisals leads to the expectation the others will act malevolently.
Also, negative expectancy appraisals and defeatist performance beliefs have been found
to be associated with negative symptoms of schizophrenia (Couture et al., 2011). In
general, negative symptoms can be divided into at least two factors, which are diminished
experience and diminished expressivity. Couture and colleagues (2011) found that

! 23
negative expectancy appraisals and defeatist performance beliefs were significantly
associated with the negative symptoms of diminished experience rather than diminished
expressivity. Furthermore, cognitive behavior therapy (CBT) has been found to improve
negative and positive symptoms of schizophrenia by focusing on negative self-thought,
which includes low self-esteem, defeatist performance beliefs, and fear of negative
appraisals (Gould et al., 2001; Rector & Beck, 2001). Negative self-appraisals and self-
blame for illness has also been found to be associated with greater risk of relapse, or
exacerbations of psychotic symptoms, in individuals with schizophrenia (Gumley et al.,
2006).
Functional Outcome and Capacity
Functional ability is traditionally assessed in one of three ways: self-report,
observation, and performance-based. Within the framework of functional ability,
functional capacity and outcome have been separately identified and examined.
Typically, functional outcome is assessed via self-report questionnaires or clinician rated
forms following interviews. Functional outcome can be considered measures of real-
world performance, or what a person is actually doing in his/her daily life, regardless of
what they are capable of (Horan et al., 2010). Functional capacity is what a person is
capable of doing given optimal circumstances (Horan et al., 2010). Functional capacity is
typically assessed using performance-based measures. These measures require an
individual to actually complete various tasks, such as making a shopping list or planning
for a trip, and participants are rated on his/her accuracy. Functional capacity was chosen
as the primary dependent variable in the current study, rather than functional outcome.
The neurocognitive abilities of reinforcement learning and effort have been found to be

! 24
related to specific brain areas and dysfunction in these areas have been found to disrupt
performance. Because individuals have disrupted brain regions associated with these
tasks, functional capacity was thought to be effected more directly by these abilities than
functional outcome.
Many factors, personal and environmental, contribute to the discrepancy between
capacity and outcome. As previously discussed, poor self-esteem, self-efficacy, and
defeatist performance beliefs have all been found to be associated with poor functional
outcome. Neurocognitive impairment in general has also been found to be related to
functional capacity and outcome (Beck & Grant, 2008; Grant & Beck, 2008). However,
the effect of specific cognitive dysfunctions, specifically reinforcement learning and/or
effort, on functional capacity has not been causally evaluated in any population, including
schizophrenia.
Research Aims and Study Hypotheses
The aim of the current study is to provide information regarding the causal factors
contributing to functional impairment.
Hypothesis 1. First, I hypothesize that the schizophrenia group will perform
more poorly on the reinforcement learning task, effort task, and functional capacity, as
well as have more defeatist performance beliefs than the control group. Prior research
has demonstrated that individuals with schizophrenia are less able to learn from
reinforcement, put forth less effort to gain a reward, have impaired functional capacity,
and have higher defeatist performance beliefs. All of these variables have not been
examined together in one study.

! 25
Confirming these findings prior to evaluating a causal model between the
variables will be important. If one variable were found to not distinguish between the
groups, this would suggest that the variable is not a unique contributor of functional
capacity in schizophrenia and would suggest its removal from the causal chain.
Hypothesis 2. Furthermore I hypothesize that the more basic functions of
reinforcement learning and effort will predict defeatist performance beliefs, which will
predict functional capacity. The causal model begins with more basic neural processes
that have been tied to specific brain pathways and continues to more complex behavioral
impairments, specifically defeatist performance beliefs and functional capacity. The
primary model proposed predicts an additive effect of the more basic variables onto the
more complex (i.e. reinforcement learning and effort ! defeatist performance beliefs !
functional capacity).
Additional models will be tested in order to determine if a different causal model
is more appropriate for the given variables. The second model reverses the causal path of
the independent variables, such that defeatist performance beliefs predict both
reinforcement learning and effort and both reinforcement learning and effort predict
functional capacity. A third model will be examined in which once causal path is added
to model 2 between defeatist performance beliefs and functional capacity. Finally, a
fourth model will be tested that resembles a standard regression equation, predicting no
causal relationship among the independent variables, only examining the impact all
independent variables have on the dependent variable functional capacity.
Each of the variables of interest in the current study have been examined
singularly or in some combination in individuals with schizophrenia. However, they

! 26
have not been examined together and in a causative fashion. As previously mentioned,
understanding the neural and behavior causes of functional impairment can provide
direction for both pharmacological and behavioral interventions aimed at increasing
quality of life and independent living skills.
!

! 27
CHAPTER 3
METHOD
Participants
Seventy-five individuals were included in the current study. Fifty individuals had
a diagnosis of schizophrenia and 25 served as healthy controls. Participants ranged in age
from 18 to 64 years. Individuals were included in the study if the spoke English as their
first language, and did not have a history of traumatic brain injury or any other medical
condition or neurological disease/damage which has the potential to adversely affect
central nervous system functioning (e.g., liver disease, HIV). Additionally, participants
were excluded from participation if they had hearing or visual deficits that would not
allow them to complete the study procedures; had a history of alcohol or substance abuse
or dependence within the past six months; or currently used prescription or over-the-
counter medications that could produce significant cognitive effects, other than those
medications prescribed to treat schizophrenia. An additional exclusionary criterion for
controls included a family history of schizophrenia or bipolar disorder in any first-degree
relative, as determined through a structured interview. Schizophrenia and bipolar disorder
have high heritability rates and non-effected first-degree relatives of individuals with
schizophrenia and bipolar disorder have been found to share some overlapping features,
or endophenotypes, of the disorders (Frantom, Allen, & Cross, 2008; Hughes et al., 2005;
MacDonald & Schulz, 2009).

! 28
Measures
Six domains were measured in the current study and included: clinical
symptomatology; defeatist performance beliefs; effort; reinforcement learning; functional
capacity; and estimated intelligence and cognitive functions. Descriptions of the tests
used to measure these domains are provided below. Client demographic and clinical
information including medical and family history were obtained from the phone
screening, demographic forms and medical records.
Clinical Symptom Measures. Patients had an existing diagnosis of
schizophrenia as identified by a treating psychiatrist or psychologist. In addition, clinical
diagnosis was confirmed using the electronic version of the Structured Clinical Interview
for DSM-IV-TR (eSCID; First, Gibbon, Spitzer, & Williams, 1996). Controls had no
existing psychiatric disorder or neurological condition, which was also confirmed using
the eSCID. In order to measure current clinical symptomatology, all participants were
administered the Calgary Depression Rating Scale (CDRS; Addington, Addington, &
Schissel, 1990), the Brief Psychiatric Rating Scale (BPRS; Overall & Gorham, 1962), the
Scale for the Assessment of Positive Symptoms (SAPS; Andreasen, 1984), and the Scale
for the Assessment of Negative Symptoms (SANS; Andreasen, 1983). The CDRS
assesses depressive symptoms associated with schizophrenia. The SAPS, SANS, and
BPRS assess affective, anxiety, and positive and negative symptoms.
Electronic Structured Clinical Interview for the DSM-IV-TR. The electronic
Structured Clinical Interview for DSM-IV-TR (eSCID) is a semi-structured interview
identical to the paper version of the Structured Clinical Interview for DSM-IV-TR (SCID;
First et al., 2001). The SCID is designed to identify clinical symptoms and determine

! 29
Axis I psychiatric diagnoses. The eSCID is an electronic, computer-based version of the
SCID that allowed for cost and resource savings by eliminating the need to copy the 200+
page document for each participant seen. The electronic format also allowed for ease of
use by automatically jumping to appropriate sections based on participant responses
during the interview, rather than requiring the examiner to flip through pages to the
appropriate section.
The eSCID was used to verify a diagnosis of schizophrenia, rule out the presence
of several other conditions that exhibit similar symptoms, as well as confirm the lack of
Axis I disorder in the healthy control group.
Calgary Depression Rating Scale. The Calgary Depression Rating Scale for
Schizophrenia (CDRS; Addington et al., 1990) was designed to assess severity of
depression in individuals with schizophrenia. The nine item rating scale is based upon the
Hamilton Depression Rating Scale and the Present State Examination, and has been
reliably shown to measure depression specific to individuals with schizophrenia, separate
from positive, negative and extrapyramidal symptoms present in the disorder. Each item
is rated on a scale from 0 to 3 (absent to severe), based upon the individual’s subjective
report given during a clinical interview. A total score was derived by summing the nine
items.
Brief Psychiatric Rating Scale. The Brief Psychiatric Rating Scale (BPRS;
Overall & Gorham, 1962) is an 18-item clinician administered rating scale designed to
assess affective symptoms as well as symptoms of anxiety and positive and negative
psychotic symptoms. Each item is rated on a scale from 1 to 7 (absent to extremely
severe). The rating of each item is based on the individual’s subjective report over the
! 30
previous two weeks or behavioral observations made by the clinician during the time of
the interview. A total score was derived by summing the 18 items. Additionally, four
factors have been identified within the BPRS using factor analysis and were reported in
the current study (Mueser, Curran, & McHugo, 1997). The four factors are: 1) thought
disturbance, composed of items rating grandiosity, suspiciousness, hallucinatory behavior,
and unusual thought content (items 8, 11, 12, and 15), resulting in a minimum score of 4
and a maximum score of 28; 2) anergia, composed of items rating emotional withdrawal,
motor retardation, uncooperativeness, and blunted affect (items 3,13, 14, and 16),
resulting in a minimum score of 4 and a maximum of 28; 3) affect, composed of items
rating somatic concern, anxiety, guilt feelings, depressive mood, and hostility (items 1, 2,
5, 9, and 10), resulting in a minimum score of 5 and a maximum of 35; and 4)
disorganization, composed of items rating conceptual disorganization, tension, and
mannerisms and posturing (items 4, 6, and 7), resulting in a minimum score of 3 and a
maximum of 21. These factors have remained stable in a three-year longitudinal study of
individuals with schizophrenia (Long & Brekke, 1999).
Scale for the Assessment of Positive Symptoms. The Scale for the Assessment of
Positive Symptoms (SAPS; Andreasen, 1984) is a 34-item clinician administered rating
scale designed to assess positive psychotic symptoms. Positive symptoms include
hallucinations, delusions, bizarre behavior, and formal thought disorder. Global ratings
are also evaluated and are used to represent overall severity within each of these four
domains. Items are rated on a scale from 0 to 5 (absent to severe). The rating of each
item is based on the individual’s subjective report over the previous two weeks, as well as
on the behavioral observations of the clinician during the time of the interview. A total

! 31
score was derived by summing all 34 items. A score for each subscale was also derived
by summing all items, including the global rating, within each subscale.
Scale for the Assessment of Negative Symptoms. The Scale for the Assessment
of Negative Symptoms (SANS; Andreasen, 1983) is a 30-item clinician administered
rating scale designed to assess negative psychotic symptoms. Negative symptoms are
organized in 5 core domains: affective flattening, alogia, avolition, anhedonia, and
attentional impairment. Global ratings are also evaluated and are used to represent
overall severity within each of these five domains. Items are rated on a scale from 0 to 5
(absent to severe). The rating of each item is based on the individual’s subjective report
over the previous week, as well as on the behavioral observations of the clinician during
the time of the interview. A total score was derived by summing all 30 items. In addition,
two subscale scores were calculated based on current research suggesting two general
domains of negative symptoms, which are emotional expressivity and
motivation/pleasure (Blanchard & Cohen, 2006; Kirkpatrick et al., 2011; Strauss et al., in
press). Emotional Expressivity is the sum of items 1 – 15 (affective flattening and alogia).
Motivation/pleasure is the sum of items 16 – 26 (avolition and anhedonia-asociality).
Attention is not included in either subscale.
Reinforcement Learning. One measure of reinforcement learning was used in
the current study in order to evaluate the ability to learn from positive feedback and to
learn to avoid losses.
Reinforcement learning task. The reinforcement learning task (RL; Strauss et
al., 2012) is based off of a reinforcement learning task used by Pessiglione and colleagues
(2006) and adapted for use in individuals with schizophrenia. It was administered via E-

! 32
Prime (Psychology Software Tools) and run on a desktop computer with a 17-in monitor.
There are two phases to the task, an acquisition and a learning phase. During the
acquisition phase, participants were presented with 4 pairs of landscape stimuli, 1 pair at
a time. Two pairs have a potential gain if the correct item is selected and two pairs have a
potential loss if the incorrect item is selected. For the gain pairs, if the correct item is
selected an image of a nickel coupled with the feedback “Win!,” is presented, whereas if
the incorrect item is selected, the feedback “Not a winner, Try again!” is presented. For
the gain pairs, the correct response was reinforced on 90% of trials in one pair and on
80% of trials in the other pair. For the potential loss pairs, or loss avoidance pairs,
selection of the correct response resulted in the feedback “Keep your money!,” whereas
selection of the incorrect item resulted in the feedback “Lose!” If the correct response in
the loss avoidance pairs was selected, participants avoided a loss 90% or 80% of the time.
The acquisition phase consisted of 160 trials with all pair types presented in a randomized
order and each pair being shown 40 times. The 160 trials are divided into 4 acquisition
blocks of 40 trials each.
Following acquisition, the transfer test phase consisted of 64 trials. The original 4
training pairs were presented 4 times and 24 novel pairings were each presented twice.
Novel pairings consisted of each trained item being presented with one another (e.g., an
item that had been a 90% winner is paired with both items from the 80% gain pair, the
90% loss-avoidance pair, and the 80% loss-avoidance pair). No feedback was given
during this phase. Variables that can be examined from this task include training and test
phase accuracy scores, feedback valance (gain versus loss avoidance), and probability.
Training phase accuracy was chosen as the independent variable for the current study.

! 33
Effort. One measure of effort was used in order to assess the level of effort one is
willing to expend in order to gain rewards.
The Effort Expenditure for Reward Task. The Effort Expenditure for Reward
Task (EEfRT; Treadway, Buckholtz, Schwartzman, Lambert, & Zald, 2009) is a multi-
trial game in which participants are given an opportunity on each trial to choose between
an easy and a hard task in order to obtain monetary rewards. The task was originally
created in MATLAB, but a stand-alone version was provided by the tasks author,
Michael Treadway, via Dropbox. The program was run on the same desktop computer
with a 17-in monitor. For all trials of either difficulty, participants made repeated
keyboard button presses within an allotted period of time. Each button press adds a lever
inside of a bar viewed onscreen. Participants were eligible to win money for each trial if
they successfully completed the trial (i.e., filled the bar within the prescribed time
period). Successful completion of hard-task trials requires the participant to make 100
button presses within 21 seconds, using his/her non-dominant pinky finger, while
successful completion of easy-task trials requires the participant to make 30 button
presses within 7 seconds, using his/her dominant index finger. Participants were eligible
to win $1.00 on each easy-task trial they successfully completed and were eligible to win
higher amounts varying between $1.24 and $4.30 on each hard-task trial they
successfully completed. Each trial had a probability of providing monetary gain if
successfully completed. Trials had three levels of probability: 88%, 50% and 12%.
Probability levels applied to both the hard and easy tasks, and there was an equal
proportion of each probability level across the experiment. Each level of probability

! 34
appears once in conjunction with each level of hard-task reward value. Trials were
presented in the same order for every participant.
Participants had 5-seconds at the beginning of each trial to choose the easy or
hard task. During this time, the probability level and monetary values were presented. If a
participant did not make a choice within 5-seconds, the difficulty level was randomly
assigned for that trial. After making a choice, a 1-second ‘Ready’ screen was presented
followed by a white bar in the center of a black screen, at which time the participant
began pressing the button corresponding to the difficulty level chosen. Following task
completion or after the task time had elapsed, a 2-second feedback screen informing the
participant that the task was successfully or unsuccessfully completed was presented. If
the task was successfully completed, an additional 2-second feedback screen informing
the participant whether or not money had been won for that trial was presented.
In addition to the reimbursement rate given for participating in the study,
participants won the actual monetary value of two randomly selected trials that money is
earned. The game lasted 20 minutes, regardless of easy or hard task selection throughout
the game. Because of the time difference between easy and hard tasks, the total number
of trials that participants played depended on the choices made. Making more hard-task
choices reduced the total number of trials, which could reduce the number of high-value,
high-probability trials that might appear towards the end of the playing time and this
trade-off will be explained to participants. The goal of this trade-off is to ensure that
always choosing the easy or always choosing the hard option could not lead to an
‘optimal’ strategy. Also, varying monetary reward levels, probability, loss of time for
future trials, and brief decision periods makes formal calculation of an optimal response
! 35
selection difficult. Overall, the task reflected individual differences in willingness to
expend effort for a given level of expected reward value.
Because the number of trials a participant completed during the task varies upon
the choices made during the 20 minutes, the first 50 trials were used in data analysis. The
mean proportion of hard-task choices was calculated for each participant and this served
as a within-subjects variable in the ANOVA and the intervening variable in the path
analysis.
Defeatist Performance Beliefs. One measure of defeatist performance beliefs
was administered in order to examine one’s beliefs about his/her ability to perform tasks.
Defeatist Performance Beliefs from the Dysfunctional Attitudes Scale. The
Defeatist Performance Beliefs (DPB) subscale of the Dysfunctional Attitudes Scale
(DAS; Weissman, 1978) is a 15-item self-report questionnaire containing statements
about one's ability to perform tasks and the likelihood of success. Participants rate how
strongly they agree with each item on a scale from 1 to 7 (agree totally to disagree
totally). An example item is, “If you cannot do something well, there is little point in
doing it at all”. A total score is calculated by adding all 15-items.
Functional Capacity. Functional capacity was assessed using the UCSD
performance based skills assessment, a performance-based measure of functional
capacity.
UCSD Performance-Based Skills Assessment. The UCSD Performance-Based
Skills Assessment (UPSA; Patterson, Goldman, McKibbin, Hughs, & Jeste, 2001) is a
performance-based measure of everyday functioning. Participants are asked to complete
a number of tasks to determine skills in five areas: planning recreational activities,

! 36
finance, communication, transportation, and household chores. Planning recreational
activities requires participants to read two story scenarios and plan for a trip to those
locations accordingly (e.g. a trip to the zoo and to the beach). The finance tasks require
participants to count change and pay a bill by check. The communication tasks require
participants to make mock telephone calls using various instructions, such as
rescheduling a medical appointment or demonstrating the number they would dial in case
of emergencies. The transportation tasks require participants to read bus schedules to
determine the cost of a ride and which bus lines to travel. The household chores task
requires participants to read a recipe for rice pudding, look for the ingredients in a mock
pantry, and write a shopping list of the missing items they need to get from the store in
order to complete the recipe. Each of the five subscales yield raw scores, which are
transformed into a 0 to 20 scale by dividing the subscale raw score by the total points
possible on that subscale and multiplying by 20. The five transformed subscale scores
are summed, yielding a summary score ranging from 0 to 100.
The UPSA was developed for use with psychiatric patients (Patterson et al.,
2001). Performance has been found to be more impaired in individuals with
schizophrenia than controls (Patterson et al., 2001).
Estimated Intelligence and other Cognitive Functions. Three subtests from the
Wechsler Adult Intelligence Scale, third edition (WAIS-III; Wechsler, 1997), Block
Design, Vocabulary, and Matrix Reasoning, will be used to calculate an estimated current
intelligence and estimated premorbid intelligence. The regression equation used to
estimate current full scale IQ uses the Vocabulary and Block Design subtests [Ringe,
Saine, Lacritz, Hynan, & Cullum, 2002; (VO Scaled Score x 2.727) + (BD Scaled Score

! 37
x 2.727) + 42.535]. The regression equation used to estimate premorbid intelligence uses
the Vocabulary and Matrix Reasoning subtests [Schoenberg, Scott, Duff, & Adams, 2010;
45.997 + .652 (VO raw score) + 1.287 (MR raw score) + .157 (Age in years) + 1.034
(Education) + .652 (Ethnicity) – 1.015 (Gender)].
The Digit Symbol Coding and Digit Span subtests from the WAIS-III were also
included to assess processing speed and working memory, respectively. Processing speed
and/or working memory may negatively impact the primary outcome variables, so these
subtests were included in order to evaluate the impact, if any, these cognitive functions
are having on the primary outcome variables.
WAIS-III Block Design Subtest. The Block Design subtest from the WAIS-III
(Wechsler, 1997) requires an individual to assemble red and white blocks to match
images of increasing complexity within a stimulus book and is a measure of perceptual
reasoning. Total raw scores are converted to age-corrected scaled scores.
WAIS-III Vocabulary Subtest. The Vocabulary subtest from the WAIS-III
(Wechsler, 1997) requires an individual to define words of increasing difficulty and is a
measure of vocabulary knowledge. Total raw scores are converted to age-corrected
scaled scores for the current estimated full scale IQ and maintained as raw scores for the
premorbid full scale IQ.
WAIS-III Matrix Reasoning Subtest. The Matrix Reasoning subtest from the
WAIS-III (Wechsler, 1997) requires an individual to solve visual puzzles of increasing
complexity within a stimulus book and is a measure of perceptual reasoning. Total raw
scores are maintained for the premorbid full scale IQ score.

! 38
WAIS-III Digit Symbol Coding Subtest. The Digit Symbol Coding subtest from
the WAIS-III (Wechsler, 1997) requires an individual to match numbers and
corresponding symbols within two minutes. It is a measure of processing speed. Total
raw scores are converted to scaled scores and correlated with the primary outcome
variables.
WAIS-III Digit Span Subtest. The Digit Span subtest from the WAIS-III
(Wechsler, 1997) requires an individual to repeat a series of numbers of increasing length
in the forward order for the first portion, followed by repetition of a series of number of
increasing length in the reverse order. It is a measure of working memory. Total raw
scores are converted to scaled scores and correlated with the primary outcome variables.
Procedure
Participants were recruited from the University of Nevada, Las Vegas, community
mental health centers, and the community at large. Participants were recruited through
posted advertisements as well as presentations given to treating psychologists and
psychiatrists in community mental health centers, which resulted in referrals to the study.
Mojave Adult, Family, and Child Services, (Mojave Mental Health) an affiliate of the
University of Nevada, Reno medical school as well as Southern Nevada Adult Mental
Health allowed presentations and postings by our researchers at their facilities.
Participants received monetary compensation at a rate of $10/hour, prorated to $5 for
every half an hour. Compensation ranged from $40-$80 per participant. Study procedures
were approved by the UNLV IRB for protection of human subjects. Facilities
authorization was obtained from Jason Schwartz, Mojave Mental Health Director of
Community Services, and approved by the UNLV IRB to allow testing at Mojave Mental
! 39
Health. Office space was provided and participants were tested on location at 4000 East
Charleston Boulevard, Las Vegas, Nevada 89104.
Individuals interested in participating in the study initially called a private study
line located in the Neuropsychology research laboratory on the UNLV campus.
Individuals recruited at Mojave mental health completed the phone screening in person at
Mojave mental health. Before answering any questions, participants were given a brief
description of study procedures, including initial screening questions, and asked to
provide verbal consent to be asked the initial screening questions. Once verbal consent
was obtained, participants answered questions to determine eligibility for participating.
Individuals that met initial selection criteria on screening were scheduled to complete
additional testing procedures at the UNLV Neuropsychology research laboratory or in the
case of individuals at Mojave mental health were scheduled to complete additional testing
procedures on location. Before participants began study procedures, written informed
consent was obtained and questions were encouraged.
Once informed consent was reviewed and obtained, participants completed
diagnostic and screening procedures. As part of these procedures, basic demographic
information was collected, followed by the eSCID to determine the presence or absence
of Axis I psychiatric disorders, and a 15-minute interview assessed current
symptomatology.
After diagnostic and screening procedures were completed and it was determined
that the participant was eligible, the remaining battery of neurocognitive tests were
administered in a fixed order. The interviews, questionnaires and neuropsychological
tests used in this study were part of a larger battery of tests. All testing was conducted by
! 40
trained doctoral level graduate students in a quiet private room at either the UNLV
Neuropsychology research laboratory or at Mojave Mental Health Center. Participants
were provided breaks whenever requested or as deemed appropriate by the examiner in
order to control for fatigue effects, alleviate anxiety, and maintain motivation.
Data Analysis
Data entry and screening. Trained graduate students and research assistants
scored all tests according to standardized procedures. Data was entered into a Microsoft
Excel database. Scoring and data entry was double checked by visual inspection by
trained individuals. Data was also evaluated for assumptions of parametric tests
(described in detail in the next section).
Preliminary analyses. Basic demographic information was calculated before
primary analyses were completed. One-way ANOVAs were conducted to examine
differences between groups on these basic demographic variables.
In addition to basic demographic information, diagnostic and clinical variables in
the schizophrenia group were calculated. These variables include, number of
hospitalizations, and current symptomatology as obtained from the clinical symptom
ratings scales (BPRS, CDRS, SAPS, and SANS). Finally, type of medication and the
frequency of each drug class by patients were calculated. To ease comparability across
antipsychotic generation and dosage, antipsychotic medication dosage was converted to a
chlorpromazine equivalent dosage (Woods, 2003). The chlorpromazine equivalent
dosage was calculated and reported as an additional clinical symptom descriptive.
Primary analyses.
! 41
Hypothesis 1. Univariate ANOVAs were used to investigate the differences
between groups on the primary variables, i.e. reinforcement learning performance, effort,
defeatist performance beliefs, and functional capacity. In these analyses, the test scores
will serve as the dependent variable, while group membership is the independent variable.
It was hypothesized that participants in the schizophrenia group would perform the worst
on the behavioral measures (reinforcement learning, effort, and functional capacity) and
would have more defeatist performance beliefs than healthy controls. These analyses
would confirm prior research demonstrating these impairments in individuals with
schizophrenia, although they have never all been collected in the same study.
Hypothesis 2. In order to examine the second hypothesis, a path analysis was
conducted. Path analysis allowed the examination of each dependent variable’s unique
prediction of the major outcome variable, functional capacity.
Path analysis is an extension of regression and allows for the comparison of
multiple causal models. Regression analyses are performed for each of the relationships
specified within a path model, and the weights predicted by the model are subsequently
compared to the correlation matrix that was obtained from the actual data. Model fit
indexes allow for comparisons between models in order to identify which of a number of
competing models provides the best explanation of the observed data.
The adequacy of fit of proposed models is determined using a number of
procedures. Path coefficients, which are standardized regression coefficients, can be
evaluated to determine whether individual causal relationships in the hypothesized model
are present in the actual data.
! 42
Figures 1-4 represents the path models evaluated. In these models, each variable
is assessed using a single indicator, or total score from each relevant measure used to
assess each variable. The models depict the relationships between the independent,
intermediary and dependent variables. In the first model reinforcement learning and effort
are the independent variables, defeatist performance beliefs are the intermediary variable,
and functional capacity is the dependent variable. Models 2-4 maintains these variables
but in varying arrangements.
In the models, causative relationships between the variable are indicated by single
arrows from one variable to another, in order to indicate their hypothesized causative
influence. The direction of each arrow indicates the direction of the hypothesized causal
influence. The causative influences of the paths from one variable on another are
determined by a standardized regression coefficient (beta). Exogenous/Independent
variables in the model have no explicit causes as indicated by no arrows leading to them.
The exception to this is when exogenous variables are correlated, which is indicated by a
curved, bidirectional arrow. Endogenous variables do have arrows leading to them.
Endogenous intervening variables have both incoming and outgoing arrows, and
dependent endogenous variables have only incoming causal arrows.
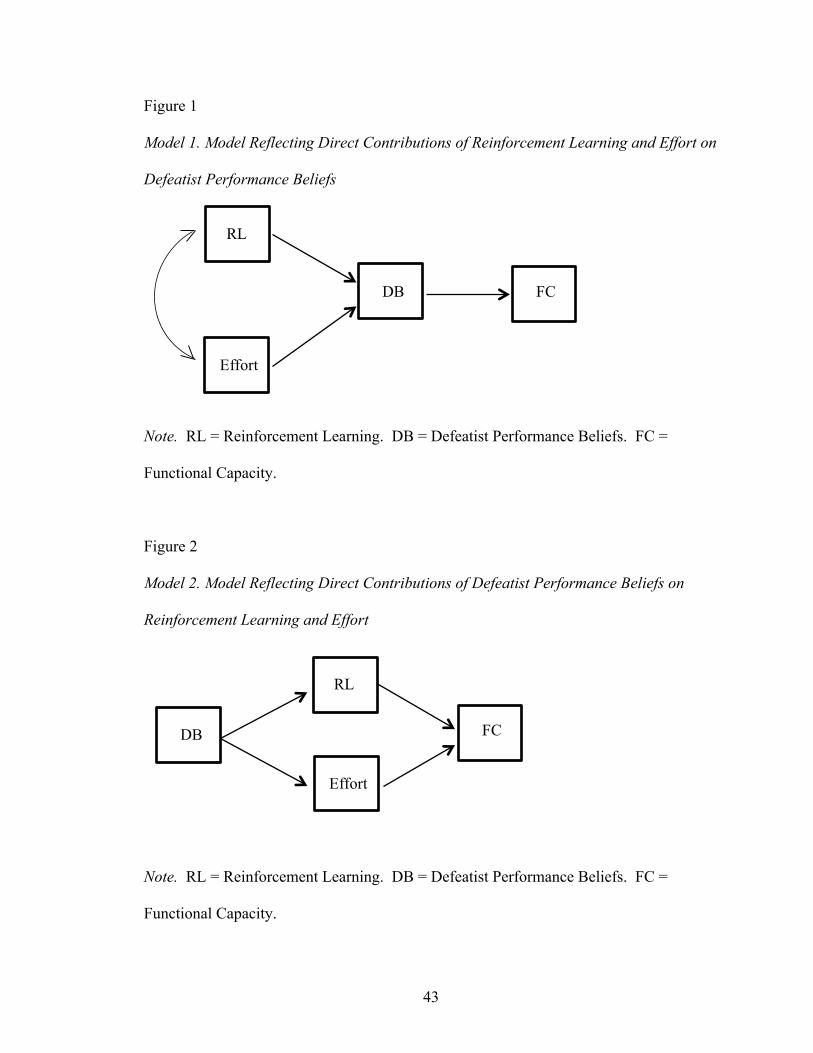
! 43
Figure 1
Model 1. Model Reflecting Direct Contributions of Reinforcement Learning and Effort on
Defeatist Performance Beliefs
Note. RL = Reinforcement Learning. DB = Defeatist Performance Beliefs. FC =
Functional Capacity.
Figure 2
Model 2. Model Reflecting Direct Contributions of Defeatist Performance Beliefs on
Reinforcement Learning and Effort
Note. RL = Reinforcement Learning. DB = Defeatist Performance Beliefs. FC =
Functional Capacity.
RL
Effort
DB
FC
RL
Effort
DB
FC

! 44
Figure 3
Model 3. Complete Model Reflecting Direct Contributions of Defeatist Performance
Beliefs on Reinforcement Learning, Effort, and Functional Capacity
!
!
!
!
!
Note. RL = Reinforcement Learning. DB = Defeatist Performance Beliefs. FC =
Functional Capacity.
Figure 4
Model 4. Standard Regression Model
!
Note. RL = Reinforcement Learning. DB = Defeatist Performance Beliefs. FC =
Functional Capacity.
FC
DB
RL
Effort
RL
Effort
DB
FC

! 45
CHAPTER 4
RESULTS
Data Screening
Initial screening and evaluation of the data took place in order to ensure accuracy
of the data and assumptions of parametric tests were met.
Accuracy of data file. Frequency and range statistics were evaluated in order to
ensure no duplicate cases existed and that all data fell within range. Data was also
examined for missing cases, of which none were present.
Outliers. Scores that fall beyond 3.29 standard deviations from the mean are
considered univariate outliers. Z-scores were calculated for each variable used in the path
analysis in order to determine the presence of univariate outliers. For all variables, the
largest z-score was an UPSA score of -3.26, indicating no univariate outliers.
Multivariate outliers are evaluated by a Mahalanobis distance of p < .001 for the
χ2 value. Five variables are used in all path models, so the χ2 value with a significance of
p < .001 is 20.52. Mahalanobis distance calculated using linear regression indicated
distances ranging from 0.19 to 11.55, indicating no multivariate outliers.
Normality. Skewness and kurtosis statistics are reported in Table 1. Generally,
skewness values within +/- 1 and kurtosis values within +/- 1.5 are considered to indicate
normally distributed data. As can be seen from the table, the scores for all tests were
generally within these cutoffs for normally distributed data, although the UPSA total
score was -1.10 for skewness. Thus, no transformation was required to normalize the data.

! 46
Table 1
Skewness and Kurtosis Values for the Primary Variables
Skewness Kurtosis
UPSA -1.10 1.02
DPB -0.10 -1.27
Effort 0.27 0.01
Reinforcement Learning -0.32 -1.08
Note. UPSA = UCSD Performance Based Skills Assessment; DPB = Defeatist
Performance Beliefs.
Linearity. Through examination of scatter plots of all dependent variables and
plots of the residuals from regression analyses, the variables exhibited a linear
relationship.
Multicollinearity and singularity. Singularity is considered the presence of a
redundant variable (i.e., a variables composed of a combination of 2 or more of the other
variables). All variables used are discrete and thus not singular. Multicollinearity was
examined using a correlation matrix. Table 2 presents the correlations among all
variables used in the path analysis. Variables are considered multicollinear if the
correlation between them are > 0.90. As can be seen in Table 2, there were no
correlations greater than 0.54 between any variable, suggesting the absence of
multicollinaerity.
Residuals. After model estimation, the residuals (residual covariances, i.e. errors)
should be small and centered around 0. Some can be large but symmetrical. When large
residuals are found, this may suggest that the model is not a good fit. In each path model,
medium sized residuals were present. Tabachnick and Fidell (2013) suggest examining
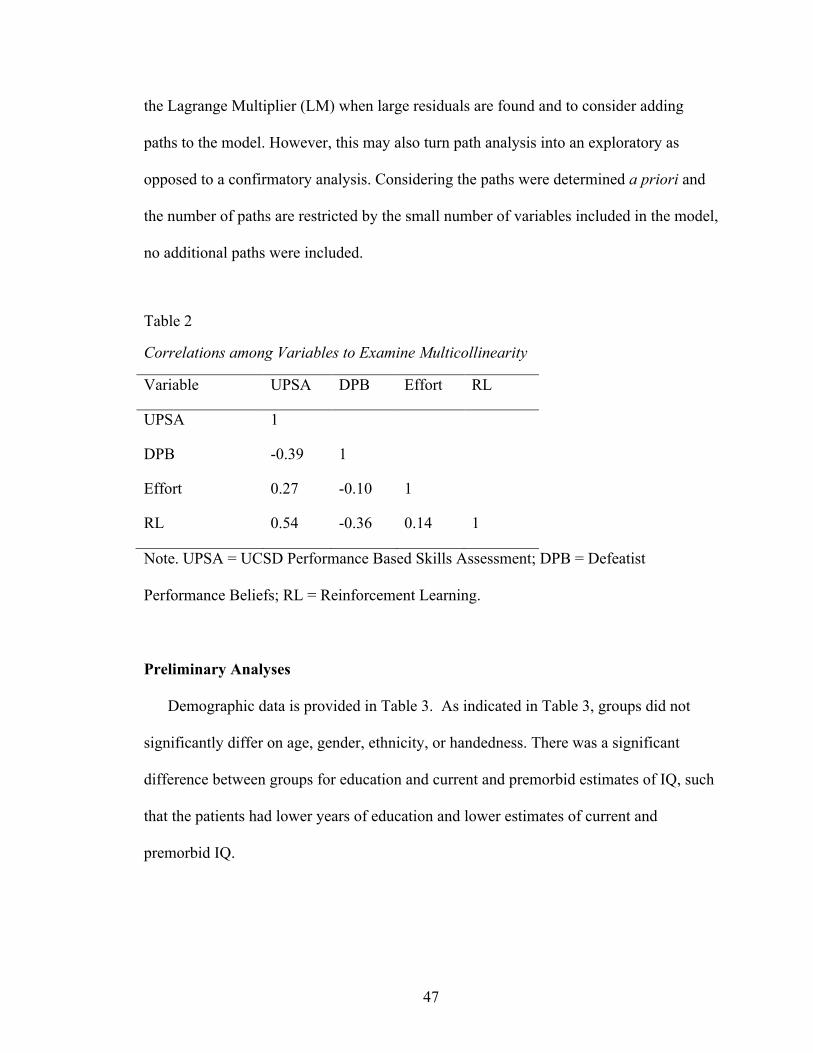
! 47
the Lagrange Multiplier (LM) when large residuals are found and to consider adding
paths to the model. However, this may also turn path analysis into an exploratory as
opposed to a confirmatory analysis. Considering the paths were determined a priori and
the number of paths are restricted by the small number of variables included in the model,
no additional paths were included.
Table 2
Correlations among Variables to Examine Multicollinearity
Variable UPSA DPB Effort RL
UPSA 1
DPB -0.39 1
Effort 0.27 -0.10 1
RL 0.54 -0.36 0.14 1
Note. UPSA = UCSD Performance Based Skills Assessment; DPB = Defeatist
Performance Beliefs; RL = Reinforcement Learning.!
!
Preliminary Analyses
Demographic data is provided in Table 3. As indicated in Table 3, groups did not
significantly differ on age, gender, ethnicity, or handedness. There was a significant
difference between groups for education and current and premorbid estimates of IQ, such
that the patients had lower years of education and lower estimates of current and
premorbid IQ.

! 48
Table 3
Demographic Information by Group
Variable Group F p
Control Schizophrenia
Age 38.08 (14.97) 40.76 (12.51) 0.67 0.42
Education 14.20 (1.94) 12.42 (1.85) 14.93 >0.001
Premorbid Estimated IQ* 111.53 (6.87) 90.36 (14.75) 46.24 >0.001
Current Estimated IQ 106.89 (11.22) 84.31 (14.06) 48.81 >0.001
χ2 p
Gender (% male) 52.0 54.0 0.03 0.87
Ethnicity (%) 2.04 0.73
Caucasian 52.0 50.0
African American 24.0 26.0
Hispanic/Latino 8.0 14.0
Asian American 8.0 2.0
Biracial 8.0 8.0
Handedness (% right) 96.0 88.0 1.26 0.26
Note. * = premorbid estimated IQ based on a regression equation is reported here,
although the term ‘premorbid’ does not apply to controls.
These differences in IQ and years of education were expected based on prior research
indicating that cognitive deficits are a core feature of schizophrenia and as such,
individuals with schizophrenia typically obtain lower IQ scores than the general
population (Aylward, Walker, & Bettes, 1984; Hedman, van Haren, van Baal, Kahn, &
Hulshoff Pol, 2013), and in comparison to individuals with other psychiatric disorders
(Goldberg et al., 1993). These intellectual deficits predate onset of illness (Caspi et al.,
2003; Reichenberg et al., 2002), and are associated with decreased academic performance

! 49
particularly in late adolescence as the onset of the disorder approaches (Allen, Frantom,
Strauss, & van Kammen, 2005; Fuller et al., 2002; Gunnell, 2002; Strauss et al., 2012;
van Oel, Sitskoorn, Cremer, & Kahn, 2002). Given that diminished IQ and associated
decreases in academic performance and years of education obtained are characteristic of
schizophrenia, IQ and education differences were not controlled through covariance or
other procedures when conducting the main analyses, since controlling for these
differences would essentially control for the independent variable of interest (i.e.,
diagnosis).
Symptomatology information for each group is summarized in Table 4. As
expected, groups significantly differed on all symptom measures, such that the patient
group had significantly higher clinical symptomatology (i.e. depression, positive and
negative symptoms, global assessment of functioning) than the control group.
Demographic and illness severity variables were correlated with the primary
outcome variables in the schizophrenia group in order to determine if any significant
associations were present (see Table 5). A Bonferroni correction was made to correct for
Type I error because of the high number of correlations being examined. The Bonferroni
correction took into account the 8 demographic variables being correlated with the 4
primary variables, resulting in a new p value of 0.006. Age, education, chlorpromazine
equivalent, number of hospitalizations, length of illness, and global assessment of
functioning were not significantly correlated with any primary outcome variables.
Reinforcement learning was significantly correlated with current IQ, r = 0.43, p < 0.006,
and UPSA was significantly correlated with premorbid IQ and current IQ, r = 0.53 and
0.55 , p < 0.006.
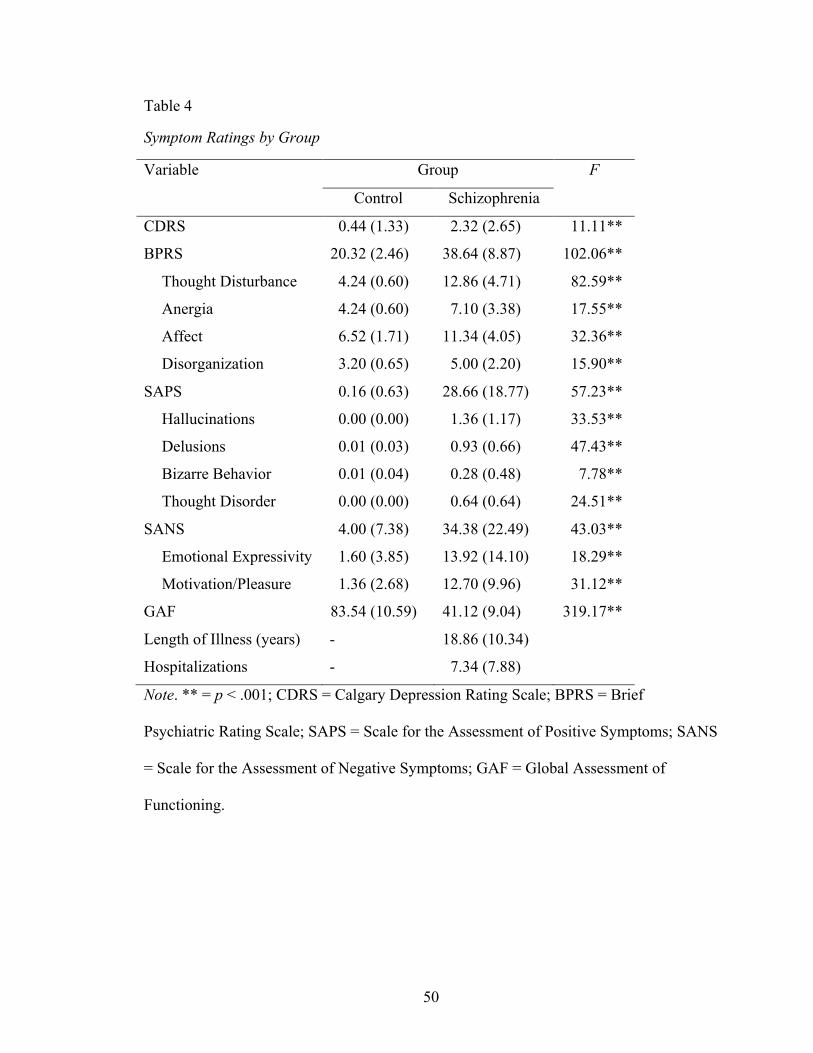
! 50
Table 4
Symptom Ratings by Group
Variable Group F
Control Schizophrenia
CDRS 0.44 (1.33) 2.32 (2.65) 11.11**
BPRS 20.32 (2.46) 38.64 (8.87) 102.06**
Thought Disturbance 4.24 (0.60) 12.86 (4.71) 82.59**
Anergia 4.24 (0.60) 7.10 (3.38) 17.55**
Affect 6.52 (1.71) 11.34 (4.05) 32.36**
Disorganization 3.20 (0.65) 5.00 (2.20) 15.90**
SAPS 0.16 (0.63) 28.66 (18.77) 57.23**
Hallucinations 0.00 (0.00) 1.36 (1.17) 33.53**
Delusions 0.01 (0.03) 0.93 (0.66) 47.43**
Bizarre Behavior 0.01 (0.04) 0.28 (0.48) 7.78**
Thought Disorder 0.00 (0.00) 0.64 (0.64) 24.51**
SANS 4.00 (7.38) 34.38 (22.49) 43.03**
Emotional Expressivity 1.60 (3.85) 13.92 (14.10) 18.29**
Motivation/Pleasure 1.36 (2.68) 12.70 (9.96) 31.12**
GAF 83.54 (10.59) 41.12 (9.04) 319.17**
Length of Illness (years) - 18.86 (10.34)
Hospitalizations - 7.34 (7.88)
Note. ** = p < .001; CDRS = Calgary Depression Rating Scale; BPRS = Brief
Psychiatric Rating Scale; SAPS = Scale for the Assessment of Positive Symptoms; SANS
= Scale for the Assessment of Negative Symptoms; GAF = Global Assessment of
Functioning.
!

! 51
Table 5
Correlations among Demographic and Illness with Primary Variables in Schizophrenia
Variable Effort RL DPB UPSA
Age 0.02 -0.13 0.05 0.19
Education -0.35 0.12 -0.18 0.26
Premorbid IQ 0.16 0.28 -0.16 0.53**
Current IQ 0.19 0.43** -0.17 0.55**
CPZ Equivalent -0.29 -0.26 -0.07 -0.32
Hospitalizations -0.07 0.25 -0.17 -0.05
Length of Illness 0.11 -0.03 -0.04 0.12
GAF 0.14 0.19 -0.32 0.31
Note. ** = p < .006; SZ = schizophrenia; RL = Reinforcement Learning; DPB = Defeatist
Performance Beliefs; UPSA = UCSD Performance Based Skills Assessment
Medication information for the patient group can be found in Table 6. As can be
seen from the table, all but one patient participant (2%) was taking some form of
psychiatric medication. Eighty-six percent of the patient participants were taking an
antipsychotic, 12% were taking a typical and 78% were taking an atypical, 36% were
taking a mood stabilizer, 48% were taking an antidepressant, and 6% were taking lithium.
Daily chlorpromazine equivalent dosage (CPE) in milligrams (Woods, 2003) was
calculated for all participants. CPE dosage involves converting all antipsychotic
medication, regardless of brand or class, into equivalent dosages to ease comparison.!
!

! 52
Table 6
Medication Information for the Schizophrenia Group
Medication Value
Chlorpromazine Equivalent 541.36 (397.33)
Antipsychotics 88%
Atypical 78%
Typical 12%
Mood Stabilizer 36%
Antidepressant 48%
Lithium 6%
No Medication 2%
Primary analyses
Hypothesis 1. One-way ANOVAs were used to investigate the differences
between groups on the primary variables, i.e. reinforcement learning performance, effort,
defeatist performance beliefs, and functional capacity. Table 7 summarizes these results.
As can be seen from the table, the patient and control groups significantly differed on all
primary variables, such that the patient group is performing significantly worse on the
reinforcement, effort, and functional capacity measures, and they are experiencing
significantly more defeatist performance beliefs. The patient and control groups also
significantly differed on the total number of effort trials completed (i.e. trials started but
not completed in time and were thus discontinued), such that the patient group completed
significantly less trials. It was unclear why the patient group was completing less trials,
and if this was impacting overall effort performance. To evaluate this, a one-way
ANOVA evaluating effort choice performance between groups that excluded participants
that completed less than 10% of the first 50 trials was completed. The difference between

! 53
groups remained significant, F(1,67) = 6.19, p = 0.015. Also to examine factors
associated with effort and trial completion, these variables were correlated with various
variables that may have contributed to poorer performance on this measure in the patient
group. Specifically, these variables were current and premorbid intelligence estimates,
working memory, processing speed, and CPE dose. Results of these correlations are
presented in Table 8. As can be seen from the table, number of trials completed was not
significantly correlated with any other variable, including effort choice. Effort choice was
significantly correlated with CPE dose. With the available results, CPE dose was at least
associated with effort choice in the patient group. It is possible the CPE dose diminishes
motivation to some extent, although it is unclear whether this association is due to the
medication itself, or other factors associated with increased medication dose, such as
illness severity. In order to further examine the effect of CPE dose on effort choice, a
regression analysis was conducted using CPE dose as the sole predictor of effort choice.
The regression analysis found CPE dose to account for only 8.5% of the variance in effort
performance. A one-way ANOVA was conducted between groups using the predicted
effort choice values derived from the regression equation. In this analysis, significance
between groups in effort performance remained significant, F(1,74) = 46.10, p < .001.
Overall, these results support the hypothesis that participants in the schizophrenia group
perform worse on the behavioral measures (reinforcement learning, effort, and functional
capacity) and have more defeatist performance beliefs than the control group. These
analyses support prior research demonstrating these impairments in individuals with
schizophrenia, although all variables had not been examined in the same study.

! 54
Table 7
Main Variable Information by Group
Variable Group F
CN (n=25) SZ (n=50)
DPB 31.40 (13.22) 51.20 (14.50) 32.90**
Reinforcement Learning 78.07 (11.09) 69.45 (12.34) 8.68**
Effort
Easy vs Hard 0.53 (0.26) 0.39 (0.24) 5.50*
Completed 0.99 (0.03) 0.95 (0.09) 4.98*
Total trials 56.32 (9.01) 60.42 (9.00) 3.48
UPSA total 87.50 (6.71) 75.53 (14.53) 15.25**
Activities/Planning 18.46 (1.51) 16.27 (2.64) 14.77**
Finance 17.74 (2.69) 14.07 (3.95) 17.48**
Communication 15.82 (2.75) 14.49 (3.68) 2.57
Transportation 17.87 (2.13) 15.40 (3.92) 8.59**
Household 17.60 (3.27) 15.30 (4.78) 4.68*
Note. * = p > .05; ** = p > .001; CN = controls; SZ = schizophrenia; DPB = defeatist
performance beliefs; UPSA = UCSD Performance Based Skills Assessment.
!

! 55
Table 8
Factors Potentially Impacting Effort Choice and Trial Completion in Schizophrenia
Variable Effort Completed
Premorbid IQ 0.16 0.06
Current IQ 0.19 0.07
Processing Speed 0.03 0.18
Working Memory 0.01 0.14
Chlorpromazine Dose -0.29* -0.24
Completed 0.01 1
Note. * = p < .05
Hypothesis 2. Figures 5-8 depict the final proposed models with path coefficients
inserted. Both groups were included in the path and regression analyses. Including only
the schizophrenia group attenuated the correlations between variables by restricting the
range. The majority of the schizophrenia participants were low functioning, requiring
social security disability, as well as housing and other forms of assistance. If higher
functioning individuals with schizophrenia had been included in the sample, the range of
scores would not have been as restricted. However, this was not the case, so including
controls in the analyses improved the range of scores and strengthened the correlations.
Correlations were conducted between the variables used in the path and regression
analyses for the schizophrenia group and the entire sample for comparison purposes (see
Table 9). As can be seen from the table, including the controls did not change the pattern
of correlations in a meaningful way, but provided more variability in scores thus
strengthening the correlations.
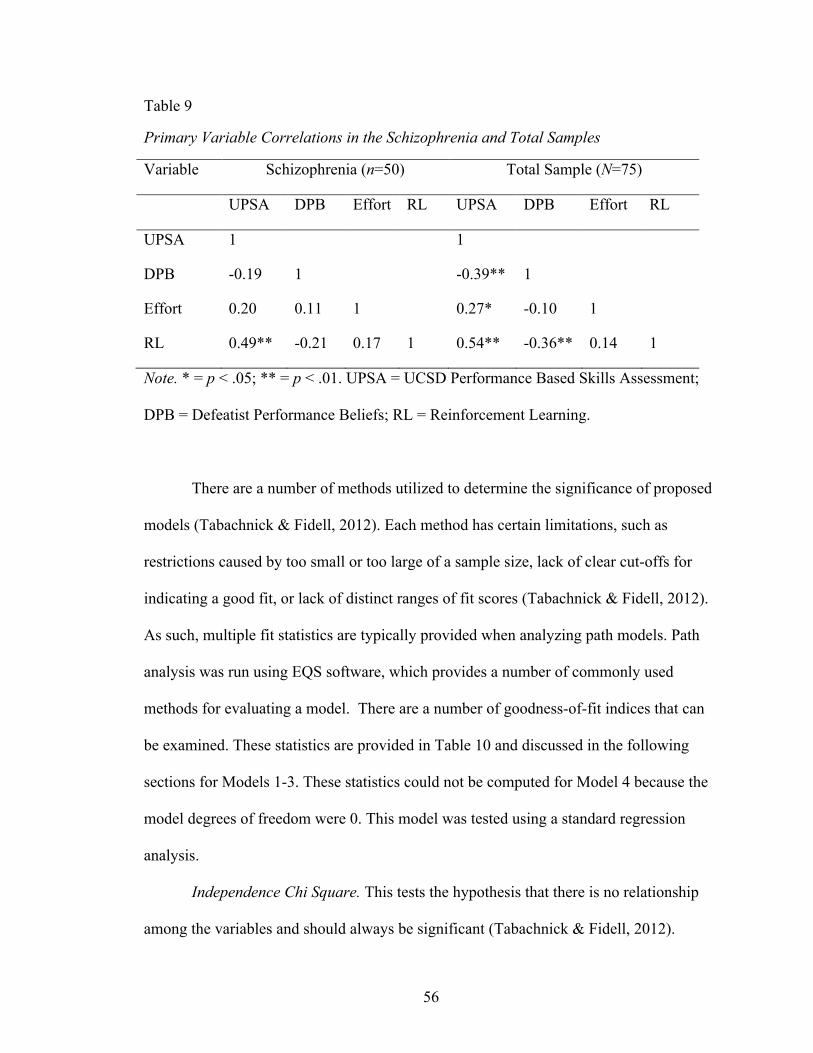
! 56
Table 9
Primary Variable Correlations in the Schizophrenia and Total Samples
Variable Schizophrenia (n=50) Total Sample (N=75)
UPSA DPB Effort RL UPSA DPB Effort RL
UPSA 1 1
DPB -0.19 1 -0.39** 1
Effort 0.20 0.11 1 0.27* -0.10 1
RL 0.49** -0.21 0.17 1 0.54** -0.36** 0.14 1
Note. * = p < .05; ** = p < .01. UPSA = UCSD Performance Based Skills Assessment;
DPB = Defeatist Performance Beliefs; RL = Reinforcement Learning.
There are a number of methods utilized to determine the significance of proposed
models (Tabachnick & Fidell, 2012). Each method has certain limitations, such as
restrictions caused by too small or too large of a sample size, lack of clear cut-offs for
indicating a good fit, or lack of distinct ranges of fit scores (Tabachnick & Fidell, 2012).
As such, multiple fit statistics are typically provided when analyzing path models. Path
analysis was run using EQS software, which provides a number of commonly used
methods for evaluating a model. There are a number of goodness-of-fit indices that can
be examined. These statistics are provided in Table 10 and discussed in the following
sections for Models 1-3. These statistics could not be computed for Model 4 because the
model degrees of freedom were 0. This model was tested using a standard regression
analysis.
Independence Chi Square. This tests the hypothesis that there is no relationship
among the variables and should always be significant (Tabachnick & Fidell, 2012).

! 57
Because the same variables were used in all models, the chi-square was identical for all
models, χ2 = 46.24, p < .001. This suggests that there is some relationship among the
variables.
Chi-square. The model chi-square, which examines the goodness of fit between
the sample covariance matrix and the estimated population covariance matrix, should
ideally be non-significant (Tabachnick & Fidell, 2012). As can be seen from Table 10,
the χ2 for Model 1 was significant while the χ2 for Model 2 and Model 3 were not
significant. These results suggest that both Model 2 and Model 3 may provide a good fit
for the data. However, Model 2 approaches significance, while Model 3 does not,
suggesting Model 3 is the best fitting model based on chi-square.
Normed Fit Index (NFI). The Normed Fit Index (NFI) compares the model χ2 to
the independence model χ2. A NFI value > 0.95 is considered a good fitting model
(Tabachnick & Fidell, 2012). Model 1’s NFI = 0.52, Model 2’s NFI = 0.88, and Model
3’s NFI = 0.98. These results again suggest that Model 3 provides the best fit for the data.
Comparative Fit Index (CFI).This fit index compares the estimated and
independent model χ2 distributions based on noncentrality parameters. Again, larger
values indicate better fitting models, with CFI > 0.95 suggestive of a good fit
(Tabachnick & Fidell, 2012). Model 1’s CFI = 0.50, Model 2’s CFI = 0.92, and Model
3’s CFI = 1.00. These results further support the better fit of Model 3 than Model 1 or 2
for the data.
Goodness-of-fit Index (GFI). GFI is a weighted proportion of variance in the
sample covariance accounted for by the estimated population covariance matrix. It can be
considered analogous to R2 in multiple regression. A GFI > 0.90 is considered an
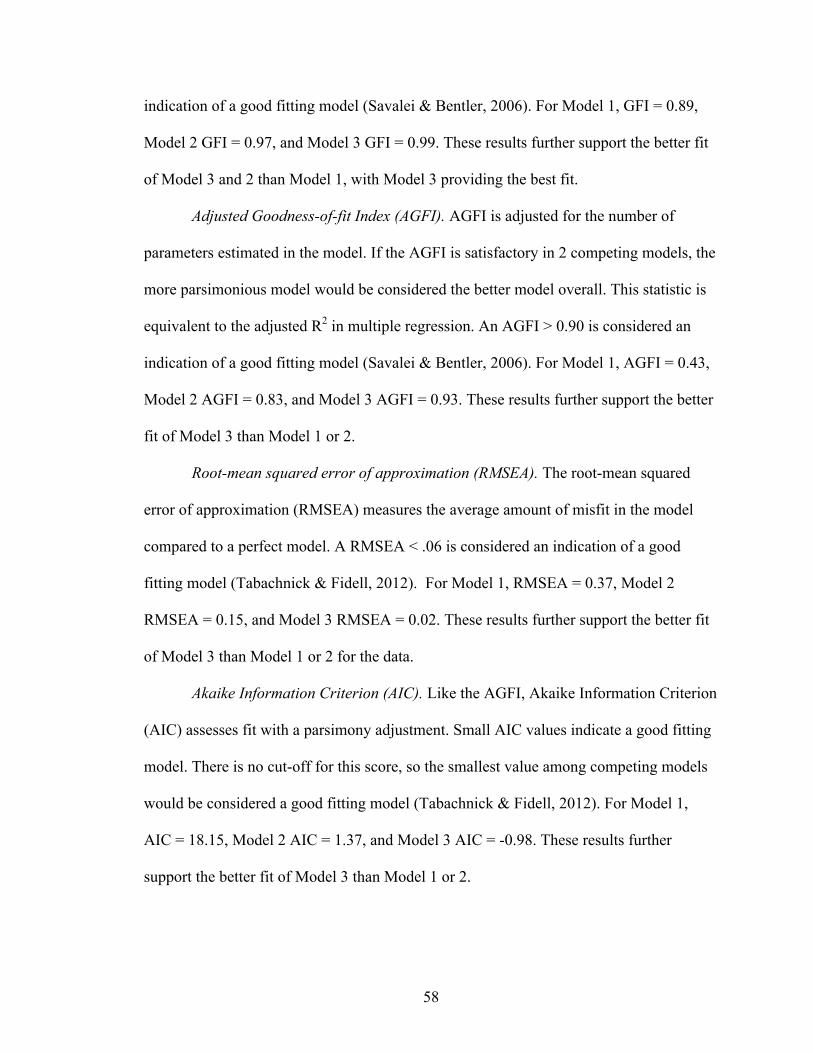
! 58
indication of a good fitting model (Savalei & Bentler, 2006). For Model 1, GFI = 0.89,
Model 2 GFI = 0.97, and Model 3 GFI = 0.99. These results further support the better fit
of Model 3 and 2 than Model 1, with Model 3 providing the best fit.
Adjusted Goodness-of-fit Index (AGFI). AGFI is adjusted for the number of
parameters estimated in the model. If the AGFI is satisfactory in 2 competing models, the
more parsimonious model would be considered the better model overall. This statistic is
equivalent to the adjusted R2 in multiple regression. An AGFI > 0.90 is considered an
indication of a good fitting model (Savalei & Bentler, 2006). For Model 1, AGFI = 0.43,
Model 2 AGFI = 0.83, and Model 3 AGFI = 0.93. These results further support the better
fit of Model 3 than Model 1 or 2.
Root-mean squared error of approximation (RMSEA). The root-mean squared
error of approximation (RMSEA) measures the average amount of misfit in the model
compared to a perfect model. A RMSEA < .06 is considered an indication of a good
fitting model (Tabachnick & Fidell, 2012). For Model 1, RMSEA = 0.37, Model 2
RMSEA = 0.15, and Model 3 RMSEA = 0.02. These results further support the better fit
of Model 3 than Model 1 or 2 for the data.
Akaike Information Criterion (AIC). Like the AGFI, Akaike Information Criterion
(AIC) assesses fit with a parsimony adjustment. Small AIC values indicate a good fitting
model. There is no cut-off for this score, so the smallest value among competing models
would be considered a good fitting model (Tabachnick & Fidell, 2012). For Model 1,
AIC = 18.15, Model 2 AIC = 1.37, and Model 3 AIC = -0.98. These results further
support the better fit of Model 3 than Model 1 or 2.
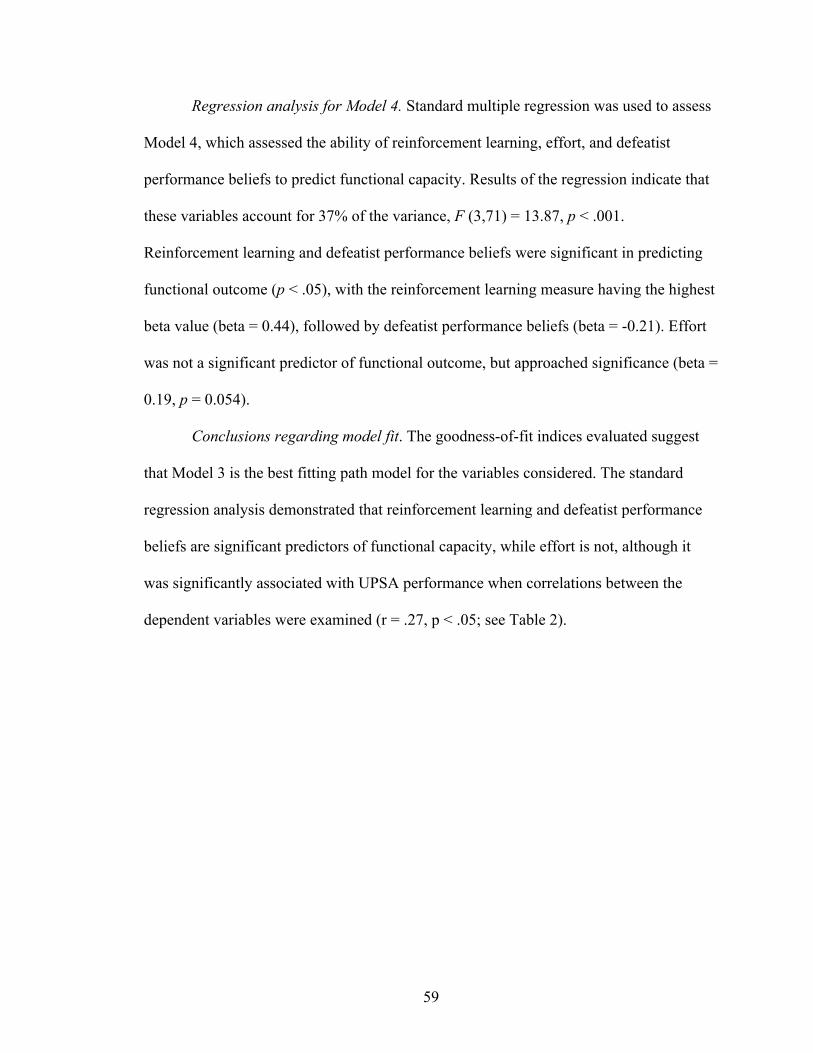
! 59
Regression analysis for Model 4. Standard multiple regression was used to assess
Model 4, which assessed the ability of reinforcement learning, effort, and defeatist
performance beliefs to predict functional capacity. Results of the regression indicate that
these variables account for 37% of the variance, F (3,71) = 13.87, p < .001.
Reinforcement learning and defeatist performance beliefs were significant in predicting
functional outcome (p < .05), with the reinforcement learning measure having the highest
beta value (beta = 0.44), followed by defeatist performance beliefs (beta = -0.21). Effort
was not a significant predictor of functional outcome, but approached significance (beta =
0.19, p = 0.054).
Conclusions regarding model fit. The goodness-of-fit indices evaluated suggest
that Model 3 is the best fitting path model for the variables considered. The standard
regression analysis demonstrated that reinforcement learning and defeatist performance
beliefs are significant predictors of functional capacity, while effort is not, although it
was significantly associated with UPSA performance when correlations between the
dependent variables were examined (r = .27, p < .05; see Table 2).

! 60
Table 10
Path Analysis Model Statistics
Model χ2 df p NFI CFI GFI AGFI RMSEA AIC
1 22.15 2 >0.001 0.52 0.50 0.89 .43 0.37 18.15
2 5.37 2 0.07 0.88 0.92 0.97 .83 0.15 1.37
3 1.03 1 0.31 0.98 1.00 0.99 .93 0.02 -0.98
Note. df = degrees of freedom; NFI = Normed Fit Index; CFI = Comparative Fit Index;
GFI = Goodness-of-fit Index; AGFI = Adjusted Goodness-of-fit Index; RMSEA = Root
Mean Squared root-mean squared error of approximation; AIC = Akaike Information
Criterion.

! 61
Figure 5
Model 1. Model Reflecting Direct Contributions of Reinforcement Learning and Effort on
Defeatist Performance Beliefs with Path Coefficients
Note. RL = Reinforcement Learning. DB = Defeatist Performance Beliefs. FC =
Functional Capacity.
Figure 6
Model 2. Model Reflecting Direct Contributions of Defeatist Performance Beliefs on
Reinforcement Learning and Effort with Path Coefficients
Note. RL = Reinforcement Learning. DB = Defeatist Performance Beliefs. FC =
Functional Capacity.
RL
Effort
DB
FC
RL
Effort
DB
FC
-.39
-.05
-.36
.20
.52
-.10
-.36
.14

! 62
Figure 7
Model 3. Complete Model Reflecting Direct Contributions of Defeatist Performance
Beliefs on Reinforcement Learning, Effort, and Functional Capacity with Path
Coefficients
!
!
!
!
Note. RL = Reinforcement Learning. DB = Defeatist Performance Beliefs. FC =
Functional Capacity.
Figure 8
Model 4. Standard Regression Model with Beta Coefficients
!
!
!
!
!
!
!
Note. RL = Reinforcement Learning. DB = Defeatist Performance Beliefs. FC =
Functional Capacity.
FC
DB
RL
Effort
-.10
-.36
.14
-.21
.19
.44
RL
Effort
DB
FC
.19
.44
-.10
-.36
-.21

! 63
CHAPTER 5
DISCUSSION
Some research has suggested that the global cognitive impairment seen in
individuals with schizophrenia may be attributable to decreased effort. This decreased
effort is not considered to be due to intentional poor performance, or malingering, but
rather it may be due to in part by impairments in midbrain dopaminergic brain regions
that are associated with effort and have been found to be affected in individuals with
schizophrenia. In addition, cognitive theories of schizophrenia suggest that individuals
experience defeatist performance beliefs about themselves and the environment. These
defeatist performance beliefs are associated with a combination of factors, including
cultural and internalized stigma and low self-esteem. Low self-efficacy, a component of
self-esteem, has been found to be associated with unemployment, poor functional
outcome and a lower quality of life (Corrigan et al., 2009; Vauth et al., 2007).
Individuals with mental illness that experience self-stigma and low self-efficacy may
think that they are unworthy or unable to succeed in basic life functions, such as living
independently. As a result, they may adopt an attitude that is consistent with the notion
“why try” (Corrigan et al., 2009), thus expending less effort and attaining less. Defeatist
performance beliefs in particular have been found to be a mediator between cognitive
deficits and functional outcome (Grant & Beck, 2008). Effort and reinforcement learning
are neurocognitive functions that have been increasingly studied in schizophrenia. They
are associated with similar midbrain dopaminergic brain regions, regions that are
impacted in individuals with schizophrenia. However, they have not been specifically
evaluated in relation to defeatist performance beliefs, but may be a key factor in the
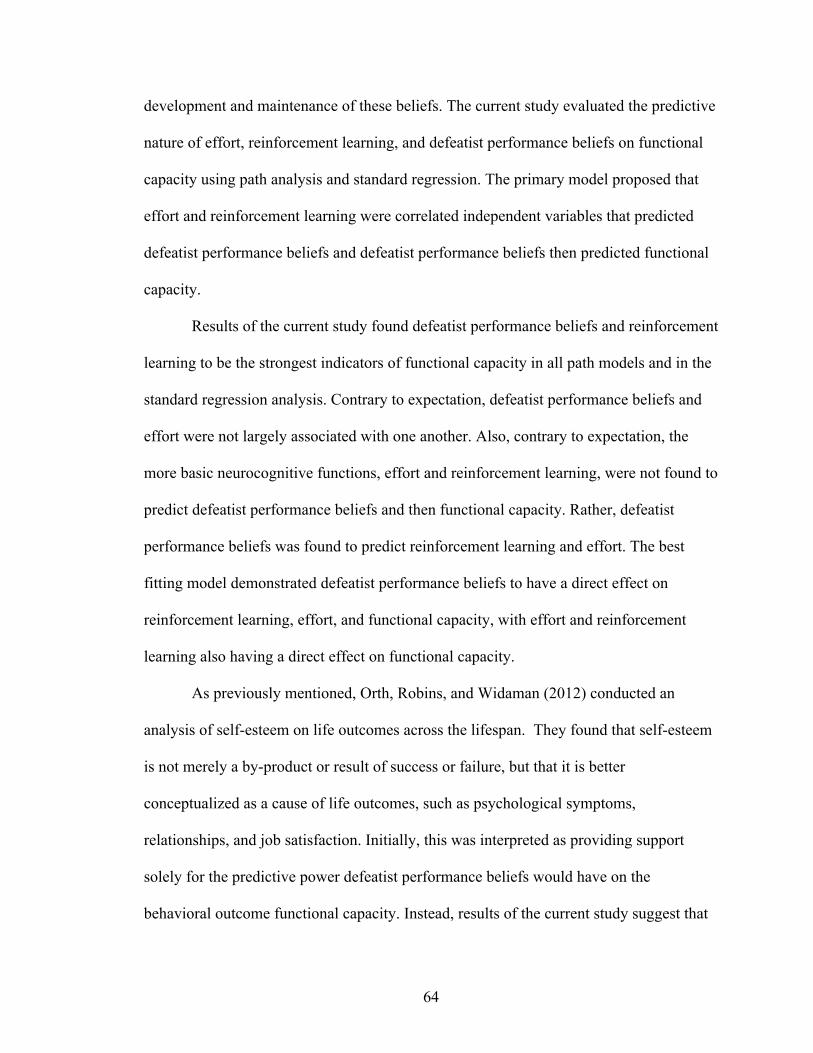
! 64
development and maintenance of these beliefs. The current study evaluated the predictive
nature of effort, reinforcement learning, and defeatist performance beliefs on functional
capacity using path analysis and standard regression. The primary model proposed that
effort and reinforcement learning were correlated independent variables that predicted
defeatist performance beliefs and defeatist performance beliefs then predicted functional
capacity.
Results of the current study found defeatist performance beliefs and reinforcement
learning to be the strongest indicators of functional capacity in all path models and in the
standard regression analysis. Contrary to expectation, defeatist performance beliefs and
effort were not largely associated with one another. Also, contrary to expectation, the
more basic neurocognitive functions, effort and reinforcement learning, were not found to
predict defeatist performance beliefs and then functional capacity. Rather, defeatist
performance beliefs was found to predict reinforcement learning and effort. The best
fitting model demonstrated defeatist performance beliefs to have a direct effect on
reinforcement learning, effort, and functional capacity, with effort and reinforcement
learning also having a direct effect on functional capacity.
As previously mentioned, Orth, Robins, and Widaman (2012) conducted an
analysis of self-esteem on life outcomes across the lifespan. They found that self-esteem
is not merely a by-product or result of success or failure, but that it is better
conceptualized as a cause of life outcomes, such as psychological symptoms,
relationships, and job satisfaction. Initially, this was interpreted as providing support
solely for the predictive power defeatist performance beliefs would have on the
behavioral outcome functional capacity. Instead, results of the current study suggest that

! 65
the causative influence of defeatist performance beliefs also applies to the neurocognitive
abilities of reinforcement learning and effort. Furthermore, the “why try” theory
(Corrigan et al., 2009) was initially interpreted as resulting in a circular effect between
effort and defeatist performance beliefs, with low effort contributing to poor functioning
and defeatist performance beliefs, with defeatist performance beliefs in turn contributing
to poor functioning and low effort. In contrast, defeatist performance beliefs and effort
were found to have a low association in the current study. The model that was found to
provide the best fit for the data actually found defeatist performance beliefs to predict
effort, but the model in which effort was predicting defeatist performance beliefs was not
supported.
On the opposite side of the ‘why try’ effect, empowerment (the opposite of low
self-efficacy) is an alternate reaction to stigma. Rather than accepting and acting on the
stigmatization of mental illness, some individuals become empowered by them and react
in a positive manner as if to disprove the stereotype. Empowerment has been found to be
associated with positive self-esteem and a higher quality of life. Self-efficacy, whether on
the negative end with defeatist performance beliefs or on the positive end with
empowerment, has been theorized to result in treatment adherence and goal attainment or
lack thereof (Corrigan et al., 2009). The current study found that defeatist performance
beliefs have a predictive impact on reinforcement learning and functional capacity,
supporting the notion that self-efficacy could lead to better outcome, possibly through
treatment adherence and goal attainment. Further research would be necessary to address
this issue specifically.
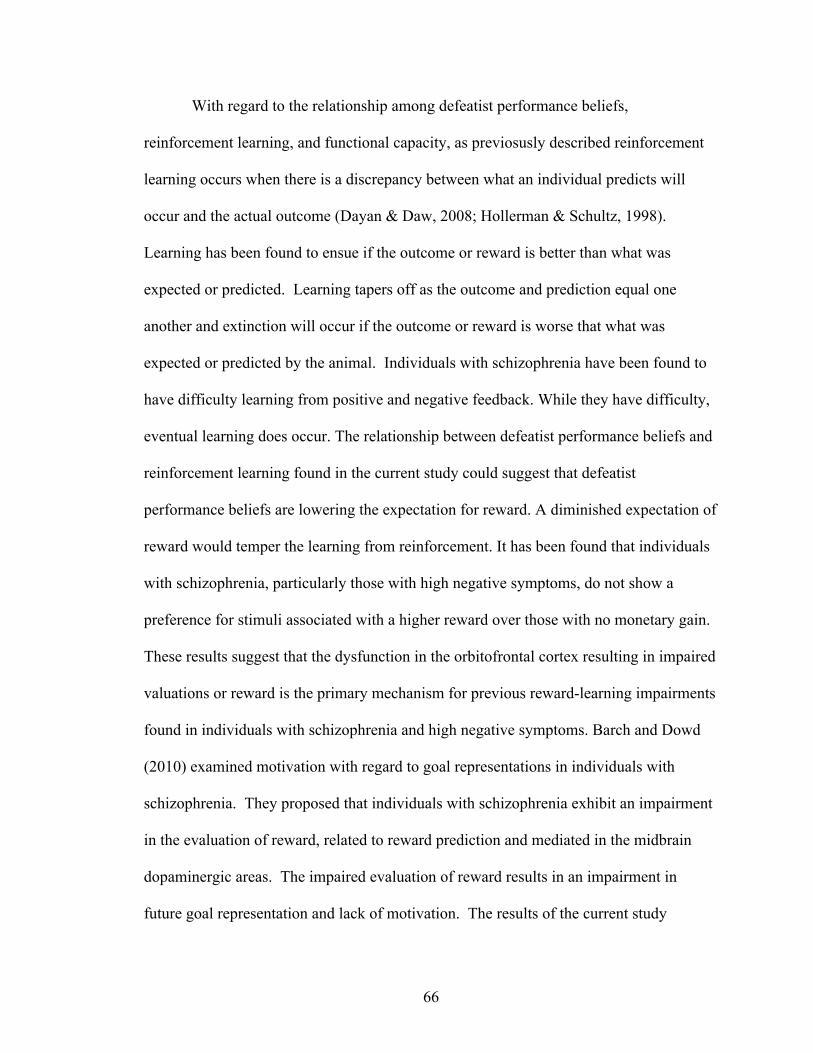
! 66
With regard to the relationship among defeatist performance beliefs,
reinforcement learning, and functional capacity, as previosusly described reinforcement
learning occurs when there is a discrepancy between what an individual predicts will
occur and the actual outcome (Dayan & Daw, 2008; Hollerman & Schultz, 1998).
Learning has been found to ensue if the outcome or reward is better than what was
expected or predicted. Learning tapers off as the outcome and prediction equal one
another and extinction will occur if the outcome or reward is worse that what was
expected or predicted by the animal. Individuals with schizophrenia have been found to
have difficulty learning from positive and negative feedback. While they have difficulty,
eventual learning does occur. The relationship between defeatist performance beliefs and
reinforcement learning found in the current study could suggest that defeatist
performance beliefs are lowering the expectation for reward. A diminished expectation of
reward would temper the learning from reinforcement. It has been found that individuals
with schizophrenia, particularly those with high negative symptoms, do not show a
preference for stimuli associated with a higher reward over those with no monetary gain.
These results suggest that the dysfunction in the orbitofrontal cortex resulting in impaired
valuations or reward is the primary mechanism for previous reward-learning impairments
found in individuals with schizophrenia and high negative symptoms. Barch and Dowd
(2010) examined motivation with regard to goal representations in individuals with
schizophrenia. They proposed that individuals with schizophrenia exhibit an impairment
in the evaluation of reward, related to reward prediction and mediated in the midbrain
dopaminergic areas. The impaired evaluation of reward results in an impairment in
future goal representation and lack of motivation. The results of the current study

! 67
support these findings and suggest that defeatist performance beliefs may be a factor
contributing to impaired reward evaluation and future goal representation. Efforts to
improve self-efficacy and lower defeatist performance beliefs could then improve ones
ability to learn from choices and experiences that result in positive or negative outcomes.
Doing so could result in more accurate appraisals of reward and outcome.
Negative self-appraisals and self-blame for illness has been found to be associated
with greater risk of relapse, or exacerbations of psychotic symptoms, in individuals with
schizophrenia (Gumley et al., 2006). Cognitive behavior therapy (CBT) has been found
to improve negative and positive symptoms of schizophrenia by focusing on negative
self-thought, which includes low self-esteem, defeatist performance beliefs, and fear of
negative appraisals (Gould et al., 2001; Rector & Beck, 2001). Utilizing CBT and other
intervention strategies aimed at defeatist performance beliefs and expectations for failure
may also benefit reinforcement learning and functional capacity. The current research
suggests that functional capacity could be improved by decreased defeatist performance
beliefs both directly and through improved reinforcement learning and to a lesser extent
effort.
Information is lacking on whether many performance-based measures of
functional ability truly measure real world independence (Moore, 2007). There are many
ways to evaluate functional ability, including self-report measures, observation, and
performance-based measures. The current study evaluated the impact of effort, defeatist
performance beliefs, and reinforcement learning on functional capacity (i.e. performance-
based functioning). It is possible that evaluating the predictive value of these variables on
functional outcome (i.e. self-reported real-world functional performance) may provide
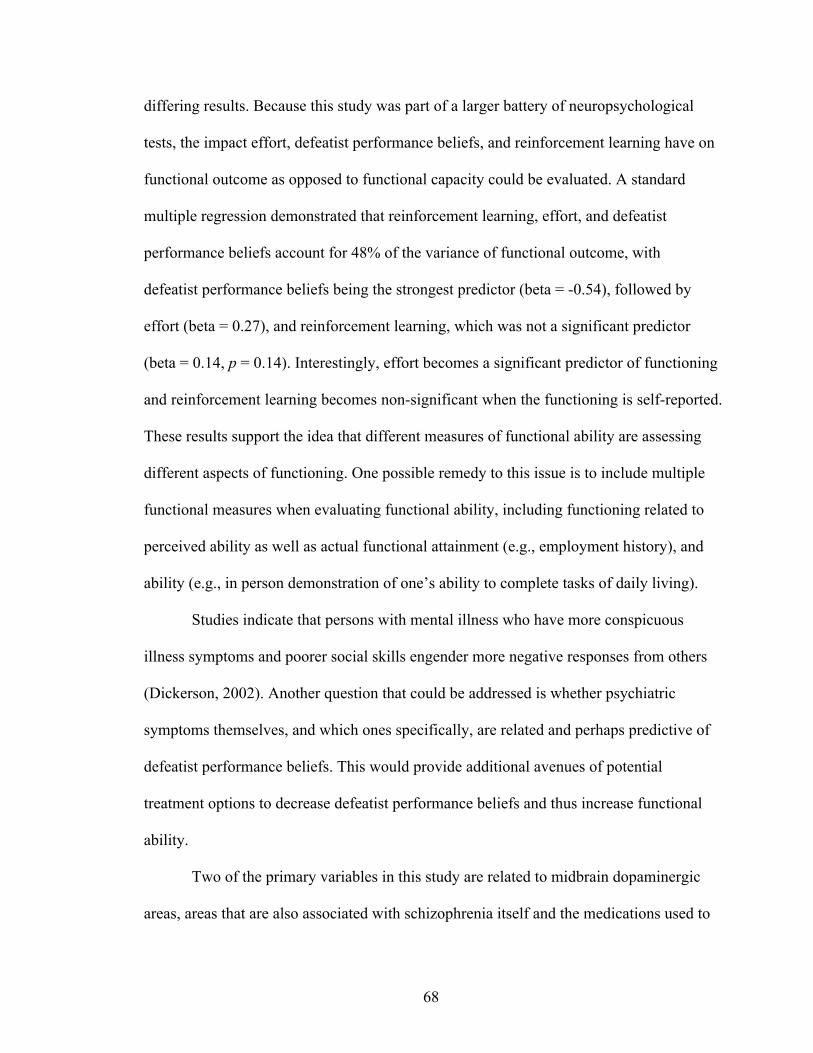
! 68
differing results. Because this study was part of a larger battery of neuropsychological
tests, the impact effort, defeatist performance beliefs, and reinforcement learning have on
functional outcome as opposed to functional capacity could be evaluated. A standard
multiple regression demonstrated that reinforcement learning, effort, and defeatist
performance beliefs account for 48% of the variance of functional outcome, with
defeatist performance beliefs being the strongest predictor (beta = -0.54), followed by
effort (beta = 0.27), and reinforcement learning, which was not a significant predictor
(beta = 0.14, p = 0.14). Interestingly, effort becomes a significant predictor of functioning
and reinforcement learning becomes non-significant when the functioning is self-reported.
These results support the idea that different measures of functional ability are assessing
different aspects of functioning. One possible remedy to this issue is to include multiple
functional measures when evaluating functional ability, including functioning related to
perceived ability as well as actual functional attainment (e.g., employment history), and
ability (e.g., in person demonstration of one’s ability to complete tasks of daily living).
Studies indicate that persons with mental illness who have more conspicuous
illness symptoms and poorer social skills engender more negative responses from others
(Dickerson, 2002). Another question that could be addressed is whether psychiatric
symptoms themselves, and which ones specifically, are related and perhaps predictive of
defeatist performance beliefs. This would provide additional avenues of potential
treatment options to decrease defeatist performance beliefs and thus increase functional
ability.
Two of the primary variables in this study are related to midbrain dopaminergic
areas, areas that are also associated with schizophrenia itself and the medications used to

! 69
treat schizophrenia. Not surprisingly, effort and reinforcement learning were correlated
with chlorpromazine equivalent dosage. The majority of participants with schizophrenia
in the current study were taking some form of antipsychotic medication, making any
causal effect of such medications on performance implausible. Future research could
examine these variables and their relationship with defeatist performance beliefs and
functional outcome in first-episode or drug naïve participants, or through experimental
designs allowing antipsychotic medication manipulation to further clarify the impact
antipsychotic medication is having on these areas.
The small number of variables examined through path analysis in the current
study restricted the number of possible paths that could be evaluated. Each model is
tested based on the models degrees of freedom, which is the number of distinct elements
in the covariance matrix minus the number of model parameters. Degrees of freedom
must be > 0 in order to be evaluated, if degrees of freedom = 0 then the model is
considered saturated and is unable to be analyzed. With only 4 variables composing the
covariance matrix, this limited the number of paths that could be drawn in specific
variable organizations. Future research could examine effort, reinforcement learning,
defeatist performance beliefs, and functioning using a variety of observed variables each,
rather than one measurement per variable. This would allow the examination of more
path models, and further determine the components that are most salient at predicting
functioning in each variable.
Because the path and regression analyses included both individuals with
schizophrenia and controls, the results are not unique to schizophrenia per say. We might
conclude that the path identified has explanatory power as to why individuals with
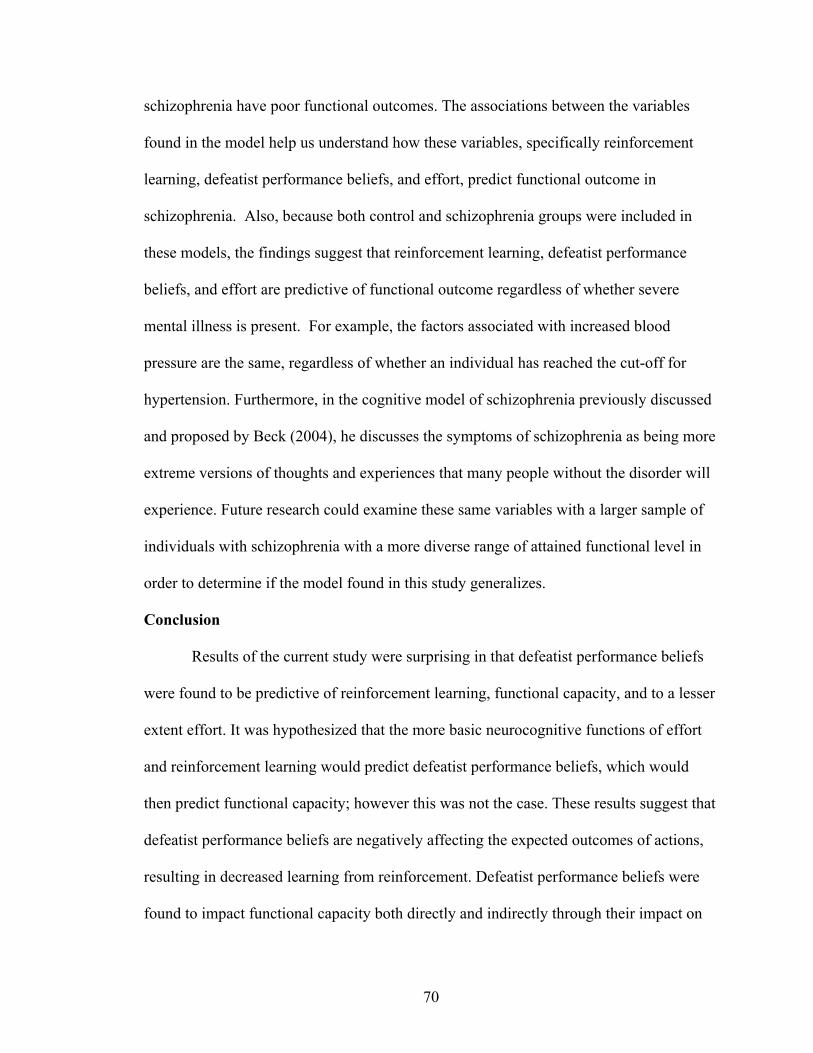
! 70
schizophrenia have poor functional outcomes. The associations between the variables
found in the model help us understand how these variables, specifically reinforcement
learning, defeatist performance beliefs, and effort, predict functional outcome in
schizophrenia. Also, because both control and schizophrenia groups were included in
these models, the findings suggest that reinforcement learning, defeatist performance
beliefs, and effort are predictive of functional outcome regardless of whether severe
mental illness is present. For example, the factors associated with increased blood
pressure are the same, regardless of whether an individual has reached the cut-off for
hypertension. Furthermore, in the cognitive model of schizophrenia previously discussed
and proposed by Beck (2004), he discusses the symptoms of schizophrenia as being more
extreme versions of thoughts and experiences that many people without the disorder will
experience. Future research could examine these same variables with a larger sample of
individuals with schizophrenia with a more diverse range of attained functional level in
order to determine if the model found in this study generalizes.
Conclusion
Results of the current study were surprising in that defeatist performance beliefs
were found to be predictive of reinforcement learning, functional capacity, and to a lesser
extent effort. It was hypothesized that the more basic neurocognitive functions of effort
and reinforcement learning would predict defeatist performance beliefs, which would
then predict functional capacity; however this was not the case. These results suggest that
defeatist performance beliefs are negatively affecting the expected outcomes of actions,
resulting in decreased learning from reinforcement. Defeatist performance beliefs were
found to impact functional capacity both directly and indirectly through their impact on

! 71
reinforcement learning and effort. While the results were not what was expected, they
provide important information as to the impact of self-esteem and self-efficacy and the
influence these beliefs have on cognitive and behavioral outcomes. Behavioral strategies
aimed at improving defeatist performance beliefs could in turn improve reinforcement
learning, effort, and functional capacity. Additionally, there is an atmosphere within the
health care community and the culture as a whole that depicts individuals with severe
mental illness as flawed and less capable of goal attainment and independent functioning.
This study further supports the potential causative influence such beliefs could be having
on actual performance and functioning. There seems to be a self-fulfilling prophecy in
that individuals with severe mental illness are told they will not lead a successful or
independent life, and these beliefs when adopted lead to reduced neurocognitive and
behavioral functioning. A continued change in the response health care providers and the
community give to individuals with schizophrenia, and likely severe mental illness as a
whole, aimed at increased hope for stability and independent functioning could also aid in
improved self-esteem and expectancies.

! 72
REFERENCES
Addington, D., Addington, J., & Schissel, B. (1990). A depression rating scale for
schizophrenics. Schizophrenia Research, 3, 247–251.
Allen, D. N., Frantom, L. V, Strauss, G. P., & van Kammen, D. P. (2005). Differential
patterns of premorbid academic and social deterioration in patients with
schizophrenia. Schizophrenia Research, 75(2-3), 389–97.
doi:10.1016/j.schres.2004.11.011
Andreasen, N. C. (1983). Scale for the Assessment of Negative Symptoms (SANS). Iowa
City: University of Iowa Press.
Andreasen, N. C. (1984). Scale for the Assessment of Positive Symptoms (SAPS). Iowa
City: University of Iowa Press.
Angermeyer, M. C., Beck, M., Dietrich, S., & Holzinger, A. (2004). The Stigma of
Mental Illness: Patients’ Anticipations and Experiences. International Journal of
Social Psychiatry, 50(2), 153–162. doi:10.1177/0020764004043115
Angermeyer, M. C., & Matschinger, H. (2004). The stereotype of schizophrenia and its
impact on discrimination against people with schizophrenia: results from a
representative survey in Germany. Schizophrenia Bulletin, 30(4), 1049–61.
Angermeyer, M. C., & Schulze, B. (2001). Reinforcing stereotypes: how the focus on
forensic cases in news reporting may influence public attitudes towards the mentally
ill. International Journal of Law and Psychiatry, 24(4-5), 469–86.
Avery, R., Startup, M., & Calabria, K. (2009). The role of effort, cognitive expectancy
appraisals and coping style in the maintenance of the negative symptoms of

! 73
schizophrenia. Psychiatry Research, 167(1-2), 36–46.
doi:10.1016/j.psychres.2008.04.016
Aylward, E., Walker, E., & Bettes, B. (1984). Intelligence in schizophrenia: meta-
analysis of the research. Schizophrenia Bulletin, 10(3), 430–59.
Barch, D. M., & Dowd, E. C. (2010). Goal representations and motivational drive in
schizophrenia: the role of prefrontal-striatal interactions. Schizophrenia Bulletin,
36(5), 919–34. doi:10.1093/schbul/sbq068
Beck, A. T. (2004). A Cognitive Model of Schizophrenia. Journal of Cognitive
Psychotherapy, 18(3), 281–288. doi:10.1891/jcop.18.3.281.65649
Beck, A. T., & Grant, P. M. (2008). Negative Self-Defeating Attitudes: Factors That
Influence Everyday Impairment in Individuals With Schizophrenia. American
Journal of Psychiatry, 165(6), 772–772. doi:10.1176/appi.ajp.2008.08020229
Bentall, R. P., Rowse, G., Rouse, G., Kinderman, P., Blackwood, N., Howard, R., …
Corcoran, R. (2008). Paranoid delusions in schizophrenia spectrum disorders and
depression: the transdiagnostic role of expectations of negative events and negative
self-esteem. The Journal of Nervous and Mental Disease, 196(5), 375–83.
doi:10.1097/NMD.0b013e31817108db
Blanchard, J. J., & Cohen, A. S. (2006). The structure of negative symptoms within
schizophrenia: implications for assessment. Schizophrenia Bulletin, 32(2), 238–45.
doi:10.1093/schbul/sbj013
Botvinick, M. M., Huffstetler, S., & McGuire, J. T. (2009). Effort discounting in human
nucleus accumbens. Cognitive, Affective & Behavioral Neuroscience, 9(1), 16–27.
doi:10.3758/CABN.9.1.16
! 74
Botvinick, M. M., & Rosen, Z. B. (2009). Anticipation of cognitive demand during
decision-making. Psychological Research, 73(6), 835–42. doi:10.1007/s00426-008-
0197-8
Cardno, A. G., Rijsdijk, F. V., Sham, P. C., Murray, R. M., & McGuffin, P. (2002). A
Twin Study of Genetic Relationships Between Psychotic Symptoms. American
Journal of Psychiatry, (April), 539–545.
Carter, C. S. (2007). Some rewarding insights into the cognitive and neurobiological
basis of negative symptoms in schizophrenia. Biological Psychiatry, 62(7), 709–10.
doi:10.1016/j.biopsych.2007.07.012
Caspi, A., Reichenberg, A., Weiser, M., Rabinowitz, J., Kaplan, Z., Knobler, H., …
Davidson, M. (2003). Cognitive performance in schizophrenia patients assessed
before and following the first psychotic episode. Schizophrenia Research, 65(2-3),
87–94. doi:10.1016/S0920-9964(03)00056-2
Cavelti, M., Kvrgic, S., Beck, E.-M., Rüsch, N., & Vauth, R. (2012). Self-stigma and its
relationship with insight, demoralization, and clinical outcome among people with
schizophrenia spectrum disorders. Comprehensive Psychiatry, 53(5), 468–79.
doi:10.1016/j.comppsych.2011.08.001
Corrigan, P. W., Larson, J. E., & Rüsch, N. (2009). Self-stigma and the “why try” effect:
impact on life goals and evidence-based practices. World Psychiatry!: Official
Journal of the World Psychiatric Association (WPA), 8(2), 75–81.
Couture, S. M., Blanchard, J. J., & Bennett, M. E. (2011). Negative expectancy appraisals
and defeatist performance beliefs and negative symptoms of schizophrenia.
Psychiatry Research, 189(1), 43–8. doi:10.1016/j.psychres.2011.05.032

! 75
Croxson, P. L., Walton, M. E., O’Reilly, J. X., Behrens, T. E. J., & Rushworth, M. F. S.
(2009). Effort-based cost-benefit valuation and the human brain. The Journal of
Neuroscience!: The Official Journal of the Society for Neuroscience, 29(14), 4531–
41. doi:10.1523/JNEUROSCI.4515-08.2009
Dayan, P., & Daw, N. D. (2008). Decision theory, reinforcement learning, and the brain.
Cognitive, Affective & Behavioral Neuroscience, 8(4), 429–53.
doi:10.3758/CABN.8.4.429
Dickerson, F. B., Sommerville, J., Origoni, A. E., Ringel, N. B., & Parente, F. (2002).
Experiences of stigma among outpatients with schizophrenia. Schizophrenia
Bulletin, 28(1), 143–55.
Eisenberger, R. (1992). Learned industriousness. Psychological Review, 99(2), 248–267.
Floresco, S. B., Tse, M. T. L., & Ghods-Sharifi, S. (2008). Dopaminergic and
glutamatergic regulation of effort- and delay-based decision making.
Neuropsychopharmacology!: Official Publication of the American College of
Neuropsychopharmacology, 33(8), 1966–79. doi:10.1038/sj.npp.1301565
Frank, M. J., Seeberger, L. C., & Reilly, R. C. O. (2004). By Carrot or by Stick":
Cognitive Reinforcement Learning in Parkinsonism, (December), 1940–1943.
Frantom, L. V, Allen, D. N., & Cross, C. L. (2008). Neurocognitive endophenotypes for
bipolar disorder. Bipolar Disorders, 10(3), 387–99. doi:10.1111/j.1399-
5618.2007.00529.x
Fuller, R., Nopoulos, P., Arndt, S., O’Leary, D., Ho, B.-C., & Andreasen, N. C. (2002).
Longitudinal assessment of premorbid cognitive functioning in patients with
! 76
schizophrenia through examination of standardized scholastic test performance. The
American Journal of Psychiatry, 159(7), 1183–9.
Gold, J. M., Waltz, J. A., Matveeva, T. M., Kasanova, Z., Strauss, G. P., Herbener, E. S.,
… Frank, M. J. (2012). Negative Symptoms and the Failure to Represent the
Expected Reward Value of Actions, 69(2), 129–138.
Gorissen, M., Sanz, J. C., & Schmand, B. (2005). Effort and cognition in schizophrenia
patients. Schizophrenia Research, 78(2-3), 199–208.
doi:10.1016/j.schres.2005.02.016
Gould, R. A., Mueser, K. T., Bolton, E., Mays, V., & Goff, D. (2001). Cognitive therapy
for psychosis in schizophrenia: an effect size analysis. Schizophrenia Research,
48(2-3), 335–342.
Grant, P. M., & Beck, a. T. (2008). Defeatist Beliefs as a Mediator of Cognitive
Impairment, Negative Symptoms, and Functioning in Schizophrenia. Schizophrenia
Bulletin, 35(4), 798–806. doi:10.1093/schbul/sbn008
Gumley, A., Karatzias, A., Power, K., Reilly, J., McNay, L., & O’Grady, M. (2006).
Early intervention for relapse in schizophrenia: Impact of cognitive behavioural
therapy on negative beliefs about psychosis and self-esteem. British Journal of
Clinical Psychology, 45(2), 247–260. doi:10.1348/014466505X49925
Gunnell, D. (2002). Associations between premorbid intellectual performance, early-life
exposures and early-onset schizophrenia: Cohort study. The British Journal of
Psychiatry, 181(4), 298–305. doi:10.1192/bjp.181.4.298
Hedman, A. M., van Haren, N. E. M., van Baal, C. G. M., Kahn, R. S., & Hulshoff Pol,
H. E. (2013). IQ change over time in schizophrenia and healthy individuals: a meta-

! 77
analysis. Schizophrenia Research, 146(1-3), 201–8.
doi:10.1016/j.schres.2013.01.027
Hollerman, J. R., & Schultz, W. (1998). Dopamine neurons report an error in the
temporal prediction of reward during learning. Nature Neuroscience, 1(4), 304–9.
doi:10.1038/1124
Horan, W. P., Rassovsky, Y., Kern, R. S., Lee, J., Wynn, J. K., & Green, M. F. (2010).
Further support for the role of dysfunctional attitudes in models of real-world
functioning in schizophrenia. Journal of Psychiatric Research, 44(8), 499–505.
doi:10.1016/j.jpsychires.2009.11.001
Hughes, C., Kumari, V., Das, M., Zachariah, E., Ettinger, U., Sumich, a, & Sharma, T.
(2005). Cognitive functioning in siblings discordant for schizophrenia. Acta
Psychiatrica Scandinavica, 111(3), 185–92. doi:10.1111/j.1600-0447.2004.00392.x
Kapur, S., Mizrahi, R., & Li, M. (2005). From dopamine to salience to psychosis--linking
biology, pharmacology and phenomenology of psychosis. Schizophrenia Research,
79(1), 59–68. doi:10.1016/j.schres.2005.01.003
Kirkpatrick, B., Strauss, G. P., Nguyen, L., Fischer, B. a, Daniel, D. G., Cienfuegos, A.,
& Marder, S. R. (2011). The brief negative symptom scale: psychometric properties.
Schizophrenia Bulletin, 37(2), 300–5. doi:10.1093/schbul/sbq059
Kool, W., McGuire, J. T., Rosen, Z. B., & Botvinick, M. M. (2010). Decision making and
the avoidance of cognitive demand. Journal of Experimental Psychology. General,
139(4), 665–82. doi:10.1037/a0020198

! 78
Lafargue, G., & Franck, N. (2009). Effort awareness and sense of volition in
schizophrenia. Consciousness and Cognition, 18(1), 277–89.
doi:10.1016/j.concog.2008.05.004
Link, B. G., Struening, E. L., Neese-Todd, S., Asmussen, S., & Phelan, J. C. (2001). The
Consequences of Stigma for the Self-Esteem of People With Mental Illnesses.
Psychiatric Services, 52(12), 1621–1626. doi:10.1176/appi.ps.52.12.1621
Long, J. D., & Brekke, J. S. (1999). Longitudinal factor structure of the Brief Psychiatric
Rating Scale in schizophrenia. Psychological Assessment, 11(4), 498–506.
doi:10.1037//1040-3590.11.4.498
Lysaker, P. H., Tsai, J., Yanos, P., & Roe, D. (2008). Associations of multiple domains of
self-esteem with four dimensions of stigma in schizophrenia. Schizophrenia
Research, 98(1-3), 194–200. doi:10.1016/j.schres.2007.09.035
MacDonald, A. W., & Schulz, S. C. (2009). What we know: findings that every theory of
schizophrenia should explain. Schizophrenia Bulletin, 35(3), 493–508.
doi:10.1093/schbul/sbp017
Merriam-Webster. (2012). Merriam-Webster Online Dictionary. MerriamWebster Online
Dictionary. Merriam-Webster Online Dictionary. Retrieved from
http://www.merriam-webster.com/dictionary/effort
Montague, P. R., Hyman, S. E., & Cohen, J. D. (2004). Computational roles for
dopamine in behavioural control, 431(October).
Mueser, K. T., Curran, P. J., & McHugo, G. J. (1997). Factor Structure of the Brief
Psychiatric Rating Scale in Schizophrenia. Psychological Assessment, 9(3), 196–
204. doi:doi:10.1037/1040-3590.9.3.196

! 79
Orth, U., Robins, R. W., & Widaman, K. F. (2012). Life-span development of self-esteem
and its effects on important life outcomes. Journal of Personality and Social
Psychology, 102(6), 1271–88. doi:10.1037/a0025558
Overall, J. E., & Gorham, D. R. (1962). The Brief Psychiatric Rating Scale.
Psychological Reports, 10, 799–812.
Park, S. G., Bennett, M. E., Couture, S. M., & Blanchard, J. J. (2012). Internalized stigma
in schizophrenia: Relations with dysfunctional attitudes, symptoms, and quality of
life. Psychiatry Research, 1–5. doi:10.1016/j.psychres.2012.08.040
Patterson, T. L., Goldman, S., McKibbin, C. L., Hughs, T., & Jeste, D. V. (2001). UCSD
Performance-Based Skills Assessment: development of a new measure of everyday
functioning for severely mentally ill adults. Schizophrenia Bulletin, 27(2), 235–45.
Prentice, K. J., Gold, J. M., & Buchanan, R. W. (2008). The Wisconsin Card Sorting
impairment in schizophrenia is evident in the first four trials. Schizophrenia
Research, 106(1), 81–7. doi:10.1016/j.schres.2007.07.015
Rector, N. A., & Beck, A. T. (2001). Cognitive behavioral therapy for schizophrenia: an
empirical review. The Journal of Nervous and Mental Disease, 189, 278–287.
Reichenberg, A., Weiser, M., Rabinowitz, J., Caspi, A., Schmeidler, J., Mark, M., …
Davidson, M. (2002). A Population-Based Cohort Study of Premorbid Intellectual,
Language, and Behavioral Functioning in Patients with Schizophrenia,
Schizoaffective Disorder, and Nonpsychotic Bipolar Disorder. American Journal of
Psychiatry, (159), 2027–2035.

! 80
Ringe, W. K., Saine, K. C., Lacritz, L. H., Hynan, L. S., & Cullum, C. M. (2002). Dyadic
Short Forms of the Wechsler Adult Intelligence Scale-III. Assessment, 9(3), 254–
260. doi:10.1177/1073191102009003004
Savalei, V., & Bentler, P. M. (2006). Structural equation modeling. In R. Grover & M.
Vriens (Eds.), The handbook of marketing research: Uses, misuses, and future
advances (pp. 330–364). Thousand Oaks, CA: Sage Publications, Inc.
Schoenberg, M. R., Scott, J. G., Duff, K., & Adams, R. L. (2010). Estimation of WAIS-
III Intelligence from Combined Performance and Demographic Variables":
Development of the OPIE-3. The Clinical Neuropsychologist, 16(4), 426–438.
Schultz, W. (2002). Getting Formal with Dopamine and Reward. Neuron, 36(2), 241–
263. doi:10.1016/S0896-6273(02)00967-4
Strauss, G. P., Allen, D. N., Miski, P., Buchanan, R. W., Kirkpatrick, B., & Carpenter,
W. T. (2012). Differential patterns of premorbid social and academic deterioration in
deficit and nondeficit schizophrenia. Schizophrenia Research, 135(1-3), 134–8.
doi:10.1016/j.schres.2011.11.007
Strauss, G. P., Frank, M. J., Waltz, J. a., Kasanova, Z., Herbener, E. S., & Gold, J. M.
(2011). Deficits in Positive Reinforcement Learning and Uncertainty-Driven
Exploration Are Associated with Distinct Aspects of Negative Symptoms in
Schizophrenia. Biological Psychiatry, 69(5), 424–431.
doi:10.1016/j.biopsych.2010.10.015
Strauss, G. P., Hong, L. E., Keller, W. R., Buchanan, R. W., Gold, J. M., Fischer, B. A.,
… Kirkpatrick, B. (n.d.). Factor Structure of the Brief Negative Symptom Scale.
Schizophrenia Research.
! 81
Suhail, K., & Cochrane, R. (2002). Effect of Culture and Environment on the
Phenomenology of Delusions and Hallucinations. International Journal of Social
Psychiatry, 48(2), 126–138. doi:10.1177/002076402128783181
Tabachnick, B. G., & Fidell, L. S. (2012). Using Multivariate Statistics (6th ed.).
Pearson.
Treadway, M. T., Buckholtz, J. W., Schwartzman, A. N., Lambert, W. E., & Zald, D. H.
(2009). Worth the “EEfRT”? The effort expenditure for rewards task as an objective
measure of motivation and anhedonia. PloS One, 4(8), e6598.
doi:10.1371/journal.pone.0006598
Van Oel, C. J., Sitskoorn, M. M., Cremer, M. P. M., & Kahn, R. S. (2002). School
performance as a premorbid marker for schizophrenia: a twin study. Schizophrenia
Bulletin, 28(3), 401–14.
Vauth, R., Kleim, B., Wirtz, M., & Corrigan, P. W. (2007). Self-efficacy and
empowerment as outcomes of self-stigmatizing and coping in schizophrenia.
Psychiatry Research, 150(1), 71–80. doi:10.1016/j.psychres.2006.07.005
Vracotas, N., Iyer, S. N., Joober, R., & Malla, a. (2010). The role of self-esteem for
outcome in first-episode psychosis. International Journal of Social Psychiatry,
58(1), 41–46. doi:10.1177/0020764010382698
Waltz, J. a., Frank, M. J., Robinson, B. M., & Gold, J. M. (2007). Selective
Reinforcement Learning Deficits in Schizophrenia Support Predictions from
Computational Models of Striatal-Cortical Dysfunction. Biological Psychiatry,
62(7), 756–764. doi:10.1016/j.biopsych.2006.09.042

! 82
Wechsler, D. (1997). Wechsler Adult Intelligence Scale, 3rd ed. Administration and
Scoring Manual. San Antonio, TX: Psychological Corporation.
Weissman, A. (1978). The Dysfunctional Attitudes Scale: a Validation Study.
Philadelphia, PA: University of Pennsylvania.
Woods, S. W. (2003). Chlorpromazine equivalent doses for the newer atypical
antipsychotics. The Journal of Clinical Psychiatry, 64(6), 663–667.
Wright, E. R., Gronfein, W. P., & Owens, T. J. (2000). Deinstitutionalization, social
rejection, and the self-esteem of former mental patients. Journal of Health and
Social Behavior, 41(1), 68–90.
Zimmerman, M., Coryell, W., Corenthal, C., & Wilson, S. (1986). Dysfunctional
attitudes and attribution style in healthy controls and patients with schizophrenia,
psychotic depression, and nonpsychotic depression. Journal of Abnormal
Psychology, 95(4), 403–405. doi:10.1037//0021-843X.95.4.403
83
VITA
SALLY J. VOGEL (Formerly Sally J. Barney)
EDUCATION
Doctor of Philosophy Anticipated Graduation May 2015 University of Nevada, Las Vegas, Las Vegas, NV Advisor: Daniel N. Allen, Ph.D. APA-Accredited Clinical Psychology Program Neuropsychology Track Dissertation: Functional Capacity in Schizophrenia: Relationship Among Reinforcement Learning, Effort, and Defeatist Performance Beliefs Defended May 14, 2014 Clinical Internship July 2014-July 2015 University of Oklahoma Health Sciences Center, Oklahoma City, OK APA-Accredited Clinical Internship Neuropsychology Track Master of Arts in Clinical Psychology May 2012 University of Nevada, Las Vegas, Las Vegas, NV Advisor: Daniel N. Allen, Ph.D. Thesis: Using Negative Feedback to Guide Behavior: Impairments on the First 4 Cards of the Wisconsin Card Sorting Test Relates to Psychosis Bachelor of Arts May 2009 University of Nevada, Las Vegas, Las Vegas, NV Summa Cum Laude with Honors Major: Psychology Minor: Biology Honors Thesis: Neurocognitive Deficits in Bipolar Disorder with Co-occurring Borderline Symptomatology Advisor: Daniel N. Allen, Ph.D.
CLINICAL TRAINING
VA Southern Nevada Healthcare System (VASNHS) August 2013–June 2014 Las Vegas, NV Supervisor: Robert F. Mirabella, Ph.D. • Doctoral Practicum Student: Cognitive Processing Therapy with veterans experiencing
Post Traumatic Stress Disorder, traumas include combat trauma and military sexual trauma. A weekly support group for female veterans co-facilitated with Diane Sakal-Gutierrez, LCSW.
• Supervision and Didactics: Weekly individual supervision meetings and case conferences are held. Training in and supervision of diagnostic interviews, treatment planning, and session notes within the CPRS medical notes system.
Lou Ruvo, Center for Brain Health, Cleveland Clinic June 2012–June 2013 Las Vegas, NV Supervisor: Sarah Banks, Ph.D., ABPP/CN • Doctoral Practicum Student: Neuropsychological assessments using a flexible battery with
individuals ranging from 25 to 97 in an outpatient medical setting. Further responsibilities include scoring, interpretation and partial interviewing and report writing. Commonly presented patient diagnoses include neurodegenerative disorders, specifically dementia and

84
movement disorders. A weekly support group for caregivers of individuals with memory problems co-facilitated with Donna Munic-Miller, PhD.
• Supervision and Didactics: Weekly individual supervision meetings were held in addition to weekly case conferences with only neuropsychology supervisors and students, as well as case conferences or grand rounds with neurology, physical therapy and/or social work.
• After the formal practicum training, I was hired to continue conducting neuropsychological assessments, scoring, and partial report writing on an as needed basis.
Center for Applied Neuroscience June 2011–June 2012 Las Vegas, NV Supervisor: Thomas F. Kinsora, Ph.D. • Doctoral Practicum Student: Neuropsychological clinical and forensic assessments using a
flexible battery with individuals ranging from 7 to 79 in an outpatient private practice setting or the Clark County Detention Center. Further responsibilities include scoring, interpretation and partial interviewing and report writing. Commonly presented patient diagnoses include cognitive disorders of varying etiologies, affective disorders, learning disabilities, and TBI.
• Supervision and Didactics: Weekly individual and group supervision meetings were held. Also attended weekly practicum seminars on campus, which include didactic, group supervision and case conference components.
• After the formal practicum training, I was hired to continue conducting neuropsychological assessments, scoring, and partial report writing for approx. one client per month.
Center for Individual, Couple, and Family Counseling (CICFC) August 2010–August 2011 University of Nevada, Las Vegas Supervisor: Christopher A. Kearney, Ph.D. August-May Nellie Mihelic, M.A. May-August • Doctoral Practicum Student: Provided long-term individual therapy to a caseload of
approximately 7-10 clients per week in an outpatient University affiliated mental health clinic. Diagnoses included personality disorders, affective disorders, anxiety disorders and adjustment disorders. Primary theoretical approach used from August to May was CBT under the supervision of Christopher Kearney, PhD. The final three months of therapy was primarily Interpersonal Process under the supervision of Nellie Mihelic, an advanced doctoral student, supervisor in training.
• Supervision and Didactics: Supervision consisted of weekly individual and group meetings with video tape review as well as weekly practicum seminars, which included didactic, group supervision, and case conference components.
Psychological Assessment & Testing Clinic August 2010–September 2011 University of Nevada, Las Vegas Supervisor: Michelle G. Carro, Ph.D. • Doctoral Practicum Student: Neuropsychological and psychoeducational assessments using
a flexible battery approach with adults and children referred from the community and the University Disability Resource Center in an outpatient University affiliated mental health clinic. Further responsibilities included interviewing, scoring, interpretation, report writing, and provision of feedback to clients.
• Supervision: Supervision included reviewing cases, joint determination of assessment battery and interpretation of results, report revisions, and discussion of feedback.
PUBLICATIONS AND PRESENTATIONS
Refereed Articles Published or In Press
Vogel, S.J., Strauss, G.S., & Allen, D.N., (In Press). Using negative feedback to guide behavior: Impairments on the first 4 cards of the Wisconsin Card Sorting Test predicts negative

85
symptoms of schizophrenia. Schizophrenia Research.
Barney, S.J., Allen, D.N., Thaler, N.S., Park, B.S., Strauss, G.P., & Mayfield, J. (2011). Neuropsychological and behavioral measures of attention assess discrete constructs in children with traumatic brain injury. The Clinical Neuropsychologist, 25 (7), 1145-1157.
Allen, D.N., Thaler, N.S., Ringdahl, E.N., Barney, S.J., & Mayfield, J. (2011). Comprehensive trail making test performance in children and adolescents with traumatic brain injury. Psychological Assessment, doi:10.1037/a0026263
Thaler, N.S., Barney, S.J., Reynolds, C.R., Mayfield, J., Allen, D.N. (2011). Differential sensitivity of TOMAL subtests and index scores to pediatric traumatic brain injury. Applied Neuropsychology, 18(3), 168-178.
Park, B.S., Allen, D.N., Barney, S.J., Ringdahl, E.N., & Mayfield, J. (2009). Structure of attention in children with traumatic brain injury. Applied Neuropsychology, 16(1), 1-10.
Manuscripts/Book Chapters Submitted
Strauss, G.P., Thaler, N., Matveeva, T., Vogel, S., Sutton, G., Lee, B., Allen, D.N. (submitted). Predicting psychosis across diagnostic boundaries: Behavioral and computational modeling evidence for impaired reinforcement learning in schizophrenia and bipolar disorder with a history of psychosis. Biological Psychiatry.
Barney, S.J. & Allen, D.N., (submitted). Connor’s Continuous Performance Test. In Cecil Reynolds, R Kamphaus, & C DiStefano (Eds), Encyclopedia of Psychological Testing. Oxford University Press: New York.
Vogel, S.J. & Allen, D.N. (submitted). Assessing substance related disorders in Asian Americans. In LT Benuto, N Thaler & BD Leany (Eds.), Guide to Psychological Assessment with Asian Americans. New York, NY: Springer Publishing.
Presentations and Published Abstracts
* Denotes presentation has a corresponding published abstract.
Vogel, S.J., Banks, S.J., Miller, J.B. (2014). Factor analysis and construct validity of the Montreal Cognitive Assessment: concordance with standard neuropsychological measures. The Annual Alzheimer’s Association International Conference, July 12-17, Copenhagen, Denmark.
*Lee, B.G., Vogel, S.J., Sisk, S.J., Yao, J.K., van Kammen, D.P., & Allen, D.N. (2014). The effects of dopamine antagonism on reward learning in schizophrenia. The 34th Annual Conference National Academy of Neuropsychology, November 12 - 15, Fajardo, Puerto Rico.
*Palisoc B.M., Vogel S.J., Ringdahl E.N., Zenisek R., Allen D.N. (2014). The relationship between negative symptoms and functional outcome in schizophrenia and bipolar disorder. The 34th Annual Conference National Academy of Neuropsychology, November 12 - 15, Fajardo, Puerto Rico.
*Ciobanu C, Vogel S.J., Cooper L., Hughes C., Allen D.N. (2014). Performance on a novel attention measure, the Search Identification Task, in Schizophrenia. The 34th Annual Conference National Academy of Neuropsychology, November 12 - 15, Fajardo, Puerto Rico.
Dadis, F., Vogel, S.J., Lee, B.G., Mayfield, J., & Allen, D.N. (2014). The Delis-Kaplan Trail Making Test (D-KEFS) is sensitive to injury and recovery in children with brain injury.

86
The 94th Annual Western Psychological Association Conference, May, Portland, Oregon
Cooper, L.J., Call, E.T., Vogel, S.J., & Allen, D.N. (2014). Examining the validity of the Halstead Category Test-Adult Computer Version. The 94th Annual Western Psychological Association Conference, May, Portland, Oregon
Ciobanu, C, Vogel, S.J., Sisk, S. & Allen, D.N. (2014). Test-retest Reliability and Practice Effects of the Original and Computer Versions of the Halstead Category Test. The 94th Annual Western Psychological Association Conference, May, Portland, Oregon
*Vogel, S.J., Ringdahl, E.N., Freeman, A., Dadis, F., & Allen, D.N. (2013). Effort expenditure is related to every day functioning and psychiatric symptomatology. The 33rd Annual Conference National Academy of Neuropsychology, October 16-19, San Diego, CA.
*Cooper, L., Allen, D.N., Vogel, S.J., Ciabanu, C., & Woolerey, H., (2013). Examining the factors of the Halstead Category Test. The 33rd Annual Conference National Academy of Neuropsychology, October 16-19, San Diego, CA.
*Ringdahl, E.N., Vogel, S.J., Freeman, A.I., Call, E. T., Allen, D.N. (2013). Impaired Higher-order Social Perception Skills in Psychotic and Affective Disorders. The 33rd Annual Conference National Academy of Neuropsychology, October 16-19, San Diego, CA. (Poster award)
*Sisk SJ, Ringdahl EN, Vogel SJ, Freeman AI, Allen DN (2013) Social perception skills predict functional outcome in bipolar disorder and schizophrenia. The 33rd Annual Conference National Academy of Neuropsychology, October 16-19, San Diego, CA.
*Verbiest, R., Ringdahl, E.N., Thaler, N.S., Sutton, G.P, Vogel, S.J., Reyes, A., & Allen, D.N. (2013). Basic auditory perception deficits are related to impaired perception of sarcasm. The 33rd Annual Conference National Academy of Neuropsychology, October 16-19, San Diego, CA.
*Zink, D, Barney, S, Gilbert, G, & Allen, D. (2013). Factor Structure of the Search Identification Task (SIT): A Novel Measure of Attention and Working Memory. The 33rd Annual Conference National Academy of Neuropsychology, October 16-19, San Diego, CA.
Vogel, S.J., Ringdahl, E.N. & Allen, D.N. (2013). Presentation at the Graduate and Professional Student Research Fair, Las Vegas, NV.
*Barney, S., Thaler, N., Sutton, G., Strauss, G., & Allen D. (2012). Reward Learning Performance Predicts Functional Ability. The 32nd Annual Conference National Academy of Neuropsychology, October, Nashville, TN.
Lee, B.G., Barney, S.J., Catalano, L.T., Ringdahl, E.N., Vertinski, M., Adams, J.L., Shugarman, Y.Y., Snyder, J.S., Allen, D.N., Strauss, G.P. (2012). Anhedonia is Associated with Impaired Long-Term Memory for Positive Emotional Stimuli in Individuals with Schizophrenia. The Society for Research in Psychopathology Annual Conference, October, Ann Arbor, MI.
Vertinski, M., Allen, D., Thaler, N., Heisler, D., Park B., Barney, S. (2012). Construct Validity of the Search Identification Task. Poster presented at the Graduate Student Research Fair, Las Vegas, NV. (Poster Award).
Ramage, E.M., Barney, S.J., Flores, A., Klimas, N., Vertinski, M., Ringdahl, E.N., Sutton, G.P., Allen, D.N, & Snyder, J.S. (2012). Concurrent Sound Segregation Impairments in schizophrenia. The Society of Biological Psychiatry Annual Conference, Philadelphia, PA.

87
*Barney, S.J., Umuhoza, D., Strauss, G.P., Knatz-Bello, D., Allen, D.N. (2011). Negative Reinforcement Learning: The first 4 cards of the WCST relates to psychosis. The 31st Annual Conference National Academy of Neuropsychology, November, Marco Island, FL.
*Vertinski, M., Allen, D., Thaler, N., Heisler, D., Park, B., Barney, S. (2011). Construct Validity of the Search Identification Task (SIT). The 31st Annual Conference National Academy of Neuropsychology, November, Marco Island, FL.
Heisler, D.L., Umuhoza, D., Ringdahl, E.N., Barney, S.J., Thaler, N.S.,& Allen, D.N. (2011). Psychometric properties of a new measure of attention and working memory. The 91st Annual Convention of the Western Psychological Association, April, Los Angeles, CA.
Hart, J.S., Locasci, T., Hadland, C., Umuhoza, D., Turner, A., Barney, S.J., Thaler, N.S., Mayfield, J., & Allen, D.N. (2011). Neuropsychological and behavioral measures in children with traumatic brain injury. The 91st Annual Convention of the Western Psychological Association, April, Los Angeles, CA.
*Boucher, J.R., Barney, S.J., Mayfield, J., Allen, D.N. (2011). Trail making tests: Comparing versions in children with TBI. The 3rd Annual American College of Professional Neuropsychology Conference, March, Las Vegas, NV.
*Terranova, J. Barney, S.J., Mayfield, J., Allen, D.N. (2011). Construct validity of the Comprehensive Trail Making Test in children with traumatic brain injury. The 3rd Annual American College of Professional Neuropsychology Conference, March, Las Vegas, NV.
*Barney, S.J., Allen, D.N., Stolberg, P.C., Mayfield, J. (2010). Construct Validity of Reynolds Intellectual Assessment Scales (RIAS) in Brain Injured Children. Poster and Platform Session presented at the 30th Annual Conference National Academy of Neuropsychology, October, Vancouver, Canada.
*Sutton, G.P., Ringdahl, E.N., Thaler, N.S., Barney, S.J., Mayfield, J., Pinegar, J., Allen, D.N. (2010, October). Differences in Executive Function Profiles in Normal Children and those with Traumatic Brain Injury. The 30th Annual Conference National Academy of Neuropsychology, October, Vancouver, Canada.
*Weintraub, D.M., Sutton, G.P., Ramage, E., Pasinski, A., Ringdahl, E.N., Barney, S., Allen, D.N., and Snyder, J.S. (2010). Auditory stream segregation in schizophrenia. The Society of Biological Psychiatry 65th Annual Meeting, New Orleans, LA. Biological Psychiatry, 67(9), 156.
Barney, S.J., Strauss, G.P., Garcia, A.E., Sanders, L.J., Allen, D.N. (2010, August). The First Ten Cards of the WCST: Comparing Bipolar and Schizophrenia. The 118th annual meeting of the American Psychological Association, August, San Diego, CA.
*Barney S.J., Pinegar J.L., Thaler N.S., McMurray J.C., Mayfield J., Allen D.N. (2010, February). Differential Impairment of Attention Component Processes in Children with TBI and ADHD. The 2nd Annual American College of Professional Neuropsychology Conference, February, Las Vegas, NV.
*Barney, S.J., Thaler, N.S., Allen, D.N., Donohue, B., Mayfield, J. (2009). WISC-IV profiles in children with traumatic brain injury: Similarities and differences to the WISC-III. The 29th Annual Conference National Academy of Neuropsychology, November. New Orleans, LA.
*Strauss, G.P., Ringdahl, E., Barney, S.J., Jetha, S.S., Duke, L.A., Ross, S.A., Watrous, B.,

88
Allen, D.N. (2009). Using Negative Feedback to Guide Behavior: Impairment on the First Four Cards of the Wisconsin Card Sorting Test Predicts Negative Symptoms of Schizophrenia. The 29th Annual Conference National Academy of Neuropsychology, November. New Orleans, LA.
*Kazakov, D., Haderlie, M., Barney, S.J., Allen, D.N., Mayfield, J. (2009). Construct validity of the CTMT in adolescent traumatic brain injury. The 117th annual meeting of the American Psychological Association, August, Toronto, Canada.
*Barney, S.J., Ringdahl, E.N., Kazakov, D., Allen, D.N. (2008). Neurocognitive deficits in bipolar disorder with co-occurring borderline symptomatology. The 28th Annual Conference National Academy of Neuropsychology, October, New York, NY.
*Bello, D.T., Randall, C., Armstrong, C.M., Barney, S.J., Kazakov, D., Allen, D.N. (2008). Neurocognitive deficits predict functional outcome as measured by the UCSD Performance-based Skills Assessment (UPSA) in individuals with bipolar disorder. The 28th Annual Conference National Academy of Neuropsychology, October, New York, NY.
Barney, S.J., Randall, C., Bello, D.T., Armstrong, C.M., Allen, D.N. (2008). Neurocognitive deficits in bipolar disorder with co-occurring borderline symptomatology. Poster presented at the Nevada Undergraduate Research Symposium, April, Reno, NV. Also presented at the Annual Honors Poster Session, May, Las Vegas, NV
*Strauss, G.P., Barney, S.J., Timko, C.J., Jetha, S.S., Kamalani, L., Pace, S.A., Barnes, L.M., Hoyt, T.E., Duke, L.A., Ross, S.A., Schwartz, J., Allen, D.N. (2007). Impaired olfactory hedonic judgment in deficit syndrome schizophrenia. The 27th Annual Conference National Academy of Neuropsychology, October, Scottsdale, AZ.
*Strauss, G.P., Barney, S.J., Timko, C.J., Jetha, S.S., Kamalani, L., Pace, S.A., Barnes, L.M., Hoyt, T.E., Duke, L.A., Ross, S.A., Schwartz, J., Allen, D.N. (2007). Neuropsychological impairment patients with deficit syndrome schizophrenia. The 27th Annual Conference National Academy of Neuropsychology, October, Scottsdale, AZ.
Barney, S.J., Hoyt, T.E., Cristiani, N., Timko, C.J., Park, B.S., & Allen, D.N. (2007). Factor support of the distinctiveness of a new measure for attention and working memory. The Annual Nevada State Psychological Association Conference, May, Las Vegas, NV.
Barney, S.J., Jetha, S.S., Mayfield, J., & Allen, D.N. (2007). Learning and memory performance in children with ADHD subtypes. The 87th Annual Convention of the Western Psychological Association, May, Vancouver, Canada.
Strauss, G.P., Villamar, A.J., Hoyt, T.E., Barney, S.J., Crow, M., Kamalani, L., & Allen, D.N. (2006). Positive emotion buffers against the development of psychopathology. The 5th Annual International Positive Psychology Summit, October, Washington, D.C.
Strauss, G.P., Leany, B.D., Barney, S.J., Kamalani, L., & Allen, D.N. (2006). Positive emotions broaden cognitive functioning. The 86th Annual Convention of the Western Psychological Association, April, Palm Springs, CA. Also presented at the Annual Psi Chi UNLV Chapter Annual Conference, April, Las Vegas, NV (Poster award)
RESEARCH EXPERIENCE
Graduate Research
Neuropsychology Research Program Summer 2009–Present University of Nevada, Las Vegas Advisor: Daniel N. Allen, Ph.D.

89
Study: Dissertation Responsibilities include project development, which involved selection of test battery, proposal preparation, IRB approval preparation, database creation, and organization of such materials as assessment materials, administration instructions and scoring, and subject recruitment resources, as well as phone screening potential participants, assessment of individuals with schizophrenia and bipolar disorder as well as controls using a 6-hour-long neuropsychological and neuroscience battery. IRB authorization was approved to test clinical participants off campus at Mojave Mental Health, an outpatient mental health clinic affiliated with the Nevada School of Medicine. Study: Wechsler Intelligence Scale for Children, Fifth edition, standardization study Responsibilities include being trained and approved in the administration of the WISC-V standardization version. To date, one child has been tested. Study: Validation of the computer Halstead Category Test and Search Identification Task Responsibilities include training undergraduate research assistants on administration, scoring, and data entry procedures. The project involves a two-part assessment, each lasting 2-hours and occurring within 7-14 days of one another. Study: Longitudinal study of neuropsychological and functional deficits in bipolar disorder Responsibilities included phone screening of potential participants, scheduling eligible participants for assessments, test scoring, data entry, and training research assistants in test scoring and entry procedures. Auditory Cognitive Neuroscience Laboratory Fall 2009–Fall 2011 University of Nevada, Las Vegas Advisors: Joel S. Snyder, Ph.D., Daniel N. Allen, Ph.D. Study: Neural mechanisms of perceptual processing in schizophrenia and bipolar disorder Responsibilities included assessment of individuals with schizophrenia using a 4-hour long neuropsychological and neuroscience battery. In addition, responsibilities include phone screening of potential participants, scheduling eligible participants, scoring, data entry, and training research assistants in scoring and entry protocols of participant assessments. Achievement Center Fall 2009–Fall 2011 University of Nevada, Las Vegas Advisor: Bradley Donohue, Ph.D. Study: Concurrent drug abuse treatment and HIV prevention in child neglecting mothers, NIDA funded RO1 grant (DA020548-01A1) Responsibilities included evaluating substance-abusing mothers who had been identified by Child Protective Services to participate in a therapeutic program as well as organizing efforts to regain contact with out of contact participants. Assessments were administered in the clients’ homes and included the SCID, urine analysis, home safety ratings, and verbally administered self-report measures of child abuse potential, family interaction styles, and life satisfaction.
LEADERSHIP AND SERVICE
National Academy of Neuropsychology Professional Affairs and Information Committee Student Member
April 2011-Present
Responsibilities: Advocacy for neuropsychologists, providing practice-related information to neuropsychologists in the form of resources and information, dictate quarterly conference call meeting minutes, monitor national neuropsychology listserv for practice related issues.

90
Student Volunteer at Annual Conferences
Nashville, TN Marco Island, FL Vancouver, BC, Canada New Orleans, LA
October 2012
November 2011 October 2010
November 2009
Outreach Undergraduate Mentoring Program Undergraduate student mentor
Fall 2011–Present
Responsibilities: Mentor an underrepresented undergraduate student through graduate school preparation, applications, and potential career paths in psychology.
American Red Cross, Southern Nevada Chapter Disaster Assistance Team Member
April 2013–September 2013
Responsibilities: Completed a one-day training in ‘response to disaster’. Was on-call one weekend a month to respond to disasters, typically house and apartment fires, in southern Nevada in order to supply aid to the victims in the form of food, clothes, and shelter when necessary.
UNLV Clinical Psychology Doctoral Student Committee Cohort Representative and Treasurer
Fall 2010–August 2011
American College of Professional Neuropsychology Student Volunteer at 2nd Annual Conference
February 2010
Reitan Society Meeting Student Volunteer at Conference
February 2010
National Alliance of Professional Psychology Providers Student Volunteer at Continuing Education Conference
Fall 2009
Psi Chi National Honor Society in Psychology Vice-President, University of Nevada, Las Vegas Chapter
Fall 2008–Spring 2009
Psychology Club Secretary, University of Nevada, Las Vegas
Spring 2008
PROFESSIONAL AFFILIATIONS AND HONOR SOCIETIES National Academy of Neuropsychology 2007–Present International Neuropsychological Society 2014–Present American Psychological Association
Division 40 American Psychological Association of Graduate Students
2007–Present 2014–Present 2009–Present
Nevada Psychological Association 2010–Present Phi Kappa Phi National Honor Society 2008 –Present Golden Key Honor Society 2008 –Present Psi Chi, National Honor Society in Psychology 2006 –Present
OTHER RELEVANT WORK AND TRAINING EXPERIENCE
Psychological Assessment & Testing Clinic August 2009–August 2010 Las Vegas, NV Supervisor: Michelle G. Carro, Ph.D.

91
Graduate Assistant responsible for conducting telephone intakes, scheduling and case assignments for 6-10 graduates students, bookkeeping, and other administrative functions at the department-sponsored community psychological assessment training clinic. (20 hours per week). Symptoms Ratings Training Program Fall 2010 University of Nevada, Las Vegas Training Supervisor: Daniel N. Allen, Ph.D. Completed a training program for the administration of a number of clinician administered symptom scales associated with symptoms of schizophrenia and bipolar disorder. Training was comprised of a series of workshops. Refresher workshops were held periodically. SCID Training Program Summer 2009 University of Nevada, Las Vegas Training Supervisor: Daniel N. Allen, Ph.D. Completed a training program over three months and made up of approximately 40 hours for administration of the Structured Clinical Interview of the DSM-IV-TR Axis I Disorders (SCID).
Provided training and mock interview assistance in two subsequent trainings held by Daniel Allen, PhD The Collaborative IRB Training Initiative (CITI) Program Spring 2005–Present (http://www.citiprogram.org).
HONORS AND AWARDS
Graduate & Professional Student Association travel funding to attend The National Academy of Neuropsychology Convention in Fajardo, Puerto Rico ($600)
Barrick Graduate Fellowship ($15,000)
2014
Summer Session Scholarship ($2,000) 2013 Graduate & Professional Student Association research funding ($470) 2013 President’s Graduate Research Fellowship ($25,000) 2012 Graduate & Professional Student Association travel funding to attend and
present at The National Academy of Neuropsychology Convention in Marco Island, FL ($500)
2011
Patricia Sastaunak Scholarship ($2,500) 2011 Graduate Access Grant ($2,000) 2011 Edward Lovinger Psychology Scholarship ($2,000) 2010 Psi Chi Travel Grant to attend The American Psychological Association 116th
Annual Convention in Boston, MA ($1,800) 2008
Second Place Poster Award, Psi Chi National Honor Society Annual Conference, Las Vegas, Nevada ($75)
2006
John P. & Mary V. Hughes Valedictorian Scholarship ($10,000) 2004 Provost Scholarship, Nevada Board of Regents ($12,000) 2004 Governor Guinn Millennium Scholarship ($10,000) 2004
GRANTS
National Science Foundation-EPSCoR Undergraduate Research Award University of Nevada, Las Vegas Research Funding ($4,310)
2007-2008

92
PROFESSIONAL REFERENCES
Daniel N. Allen, Ph.D. Lincy Professor of Psychology Department of Psychology University of Nevada, Las Vegas 4505 Maryland Parkway MS 5030 Las Vegas, NV 89154-5030 • Email: [email protected] • Phone: (702) 895-0121
Sarah Banks, Ph.D., ABPP/CN Head, Neuropsychology Program Lou Ruvo Center for Brain Health Assistant Professor of Medicine Department of Psychiatry and Psychology Cleveland Clinic Lerner College of Medicine Case Western Reserve University 888 W Bonneville Ave Las Vegas, NV 89106 • Email: [email protected] • Phone: (702) 778-7002
Thomas F. Kinsora, Ph.D. Clinical Neuropsychologist Center for Applied Neuroscience 716 S. 6th Street Las Vegas, Nevada 89101 • Email: [email protected] • Phone: (702) 382-1960