function maps and the role of surfaces
TRANSCRIPT

International Journal of Machine Tools & Manufacture 41 (2001) 1847–1861
Function maps and the role of surfaces
D.J. Whitehouse*
Department of Engineering, University of Warwick, Coventry CV4 7AL, UK
Abstract
An integrated way of viewing workpiece function performance is presented. This is called a functionmap. Some of its attributes are explained. Using this function map a classification scheme for functionalperformance is developed. The way in which surfaces relate to function is investigated with respect tothese maps. New boundary conditions are revealed thereby allowing conventional parameters to be usedwith confidence so avoiding a new parameter rash. The whole approach is pictorial rather than analyticalfor clarity 2001 Elsevier Science Ltd. All rights reserved.
Keywords: Surfaces; Workpiece function; Functional classification; Surface parameters; Nanotechnology
1. Introduction
1.1. General performance
In this age of control and optimization much attention is paid to the manufacture of the work-piece rather than to decide how it performs when in use.
Ideally the way to decide how well the workpiece will behave is to try it out. This meanstesting it in a way which mimics the function. Under this regime an inspection room in a factorywould have product testers. An alternative to this approach would be the opposite. The tests onthe workpiece would be designed to determine the extent or even just the presence of factorswhich destroy the function such as high friction or wear. The inspection room using this regimewould have friction rigs, tests for wear or perhaps a light scatter rig in the case of optical function.
* Tel.: +44-1203-523154; fax:+44-1203-471457.E-mail address: [email protected] (D.J. Whitehouse).
0890-6955/01/$ - see front matter 2001 Elsevier Science Ltd. All rights reserved.PII: S0890-6955(01)00049-9

1848 D.J. Whitehouse / International Journal of Machine Tools & Manufacture 41 (2001) 1847–1861
The overall pattern might well be as shown in Fig. 1 in which there are three paths to perform-ance. Of the three (b) is the simplest and the cheapest because it is merely holding the status quoand not attempting to remedy intrinsic faults as in (c) or optimizing as in path (a).
The problem is that path (a) is too restrictive and (c) is expensive especially if a wide rangeof function is required. It may be that a workpiece might be subjected to a wide range of loadsand speeds, with or without lubricants at high or low temperatures, and so on. The apparatusnecessary to cater for such variety was and is complex and expensive. The result is that path (c)in Fig. 1 is rarely used and only if the function is idealized for simplicity, e.g. using four ballmachines to test oil for gears, or using two disc machines for pitting wear.
There is, however, one way which has been used over a number of years which is a modificationof path (b) using surface metrology [3]. In this a relatively simple parameter such as the averageroughness value, the Ra, is used as a statistical control parameter for the manufacturing process.This is valid because should any change in the process occur it will surely reflect on the roughnessvalues. The actual value of Ra is not important but the variation in Ra represents the degree ofcontrol of the process.
More recently some surface parameters have been used to predict how the workpiece willbehave. For example the roughness peak heights such as Rz [1] have been kept below the designedfilm thickness. The roughness has therefore had two roles, that of control of process and that ofguaranteeing performance.
The extension of the latter role has been tried with only marginal success. Various parametershave been suggested for the same function, sometimes peaks, sometimes averages Rq, sometimeswaviness. The term “parameter rash” [2] has been used to describe the multiplicity of parameterscurrently available from instrument makers and has been the result of unsatisfactory matching ofa parameter to any given function. This situation has been made possible with the advent ofdigital methods. Unfortunately there are two basic problems. One is that designers who are con-cerned with meeting specifications have little knowledge of the functional significance of theseparameters. The other is that the key properties governing performance are also not well under-stood. The proliferation of parameters is often symptomatic of ignorance in the same way thatdimension tolerances tend to be tight if little is known about their design significance [3].
There is no point in trying to match parameters of the surface to nebulous functional character-
Fig. 1. Ways to ensure performance.
1849D.J. Whitehouse / International Journal of Machine Tools & Manufacture 41 (2001) 1847–1861
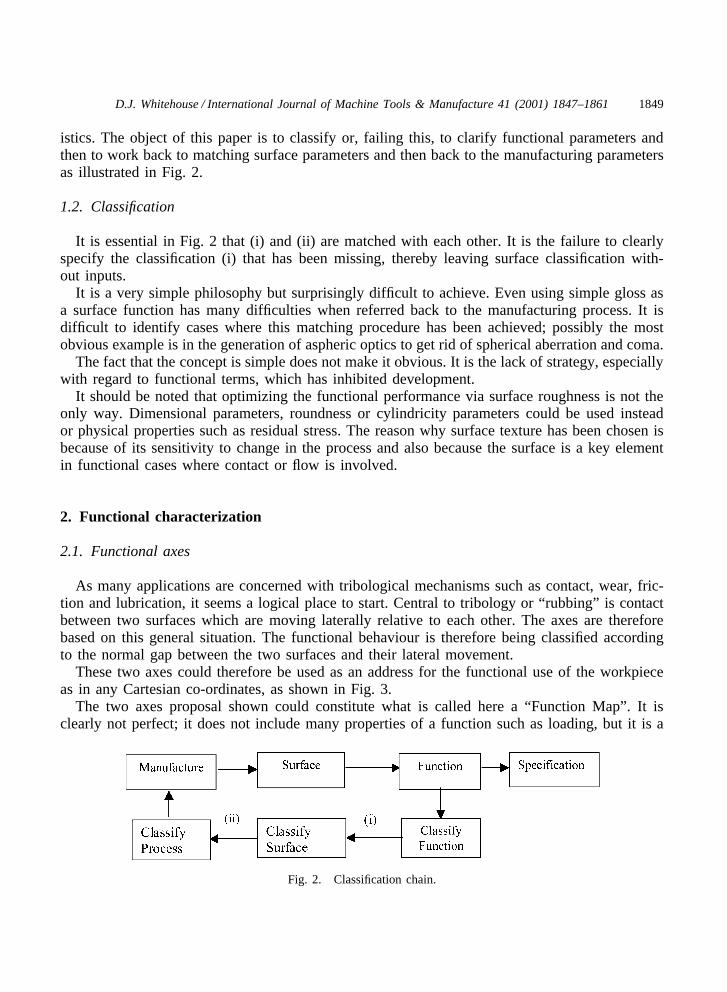
istics. The object of this paper is to classify or, failing this, to clarify functional parameters andthen to work back to matching surface parameters and then back to the manufacturing parametersas illustrated in Fig. 2.
1.2. Classification
It is essential in Fig. 2 that (i) and (ii) are matched with each other. It is the failure to clearlyspecify the classification (i) that has been missing, thereby leaving surface classification with-out inputs.
It is a very simple philosophy but surprisingly difficult to achieve. Even using simple gloss asa surface function has many difficulties when referred back to the manufacturing process. It isdifficult to identify cases where this matching procedure has been achieved; possibly the mostobvious example is in the generation of aspheric optics to get rid of spherical aberration and coma.
The fact that the concept is simple does not make it obvious. It is the lack of strategy, especiallywith regard to functional terms, which has inhibited development.
It should be noted that optimizing the functional performance via surface roughness is not theonly way. Dimensional parameters, roundness or cylindricity parameters could be used insteador physical properties such as residual stress. The reason why surface texture has been chosen isbecause of its sensitivity to change in the process and also because the surface is a key elementin functional cases where contact or flow is involved.
2. Functional characterization
2.1. Functional axes
As many applications are concerned with tribological mechanisms such as contact, wear, fric-tion and lubrication, it seems a logical place to start. Central to tribology or “ rubbing” is contactbetween two surfaces which are moving laterally relative to each other. The axes are thereforebased on this general situation. The functional behaviour is therefore being classified accordingto the normal gap between the two surfaces and their lateral movement.
These two axes could therefore be used as an address for the functional use of the workpieceas in any Cartesian co-ordinates, as shown in Fig. 3.
The two axes proposal shown could constitute what is called here a “Function Map” . It isclearly not perfect; it does not include many properties of a function such as loading, but it is a
Fig. 2. Classification chain.

1850 D.J. Whitehouse / International Journal of Machine Tools & Manufacture 41 (2001) 1847–1861
Fig. 3. Address of function.
description of the operational parameters and it could set clear objectives for the design aim ofthe workpiece.
In Fig. 4 the ordinate is the gap between the surfaces. This axis has to take account of situationswhere the surfaces are solidly engaged even to the extent of damage. Hence there is the equivalentof a “negative” gap where elastic or plastic deformation occurs. Consequently there are tworegions of the ordinate axis, one with a gap and the other with contact, (i) and (ii). The abscissais transverse relative movement between the surfaces.
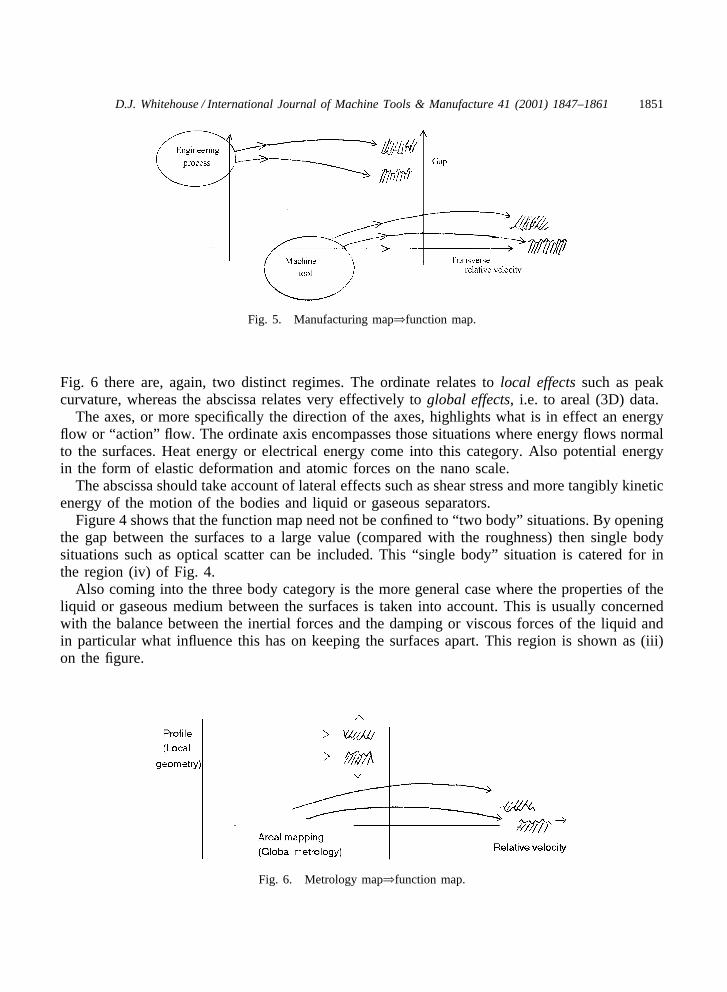
This choice of function axes is fortunate because examination of Fig. 5 reveals that the twochosen axes of the function map relate conveniently to different aspects of the manufacturingsystem. The function map is at the same time a manufacturing map in disguise.
The gap properties are determined largely by the process marks, especially as the gap closes.The number of contacts and their distribution depend on the local geometry which can usuallybe determined from profile information, whereas the effectiveness of the relative velocity isdetermined by the general shape and areal “ lay” of the surfaces, which are determined largely bythe tool path in space, which in turn relies on the machine tool. In the metrology map shown in
Fig. 4. Tribological regime.
1851D.J. Whitehouse / International Journal of Machine Tools & Manufacture 41 (2001) 1847–1861
Fig. 5. Manufacturing map⇒function map.
Fig. 6 there are, again, two distinct regimes. The ordinate relates to local effects such as peakcurvature, whereas the abscissa relates very effectively to global effects, i.e. to areal (3D) data.
The axes, or more specifically the direction of the axes, highlights what is in effect an energyflow or “action” fl ow. The ordinate axis encompasses those situations where energy flows normalto the surfaces. Heat energy or electrical energy come into this category. Also potential energyin the form of elastic deformation and atomic forces on the nano scale.
The abscissa should take account of lateral effects such as shear stress and more tangibly kineticenergy of the motion of the bodies and liquid or gaseous separators.
Figure 4 shows that the function map need not be confined to “ two body” situations. By openingthe gap between the surfaces to a large value (compared with the roughness) then single bodysituations such as optical scatter can be included. This “single body” situation is catered for inthe region (iv) of Fig. 4.
Also coming into the three body category is the more general case where the properties of theliquid or gaseous medium between the surfaces is taken into account. This is usually concernedwith the balance between the inertial forces and the damping or viscous forces of the liquid andin particular what influence this has on keeping the surfaces apart. This region is shown as (iii)on the figure.
Fig. 6. Metrology map⇒function map.

1852 D.J. Whitehouse / International Journal of Machine Tools & Manufacture 41 (2001) 1847–1861
2.2. Numerical scales
It is tempting to use logarithmic scales but this is not possible on the ordinate axis unless thezero is artificially suppressed. It may be acceptable to use a logarithmic scale and to skip theorigin, i.e. where surfaces just touch. It is possible to justify this step because where the zeroposition is in practice is not known. It is a statistical probability because of the nature of roughsurfaces so it may be a good idea to fudge the position on the graph.
It is possible to use such an axis scale on the abscissa but in the important case of static contact,problems arise. Another judgement is needed for the axes units. They could both be absolutevalues, but in tribological situations it is often better to normalize the units. So, for example, theordinate gap could be measured relative to the joint roughnesses of the mating surfaces.
This step is not trivial because a suitable choice of parameter to represent mating surfaces hasto be made. It would seem obvious to use the rms value Rq or the average value Ra, but not touse parameters based on peaks. The unit is usually micrometres.
This normalization is especially useful in the very small parts used in microdynamics wherethe roughness values are large relative to surface separations. Such a unit for the axes could beused in the region (i). In region (iii) the situation is dynamic rather than static so that the unitcannot be completely spatial as in A but it must have a temporal component in it. This reducesto some unit which involves the relative velocity of the surfaces.
One possibility for the abscissa unit could be the Reynolds number because many applicationsinvolving lateral movement, especially in lubrication, are described by the Reynolds equation andso would fit on this axis. The problem is that “normal” parameters such as “h” are also involved.The obvious solution is to use the relative velocity as it stands. This is one option but it couldbe criticized for being too “non-functional” ! Nevertheless, this is the unit variable chosen hereand is measured in m/s.
It makes some sense to make the abscissa axis function orientated like the gap value is for theordinate axis. For example, Fig. 7 shows that quite different contact functions are sprinkled with-out ambiguity up the ordinate “gap” axis.
Because the flow is through the surface the chemical and physical attributes are very important.
Fig. 7. Function map flow regimes.
1853D.J. Whitehouse / International Journal of Machine Tools & Manufacture 41 (2001) 1847–1861
In the case of transverse flow shown in the figure the actual chemical constitution of the surfacesis not so critical because the flow only touches the surface and does not flow through it.
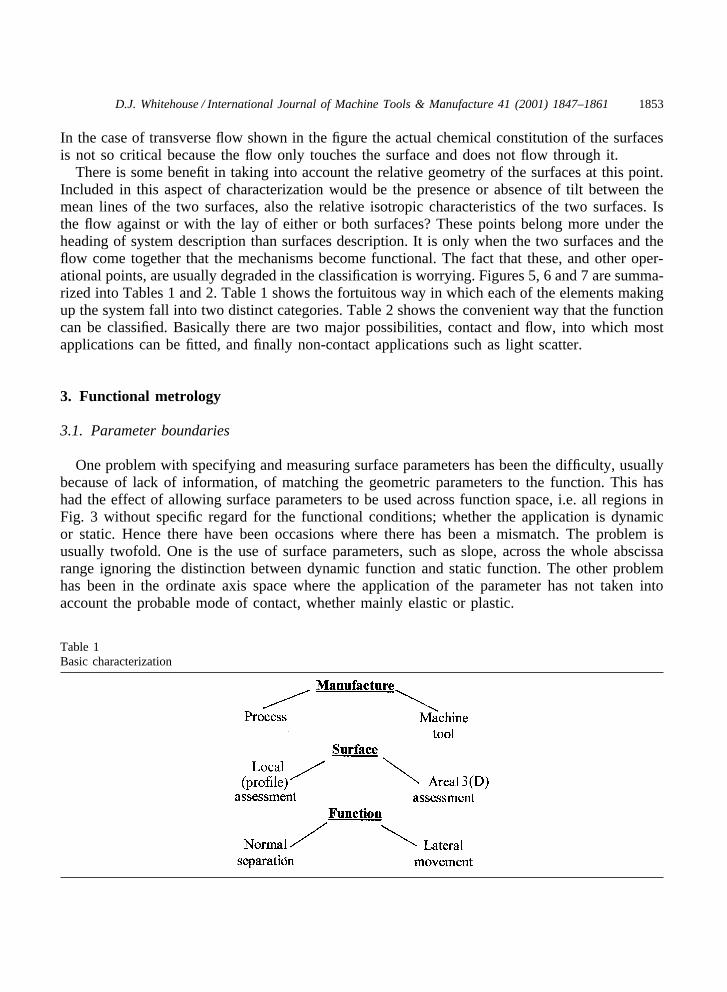
There is some benefit in taking into account the relative geometry of the surfaces at this point.Included in this aspect of characterization would be the presence or absence of tilt between themean lines of the two surfaces, also the relative isotropic characteristics of the two surfaces. Isthe flow against or with the lay of either or both surfaces? These points belong more under theheading of system description than surfaces description. It is only when the two surfaces and theflow come together that the mechanisms become functional. The fact that these, and other oper-ational points, are usually degraded in the classification is worrying. Figures 5, 6 and 7 are summa-rized into Tables 1 and 2. Table 1 shows the fortuitous way in which each of the elements makingup the system fall into two distinct categories. Table 2 shows the convenient way that the functioncan be classified. Basically there are two major possibilities, contact and flow, into which mostapplications can be fitted, and finally non-contact applications such as light scatter.
3. Functional metrology
3.1. Parameter boundaries
One problem with specifying and measuring surface parameters has been the difficulty, usuallybecause of lack of information, of matching the geometric parameters to the function. This hashad the effect of allowing surface parameters to be used across function space, i.e. all regions inFig. 3 without specific regard for the functional conditions; whether the application is dynamicor static. Hence there have been occasions where there has been a mismatch. The problem isusually twofold. One is the use of surface parameters, such as slope, across the whole abscissarange ignoring the distinction between dynamic function and static function. The other problemhas been in the ordinate axis space where the application of the parameter has not taken intoaccount the probable mode of contact, whether mainly elastic or plastic.
Table 1Basic characterization

1854 D.J. Whitehouse / International Journal of Machine Tools & Manufacture 41 (2001) 1847–1861
Table 2Elementary links in characterization
One possible boundary regime could be as shown in Fig. 8. A is elastic, B plastic, C dynamic.D is static. The question is where are these boundaries and what change of state of the systemdoes each boundary represent, and is there a surface type or parameter which fits uniquely intoeach regime? What is the nature of useful surface parameters [6]? The latter problem will beexamined next with a view to clarifying the issues of the boundaries.
It seems from Fig. 8 that there are at least two fundamental boundaries that are needed in orderto compartmentalize the function map and hence the surface parameters.
Line (a) is the boundary between elastic and plastic behaviour of surfaces mainly in the static
Fig. 8. Boundaries of application.

1855D.J. Whitehouse / International Journal of Machine Tools & Manufacture 41 (2001) 1847–1861
mode and concerned with contact. Line (b) is the distinction between dynamic and static function,the former involved in flow. This is itself simplistic as will be seen later.
The basis for line “a” is Hertz’s equation for the elastic deformation of a sphere into a flatwhich in some ways mimics a contact point of two surfaces. The elastic pressure can be greaterthan the local hardness of the weaker surface in which case plastic deformation can occur. Thusy=[(W1/3E2/3)/(3.87HR2/3)] where E and R are composite values. When y�1 deformation occursincorporating both surfaces [4]. H is the “skin” hardness, i.e. the hardness value at depths ofindentation of the same order as the surface roughness, e.g. 0.1 µm. W is also a problem becauseit has to be the average load of all the contacts at that height. Also, more importantly there is adynamic element which adds to the usual static load term. This is not the dynamics of flow. Thedynamic term includes not only the surface geometry in terms of Rq, the root mean square value,but also forces in the system holding the surfaces.
Classifying the function implies setting up boundaries within the function map to establishdomains within which specific surface and/or dimensional characteristics could be identified.Clearly the dynamic function C has to take into account inertial, viscous and elastic regimes.Hence taking the static and dynamic components into account involves a minimum set (4C2) ofboundaries. These are:
(a) Elastic/plastic(b) Elastic/inertial(c) Visco/elastic(d) Visco/plastic(e) Visco/inertial(f) Plasto/inertial
Even this set is simplified by allowing elasticity to be identical in the static and dynamic modes.Each interface can be expressed as a division of the two elements making up the interface e.g.(elastic/plastic). This division may be woven into a non-dimensional number which includes arelative transverse velocity and/or a characteristic length taken here a gap. This then fixes thefunction mode, i.e. the division into the co-ordinate system of the function map. The modifiedReynolds number or the Reynolds roughness number is a good example of the (inertial/viscous)boundary. The Greenwood (elastic/plastic) contains only normal compliance yet it makes a goodstatic boundary. Other non-dimensional parameter sets are the Bingham number of the viscoplastic regime of low shear and the elasticity number for the elastic/inertial ratio.
No doubt there are other more suitable non-dimensional numbers which could be used. Thoseabove merely show how a complete set of compartments for the function map may be achieved.The value of these numbers depends on the specific application and the scale of size of the systemcomponents. Note that non-dimensionality is used because it helps to minimize the number offactors not present in the map.
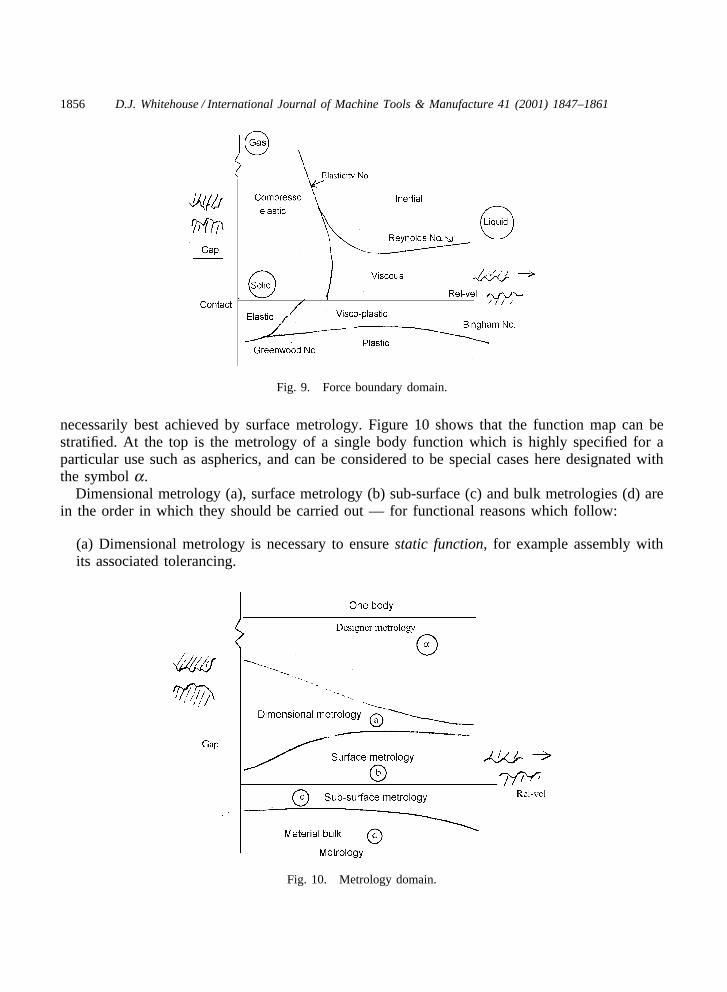
Figure 9 is an attempt to formulate boundaries on a force description basis with thesolid/liquid/gas phases within the function map. Although not quantitative it shows the potentialof such an approach. The boundaries themselves can be non-dimensional, as in the modifiedReynolds number shown, and still be a function of velocity and gap, or either.
Also, the significance of the function from one part of the function map to another is not
1856 D.J. Whitehouse / International Journal of Machine Tools & Manufacture 41 (2001) 1847–1861
Fig. 9. Force boundary domain.
necessarily best achieved by surface metrology. Figure 10 shows that the function map can bestratified. At the top is the metrology of a single body function which is highly specified for aparticular use such as aspherics, and can be considered to be special cases here designated withthe symbol a.
Dimensional metrology (a), surface metrology (b) sub-surface (c) and bulk metrologies (d) arein the order in which they should be carried out — for functional reasons which follow:
(a) Dimensional metrology is necessary to ensure static function, for example assembly withits associated tolerancing.
Fig. 10. Metrology domain.

1857D.J. Whitehouse / International Journal of Machine Tools & Manufacture 41 (2001) 1847–1861
(b) Surface metrology is necessary to ensure dynamic function, for example, rotation.(c) Sub-surface metrology is necessary to ensure the integrity and hence the long life function,one example is residual stress.(d) The general bulk metrology of, for example, hardness helps ensure fitness for use in thepresence of the dynamic and static loading specified [9].
It should be emphasized that (a), (b), (c) and (d) above relate to two body or even three bodysystems and not one body as in a.
It should be stressed here that these ideas are tentative and are qualitative rather than quantitat-ive. A critical Reynolds number using the “gap” as the “ typical dimension” could well be 500 inconventional engineering, yet gets nearer to unity as the scale of size reduces. Inertial forces getless important and the emphasis shifts to the elastic and viscous regimes where the surface para-meters can be expected to become dominant (see Fig. 11).
3.2. System and surface
Whereas the conventional parameters of the surface are given in spatial terms, e.g. averagewavelength, the functional equivalents are temporal because the dynamics are in real time. Takesurface slope, for example. This has a different functional effect for given speeds. Hence thesurface parameters become “system parameters” incorporating into the surface a “Doppler”effect — the surface slopes should be in terms of time. If the parameters of the surface are onlyrelevant when the system is taken into account it seems rather pointless to carry the areal (3D)characterization too far [5].
The surface characterization map should relate to the function map temporally, not only spati-ally. See Section 3.3.2.
Fig. 11. Scale of size effect.

1858 D.J. Whitehouse / International Journal of Machine Tools & Manufacture 41 (2001) 1847–1861
3.3. Nature of parameters
3.3.1. General breakdown of resultsThroughout the last thirty years there have been many different views on what is important in
a functional situation regarding the surfaces involved. However, one concept has threaded its waythrough the various functional models. This is that the function can be broken down into twomechanisms. First is that of a “unit event” of the function, e.g. a contact spot in cases where thesurfaces touch. The other is the spatial distribution of such events throughout the function space[7]. It is recognized that whereas the surface geometry may be only partly responsible for “unitevent” behaviour, e.g. the curvature at the contact, so it is the surface geometry which is funda-mentally responsible for their distribution in space. Unfortunately these complementary facets ofthe surface geometry have tended to become separated. Attention has been given to either theunit event, as in manufacturing control, or the distribution, as in optics, rarely have these beenlumped together except perhaps in simple contact.
The point which has to be addressed is that it cannot be taken for granted that both facets ofthe geometry belong in the same region of the function map. This complicates the issue. Is itpossible to concentrate on the one aspect of the geometry or are both essential? The answer isthat it depends on the function. For example, in the case of lubrication where the surfaces areseparated the surface distributions are very important in allowing satisfactory performance,whereas in contact the “unit” event may be of more interest.
3.3.2. Functional dependence of parametersBecause of the weak tie-up of parameters to function it has been general practice to lump a
type of measurement to a large functional group of applications, for example surfaces slopes toflow. The fact is that one surface will see completely different values of slope on its matingsurfaces depending on their relative velocities. In other words, the definition of surface slopeshould incorporate the key element of the function — in this case the relative velocity. In thisscenario any parameter involving lateral spacing between features of the gap between the surfaceswould be modified by the relative speed. “Gap” slope m, for example, given in purely spatialterms would become m� functionally, where m� is m(1+�); the � term being the extra termincorporating the relative velocity of the surfaces.
It is appreciated that matching surface parameters to function maps is difficult, usually becauseof time and expense. The usual option is to try a few parameters to get the best correlationbetween parameter and function. Unfortunately, as the experiments are few and conditions areimperfect questionable correlation coefficients result. The next step is usually to invent and trymore parameters. The whole process of investigation has tended to increase the number of para-meters rather than to increase understanding. It is suggested here that parameter modification isbetter than a parameter rash because it preserves a lot of the good sense embodied in past experi-ence.
3.3.3. Function or malfunctionSometimes the issue of whether parameters have a good or bad influence on performance has
been neglected. This is probably due to misunderstanding the “unit event” idea. For example avery high peak within a general distribution is statistically to be expected; it is an extreme value

1859D.J. Whitehouse / International Journal of Machine Tools & Manufacture 41 (2001) 1847–1861
Fig. 12. General surface relevance.
from a distribution and it may initiate the destruction of an oil film in, say, hydrodynamic lubri-cation. It illustrates the point that average behaviour of the surface geometry can be viewed as afactor in influencing the good performance of a workpiece, whereas extremes of the surface tendto cause a breakdown of performance. The latter point obviously holds for freak geometry as indefects (Fig. 12).
From the above it is necessary to group surface effects in function space as in the figures intogood or bad influences. At present there is a mixture of both. This leads to the very generalbreakdown of the geometry shown in Table 3.
4. Conclusions
This report has set out to bring together some scattered thoughts which when integrated rep-resent a contribution to a very important area of engineering, namely quality of performance.
Table 3Dual roles of surface metrology and relationship to the statistics
1860 D.J. Whitehouse / International Journal of Machine Tools & Manufacture 41 (2001) 1847–1861
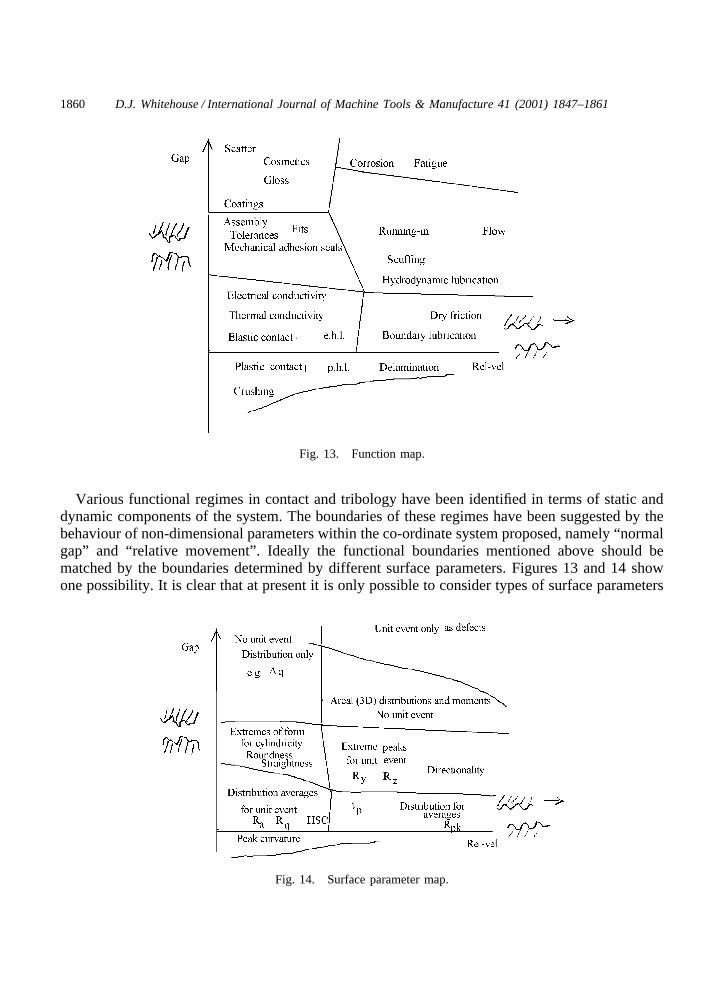
Fig. 13. Function map.
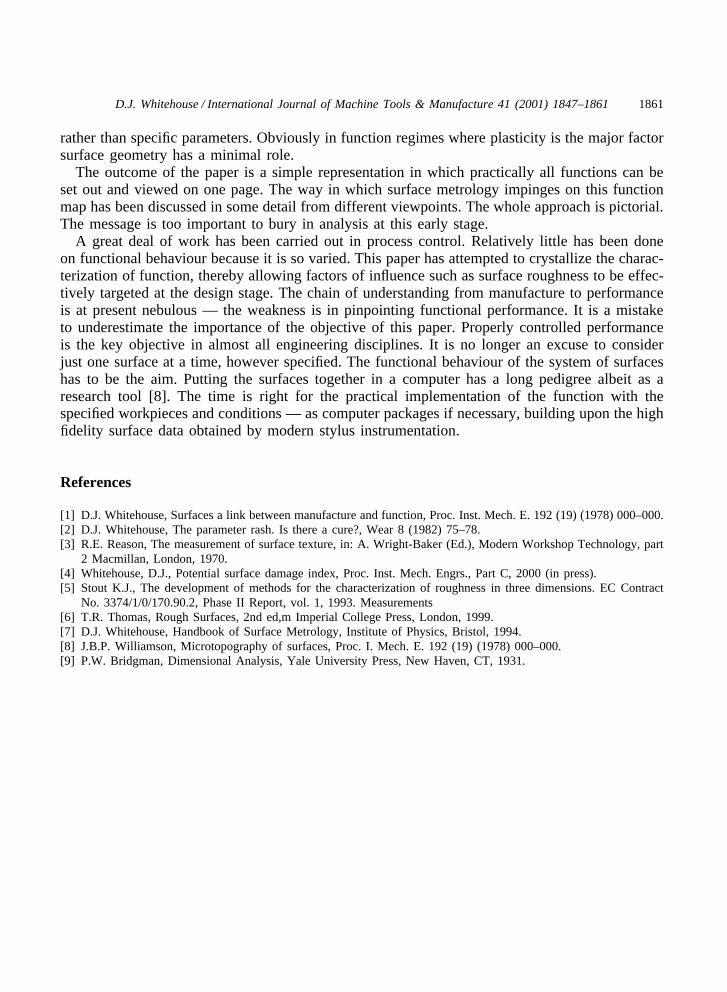
Various functional regimes in contact and tribology have been identified in terms of static anddynamic components of the system. The boundaries of these regimes have been suggested by thebehaviour of non-dimensional parameters within the co-ordinate system proposed, namely “normalgap” and “ relative movement” . Ideally the functional boundaries mentioned above should bematched by the boundaries determined by different surface parameters. Figures 13 and 14 showone possibility. It is clear that at present it is only possible to consider types of surface parameters
Fig. 14. Surface parameter map.
1861D.J. Whitehouse / International Journal of Machine Tools & Manufacture 41 (2001) 1847–1861
rather than specific parameters. Obviously in function regimes where plasticity is the major factorsurface geometry has a minimal role.
The outcome of the paper is a simple representation in which practically all functions can beset out and viewed on one page. The way in which surface metrology impinges on this functionmap has been discussed in some detail from different viewpoints. The whole approach is pictorial.The message is too important to bury in analysis at this early stage.
A great deal of work has been carried out in process control. Relatively little has been doneon functional behaviour because it is so varied. This paper has attempted to crystallize the charac-terization of function, thereby allowing factors of influence such as surface roughness to be effec-tively targeted at the design stage. The chain of understanding from manufacture to performanceis at present nebulous — the weakness is in pinpointing functional performance. It is a mistaketo underestimate the importance of the objective of this paper. Properly controlled performanceis the key objective in almost all engineering disciplines. It is no longer an excuse to considerjust one surface at a time, however specified. The functional behaviour of the system of surfaceshas to be the aim. Putting the surfaces together in a computer has a long pedigree albeit as aresearch tool [8]. The time is right for the practical implementation of the function with thespecified workpieces and conditions — as computer packages if necessary, building upon the highfidelity surface data obtained by modern stylus instrumentation.
References
[1] D.J. Whitehouse, Surfaces a link between manufacture and function, Proc. Inst. Mech. E. 192 (19) (1978) 000–000.[2] D.J. Whitehouse, The parameter rash. Is there a cure?, Wear 8 (1982) 75–78.[3] R.E. Reason, The measurement of surface texture, in: A. Wright-Baker (Ed.), Modern Workshop Technology, part
2 Macmillan, London, 1970.[4] Whitehouse, D.J., Potential surface damage index, Proc. Inst. Mech. Engrs., Part C, 2000 (in press).[5] Stout K.J., The development of methods for the characterization of roughness in three dimensions. EC Contract
No. 3374/1/0/170.90.2, Phase II Report, vol. 1, 1993. Measurements[6] T.R. Thomas, Rough Surfaces, 2nd ed,m Imperial College Press, London, 1999.[7] D.J. Whitehouse, Handbook of Surface Metrology, Institute of Physics, Bristol, 1994.[8] J.B.P. Williamson, Microtopography of surfaces, Proc. I. Mech. E. 192 (19) (1978) 000–000.[9] P.W. Bridgman, Dimensional Analysis, Yale University Press, New Haven, CT, 1931.