full year results…navitas fy17 full year results presentation – 30 june ... navitas ventures ......
TRANSCRIPT

FULL YEAR RESULTSFor the year ended 30 June 2017

2
• Key Highlights
• Financial Performance
• Strategy and Outlook
Navitas FY17 Full Year Results Presentation – 30 June 2017
Agenda

3
Growth
Navitas FY17 Full Year Results Presentation – 30 June 2017
Continued delivery of strong student experience and
academic outcomes
Creation of the Careers and Industry
Division
Operations streamlined and shared service
implementation progressed
New agreements with University of Idaho and Richard Bland College
signed in the US
5 University Partnership contracts
renewed
Quality Efficiency
170 basis point increase in Careers and Industry
EBITDA margin
Navitas Ventures launched
Average University Pass rates 82%, Retention
87%, Progression 94%
Key Highlights
5% enrolment growth for University Partnerships

4
1. Group revenue decreased by 5%
2. 5% full time enrolment CAGR in FY17
3. KPI commences in FY18
Group KPI’s for 2020 – Update
2020 Target FY17
Quality
Efficiency
Growth
1. Pass rates to 84%1
2. Retention rates to 90%1
1. 18% Group EBITDA Margin
2. 20% SAE EBITDA Margin
3. Annual capex under $20m
1. 5%2 revenue CAGR
2. 5% full time enrolment CAGR
3. 5 new university partnerships
1. Pass rates of 82%
2. Retention rates of 87%
1. Group EBITDA margin flat at 16.3%
2. SAE EBITDA Margin up 80 bps to 14.9%
3. KPI commences in FY18
2 Note: Based on constant currency and CAGR calculated assuming AMEPrevenue reduction excluded from FY17 to FY20. This reduces to 3% CAGRagainst FY17 Group revenue if AMEP revenue is included
1 University Partnerships Division only
Navitas FY17 Full Year Results Presentation – 30 June 2017
Metric

5
University Partnerships strategy
High pass, retention and progression-to-university rates maintained
Uni South Australia, Adelaide, Hertfordshire, Manitoba and Deakin contracts renewed
Optimal College model completed in Australia and North America
Sales and Marketing transformation started
New programs in Engineering, Health Sciences, Business and Sports Science
English language programs and Internships business now integrated
Signed new agreements with the University of Idaho and Richard Bland College
Strong Business Development pipeline Edith Cowan College converted to Joint
Venture model
Navitas FY17 Full Year Results Presentation – 30 June 2017
Extend and enhance
contracts, services and
student outcomes
Grow, retain and support
partners
Develop new products
Continue to improve/maintain high pass, retention and progression rates
Renew all due contracts – Anglia Ruskin University (Nov), Swansea University (Nov) Curtin University (Curtin College - Dec, Singapore – Mar), Brunel (Jan)
Complete Optimal College model in Europe Complete Sales and Marketing
transformation – includes recruitment tech Improve Division efficiency and margin
Expand new programs and products to partners
Explore pathways-to-employment and work integrated learning
Sign new university partners Explore a variety of models to suit different
needs of university partners Develop and target transformation offerings
for partners
VISION - Become the preferred transformation partner to universities around the world
Initiative FY18 FocusFY17 Progress

6
Careers and Industry strategy
Navitas FY17 Full Year Results Presentation – 30 June 2017
Finalise Careers and Industry operational restructure and deliver full integration benefits
Keep improving academic and student experience outcomes
Gain approval for >20 new US programs Develop efficiencies across the Division
New segments developed and expanded Further develop online capability Build or acquire high quality borderless
education organisations aligned to vertical segments
Explore further SAE licensing opportunities
VISION - Provide students with a quality, valued education in segments with strong employment prospects
Initiative FY18 FocusFY17 Progress
Careers and Industry restructure now largely complete
Aligned sectors around Creative, Government Services, Human Services and Health created
4 sub-scale SAE campuses exited
Strong academic & student experience outcomes
SAE US product expansion progressing – 15 new programs approved for delivery
ACAP awarded self-accrediting status SAE and ACAP receive VET Student Loan
accreditation
Market research commenced to identify appropriate new segments
Screening commenced for quality entry options (organic/inorganic)
Partner with Navitas Ventures to explore borderless opportunities
Refocus into industry aligned
vertical segments
Develop future business
opportunities
Increase performance of core – including
academic outcomes

7
Navitas Ventures investing in the future
Navitas FY17 Full Year Results Presentation – 30 June 2017
Projects and initiatives underway - ~$2.5 invested in FY17
Incubation Investment Partnerships
Online career centre. Supporting international students to secure internships
and jobs in the US.
Artificial Intelligence powered language coaching for Chinese students
Using Blockchain to issue and manage education credentials SaaS platform connecting agents, students
and University admissions teams.
Online synchronous, unaccredited management and leadership skills.
Pathways to post-graduate education.
Australia’s Edtech Acceleration Network for Scalable Borderless Education.

8
FINANCIAL PERFORMANCE
David Buckingham CFO
9
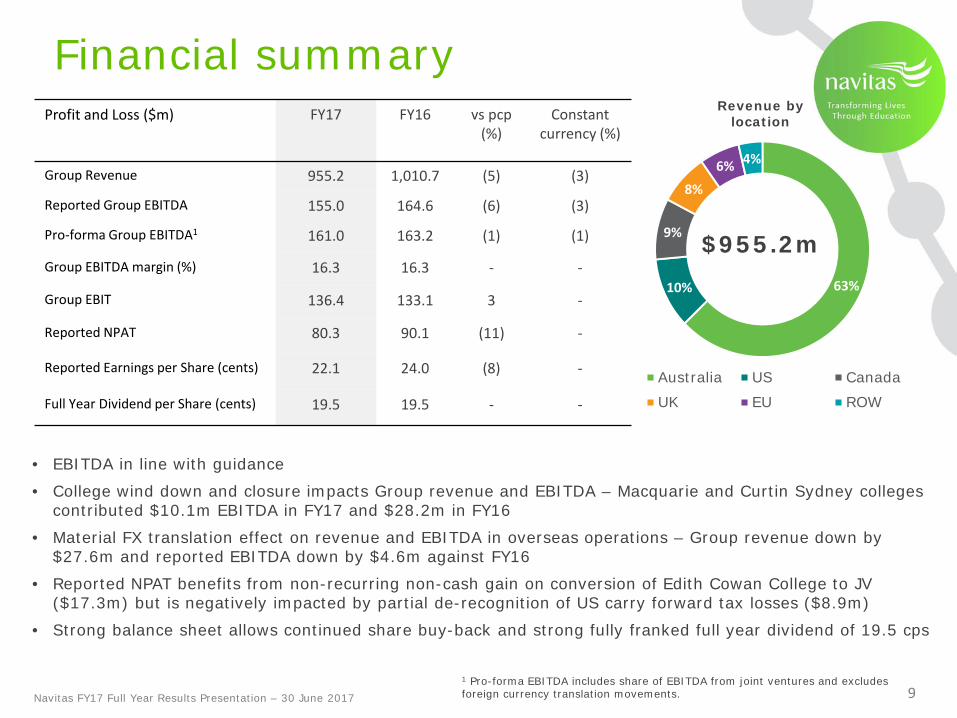
Profit and Loss ($m) FY17 FY16 vs pcp(%)
Constant currency (%)
Group Revenue 955.2 1,010.7 (5) (3)
Reported Group EBITDA 155.0 164.6 (6) (3)
Pro-forma Group EBITDA1 161.0 163.2 (1) (1)
Group EBITDA margin (%) 16.3 16.3 - -
Group EBIT 136.4 133.1 3 -
Reported NPAT 80.3 90.1 (11) -
Reported Earnings per Share (cents) 22.1 24.0 (8) -
Full Year Dividend per Share (cents) 19.5 19.5 - -
Financial summary
Navitas FY17 Full Year Results Presentation – 30 June 2017
• EBITDA in line with guidance
• College wind down and closure impacts Group revenue and EBITDA – Macquarie and Curtin Sydney colleges contributed $10.1m EBITDA in FY17 and $28.2m in FY16
• Material FX translation effect on revenue and EBITDA in overseas operations – Group revenue down by $27.6m and reported EBITDA down by $4.6m against FY16
• Reported NPAT benefits from non-recurring non-cash gain on conversion of Edith Cowan College to JV ($17.3m) but is negatively impacted by partial de-recognition of US carry forward tax losses ($8.9m)
• Strong balance sheet allows continued share buy-back and strong fully franked full year dividend of 19.5 cps
1 Pro-forma EBITDA includes share of EBITDA from joint ventures and excludes foreign currency translation movements.
Revenue by location
63%10%
9%
8%
6% 4%
Australia US CanadaUK EU ROW
$955.2m

10
Stable University Partnerships margin
Navitas FY17 Full Year Results Presentation – 30 June 2017Note 1. $64.3m of revenue and $9.7m of EBITDA reclassified to University Partnerships in FY16 following the restructuring of ELICOS colleges to the Division. All comparative periods adjusted accordingly.
• Results impacted by the final wind down and closure of Macquarie and Curtin Sydney colleges, tough UK environment, conversion of a college to a JV ($17.3m revenue reduction vs pcp) and adverse FX translation movements
• Underlying EFTSU increased 5% and price by 2.5% in FY17
• Margin impacted by closure of colleges
• New colleges with the University of Idaho and Richard Bland College in the US
• 5 contracts renewed and Edith Cowan College converted to a Joint Venture
• Implementation of optimal college model to standardise and enhance best practice
FY17 Revenue Distribution
FY17 FY161 vs pcp (%) Constant currency
(%)
Revenue ($m) 574.1 635.4 (10) (7)
EBITDA ($m) 131.3 146.9 (11) (8)
Margin (%) 22.9 23.167%
22%
11%
Australasia North America Europe
$574.1m

11
University Partnerships enrolments increase 8% in semester 2 2017
Prior periods exclude the Equivalent Full Time Student Unit (EFTSU) of closed colleges – see prior ASX announcements for more detailsNavitas FY17 Full Year Results Presentation – 30 June 2017
• North American enrolments flat compared to pcp with growth in Canada offset by decline in the US
• Overall demand remains strong for both countries but US visa rejection rates increased under the new US administration
• UK enrolments drop 3% in semester 2 2017 - traditionally small semester• Regulatory environment continues to be restrictive
• 16% growth in Australasian colleges• Growth enabled by ongoing demand for Australian and NZ universities and
stable regulatory regime
14,0
36 15,9
91
13,5
46
14,6
76
17,6
79
14,3
29
14,9
73
19,0
47
15,5
19
0%
2%
4%
6%
8%
10%
12%
0
2,000
4,000
6,000
8,000
10,000
12,000
14,000
16,000
18,000
20,000
1403 1501 1502 1503 1601 1602 1603 1701 1702
University Partnerships EFTSU
EFTSU Growth rate

12
Careers and Industry improves margin
Navitas FY17 Full Year Results Presentation – 30 June 2017
• Division created in FY17 from merger of SAE and Professional and English Programs
• SAE revenue growth masked by adverse foreign currency movements. Revenue growth in several core markets. Strong Australian result despite some impact from changed Vocational funding rules
• Margin growth of 170 bps driven by one-off increase in AMEP clients and effective cost control
• New SAE campus in Germany and expansion into Canada
• SAE campuses relocated or refurbished to allow growth – Sydney, Berlin, Hamburg, Paris, London
• Reduced AMEP contracts in retender – FY18 EBITDA to decrease by $14.0m from 1 July 2017
• Recent UK Court of Appeal rejection of SAE VAT case, appeal being considered. $5.0m outstanding liability paid in H1 FY17 and $3.0m expense incurred in FY17. UK business already restructured.
FY17 Revenue Distribution
FY17 FY16 vs pcp(%)
Constant currency (%)
Professional and English Programs revenue ($m)
174.4 165.6 5 N/A
SAE revenue ($m) 200.7 202.8 (1) 3
Careers and Industry revenue ($m) 375.1 368.4 2 4
Professional and English Programs EBITDA ($m)
31.1 25.4 22 22
SAE EBITDA ($m) 29.9 28.5 5 5
Careers and Industry EBITDA ($m) 61.0 53.9 13 13
Professional and English Programs margin (%)
17.8 15.4
SAE margin (%) 14.9 14.1
Careers and Industry margin (%) 16.3 14.6
35%
32%
19%
10%4%
Australia US GSA SW EU UK
$375.1m

13
Cash flow and key debt metrics
Navitas FY17 Full Year Results Presentation – 30 June 2017
• Operating cash flow impacted heavily in H1 FY17 by unwind of deferred revenues relating to closing colleges, conversion of a college to a JV and make good payments to exit old Sydney property.
o H2 FY17 net working capital returned to normalised level of $1.1m• Gross capex of $81.7m – net capex of $44.1m after lease incentive of $37.6m for new Sydney
premises o Capex expected to drop to <$20.0m in FY18
• Closing net debt of $186.0m (FY16: $56.2m)• Gearing ratio of 1.48 x, interest cover of 26.8x• Net cash of $86.6m includes $41.7m of cash in the Tuition Protection Service• Buy-back 69% complete - $69.8m spend in FY17
($m) FY17 FY16
EBITDA 155.0 164.6
Net working capital (47.5) 1.4
Lease incentive contributions 37.6 9.8
Tax (37.8) (46.3)
Net interest (5.8) (3.7)
Operating cash flow 101.5 125.8
Capex (81.7) (43.7)
Disposal of subsidiary cash (8.2) (1.2)
Other investments (3.2) (0.8)
Net cash flow before financing 8.4 80.1

14NAVITAS FY17 FULL YEAR RESULTS PRESENTATION – 30 JUNE 2017
STRATEGY AND OUTLOOK
Rod Jones, Group CEO

15
MEASURES OF SUCCESS
VISION
PURPOSE
Transform lives by increasing student access to quality tertiary education
Conviction Drive Adventurous Rigour Genuine Respect
To be universally recognised as one of the world’s most trusted learning organisation
UNIVERSITY PARTNERSHIP (UP) BUSINESSES
The preferred transformation partner to universities around the world
CAREERS AND INDUSTRY (CI) BUSINESSES
Providing students with a quality, valued education in segments with strong
employment prospects
Australasia North America Europe Creative Human
ServicesGovt.
Programs Health Incubation Investment Partnerships
NAVITAS VENTURES
Scaling ideas and growing teams that unleash human potential and transform the way the
world learns
EBITDAMargin
Partner NPS
Contract renewal
Student progression
Employee engagement
Senior retention New partners EBITDA EVAEFTSUStudent
commencements
WORLD CLASS QUALITY
LEADINGEFFICIENCY
SUSTAINABLEGROWTH
Clear strategic direction –aligned with operational goals
Navitas FY17 Full Year Results Presentation – 30 June 2017
2020 TARGETSPass rates Retention
ratesGrp EBITDA
marginSAE EBITDA
marginCapex per
annumRevenue
CAGRNew UP
Agreemt’sUP EFTSU
CAGR

16
Repositioning Navitas
Navitas FY17 Full Year Results Presentation – 30 June 2017
HORIZON
FY16 – FY17SIMPLIFICATION• Continue to focus on student
outcomes and experience• Establish global integrated and
simplified structure• Prioritise projects and initiatives• Establish new capabilities, both people
and operationally
FY18 – FY20EXPANSION• Build strong Australasian position • Secure NA and EU markets• Build beyond pathways with
University Partners on multiple agendas
• Consolidate industry focused offerings with new Careers and Industry division
• Growth and innovation through new Ventures
FY20+ENDURANCE• Repositioned University Partnerships
working on internationalisation, digitisation and supporting agendas
• Long-term industry partnerships developed with multiple offerings
• Ventures delivering new core offerings for growth and diversification, driving innovation and mitigating disruption
1
HORIZON 3
HORIZON 2

17
• Demand for education services growing globally despite uncertainty in some markets
• Navitas well positioned with a track record of delivering quality outcomes, a global network and a strong innovation pipeline now in place
• No income from closed colleges in FY18
• C&I EBITDA to decrease $14.0m from 1 July 2017 following AMEP retender
• Navitas 2020 growth targets
o 5% Group CAGR revenue
o 18% Group EBITDA margin
o 5% University Partnerships enrolment CAGR
o <$20.0m capex per annum
Outlook
Navitas FY17 Full Year Results Presentation – 30 June 2017

18
APPENDIX

19
Navitas – a globally diverse education provider
US RevenueFY13 - 3.8%
FY17 - 10.5%
ROW RevenueFY13 - 6.6%FY17 - 3.7%
EU RevenueFY13 - 6.1%FY17 - 6.0%
UK RevenueFY13 - 6.6%FY17 - 7.7%
Canada Revenue
FY13 - 5.9%FY17 - 9.2%
Aus RevenueFY13 - 71.1%FY17 - 62.9%
FY17 Group revenue $955.2mFY13 Group revenue $729.6m

20
Careers and Industry DivisionUniversity Partnerships Division
Navitas Ventures
Navitas Corporate
Navitas’ PurposeTransform lives by increasing student access to quality tertiary education
Navitas FY17 Full Year Results Presentation – 30 June 2017
The University Partnerships Division is a leading provider of pre-university and university
pathway programs with 34 colleges across Australia, US, UK, Canada,
NZ and Sri Lanka
The Careers and Industry Division provides industry focused vocational
and higher education programs across the Creative, Health, Human Services and Government Services
segments
Navitas Ventures scales ideas and invest in new education models and technology
Navitas (ASX: NVT) is a leading global education provider with over 120 colleges and campuses across 31 countries offering an extensive range of
educational services to students, clients and professionals. Navitas is an ASX200 company.
% of FY17 Group Revenue
60% 40%
% of FY17 Group Revenue
About Navitas

21
Market summary for external pathway programs
Source: Global flow of tertiary level students, UNESCO Institute of Statistics; US Dept of Education; Australian Dept of Education and Training; UK Dept of Business, Innovation and Skills; Global Affairs Canada.
Navitas FY17 Full Year Results Presentation – 30 June 2017
Australia• 39 universities• ~20 pathway colleges – 12 Navitas• 266k international tertiary students• International enrolments as a % of students –
18%• Government strategy – increase total
international enrolments by 45% to 720k by 2025
UK• 130 universities• ~55 pathway colleges – 10 Navitas• 428k international tertiary students• International enrolments as a % of students –
18.0%• Government strategy – increase sector value
by 66% to GBP30b by 2020
US• ~2,000 universities• ~55 pathway colleges - 7 Navitas• 842k international tertiary students• International enrolments as a % of students –
4%• Government strategy – focused on domestic
benefits, no targets
Canada• 49 universities• 2 pathway colleges – both Navitas• 151k international tertiary students• International enrolments as a % of students –
10.0%• Government strategy – increase total
international enrolments by 34% to 450k by 2022
Demand for international education continues to grow due to increases in population and middle class wealth in developing countries while investment in tertiary infrastructure lags
GLOBAL

22
Financial metrics
980.3878.2
731.7688.5643.8556.7
470.7345.4
955.21,010.7
FY11FY10FY09FY08 FY15FY14FY13FY12 FY17FY16
80.390.1
71.8
51.6
74.673.177.464.3
49.237.4
FY12FY11FY10FY09 FY16FY15FY14FY13 FY17FY08
Revenue ($m)
Underlying EBITDA ($m)155.0
164.6163.1144.9
130.0126.8121.196.7
77.163.4
FY17FY16FY15FY14FY13FY12FY11FY10FY09FY08
Reported NPAT ($m)
33.937.737.5
33.8
19.718.5
25.330.5
22.928.3
FY17FY16FY15FY14FY13FY12FY11FY10FY09FY08
19.519.519.519.519.520.7
18.8
14.310.9
19.5
FY17FY08 FY16FY15FY14FY13FY12FY11FY10FY09
Operating cash flow (cps)
Reported Earnings (cps)22.1
24.0
19.1
13.7
19.919.521.7
18.8
14.310.8
FY17FY13FY12FY11FY10FY09FY08 FY16FY15FY14
Dividends (cps)
Navitas FY17 Full Year Results Presentation – 30 June 2017

23
Detailed P&L – 5 years
Navitas FY17 Full Year Results Presentation – 30 June 2017
Navitas Ltd GrowthFY13 FY14 FY15 FY16 FY17 CAGR*
Operating RevenueUP 474,952 560,551 628,219 635,411 574,129 5%SAE 114,934 150,319 185,450 202,822 200,662 15%PEP 137,138 162,848 162,130 165,618 174,392 6%Corporate 2,537 2,255 2,342 4,584 4,321 14%
Total operating revenue 729,561 875,973 978,141 1,008,435 953,504 7%
Expenses (599,559) (731,044) (815,034) (843,854) (798,456) 7%
Underlying EBITDA # 130,002 144,929 163,107 164,581 155,048 5%
Depreciation (15,492) (24,593) (27,318) (30,767) (32,259) 20%
Underlying EBITA # 114,510 120,336 135,789 133,814 122,789 2%
Amortisation (863) (749) (749) (749) (604) -9%
Underlying EBIT # 113,647 119,587 135,040 133,065 122,185 2%
Net Interest (paid)/received (7,590) (6,238) (3,823) (3,998) (5,778) -7%Share of equity accounted JV profits (losses) - - - (974) 271 n/a
Underlying net profit before tax # 106,057 113,349 131,217 128,093 116,678 2%
Income tax (31,006) (32,099) (39,564) (37,330) (50,072) 13%
Underlying NPAT # 75,051 81,250 91,653 90,763 66,606 -3%
Outside equity interest (476) 782 (301) (685) (532) 3%
Underlying NPAT attributable to Navitas # 74,575 82,032 91,352 90,078 66,074 -3%
Statutory NPAT 75,051 50,802 72,111 90,763 80,869 2%Statutory NPAT attributable to members 74,575 51,584 71,810 90,078 80,337 2%
# excluding impairment of goodwill and one off gains* Cumulative Annual Growth Rate from FY13 to FY17

24
ACAP – Australian College of Applied Psychology
AMEP – Adult Migrant English Program
ASX – Australian Securities Exchange
C&I – Careers and Industry
CPS – Cents Per Share
EFS – English and Foundation Skills
EBITDA – Earnings Before Interest Tax, Depreciation and Amortisation
ELICOS – English Language Intensive Courses for Overseas Students
HE – Higher Education
HSA – Health Skills Australia
NCPS – Navitas College of Public Safety
NPAT – Net Profit After Tax
PCP – Prior Corresponding Period
PEP – Professional and English Programs
SAE – School of Audio Engineering, now known as SAE
SAIBT – South Australian Institute of Business and Technology
SEE – Skills for Education and Employment
SSVF – Simplified Student Visa Framework
TEQSA – Tertiary Education Quality Standards Agency
UP – University Partnerships
VET – Vocational Education and Training
VFH – VET FEE-HELP
VSL – VET Student Loan
WACC – Weighted Average Cost of Capital
Glossary
Navitas FY17 Full Year Results Presentation – 30 June 2017

25
Disclaimer• This document has been prepared by Navitas Limited ABN 69 109 613 309 ("Navitas" or the "Company").
Information in this document should be read in conjunction with other Navitas announcements made to theASX and available at www.navitas.com or www.asx.com. By accessing or attending this presentation youacknowledge that you have read, understood and agree with the following statements.
• This document has been prepared for information purposes only and does not take into account yourindividual investment objectives, including the merits and risks involved in an investment in Navitas shares,or your financial situation or particular needs, and is not investment, financial product, legal, tax oraccounting advice or opinion.
• You should make your own independent investigation and assessment of Navitas and its shares and obtainany professional advice you require before making any investment decision based on your investmentobjectives and financial circumstances. An investment in Navitas shares is subject to investment and otherknown and unknown risks, some of which are beyond the control of Navitas, including possible delays inrepayment and loss of income and principal invested. Navitas does not guarantee any particular rate ofreturn or the performance of Navitas, nor does it guarantee the repayment of capital from Navitas or anyparticular tax treatment.
• No representation, warranty or guarantee, express or implied, is made by Navitas, its subsidiaries or theirrespective directors, officers, employees or agents, nor any other person (the “Beneficiaries”) as to thefairness, accuracy, completeness, reliability or correctness of the information, opinions and conclusionscontained in this document (including, without limitation, any estimates, calculations, projections orforward looking statements). No action should be taken on the basis of the information, and no reliancemay be placed for any purpose on the accuracy or completeness of the information or opinions contained inthis document. To the maximum extent permitted by law, the Beneficiaries exclude and disclaim all liability,including, without limitation, any liability arising from fault or negligence, for any direct or indirect loss ordamage which may be suffered by any person through relying on anything contained in or omitted fromthis document.
• The distribution of this document in jurisdictions other than Australia may also be restricted by law and anysuch restrictions should be observed. Any failure to comply with such restrictions may constitute a violationof applicable securities laws.
• This document does not constitute an offer, invitation, solicitation, advice or recommendation with respectto the issue, purchase or sale of Navitas shares in any jurisdiction.
• All references to dollars, cents or $ in this document are to Australian currency, unless otherwise stated.
Navitas FY17 Full Year Results Presentation – 30 June 2017