full year 2018 - vestas/media/vestas/investor/investor...classification: public 5 full year 2018...
TRANSCRIPT

FULL YEAR 2018
Vestas Wind Systems A/S
Copenhagen, 7 February 2019
Classification: Public
2
DISCLAIMER AND CAUTIONARY STATEMENT
This document contains forward-looking statements concerning Vestas’ financial condition, results of operations and business. All statements other
than statements of historical fact are, or may be deemed to be, forward-looking statements. Forward-looking statements are statements of future
expectations that are based on management’s current expectations and assumptions and involve known and unknown risks and uncertainties that
could cause actual results, performance, or events to differ materially from those expressed or implied in these statements.
Forward-looking statements include, among other things, statements concerning Vestas’ potential exposure to market risks and statements
expressing management’s expectations, beliefs, estimates, forecasts, projections and assumptions. A number of factors that affect Vestas’ future
operations and could cause Vestas’ results to differ materially from those expressed in the forward-looking statements included in this document,
include (without limitation): (a) changes in demand for Vestas’ products; (b) currency and interest rate fluctuations; (c) loss of market share and
industry competition; (d) environmental and physical risks, including adverse weather conditions; (e) legislative, fiscal, and regulatory developments,
including changes in tax or accounting policies; (f) economic and financial market conditions in various countries and regions; (g) political risks,
including the risks of expropriation and renegotiation of the terms of contracts with governmental entities, and delays or advancements in the
approval of projects; (h) ability to enforce patents; (i) product development risks; (j) cost of commodities; (k) customer credit risks; (l) supply of
components; and (m) customer created delays affecting product installation, grid connections and other revenue-recognition factors.
All forward-looking statements contained in this document are expressly qualified by the cautionary statements contained or referenced to in this
statement. Undue reliance should not be placed on forward-looking statements. Additional factors that may affect future results are contained in
Vestas’ annual report for the year ended 31 December 2018 (available at www.vestas.com/investor) and these factors also should be considered.
Each forward-looking statement speaks only as of the date of this document. Vestas does not undertake any obligation to publicly update or revise
any forward-looking statement as a result of new information or future events other than as required by Danish law. In light of these risks, results
could differ materially from those stated, implied or inferred from the forward-looking statements contained in this document.
Full year 2018 (Public)

Classification: Public
3
KEY HIGHLIGHTS
Financial and operational results
• Highest ever order intake of 14.2 GW across 43 countries; up 27 percent compared to 2017
• All-time high combined order backlog of more than EUR 26bn
• FY 2018 guidance met on all parameters; revenue of EUR 10.1bn, EBIT margin before special items of
9.5 percent, FCF of EUR 418m*, and net investments of EUR 603m*
• Organic growth of 13 percent in Service compared to 2017; EBIT margin of 25 percent
• MHI Vestas breaking even on net profit
• 25 percent improvement on safety performance; total recordable injuries down to 4.0
• Recommended dividend payment of DKK 7.44 per share, equal to a payout ratio of 30.0 percent
Profitable growth strategy firmly on track
• Vestas strengthened its leadership position in a transitioning market
Full year 2018 (Public)
*Excl. the acquisition of Utopus Insights, Inc., any investments in marketable securities, and short-term financial investments.

Classification: Public
Full year 2018 (Public)4
Orders and markets
Financials
Strategy
Outlook and Q&A
AGENDA
Classification: Public
Full year 2018 (Public)5
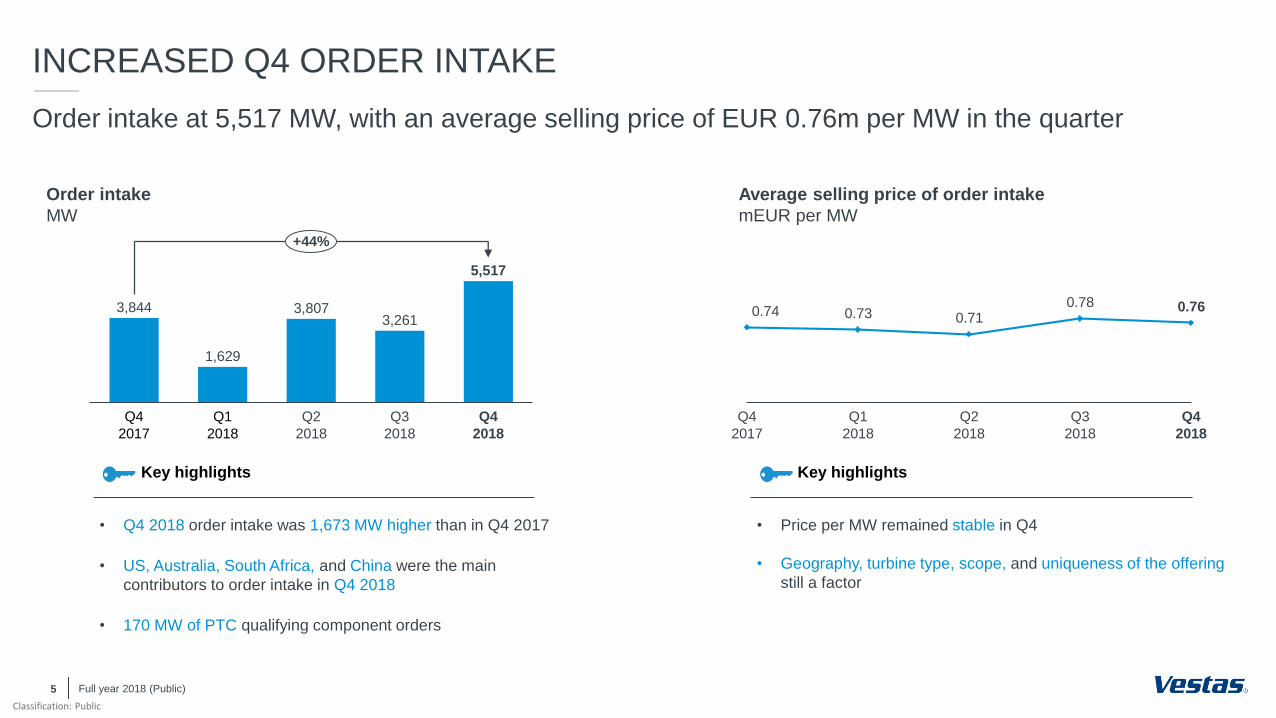
INCREASED Q4 ORDER INTAKE
Order intake at 5,517 MW, with an average selling price of EUR 0.76m per MW in the quarter
Q1
2018
Q4
2017
Q2
2018
Q3
2018
Q4
2018
3,844
1,629
3,8073,261
5,517
+44%
Average selling price of order intake
mEUR per MW
Q3
2018
0.740.78
Q4
2017
0.73
Q1
2018
0.71
Q2
2018
0.76
Q4
2018
• Q4 2018 order intake was 1,673 MW higher than in Q4 2017
• US, Australia, South Africa, and China were the main
contributors to order intake in Q4 2018
• 170 MW of PTC qualifying component orders
Key highlights
• Price per MW remained stable in Q4
• Geography, turbine type, scope, and uniqueness of the offering
still a factor
Key highlights
Order intake
MW

Classification: Public
GLOBAL REACH
6
Order intake from 43 countries highlights unique global reach and strong global demand
USA
Argentina
Mexico
Canada
Scandinavia
Finland
Sweden
Denmark
Norway
Northern Europe
United Kingdom
Netherlands
Belgium
Ireland
Southern
Europe
France
Turkey
Italy
Greece
Spain
Central
Europe
Germany
Austria
Poland
Ukraine
Czech Rep.
Serbia
Australia
China
India
South Korea
Russian Fed.
Thailand
Chile
Kazakhstan
Jordan
Bolivia
Dominican Rep.
Brazil
Senegal
South Africa
Sri Lanka
Full year 2018 (Public)
Peru Panama
Japan
Taiwan
Vietnam
First orders ever in:
• Senegal
• Panama
• Bolivia
• Kazakhstan

Classification: Public
Full year 2018 (Public)7
ORDER INTAKE
Highest-ever order intake in all regions totalling 14.2 GW; up 27 percent compared to 2017
FY
1,694
5,006 4,4766,271
2,344
5,599
FY FY
+25%+25%
+38%
2017
2018
Americas
MW
EMEA
MW
Asia Pacific
MW
• Increasing order intake in the
US and Brazil
• Argentina, Canada, and
Mexico remained at high
level
• Strong development in South
Africa and Norway more than
offsetting decline in Germany
• High order intake in Sweden
and France continued
• Australia driving the
increase with more than
1 GW in order intake
• Diverse order intake from
nine different countries
underlines region’s potential

Classification: Public
Full year 2018 (Public)8
DELIVERIES
Increasing deliveries in all regions
860
FYFY
3,856 4,1284,996
4,063
FY
1,723
+30%
+2%
+100%
2017
2018
Americas
MW
EMEA
MW
Asia Pacific
MW
• FY 2018 increase driven by
Mexico and Argentina
• US deliveries remained at
high level
• Increased deliveries in
Scandinavia offsetting decline
in Germany
• France and Italy deliveries at
high level
• Strong development in
Australia, India, and
Thailand
• Lower level of deliveries in
China
Classification: Public
* Compared to FY 2017.
9
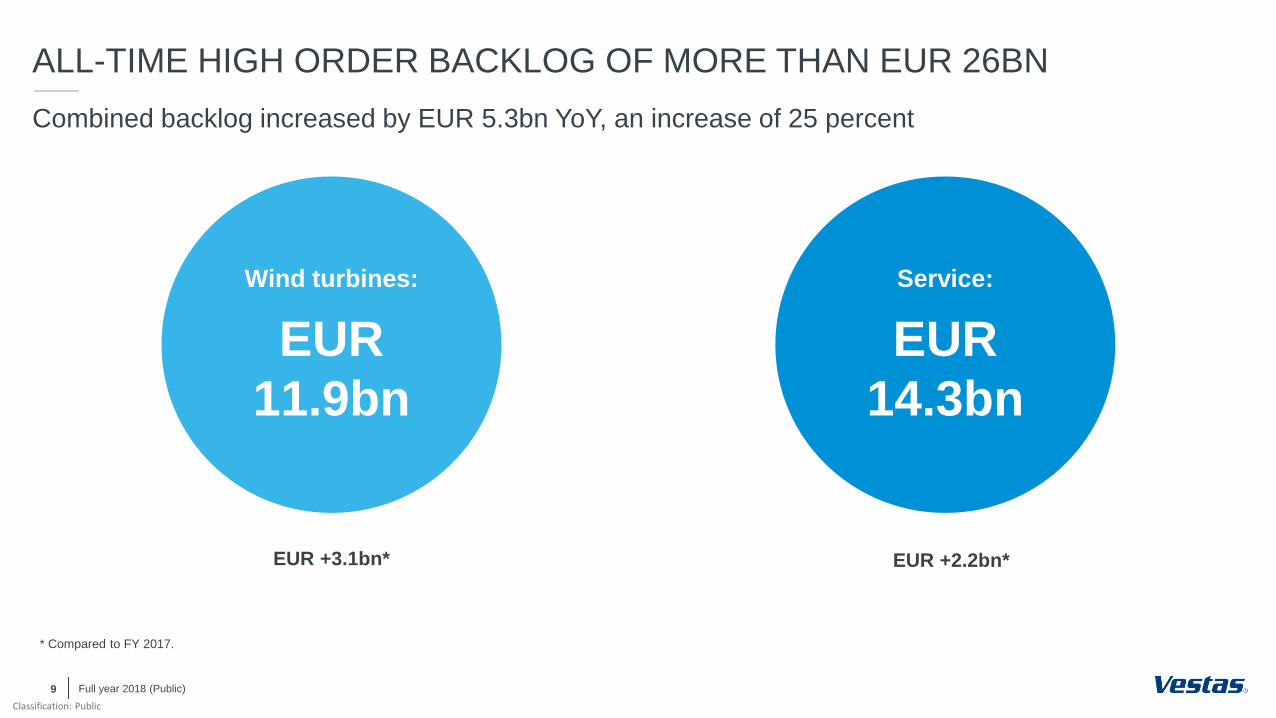
ALL-TIME HIGH ORDER BACKLOG OF MORE THAN EUR 26BN
Combined backlog increased by EUR 5.3bn YoY, an increase of 25 percent
Wind turbines:
EUR
11.9bn
Service:
EUR
14.3bn
EUR +3.1bn* EUR +2.2bn*
Full year 2018 (Public)

Classification: Public
10
MHI VESTAS OFFSHORE WIND
Ramping up in core and new markets as order book increases
• Firm order intake of 3,180 MW; all based on the industry-leading V164 turbine,
which during the year was upgraded to a nominal rating of 10 MW
• Preferred supplier agreement for the 800 MW Vineyard Wind project – the first
utility scale offshore wind project in the US
• Secured a strong position in Taiwan with 900 MW in preferred supplier
agreements
~3.8
GWUnder installation/
unconditional orders
~3.8
GW
> 1.000 turbines installed
across 28 projects
Track record… Key highlights
Pipeline…
~1.7
GW
Conditional orders/
preferred supplier
7 February, 2019
Near-term project execution
Norther (BE)
370 MW
V164-8.4 MW
Projects currently in progress
Borkum Riffgrund
(DE)
450 MW
V164-8.3 MW
Horns Rev 3 (DK)
406 MW
V164-8.3 MW
Full year 2018 (Public)

Classification: Public
Full year 2018 (Public)11
Orders and markets
Financials
Strategy
Outlook and Q&A
AGENDA

Classification: Public
INCOME STATEMENT – FULL YEAR
12
Increased competition impacting profitability
Full year 2018 (Public)
mEUR FY 2018 FY 2017* % change
Revenue 10,134 9,953 2%
Production costs (8,503) (7,990) (6)%
Gross profit 1,631 1,963 (17)%
SG&A costs** (672) (733) 8%
EBIT before special items 959 1,230 (22)%
Income from investments in
associates and joint ventures40 (40) 200%
Net profit 683 894 (24)%
Gross margin 16.1% 19.7% (3.6)%-pts
EBITDA margin before special
items13.8% 16.6% (2.8)%-pts
EBIT margin before special items 9.5% 12.4% (2.9)%-pts
• Revenue up 2 percent compared to 2017; mainly driven by
increased revenue in Service, partly offset by lower prices in
Power solutions
• Gross profit down by 3.6 percentage points, mainly driven by
lower average margins in Power solutions
• EBIT margin before special items down by 2.9 percentage
points, mainly driven by lower gross profit
• Result from JVs at EUR 40m; EUR 13m in stand-alone profit,
and EUR 26m from delivery of 3 MW turbines
Key highlights
*Refer to note 7.3, Changes in accounting policies and disclosures, Annual report 2018
**R&D, administration, and distribution
Classification: Public
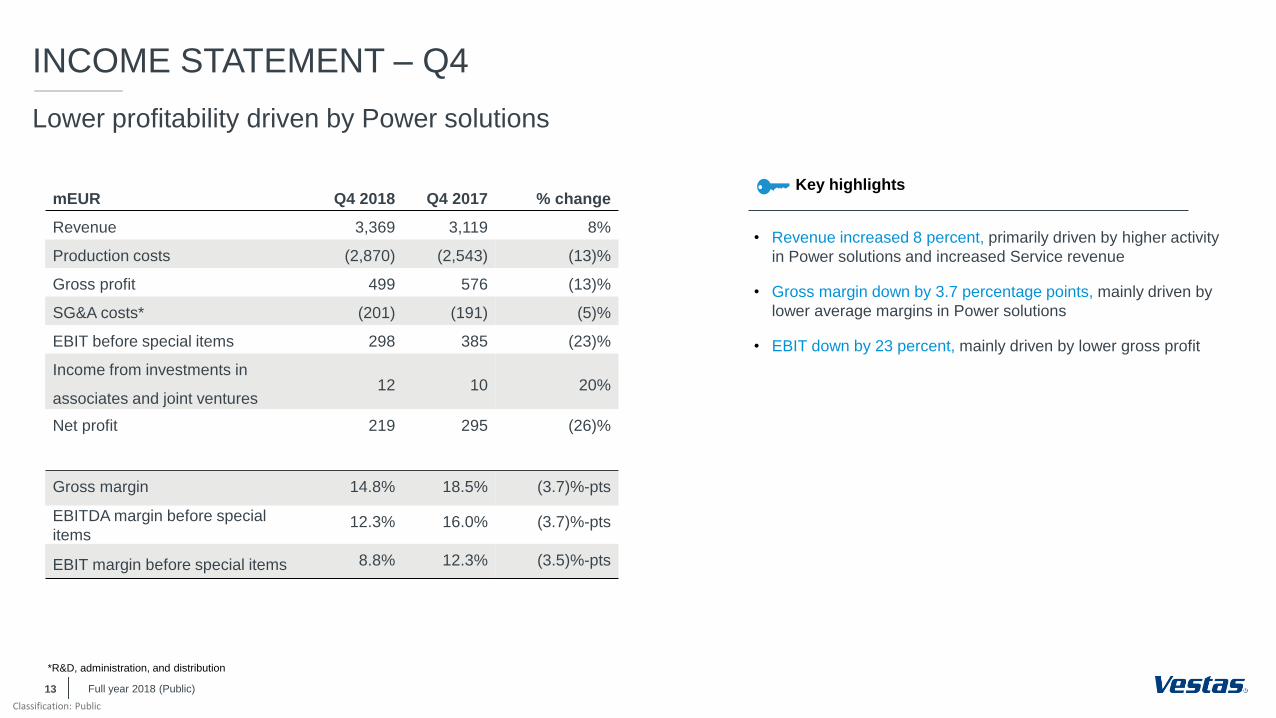
INCOME STATEMENT – Q4
13
Lower profitability driven by Power solutions
mEUR Q4 2018 Q4 2017 % change
Revenue 3,369 3,119 8%
Production costs (2,870) (2,543) (13)%
Gross profit 499 576 (13)%
SG&A costs* (201) (191) (5)%
EBIT before special items 298 385 (23)%
Income from investments in
associates and joint ventures12 10 20%
Net profit 219 295 (26)%
Gross margin 14.8% 18.5% (3.7)%-pts
EBITDA margin before special
items12.3% 16.0% (3.7)%-pts
EBIT margin before special items 8.8% 12.3% (3.5)%-pts
• Revenue increased 8 percent, primarily driven by higher activity
in Power solutions and increased Service revenue
• Gross margin down by 3.7 percentage points, mainly driven by
lower average margins in Power solutions
• EBIT down by 23 percent, mainly driven by lower gross profit
Key highlights
Full year 2018 (Public)
*R&D, administration, and distribution

Classification: Public
SG&A COSTS
14
SG&A costs under control
SG&A costs (TTM)*
EURm
705 709692 705
733 722
674 662 672
Q2
2017
Q3
2018
6.9%
Q1
2017
Q4
2016
Q4
2018
6.7%6.6% 6.9%
Q3
2017
7.4%
Q4
2017
7.4%
Q1
2018
6.9%
Q2
2018
6.7% 6.6%
0.8 %-pts• SG&A down YoY
• Relative to activity levels, SG&A costs amounted to 6.6 percent
– a decrease of 0.8 percentage points compared to Q4 2017,
primarily driven by distribution and administration costs
Key highlights
Full year 2018 (Public)
* R&D, administration, and distribution on trailing 12 months basis

Classification: Public
SERVICE
15
Strong service performance
Service revenue and EBIT margin, onshore
EURm and percent
964
1.138
1.309
1.522
1.669
17%
FY
2014
FY
2016
18% 18%
FY
2017
FY
2015
20%
25%
FY
2018
10%
• Service revenue increased by 10 percent compared to 2017,
mainly driven by higher activity levels; FX headwind of EUR
54m, resulting in 13 percent organic growth
• 2018 EBIT: EUR 421m
2018 EBIT margin: 25.2 percent
• Q4 2018 revenue: EUR 481m, up 16 percent YoY
Q4 2018 EBIT Margin: 24.7 percent
Key highlights
Full year 2018 (Public)

Classification: Public
Assets (mEUR) FY 2018 FY 2017* Abs. change % change
Non-current assets 3,344 2,865 479 17%
Current assets 8,555 8,006 549 7%
Total assets 11,899 10,871 1,028 9%
Liabilities (mEUR)
Equity 3,104 3,112 (8) (0)%
Non-current liabilities 1,390 1,226 164 13%
Current liabilities 7,405 6,533 868 13%
Total equity and liabilities 11,899 10,871 1,028 9%
Key figures (mEUR)
Interest bearing position (net) 3,046 3,359 (313) (9)%
Net working capital (2,040) (1,984) (56) 3%
Solvency ratio (%) 26.1 28.6 - (2.5)%-pts
ROCE (%) 20.4 25.1 - (4.7)%-pts
BALANCE SHEET
16
Balance sheet remains strong
Full year 2018 (Public)
• Continued strong cash position of EUR 3,046m
• ROCE of 20.4 percent driven by lower operating profit
Key highlights
* Refer to note 7.3, Changes in accounting policies and disclosures, Annual report 2018

Classification: Public
17
CHANGE IN NET WORKING CAPITAL
Satisfactory net working capital management
Other
liabilities
Receiv-
ables
NWC end
2017
243(33)
Contract
assets /
liabilities
Inventories
and contract
costs
619
(1,984)
(872)
Payables
(13)
NWC end
2018
(2,040)
NWC change over the last 12 months*
mEUR
Full year 2018 (Public)
* Refer to note 7.3, Changes in accounting policies and disclosures, Annual report 2018
• Improvement driven by higher down- and milestone payments
partly driven by strong order intake, especially in Q4
• Higher level of inventory to cater for increased activity expected
in 2019
Key highlights

Classification: Public
CASH FLOW STATEMENT – FULL YEAR
18
Underlying free cash flow of EUR 418m
Full year 2018 (Public)
• Free cash flow was in line with the updated outlook of approx.
EUR 400m disclosed on 9 January 2019
• Decline in free cash flow primarily driven by lower net profit and
higher investments
• Net working capital impacted by non-cash adjustments and
exchange rate adjustments with a total amount of net EUR
(225)m
Key highlights
* Refer to note 7.3, Changes in accounting policies and disclosures, Annual report 2018
** Change in net working capital in FY 2018 impacted by non-cash adjustments and exchange rate adjustments with a total amount of net EUR (225)m
*** Before investments in marketable securities and short-term financial investments
mEUR FY 2018 FY 2017* Abs. change
Cash flow from operating activities
before change in net working capital 1,190 1,461 (271)
Change in net working capital** (169) 164 (333)
Cash flow from operating activities 1,021 1,625 (604)
Cash flow from investing activities*** (603) (407) (196)
Free cash flow before financial
investments*** 418 1,218 (800)
Acquisition of subsidiaries (65) - (65)
Purchase of financial investments (422) - (422)
Free cash flow (69) 1,218 (1,287)
Cash flow from financing activities (639) (974) 335

Classification: Public
TOTAL INVESTMENTS
19
Total investments in line with expectations
Total investments*
EURm
285
370
512 506
603
55
65
83
6%
4%4%5%
FY
2014
22
FY
2015
FY
2016
(99)
FY
2017
6%
FY
2018
425
617
407
668
+97
• Underlying investments increased approx. EUR 100m in order
to meet strong demand for 2019 and new product launches
• Total investments increased by EUR 261m further driven by
sale of office buildings in Aarhus in 2017, and acquisition of
Utopus Insights, Inc. in 2018.
Key highlights
Full year 2018 (Public)
* Before investments in marketable securities and short-term financial investments.
Percent of revenue
Service acquisitions Cashflow from investing activity*
Other acquisitions and divestments

Classification: Public
20
WARRANTY PROVISIONS AND LOST PRODUCTION FACTOR
Warranty consumption and LPF continue at a low level
Lost Production Factor (LPF)
Percent
• Warranty consumption increased, reflecting higher
activity
• Warranty provisions made correlates with revenue in the
quarter, corresponding to 1.6 percent in Q4 2018
Key highlights
• LPF continues at a low level – below 2.0
• LPF measures potential energy production not captured
by Vestas’ wind turbines
Key highlights
Warranty provisions made and consumed
mEUR
Full year 2018 (Public)
55
27
3744
53
43 4136
41
50
Q1
2018
Q2
2018
Q4
2017
Q3
2018
Q4
2018
Provisions consumed
Provisions made
0
1
2
3
4
5
6
Dec
2012
Dec
2013
Dec
2009
Dec
2015
Dec
2011
Dec
2010
Dec
2014
Dec
2016
Dec
2017
Dec
2018

Classification: Public
21
CAPITAL STRUCTURE
Net debt to EBITDA well below threshold
Solvency ratio*
Percent
• Net debt to EBITDA remains at low level of (2.2) in Q4
2018
Key highlights
• Solvency ratio of 26.1 percent in Q4 2018
• Low level primarily driven by share buy-back
programmes
Key highlights
Net debt to EBITDA before special items*
mEUR
Full year 2018 (Public)
Q4
2017
(2.0)
Q3
2018
Q1
2018
(1.2)(1.7)
Q2
2018
(1.3)
(2.2)
<1.0
Q4
2018
Net debt to EBITDA, last 12 months
Net debt to EBITDA, financial target
20
25
30
35
40
Q3
2018
Q1
2018
28.6
Q4
2018
Q4
2016
25.927.6
25.9
Q2
2018
26.1
25.0
Solvency ratio
* Refer to note 7.3, Changes in accounting policies and disclosures, Annual report 2018

Classification: Public
CAPITAL ALLOCATION
Total distribution to shareholders reaches EUR 607m
22
• For 2018, the Board recommends to the AGM to pay out a
dividend of DKK 7.44 per share – corresponding to 30.0
percent of the net result for the year
• During 2018, Vestas completed two share buy-back
programmes of EUR 402m in total
Key highlightsEURm FY 2018 FY 2017 FY 2016
Dividend per share (DKK)* 7.44 9.23 9.71
Dividend per share (EUR)* 1.00 1.24 1.31
Dividend payout ratio* 30.0 29.9 30.0
Dividend based on net results (mEUR)** 205 267 289
Share buy-back programme (mEUR) 402 694 401
Total distribution (mEUR)* 607 961 690
Full year 2018 (Public)
*Based on proposed dividend.
**Based on shares issued at year end.
Classification: Public
Full year 2018 (Public)23
Orders and markets
Financials
Strategy
Outlook and Q&A
AGENDA
Classification: Public
24
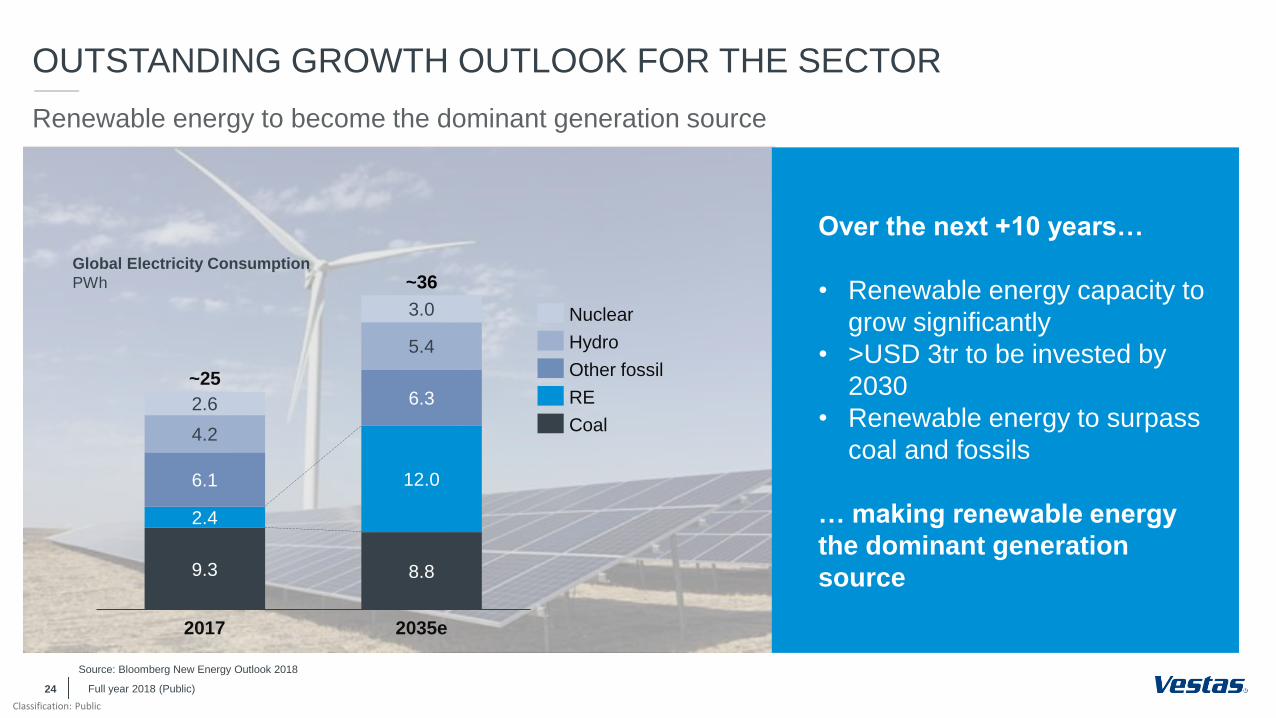
OUTSTANDING GROWTH OUTLOOK FOR THE SECTOR
5.4
9.3
12.0
2.6
2017
4.2
3.0
6.1
2.4
6.3
8.8
2035e
~25
~36
Source: Bloomberg New Energy Outlook 2018
Over the next +10 years…
• Renewable energy capacity to
grow significantly
• >USD 3tr to be invested by
2030
• Renewable energy to surpass
coal and fossils
… making renewable energy
the dominant generation
source
Nuclear
Coal
RE
Hydro
Other fossil
Renewable energy to become the dominant generation source
Global Electricity Consumption
PWh
Full year 2018 (Public)
Classification: Public
25
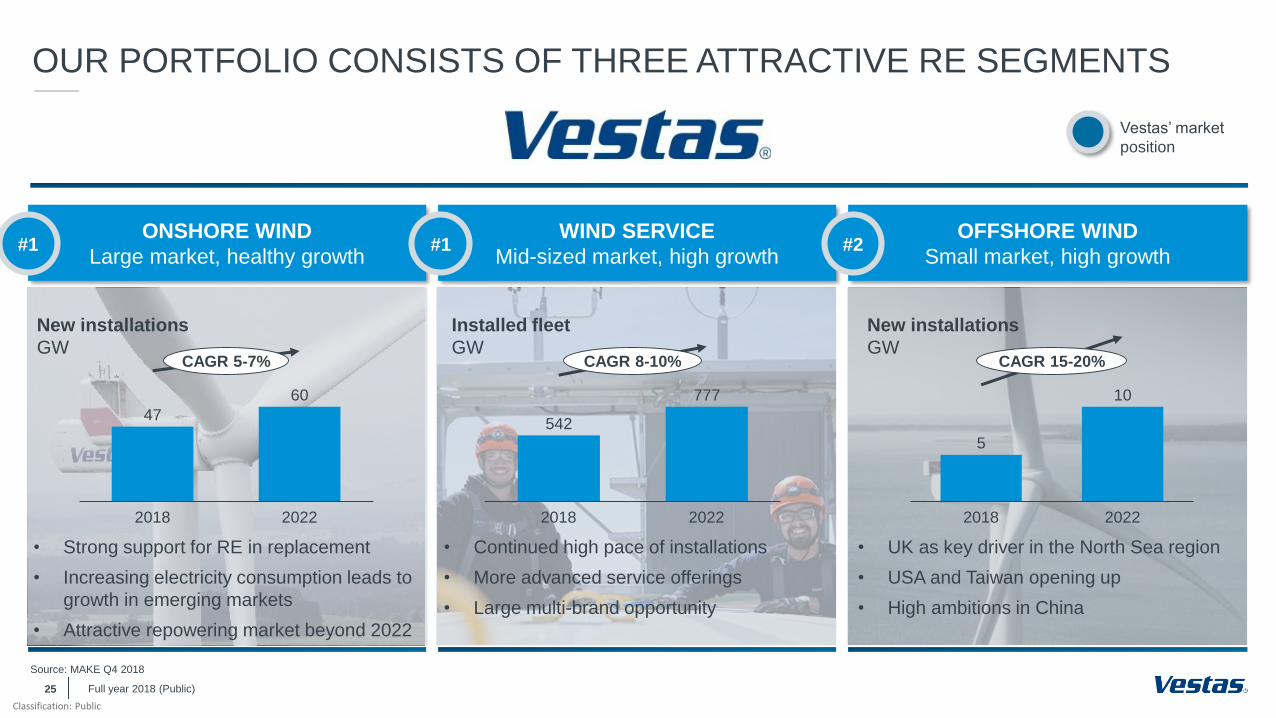
OUR PORTFOLIO CONSISTS OF THREE ATTRACTIVE RE SEGMENTS
#1 ONSHORE WIND
Large market, healthy growth
WIND SERVICE
Mid-sized market, high growth
OFFSHORE WIND
Small market, high growth
New installations
GW
Installed fleet
GW
New installations
GW
• Strong support for RE in replacement
• Increasing electricity consumption leads to
growth in emerging markets
• Attractive repowering market beyond 2022
• Continued high pace of installations
• More advanced service offerings
• Large multi-brand opportunity
• UK as key driver in the North Sea region
• USA and Taiwan opening up
• High ambitions in China
Source: MAKE Q4 2018
#1 #1 #2
Vestas’ market
position
Full year 2018 (Public)
47
60
2018 2022
CAGR 5-7%
542
777
2018 2022
CAGR 8-10%
5
10
2018 2022
CAGR 15-20%

Classification: Public
26
WE HAVE FOUR KEY DIFFERENTIATORS IN THIS MARKET
Global reach
Technology
and service
leadership
ScaleProven
execution
Full year 2018 (Public)

Classification: Public
Expanding number of
variants, lowering number of
components
Increased opportunities to build supplier partnerships
Enabling more customised solutions to
match customer needs
More standardised components
enable efficiency and scale
27
NEXT STEP: ADVANCED MODULAR DESIGN
Full year 2018 (Public)
Modularity enhances the flexibility of our solutions, while maintaining benefits of scale

Classification: Public
Starting with V150-5.6 MW and V162-5.6 MW offering significant output increase
28
INTRODUCING TWO NEW VARIANTS
Full year 2018 (Public)
V150-4.2 MW™
Annual Energy Production*
* Average wind speed at same HH, standard site characteristics: k = 2; ρ = 1.225 Kg/m3
V150-5.6 MW™
V136-4.2 MW™
6,5 m/s 7,5 m/s 8,5 m/s
+29% +30% +30%
7,5 m/s6,5 m/s 8,5 m/s
+24% +26% +27%
V162-5.6 MW™
Classification: Public
29
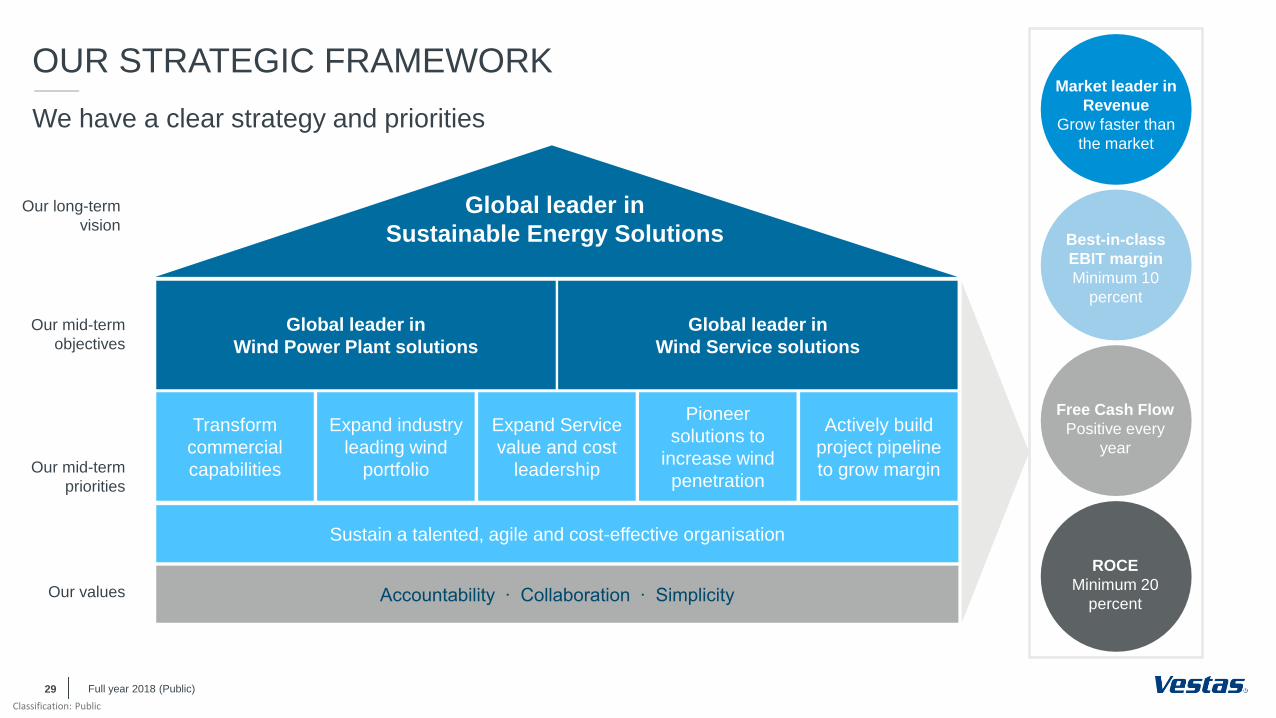
OUR STRATEGIC FRAMEWORK
We have a clear strategy and priorities
Global leader in
Wind Power Plant solutions
Global leader in
Wind Service solutions
Our mid-term
objectives
Global leader in
Sustainable Energy Solutions
Our long-term
vision
Transform
commercial
capabilities Our mid-term
priorities
Our values
Expand industry
leading wind
portfolio
Expand Service
value and cost
leadership
Pioneer
solutions to
increase wind
penetration
Actively build
project pipeline
to grow margin
Sustain a talented, agile and cost-effective organisation
Accountability ∙ Collaboration ∙ Simplicity
Market leader in
Revenue
Grow faster than
the market
Best-in-class
EBIT margin
Minimum 10
percent
Free Cash Flow
Positive every
year
Full year 2018 (Public)
ROCE
Minimum 20
percent

Classification: Public
30
MARKET LEADERSHIP
Summarising our market-leading position
Note: Consolidation of Vestas and Vestas’ proportionate share of MHI Vestas financial and operational figures per 31 December 2018. Combined market share for Vestas and MHI Vestas is based on
MAKE 2017 market share statistics.
Backlog:
EUR
30bn
• Annual order intake of almost
16 GW
• Largest installed base of more
than 100 GW
• More than 90 GW under service
EBIT:
EUR
1bn
• Best-in-class margins
• Largest R&D investments in
the industry
• Modular design enabling
flexibility and benefits of scale
Revenue:
EUR
11bn
• Grow faster than the market
• Leading market share of 16
percent
Full year 2018 (Public)

Classification: Public
Full year 2018 (Public)31
Orders and markets
Financials
Strategy
Outlook and Q&A
AGENDA

Classification: Public
32
OUTLOOK 2019
Outlook
Revenue (bnEUR)
- Service is expected to grow approx. 10 percent10.75 - 12.25
EBIT margin before special items (%)
- Service margin is expected to be approx. 24 percent8 - 10
Total investments (mEUR)(Excl. any investments in marketable securities and short-term financial investments)
approx. 700
Full year 2018 (Public)
The 2019 outlook is based on current foreign exchange rates

Classification: Public07.02.201933
Q&A
Financial calendar 2019:
• Annual General Meeting in Aarhus (3 April)
• Disclosure of Q1 2019 (8 May)
• Disclosure of Q2 2019 (15 August)
• Disclosure of Q3 2019 (7 November)
Full year 2018 (Public)

Copyright NoticeThe documents are created by Vestas Wind Systems A/S and contain copyrighted material, trademarks, and other proprietary information. All rights reserved. No part of the documents may be reproduced or copied in any form or by any means - such as graphic, electronic, or mechanical, including photocopying, taping, or information storage and retrieval systems without the prior written permission of Vestas Wind Systems A/S. The use of these documents by you, or anyone else authorized by you, is prohibited unless specifically permitted by Vestas Wind Systems A/S. You may not alter or remove any trademark, copyright or other notice from the documents. The documents are provided “as is" and Vestas Wind Systems A/S shall not have any responsibility or liability whatsoever for the results of use of the documents by you.
THANK YOU FOR YOUR ATTENTION