full spectrum crashworthiness criteria for rotorcraft
TRANSCRIPT

RDECOM TR 12-D-12 U.S. ARMY RESEARCH, DEVELOPMENT & ENGINEERING COMMAND
TITLE Full Spectrum Crashworthiness Criteria for Rotorcraft
AUTHORS Akif Bolukbasi, John Crocco, Charles Clarke, Edwin Fasanella, Karen
Jackson, Paul Keary, Lance Labun, Peter Mapes, Joe McEntire, Joseph Pellettiere, Bryan Pilati, Fred Rumph, Jon Schuck, Michael Schultz, Michael Smith, Debra Vasquez
ORGINIZATION NAME Aviation Applied Technology Directorate COMPANY ADDRESS 401 Lee Blvd. Ft. Eustis, VA 23604 DATE December 2011 FINAL REPORT
DISTRIBUTION STATEMENT
Prepared by
U.S. ARMY RESEARCH, DEVELOPMENT & ENGINEERING COMMAND AVIATION APPLIED TECHNOLOGY DIRECTORATE FORT EUSTIS, VA 23604-5577
DISTRIBUTION STATEMENT A
Approved for Public Release. Distribution Unlimited.

REPORT DOCUMENTATION PAGE Form Approved OMB No. 0704-0188
Public reporting burden for this collection of information is estimated to average 1 hour per response, including the time for reviewing instructions, searching existing data sources, gathering and maintaining the data needed, and completing and reviewing this collection of information. Send comments regarding this burden estimate or any other aspect of this collection of information, including suggestions for reducing this burden to Department of Defense, Washington Headquarters Services, Directorate for Information Operations and Reports (0704-0188), 1215 Jefferson Davis Highway, Suite 1204, Arlington, VA 22202-4302. Respondents should be aware that notwithstanding any other provision of law, no person shall be subject to any penalty for failing to comply with a collection of information if it does not display a currently valid OMB control number. PLEASE DO NOT RETURN YOUR FORM TO THE ABOVE ADDRESS.
1. REPORT DATE (DD-MM-YYYY)
Dec 2011 2. REPORT TYPE
Final Report 3. DATES COVERED (From - To)
Sep. 2007 – Dec 2011 4. TITLE AND SUBTITLE
Full Spectrum Crashworthiness Criteria for Rotorcraft
5a. CONTRACT NUMBER
5b. GRANT NUMBER
5c. PROGRAM ELEMENT NUMBER
6. AUTHOR(S)
Akif Bolukbasi, John Crocco, Charles Clarke, Edwin Fasanella, Karen Jackson, Paul
Keary, Lance Labun, Peter Mapes, Joe McEntire, Joseph Pellettiere, Bryan Pilati, Fred
Rumph, Jon Schuck, Michael Schultz, Michael Smith, Debra Vasquez
5d. PROJECT NUMBER
5e. TASK NUMBER
5f. WORK UNIT NUMBER
7. PERFORMING ORGANIZATION NAME(S) AND ADDRESS(ES)
Aviation Applied Technology Directorate
6900 Main Street AND ADDRESS(ES)
8. PERFORMING ORGANIZATION REPORT NUMBER
401 Lee Blvd.
Ft. Eustis, VA 23604
9. SPONSORING / MONITORING AGENCY NAME(S) AND ADDRESS(ES) 10. SPONSOR/MONITOR’S ACRONYM(S)
Aviation Applied Technology Directorate AATD
Building 401, Lee Blvd
Attn: RDMR-AAF 11. SPONSOR/MONITOR’S REPORT
Fort Eustis, VA 23604-5577 NUMBER(S)
RDECOM TR 12-D-12 12. DISTRIBUTION / AVAILABILITY STATEMENT
Approved for Public Release, Distribution Unlimited.
13. SUPPLEMENTARY NOTES
14. ABSTRACT
The purpose of this document is to establish full-spectrum crashworthiness criteria for implementation starting in the initial stages of system design for a wide range of rotorcraft classes, types, configurations, and operating conditions that continue over the life cycle of the rotorcraft system. These criteria will identify the key components that contribute to a system’s crashworthiness and will provide a quantitative measure of crashworthy performance that is relevant to user needs and future operating environments.
15. SUBJECT TERMS
helicopter, crashworthiness, protection, survivability, full spectrum criteria
16. SECURITY CLASSIFICATION OF:
17. LIMITATION OF ABSTRACT
18. NUMBER OF PAGES
19a. NAME OF RESPONSIBLE PERSON
Mr. John Crocco
a. REPORT
UNCLASSIFIED b. ABSTRACT
UNCLASSIFIED c. THIS PAGE
UNCLASSIFIED
SAR
162
19b. TELEPHONE NUMBER (include area
code)
757-878-3008
Standard Form 298 (Rev. 8-98) Prescribed by ANSI Std. Z39.18

Full Spectrum Crashworthiness Criteria October 2011 Page 1
TABLE OF CONTENTS
1. SCOPE ................................................................................................................................................ 5
2. APPLICABLE DOCUMENTS ......................................................................................................... 6
3. DEFINITIONS .................................................................................................................................. 7
4. APPLICABILITY OF CRITERIA ................................................................................................... 9
5. RESEARCH SUPPORTING A CRASH INDEX APPROACH .................................................... 9
6. REQUIREMENTS .......................................................................................................................... 95
7. CRASH INDEX EXAMPLE CALCULATION ........................................................................... 119
8. MOST RECENT ROTORCRAFT CRASH DATA ANALYSIS .............................................. 139
APPENDIX A: ACRONYMS AND ABBREVIATIONS ................................................................... 154
APPENDIX B: WORKS CITED ........................................................................................................ 155

Full Spectrum Crashworthiness Criteria October 2011 Page 2
LIST OF FIGURES Figure 5-1: Generic Rotorcraft Design Type Taxonomy ............................................... 10 Figure 5-2: Generic Rotorcraft Types and Key Crashworthiness Design Dimensions . 10 Figure 5-3: Coordinate system for seated human occupant .......................................... 15 Figure 5-4: Human tolerance limits to uniform acceleration along the -Z-axis (eyeballs
down). .................................................................................................................... 18 Figure 5-5: Spinal injury rate correlated to DRI for ejections from military fighters. ...... 19 Figure 5-6: Impact surface distribution from Army and Navy mishap data ................... 31 Figure 5-7: MIL-STD-1290 pitch / roll envelope (green) versus expanded envelope
(blue) ...................................................................................................................... 32 Figure 5-8: Pitch angles from mishap data. MIL-STD-1290A requirements (green)
versus expanded envelope (blue) .......................................................................... 33 Figure 5-9: Roll angles from mishap data. MIL-STD-1290A requirements (green)
versus expanded envelope (blue) .......................................................................... 33 Figure 5-10: Assessing the Value of a Vertical Crash Capability ................................. 35 Figure 5-11: Longitudinal Velocity for Pilot and Co-Pilot Egress .................................. 37 Figure 5-12: Longitudinal Velocity for Cabin Length Retention .................................... 38 Figure 5-13: Lateral Velocity for Cockpit/Cabin Width Retention .................................. 39 Figure 5-14: FSC Mishap Statistics for an 8-Degree Flight Path .................................. 40 Figure 5-15: Emergency Egress Timeline for a Water Crash ....................................... 49 Figure 5-16: Analytical Tool Readiness Level. Reprinted from Reference [41]. ........... 54 Figure 5-17: Comparison of piezo-resistive and piezo-electric accelerometers mounted
together in drop test. .............................................................................................. 57 Figure 5-18: Electrical anomalies in dynamic load cell data ......................................... 59 Figure 5-19: Lumbar load cell data filtered with 60 Hz low-pass filter .......................... 59
Figure 5-20: Unfiltered dummy pelvis acceleration with electrical anomalies ............... 60 Figure 5-21: Accelerometer data that has over-ranged the amplifiers .......................... 61 Figure 5-22: Plot of vertical raw acceleration data ....................................................... 62 Figure 5-23: Velocity obtained from integrating the raw acceleration trace in Figure
5-22. ....................................................................................................................... 63 Figure 5-24: Acceleration data filtered with 2-pole Butterworth low-pass digital filters
with frequencies ranging from 10- to 80-Hz ........................................................... 64 Figure 5-25: Acceleration data filtered with 2-pole Butterworth low-pass digital filters
with frequencies of 5, 10, 20, and 80-Hz. Note that the 5 Hz filter distorts the pulse shape. .................................................................................................................... 65
Figure 5-26: Velocity responses obtained from integrating the raw data, and integrating the filtered 10- and 5-Hz acceleration data. .......................................... 66
Figure 5-27: Stress versus volumetric crush for a foam material exhibiting a tensile cut-off stress, an exponential unloading curve, and a large exponential bottoming-out stress. .............................................................................................................. 73
Figure 5-28: 200-Hz filtered acceleration responses of Node 3572 (left) and Node 3596 (right). ............................................................................................................ 79
Figure 5-29: 125-Hz filtered acceleration responses of Node 3572 (left) and Node 3596 (right). ............................................................................................................ 79
Figure 5-30: 40-Hz filtered acceleration responses of Node 3572 (left plot) and Node 3596 (right plot). ..................................................................................................... 79

Full Spectrum Crashworthiness Criteria October 2011 Page 3
Figure 5-31: USDA Soil Texture Triangle ..................................................................... 91
Figure 5-32: North Atlantic and North Pacific Cumulative Probability of Sea State ...... 92 Figure 5-33: Comparison of Rigid Surface and Soft Soil Velocity Statistics for Direct to
Terrain .................................................................................................................... 93 Figure 6-1: Pitch and roll capability weighted factor ................................................... 104 Figure 6-2: Score (Vsurface) for vertical impact capability on each surface type
(Vsurface) ................................................................................................................ 104 Figure 6-3: High impact angle capability versus score ............................................... 105 Figure 6-4: Longitudinal Velocity capability for Pilot and Co-Pilot Egress versus score105 Figure 6-5: Longitudinal Velocity for Cabin Retention capability versus score ........... 106 Figure 6-6: Lateral impact capability versus score ..................................................... 106 Figure 6-7: Low angle impact capability versus score ................................................ 107 Figure 6-8: Full-scale crash tests at YPG for impact test of a Huey onto water and soil111
Figure 6-9: Illustration of full-scale crash test approach. Reprinted from Reference [88]. ...................................................................................................................... 112
Figure 6-10: Schematic of the LandIR Facility. ........................................................... 113 Figure 6-11: KRASH model and test-analysis comparison for the main transmission
mass. Reprinted from Reference [95]. ................................................................. 115 Figure 6-12: MD-500 helicopter with crushable honeycomb FEM and pre-test
photograph. .......................................................................................................... 117 Figure 7-1: Trend of capability versus score weight (Cockpit) .................................... 127 Figure 7-2: Trend of capability versus score weight (Cabin) ..................................... 127 Figure 7-3: Cabin example and lateral impact example ............................................. 128 Figure 8-1: Sample Section of Accident Mishap Report ............................................ 141 Figure 8-2: Comparison of flight path angle for obstacle (IT-T&TA) and non-obstacle
(T) crashes ........................................................................................................... 143 Figure 8-3: Comparison of vertical velocity for obstacle (IT-T&TA) and non-obstacle (T)
crashes ................................................................................................................ 143 Figure 8-4: Example of impact severity plot ............................................................... 145 Figure 8-5: Example of a damage map ...................................................................... 146
LIST OF TABLES Table 5-1: Generic Rotorcraft Types and Key Crashworthiness Design Dimensions ... 11 Table 5-2: Vertical Sink Rate Capabilities .................................................................... 11
Table 5-3: Load Factor and Efficiency Assumptions .................................................... 11 Table 5-4: Representative Static Crash Load Criteria .................................................. 24
Table 5-5: ADS-11B assessment areas and scores ..................................................... 26 Table 5-6: FSC assessment areas and scores ............................................................ 26 Table 5-7: Basic airframe crashworthiness .................................................................. 27
Table 5-8: Example of Rigid-Surface, Wheels-Extended Vertical Crash Capability ..... 34 Table 5-9: Prorated Vertical Velocity Capability ........................................................... 35 Table 5-10: Percent Time Spent at Mission GW-CG Combinations ............................. 36 Table 5-11: Percent Time Spent at Mission Gross Weights ......................................... 36 Table 5-12: Example of Longitudinal Velocity Percent Score for Pilot and Co-Pilot
Egress .................................................................................................................... 37

Full Spectrum Crashworthiness Criteria October 2011 Page 4
Table 5-13: Typical Consistent Systems of Units. ........................................................ 69
Table 5-14: Suggested Model Calibration Metrics ........................................................ 87 Table 5-15: Soil data .................................................................................................... 91 Table 6-1: Modified ADS-11B rating system summary ................................................. 95 Table 6-2: Critical Intercept Values for Nij Calculation at C0-C1 and C7-T1 for specific
Occupant Sizes ...................................................................................................... 97 Table 6-3: Maximum Values for Lumbar Injury for specific Occupant Sizes ................. 97 Table 6-4: Critical Intercept Values for TI Calculation for Specific Occupant Sizes ...... 98 Table 6-5: Maximum Values for Arm Injury for specific Occupant Sizes ...................... 98 Table 6-6: Crew retention rating ................................................................................... 99 Table 6-7: Occupant retention rating ............................................................................ 99 Table 6-8: Basic Airframe Crashworthiness Rating .................................................... 102 Table 6-9: Post-crash fire potential – Spillage ............................................................ 107
Table 6-10: Post-crash fire potential – Ignition Control............................................... 108 Table 6-11: Injurious environment rating .................................................................... 108 Table 6-12: Evacuation Rating ................................................................................... 109 Table 7-1: Performance criteria .................................................................................. 122
Table 7-2: Basic Airframe CI areas affected by operating mission (highlighted) ........ 123 Table 7-3: Operation time matrix ................................................................................ 124 Table 7-4: Combined mission matrix .......................................................................... 124 Table 7-5: Reduced Combined mission conditions .................................................... 124 Table 7-6: Example of (a) vertical impact capability in each condition (b) full pitch / roll
envelope or level impact only .............................................................................. 125 Table 7-7: Example of vertical impact capability score ............................................... 126 Table 7-8: Longitudinal impact capability to ensure cockpit is not compromised ....... 126
Table 7-9: Longitudinal impact capability to ensure occupant space is not compromised (Cabin) ........................................................................................... 127
Table 7-10: Lateral impact capability .......................................................................... 128 Table 7-11: Example of Basic Airframe Crashworthiness rating Summary ................ 129 Table 8-1: 95th Percentile Downward Vertical Impact Velocity (T, S=1,2) ................. 140 Table 8-2: Logistic Regression Coefficients ............................................................... 150

Full Spectrum Crashworthiness Criteria October 2011 Page 5
1. Scope
1.1 Purpose
The purpose of this document is to establish full-spectrum crashworthiness criteria for implementation starting in the initial stages of system design for a wide range of rotorcraft classes, types, configurations, and operating conditions that continue over the life cycle of the rotorcraft system. These criteria will identify the key components that contribute to a system’s crashworthiness and will provide a quantitative measure of crashworthy performance.
1.2 Background
Crashworthiness requirements for military rotorcraft are defined by MIL-STD-1290A (AV) [1] which was cancelled in the mid 1990s but reinstated, without revision, in 2006. The Aircraft Crash Survival Design Guide (ACSDG) [2] provided the basis for MIL-STD-1290. The ACSDG describes every aspect of a crashworthy design and defines a set of crash scenarios that can be survivable if an aircraft is properly designed. This guidance significantly influenced the design of the AH-64 and UH-60 aircraft in the 1970’s. Their performance in crash conditions have shown a great improvement over previous generation helicopters [3]. Over the years, there has been repeated discussion about the need to revise crashworthiness design criteria and crashworthiness qualification methodology. Over time, more mishap data becomes available; tactics, techniques and procedures change; new technologies are developed; and modeling and simulation capability improves. In addition, limitations of existing guidance become more evident. The ACSDG was first published in 1967 with revisions made in 1969, 1971, 1980 and lastly in 1989[4]. MIL-STD-1290 was first published in 1974 and then revised in 1988. Aeronautical Design Standard (ADS) 36 was put together in the 1987 and applied only to the Army Light Helicopter development program and has since been cancelled. As the Department of Defense (DoD) moves forward with the development of future systems such as Unmanned Aerial Systems (UASs), Joint Future Theater Lift (JFTL), Joint Multi-Role (JMR) and upgrades of current fleet helicopters, questions have arisen regarding the adequacy of existing specifications and guidelines. The impact of future operations and environments and advanced design configurations on crashworthy design are not fully understood. Adequate guidelines do not exist to ensure crashworthiness of new generation rotary wing aircraft in these broad ranges of gross weights. Evidence also suggests that military helicopters are flying lower and faster than anticipated in the ACSDG, and that most crashes do not occur at Structural Design Gross Weight on prepared surfaces[3]. Furthermore, past crashworthiness design guidance applied primarily to UH-60- and AH-64-sized and light fixed-wing aircraft. Work has been done to correlate helicopter size and mission to reasonable crash criteria, but it did not address very large rotorcraft and multiple impact surfaces[5]. Many questions exist regarding the appropriate criteria to apply to very large new generation rotorcraft such as the JFTL, Class IV and larger UASs with expensive payloads, or any other rotorcraft not addressed by previous guidance and requirements such as MIL-STD-1290A. Even with current fleet helicopters, technology

Full Spectrum Crashworthiness Criteria October 2011 Page 6
could be applied to improve crashworthiness over a range of crash impact surfaces (hard, soft soil and water), operating weights and pitch/roll attitudes. All attributes are tradable in a new aircraft design. There is difficulty in comparing crashworthiness qualities from one aircraft design to another. A comparative metric along with adequate tools need to be developed to apply a systems approach to crashworthiness at minimum cost and weight. Despite differences in aircraft, the basic criteria which need to be met to ensure post-crash survival of human occupants remain the same and are typically understood by the acronym CREEP[6]:
(1) Container – The structure must provide for a survivable space for the occupant. The survivable space must be free of intrusion and the occupant must be able to survive inside the container and be able to egress after the crash.
(2) Restraint – proper restraint prevents flailing, distributes loads over the body. (3) Environment – proper equipment is in place to ensure occupants are able to
survive in the environment that they are operating in. This includes taking into account flail envelopes, eliminating sharp edges and impaling hazards.
(4) Energy absorption – crash energy is dissipated in a controlled manner (5) Post Crash Factors – occupants are able to egress and survive until rescued.
Fires are mitigated, emergency locator transmitters provide accurate data to allow for a rescue in the shortest time practical.
This document addresses the evolution of crash survival design criteria, their influence on rotary wing aircraft crashworthiness, and the application of new and evolving technology to current and next-generation DoD helicopters. Emphasis is given to the need for a total system approach in design for crashworthiness and the need to consider crashworthiness early in the design phase of a new aviation weapon systems development effort. Consequently, effective crashworthy designs must consider all likely sources of injury, eliminate or mitigate as many as practicable for likely crash scenarios, and do so at an acceptable cost and weight.
1.3 Document Application
This Crashworthiness Criteria design document is applicable to all rotorcraft systems throughout the life cycle of the rotorcraft.
2. Applicable Documents
There has been much research on crashworthiness in the last fifty plus years. Much of the design guidance contained in the ACSDG is still applicable and relevant. The requirements of MIL-STD-1290A, which came from guidance in the ACSDG, provided practical minimum requirements. There are also other specifications and standards that detail various subsystem requirements that will not be addressed by these criteria (e.g. seat standards, FAA standards, etc). . In the event of a conflict between the text of this document and the references cited herein, the text of this document takes precedence. Nothing in this document, however, supersedes applicable laws and regulations unless a specific exemption has been obtained.
Full Spectrum Crashworthiness Criteria October 2011 Page 7
3. Definitions
This section provides definitions for specialized terms as they are used within this document.
Crash Avoidance
Crash avoidance can be viewed from two perspectives. The first is the prevention of mishaps. The second is the maintenance of aircraft control and energy management so that the potential crash is converted to a controlled event which is survivable. Crash avoidance is an important way to minimize injuries and aircraft damage but does not directly affect the crashworthiness of an aircraft, so avoidance systems are not within the scope of this document.
Crash Survivability
Crash Survivability is the ability of occupants, airframe, and systems to survive crash impact forces, subsequent crash sequence hazards, and post-crash hazards. Crash Survivability is assessed through the Crashworthiness Index.
Crashworthiness
Crashworthiness is the ability of aircraft to maintain a protective space for occupants throughout the crash impact sequence; prevent occupants, cargo, or equipment from breaking free of their normal location and positions during a crash sequence; limit the magnitude and duration of accelerations and loads experienced by occupants to within survivable levels; prevent catastrophic injuries and fatalities resulting from contact with barriers, projections, and loose equipment; and limit the threat to occupant survivability posed by fire, drowning, exposure, entrapment, etc., following the cessation of the crash impact sequence.
Crashworthiness Index
The Crashworthiness Index (CI) is a quantitative measure of a rotorcraft’s crashworthiness across multiple crash environments and conditions over the duration of the crash event sequence. It is a single number calculation based on multiple crash conditions and airframe performance under those conditions. (For example, a rotorcraft that crashes at x fps, with an impact angle of y degrees on z surface will have a CI f(x,y,z).) The CI is described in detail in section 5.3 with an example on how to calculate the CI provided in section 7.
Crash Event Sequence
The sequence of events that leads to the crash. A crash event starts when, during a flight, insufficient flight critical systems are functional (whatever the cause) and the rated crewmember(s) can no longer execute a safe landing. The crash event sequence begins once the impact is inevitable. The crash event sequence ends once the vehicle has come to a rest and occupants, if any, have safely egressed.

Full Spectrum Crashworthiness Criteria October 2011 Page 8
Human Tolerance Limits
Acceleration and load pulses that can be applied on the human body with a low probability of causing permanent injury or temporary unconsciousness.
Impact
The striking of one object against another; types of impact events include: Terrain: Event when a rotorcraft crashes on earth. Water Impact: Event when aircraft crashes on water. Definition may also include probability of crashing in a certain sea state. In-flight Impact: Aircraft impact into an obstacle above the earth’s surface such as trees, wires, towers, vehicle and buildings. An in-flight impact could be followed by a terrain impact, a forced landing or a precautionary landing.
Rotorcraft
A rotorcraft is a heavier-than-air flying machine that produces lift independent of vehicle velocity through the use of rotating airfoils – rotary wings. The wings are referred to as rotor blades; a system of two or more blades on the same mast is referred to as a rotor or rotor system. Rotorcraft include helicopters, autogyros, some tilt-wings and tilt-rotors.
Rotorcraft Type
Rotorcraft have various design types that can have an influence on crashworthiness. These types include: Conventional rotorcraft (large main rotor with small tail rotor to counteract torque) Tandem (two counter rotating rotors that are essentially coplanar, and mounted on separate, non-coincident shafts) Coaxial (Two counter rotating rotors with coincident shaft centerlines) Tilt-wing / Tilt-rotor (rotor systems that are capable of transitioning between providing vertical lift and forward thrust via variable (rotor versus propeller) orientation, relative to the aircraft’s wing/fuselage).
Rotorcraft Class Sizes (Based on Gross Weight)
Crash scenarios and rotorcraft performance are dependent on rotorcraft size due to scaling effects of structures and other various issues. Moreover, crashworthiness is driven by the presence or absence of human occupants. Unmanned aircraft may not need to meet the same standards of accommodation for human occupants (i.e. energy management) that manned aircraft must comply with. Crashworthiness criteria will be differentiated between various rotorcraft classes as follows:

Full Spectrum Crashworthiness Criteria October 2011 Page 9
Unmanned Rotorcraft Manned Rotorcraft Class 0: < 8 lbs Class A: n/a Class 1: 8 – 32 lbs Class B: n/a Class 2: 33 – 200 lbs Class C: 33 – 200 lbs Class 3: 201 – 1500 lbs Class D: 201 – 1500 lbs Class 4: 1501 – 7500 lbs Class E: 1501 – 7500 lbs Class 5: 7501 – 75,000 lbs Class F: 7501 – 75,000 lbs Class 6: > 75,000 lbs Class G: > 75,000 lbs
Survivable Crash
An accident in which crashworthiness design ensures to the maximum extent possible that limits of human tolerance are not exceeded. This criterion is applied to each occupant location in the aircraft. If all locations meet the criteria, the crash is “survivable.” If one or more locations meets the criteria and one or more do not, the crash is “partially survivable.” If none of the locations meet the criteria, then the crash is “non-survivable.”
System Crashworthiness
Attributes of an aircraft design or a configuration that minimize occupant injuries and fatalities, as well as damage to the aircraft and critical mission equipment.
4. Applicability of Criteria
Criteria will be applicable to current and future rotorcraft systems. When evaluated under these criteria, any rotorcraft system will have a determinable Crashworthiness Index (CI) based on its system crashworthiness features and mission profile.
5. Research Supporting a Crash Index Approach
System crashworthiness is achieved, in part, as a result of crashworthy subsystems efficiently integrated to protect occupants and critical payload in a crash event. Future rotorcraft designs may be slightly different from the types identified here (such as compound or co-axial types). Future programs are likely to focus on multiple roles for rotorcraft. Though the designs may bring about new types of rotorcraft, the same basic design considerations for crashworthiness should be followed. In areas of special concern, the specific design should be evaluated with current crashworthiness technologies, so that the best crashworthy performance is obtained. For a system level design approach, generic rotorcraft design types have been identified (Figure 5-1). The taxonomy implemented for these generic rotorcraft design types are: conventional, tandem, and tilt rotor. Key design dimensions of importance to the crashworthiness of the rotorcraft have been identified (Figure 5-2) along with nominal dimensions (Table 5-1). These nominal dimensions can be scaled up or down, depending on the gross size of the rotorcraft. As in the case of the conventional rotorcraft, the nominal dimensions may be dependent on mission characteristics (Figure 5-2).

Full Spectrum Crashworthiness Criteria October 2011 Page 10
Figure 5-1: Generic Rotorcraft Design Type Taxonomy
The Conventional type covers a broad range of rotorcraft with different missions including attack, utility, and cargo. Although all of the conventional rotorcraft have a main rotor and tail rotor anti-torque, the key design dimensions can be different due to mission requirements.
Figure 5-2: Generic Rotorcraft Types and Key Crashworthiness Design Dimensions
Examples of key design dimensions of importance to crashworthiness include: aircraft gross weight, ground clearance, fuselage crush depth, seat stroke, location and stroke of landing gears, as well as overall rotorcraft height and length (Table 5-1). These and other similar parameters must be identified and understood because they may facilitate or limit the use and beneficial effects of applicable crashworthiness technologies.
Full Spectrum Crashworthiness Criteria October 2011 Page 11
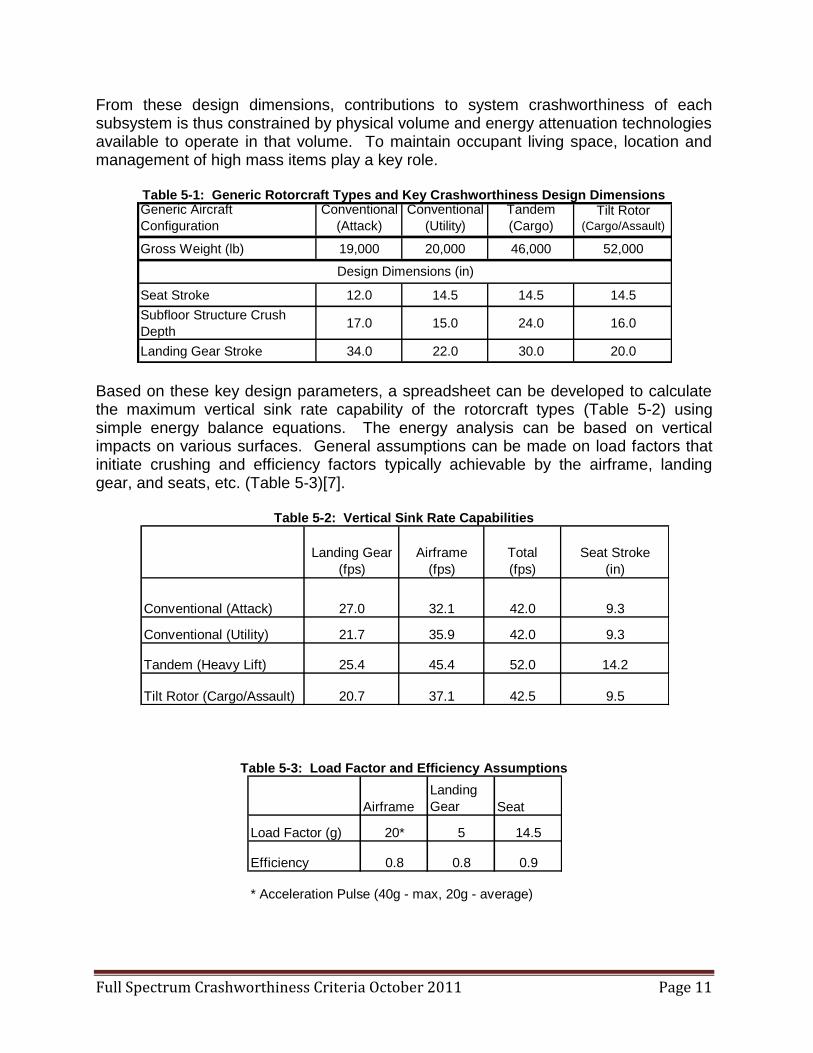
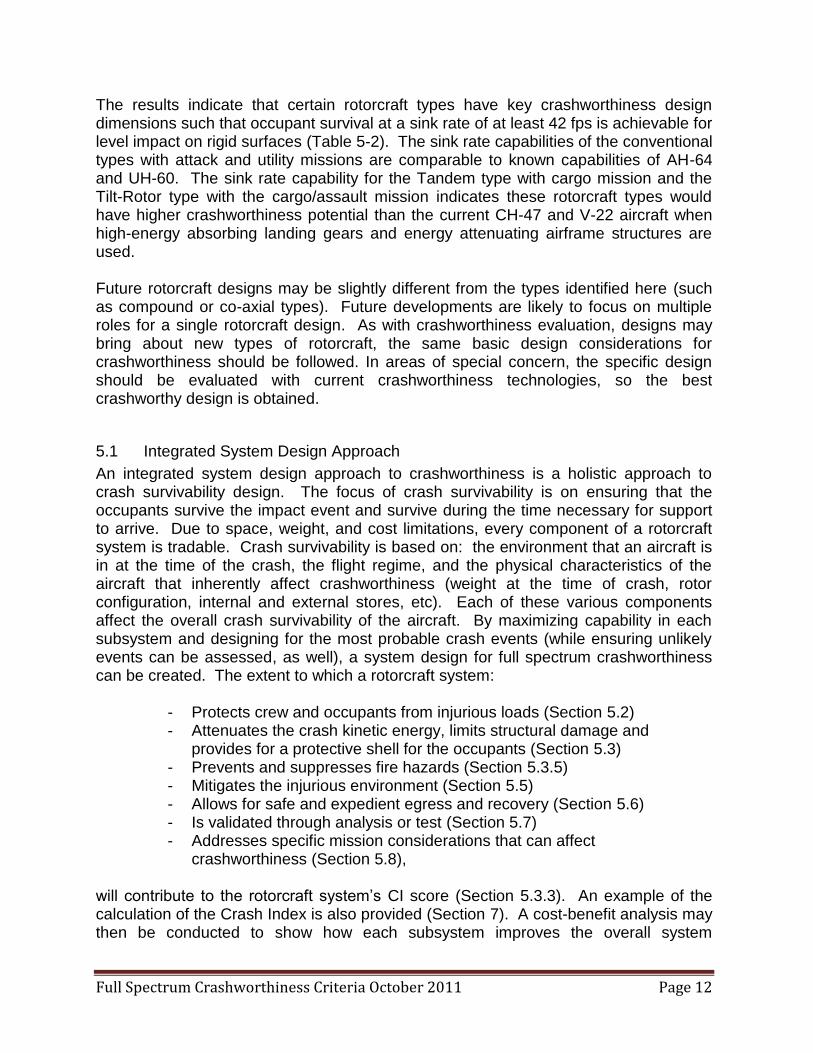
From these design dimensions, contributions to system crashworthiness of each subsystem is thus constrained by physical volume and energy attenuation technologies available to operate in that volume. To maintain occupant living space, location and management of high mass items play a key role.
Table 5-1: Generic Rotorcraft Types and Key Crashworthiness Design Dimensions
Based on these key design parameters, a spreadsheet can be developed to calculate the maximum vertical sink rate capability of the rotorcraft types (Table 5-2) using simple energy balance equations. The energy analysis can be based on vertical impacts on various surfaces. General assumptions can be made on load factors that initiate crushing and efficiency factors typically achievable by the airframe, landing gear, and seats, etc. (Table 5-3)[7].
Table 5-2: Vertical Sink Rate Capabilities
Table 5-3: Load Factor and Efficiency Assumptions
Generic Aircraft
Configuration
Conventional
(Attack)
Conventional
(Utility)
Tandem
(Cargo)Tilt Rotor
(Cargo/Assault)
Gross Weight (lb) 19,000 20,000 46,000 52,000
Seat Stroke 12.0 14.5 14.5 14.5
Subfloor Structure Crush
Depth17.0 15.0 24.0 16.0
Landing Gear Stroke 34.0 22.0 30.0 20.0
Design Dimensions (in)
Landing Gear
(fps)
Airframe
(fps)
Total
(fps)
Seat Stroke
(in)
Conventional (Attack) 27.0 32.1 42.0 9.3
Conventional (Utility) 21.7 35.9 42.0 9.3
Tandem (Heavy Lift) 25.4 45.4 52.0 14.2
Tilt Rotor (Cargo/Assault) 20.7 37.1 42.5 9.5
Airframe
Landing
Gear Seat
Load Factor (g) 20* 5 14.5
Efficiency 0.8 0.8 0.9
* Acceleration Pulse (40g - max, 20g - average)
Full Spectrum Crashworthiness Criteria October 2011 Page 12
The results indicate that certain rotorcraft types have key crashworthiness design dimensions such that occupant survival at a sink rate of at least 42 fps is achievable for level impact on rigid surfaces (Table 5-2). The sink rate capabilities of the conventional types with attack and utility missions are comparable to known capabilities of AH-64 and UH-60. The sink rate capability for the Tandem type with cargo mission and the Tilt-Rotor type with the cargo/assault mission indicates these rotorcraft types would have higher crashworthiness potential than the current CH-47 and V-22 aircraft when high-energy absorbing landing gears and energy attenuating airframe structures are used. Future rotorcraft designs may be slightly different from the types identified here (such as compound or co-axial types). Future developments are likely to focus on multiple roles for a single rotorcraft design. As with crashworthiness evaluation, designs may bring about new types of rotorcraft, the same basic design considerations for crashworthiness should be followed. In areas of special concern, the specific design should be evaluated with current crashworthiness technologies, so the best crashworthy design is obtained.
5.1 Integrated System Design Approach
An integrated system design approach to crashworthiness is a holistic approach to crash survivability design. The focus of crash survivability is on ensuring that the occupants survive the impact event and survive during the time necessary for support to arrive. Due to space, weight, and cost limitations, every component of a rotorcraft system is tradable. Crash survivability is based on: the environment that an aircraft is in at the time of the crash, the flight regime, and the physical characteristics of the aircraft that inherently affect crashworthiness (weight at the time of crash, rotor configuration, internal and external stores, etc). Each of these various components affect the overall crash survivability of the aircraft. By maximizing capability in each subsystem and designing for the most probable crash events (while ensuring unlikely events can be assessed, as well), a system design for full spectrum crashworthiness can be created. The extent to which a rotorcraft system:
- Protects crew and occupants from injurious loads (Section 5.2) - Attenuates the crash kinetic energy, limits structural damage and
provides for a protective shell for the occupants (Section 5.3) - Prevents and suppresses fire hazards (Section 5.3.5) - Mitigates the injurious environment (Section 5.5) - Allows for safe and expedient egress and recovery (Section 5.6) - Is validated through analysis or test (Section 5.7) - Addresses specific mission considerations that can affect
crashworthiness (Section 5.8), will contribute to the rotorcraft system’s CI score (Section 5.3.3). An example of the calculation of the Crash Index is also provided (Section 7). A cost-benefit analysis may then be conducted to show how each subsystem improves the overall system

Full Spectrum Crashworthiness Criteria October 2011 Page 13
performance. Many of the conclusions and requirements are based on analysis of historical mishap data [3] (Section 8) and current analysis of future operations. [8] The overall objective of designing an aircraft and its systems for crashworthiness is to minimize occupant injuries and fatalities, enable emergency egress following a crash impact sequence, and minimize aircraft impact damage. Accomplishing these objectives requires the designer to use a systems approach, since like a chain, crashworthiness is only as good as the weakest link in the system. All of the systems must function together as needed to achieve the crashworthiness objective. Hence, the aforementioned system and process elements of crashworthiness should be addressed.
5.2 Occupant Protection
The primary goal of any crashworthy system is to provide occupant protection by mitigating impulsive loading, maintaining a survivable volume, and allowing for egress. This section focuses on the occupant and provides background information on crash-related injuries, a survey of human injury risk criteria, and applicable technologies for occupant protection. Section 5.2.1 summarizes several studies looking at common rotorcraft crash injuries. Section 5.2.2 reviews various injury criteria that have been developed. In addition, Section 5.2.2.2 contains a summary of current Anthro-pomorphic Test Devices (ATDs), more commonly known as crash test dummies, which are used to represent human occupants during impact testing. Section 5.2.2 identifies the injury criteria currently deemed feasible to be used in the development of rotorcraft crashworthiness requirements. Finally, Section 5.2.3 identifies applicable technologies that directly enable occupants to survive crash events.
5.2.1 Crash-Related Injuries
In order to improve occupant survivability, it is important to know what injuries are occurring during crash events in the field. Recently, three different accident studies have been completed, including a study of helicopter crashes performed in support of the Full Spectrum Crashworthiness criteria [3], a survey of US Navy helicopter mishaps [9], and a comparison of various injury mechanisms in US Army helicopter crashes [10]. Reference [3] provides injury data, which has been sorted to isolate injuries that occurred in survivable accidents for eight different military helicopters. The data is also sorted based on two accident types: those resulting from direct impact with terrain, and those resulting from post-obstacle strikes. Injury maps were developed for each aircraft type, which plot the frequency of injury as a percentage of all injuries that were reported. The injury maps cover nine body regions including the head, neck, cervical spine, upper extremities, thorax, abdomen, thoracic lumbar spine, lower extremities, and general. The body regions experiencing the highest rate of injury are the head, abdomen, thorax, and lower extremities. These results are for all types of occupants including pilots, crew, and passengers. Reference [3] includes a list of actions and causal factors related to accident injuries. For example, a thoracic-lumbar spine injury may have an injury action listed as severe deceleration and a causal factor listed as seat failure. However, specific injury mechanisms, such as fractured vertebra, ruptured spleen, or lower leg fracture are not included.

Full Spectrum Crashworthiness Criteria October 2011 Page 14
Kent [9] describes crew and passenger injury patterns associated with US Navy and US Marine Corps helicopter mishaps occurring from 1985 through 2005. Injury data are presented in four categories of severity for seven anatomical locations. In total, eight different aircraft were included in the study. The study found that the head was the most common injury location for pilots, crew, and passengers. Other areas of high injury included the lower and upper extremities, and the spine. Spinal injuries were more common in pilots than non-pilots. However, based on statistics, pilots were more likely to walk away from a mishap uninjured than non-pilots. Finally, when the injury data were separated by decade, the numbers of fatalities due to drowning dropped significantly in the second decade as compared with the first. Finally, Barth and Balcena [10] conducted a survey to compare the frequency of heart and aortic injuries with more common injuries to the head/neck and spine/pelvis regions. The study reviewed 156 US Army aviation accidents from 1983 to 2005, and comparisons were made of the relative frequency of accidents where head/neck, spine/pelvis, and heart/aorta injuries occur in at least one occupant. The largest frequency of injury was to the head/neck (87%), followed by the spine/pelvis (83%), and followed by the heart/aorta (46%). In addition, combinations of injuries to more than one location were evaluated. The study concluded that heart/aorta injuries occur most often in accidents where head/neck and spine/pelvis injuries also occur and that these accidents are generally non-survivable. Consequently, additional criteria for these injury mechanisms are not needed at this time.
5.2.2 Survey of Human Injury Risk Criteria
This section of the report contains information on current human injury risk criteria. In general these criteria are written to evaluate forces and accelerations experienced by the occupant during impact. Since these are vector quantities, it is also appropriate to present defined coordinate systems for the occupant and seating system. Finally, a brief summary of current Anthropomorphic Test Devices (ATDs), which are used to represent human occupants during impact testing, is presented.
5.2.2.1 Human Body Coordinate System
Forces and accelerations are vectors, thus a standard human-body coordinate system is required. The X, Y, and Z directions are defined for a seated occupant as follows: +Z is pointing upward out of the head and is called headward. A headward acceleration is also called “eyeballs down” as the eyeballs would initially move in the opposite direction to the acceleration due to inertia. +X is the back to chest direction, which is denoted “eyeballs in.” +Y is to the right of the seated occupant and is called “eyeballs left.” Refer to Figure 5-3 for details, which shows the local coordinate system used for both seats and seated occupants. Note that the X, Y, and Z axes in Figure 5-3a form a left-handed coordinate system. Thus, care must be taken to reverse the Y-direction if vector operations are required.

Full Spectrum Crashworthiness Criteria October 2011 Page 15
(a) Seat coordinate system. (b) Occupant coordinate system.
Figure 5-3: Coordinate system for seated human occupant
5.2.2.2 Anthropomorphic Test Devices
Human injury risk criteria are needed to measure the performance of the aircraft system. While there are many sources from which to choose these criteria and many have been proposed, a judicious selection must be made to use those criteria, which are meaningful and achievable. Injury criteria also pertain to the particular measurement device used, whether it is through physical testing or analysis. For the criteria developed, several possible Anthropomorphic Test Devices (ATDs) are considered. These included:
1. 49 CFR Part 572, Subpart B, Hybrid II – Straight spine 2. 49 CFR Part 572, Subpart E, Hybrid III – automotive, curved spine 3. FAA Hybrid III – straight spine 4. Aerospace Hybrid IIIs – DoD straight spine, but different from Hybrid II
The Subpart B Hybrid II and FAA Hybrid III have been commonly used for aviation specific testing and are the ATDs accepted in the FAR for certification of aircraft seats. The FAA Hybrid III uses the straight spine and upper leg assembly, among a few other components, from the Subpart B Hybrid II, but still has the thorax, upper limbs, head, and neck from the Subpart E Hybrid III [11]. The Subpart E Hybrid III is commonly used in automotive testing and its response has been widely studied and used in regulations by the National Highway Traffic Safety Administration (NHTSA). The DoD also had unique testing requirements as a result of ejection seat programs. These requirements led to the development of the Aerospace Hybrid IIIs that also have a straight spine, but which are different from the Subpart B Hybrid II or FAA Hybrid III, with slightly different anthropometries and construction materials. Because there is no single standard ATD that can be used for rotorcraft crashworthiness testing, care must be taken to ensure that the proper limits are used for the different ATDs. When using analysis, it may be possible to calculate certain response parameters that the ATD is not capable of measuring. These parameters are of little use since they cannot be verified.

Full Spectrum Crashworthiness Criteria October 2011 Page 16
The current family of crash-test dummies does not have sufficient bio-fidelity to be representative of a human in many of the impact scenarios that may occur in a crash. Injury assessment values must be specified for occupant injuries in terms of measured dummy responses. However, not all human injuries can be correlated to measured dummy responses. The methodology was developed for automotive injuries and correlated to standard Hybrid III dummies with a curved spine and without a lumbar load cell. Consequently, there are unknowns involved when using a Hybrid III “FAA” dummy for aerospace use since the FAA dummy has a straight spine. Also, in testing, only a limited number of impacts are studied. Also, only a limited size range of Hybrid III dummies are available [12].
From the reviews of mishap data discussed in Section 5.2.1, it was apparent that fatalities were primarily caused by injuries to the head, neck, chest, and extremities. It was also deemed important to maintain the gains in lumbar protection that have resulted from improved seat design and structural crashworthiness. Each one of these body regions was targeted for specific criteria that can be used to assess the safety performance of the airframe system. The criterion for each body region is described, along with its source of derivation.
5.2.2.3 Head Injury
The Head Injury Criterion (HIC) is based upon the Wayne State Tolerance Curve (WSTC) and the Gadd Severity Index (GSI) [13]. The underlying data were a series of head impacts with resultant head fractures. As such, the criterion is really a measure of the risk of a skull fracture given a particular linear acceleration of the head. The original implementation of the HIC had an unlimited time window with which to calculate the measure. Later, a change was implemented to limit the time window to 36-ms as that was judged to be long enough to account for long duration impacts while preserving some of its short duration prediction ability. However, it was noted that the data from which HIC was derived only had durations up to 15-ms. With this in mind, the limit on the duration was lowered. Along with this new duration limit, the threshold value was also lowered from 1000 to 700. Through analysis, it was shown that the HIC15 700 was comparable to a HIC36 1000 for the long duration pulses. Another change was a more stringent requirement on the shorter duration pulses, which was deemed acceptable, as this was one of the injury mechanisms that the criterion was aiming to protect. The HIC is currently specified in the Federal Motor Vehicle Safety Standard 208 (FMVSS 208) [14], and has been routinely implemented for various programs where protection against a head injury is warranted.
5.2.2.4 Neck Injury
Injuries to the neck can occur from multiple loading scenarios. Typical injuries of concern would be vertebral fractures, dislocations including an atlanto-occipital dislocation, cord contusions and even a basilar skull fracture, which, while not categorically a neck injury, is caused from excessive loading to the neck. These different loading modes have led to considerable changes over the years to neck injury

Full Spectrum Crashworthiness Criteria October 2011 Page 17
criteria. Separate limits for the axial tolerance of the neck in both tension and compression were previously considered. These limits included both the duration limit curves [15] and a separate probability function for pure tensile loading [16]. With the development of the combined neck moment and axial load metric, Nij, the duration limits were dropped [17]. However, limits on pure axial tension and compression were incorporated. The DoD adapted the Nij and incorporated several other metrics to form its Neck Injury Criteria (NIC) [18]. The NIC included the Nij with its critical intercept values; however, the acceptance level was reduced by half. Further limits on tension, compression, shear, and bending were incorporated, as well as duration limits similar to those previously discussed by Mertz [19]. In reviewing the NIC, there are 12 separate criteria that must be met, for both the upper and lower neck. Much of what is in the NIC can be contradictory, or duplicative. For instance, the neck compression criteria at 5-ms is 790-lb, while that allowed by implementation of the Nij is only 692-lb. Obviously failing one criterion would fail the other so it would be unproductive to continue tracking metrics that have no meaning. In fact, with this many requirements, it may become difficult to find a design that could pass. The NIC criteria were routinely exceeded, thus limiting their ability as an injury predictor. The Nij criteria only applies to cases for combined moments with frontal flexion/extension and tension/compression. However, there are some situations where lateral loading is possible, such as a case with a rolled attitude at impact. In those situations, it is important to ensure that the neck is protected from lateral neck injuries. To prevent a scenario where competing requirements could cancel each other and complicate the criteria as happened with the NIC, one additional limit was included to cover side impacts that is based upon recent FAA research. These limits were based on the EuroSID (ES2 –re) [20] side impact manikin, but the neck loads can be similar to the mid-size male Hybrid III.
5.2.2.5 Chest Injury
The chest is a major body region that can be injured either from direct impact or from inertial forces and was one of the top three body regions associated with fatalities and major injuries from the accident data review [21]. Inertial loading of the chest is a result of rapid deceleration of the occupant and the interaction with the restraint system. A stiff restraint that allows large loads to be transmitted directly to the occupant has the potential to cause injury. Because of this, in typical FAA regulations, limits have been placed on the maximum load to be carried by the restraint system (14 CFR 27(29).562c2). A direct impact to the chest can also cause injury. This injury could be the result of impacting controls and other protruding surfaces within the cockpit, or as a result of the interaction of the belt system with the chest of the occupant. Limiting belt loads can minimize this interaction. One way to ensure safety to the chest is to limit the maximum chest acceleration. For the Hybrid III type manikins, Injury Assessment Reference Values (IARVs) have been proposed [22] that include a limit of 60 G’s of acceleration in the chest for the mid-size male Hybrid III. Limits could be placed on the deflection of the chest cavity, but not all ATDs commonly used for this particular testing are capable of measuring this value. Previously, the NTSB had concluded that the use of shoulder straps would prevent many fatalities and reduce major injuries.

Full Spectrum Crashworthiness Criteria October 2011 Page 18
The General Aviation Safety Panel (GASP) provided a summary of expected chest injuries with shoulder strap loads [23]. It is expected that any new rotorcraft design will include upper torso straps for retention and these restraints have been shown effective in mitigating injuries.
5.2.2.6 Lumbar Injury
Despite the advances in energy absorbing seats, the lumbar region is commonly injured during vertical impacts. The occurrence of these injuries has been reduced, but it is important to still ensure that this critical body region must remain a focus of attention to ensure protection. Injuries can result from other loading modes, but compression in the lumbar spine is the primary driver. Continuing to provide protection to the lumbar spine may also mitigate heart and aortic injuries (HAI) [10]. HAI injuries were found to seldom occur without an associated head/neck or thoracic injury. Thus, it was judged that a separate criterion to protect the internal organs was not necessary. Over the years the criteria for assessing the safety of a system to vertical impacts has changed. Eiband [24] developed the earliest criterion in the 1950’s. Using human volunteer and animal data, exposure limits for uninjured, moderately injured, and seriously injured occupants were developed. For vertical impacts, it was reported that human volunteers tolerated 10-G’s for 0.1 seconds and 15-G’s for 0.05 seconds (Figure 5-4).
Figure 5-4: Human tolerance limits to uniform acceleration along the -Z-axis (eyeballs down).
Application of the Eiband curve had several limitations. It primarily characterized the response to whole body acceleration and did not segregrate injuries by body region. It also was not sensitive to changes in the pulse shape or mitigation methods that may have been developed. Initial ejection seat designs had acceleration limits in the 20-G range. This range falls at the boundary of moderate injury in the Eiband criteria. It was

Full Spectrum Crashworthiness Criteria October 2011 Page 19
found that spinal fractures frequently occurred during ejection seat incidents and that improved seat designs were needed. As part of a revised ejection seat development program, a new criterion was also developed that is known as the Dynamic Response Index (DRI) [25]. The DRI model represents the spinal column of the human occupant as a lumped mass-spring-damper model. Input to the model consisted of seat pan accelerations and model output consisted of the acceleration time history of the DRI system. The maximum value of the DRI response was the parameter of interest. This value could then be correlated with operational injury data and an accepted value of 18 was selected (Figure 5-5).
Figure 5-5: Spinal injury rate correlated to DRI for ejections from military fighters.
The primary limitation of the DRI model is that it was developed for ejection seat pulses and is not sensitive to seat design changes such as different seat cushions, different restraint systems, or ATDs. These changes may have a minor effect on the overall seat acceleration, thereby changing the DRI only slightly. To address these issues, the FAA developed a lumbar load tolerance value. Since load in the lumbar region is the primary factor causing injuries, it was thought that a criterion based directly on measured lumbar load response was prudent. To determine the threshold, the FAA conducted a series of dynamic impact tests using aviation specific pulses. For each test, a lumbar load was measured and the DRI of the test condition was calculated. Based upon this correlation, a lumbar load of 1500-lb measured in the Hybrid II ATD was correlated to a DRI of 19 which was considered acceptable. One limitation is that these measurements were made using a Hybrid II ATD, but later tests included the FAA Hybrid III. To expand the lumbar criteria to different anthropometries, tests and simulations were conducted using seating systems with different sized ATDs. The results of this effort formed the basis for the lumbar criteria used in the Joint Services Specification Guide (JSSG) [26]. The JSSG specified maximum lumbar loads for various sized occupants, some of which there was no equivalent ATD in existence. In a later analysis, it was

Full Spectrum Crashworthiness Criteria October 2011 Page 20
shown that the JSSG limits were too high [27], based primarily on the analysis program that tended to calculate higher loads than were measured during testing. Revised limits were proposed based on this re-analysis. The U.S. Air Force had been using the 1500-lb compressive limit for its mid-sized ATD’s and used a linear mass scaling based upon the total ATD weight to generate limits for the other dummy sizes. These dummies were typically from the Aerospace Hybrid III family and had similar body weight distributions. These limits were applied to seat cushion development programs to select replacement cushions.
5.2.2.7 Extremity Injury
Protection of the upper and lower extremities is important in rotorcraft impacts since injuries to these body regions may severely hinder egress and, in the case of water impact, lead to drowning. The mishap data showed that these body regions are frequently injured, though they do not show as prevalent in the fatal cases. Demonstrating extremity protection may not necessarily be required, but is listed as an optional area for consideration, and may become a requirement in specific cases, especially for water impacts, or specific occupant locations that require more detailed assessment. Extremity criteria are reviewed so that researchers and system designers can account for protection of these areas. The lower leg may be injured from either impact loads of the floor structure or through inertial loading of leg flail. These scenarios can generate both compressive and bending loads. There are several choices of injury criteria, which were summarized by Keown [28]. Tibia load limits are required in cases where an occupant could impact an object with their legs, such as in a pilot seat or instrument panel. Arm load limits could be required in cases where an occupant might impact an object with their arms, such as in a pilot seat, or crew station that is near a bulkhead. Previous studies focused on breaking strength of female upper extremities that would frequently occur during automotive airbag deployment [29]. This research supplements the early work of Yamada [30] and was applied to programs that developed military restraint systems such as the Joint Cockpit Airbag System and the upper extremity netting found in ejection seats. However, no suitable injury criteria have been proposed that could be readily qualified based on measurements from the ATDs commonly used for these assessments. An instrumented arm is available, but its use and correlation to injury measures is not generally accepted. Rather, subjective recommendations are warranted that state that arm contact with any unpadded or sharp surface shall be prevented. This statement will be modified in future revisions as more data and information become available.
5.2.2.8 Injury Assessment Reference Values
Injury Assessment Reference Values (IARVs) are provided by Mertz [31] for restrained Hybrid III dummy occupants subjected to sudden impacts. In 1983, General Motors Corporation petitioned the National Highway Traffic Safety Administration (NHTSA) to allow the use of the Hybrid III dummy along with a set of IARVs for FMVSS 208 [21]

Full Spectrum Crashworthiness Criteria October 2011 Page 21
Occupant Crash Protection. In 1986, NHTSA responded favorably to the petition. These injury assessment design limits were chosen such that if an IARV was not exceeded, the risk of an associated injury would be less than 5%. The IARVs were basically conservative injury estimates. By the 1990’s, the Hybrid III dummy was adopted by all domestic and most of the foreign car manufacturers.
Injury guidelines are specified for head and neck forces and moments, head and chest accelerations, knee and femur loads, and tibia loads and moments. Originally injury guidelines were only for a 50th percentile male occupant represented by the Hybrid III dummy. In 1993, IARVs were published for small female and large adult male Hybrid III dummies by the use of scaling [22]. To provide limits, injuries to cadavers and human surrogates such as pigs were compared with instrumented Hybrid III dummies for the same impact condition.
5.2.2.9 Abbreviated Injury Scale and Injury Severity Score
The Abbreviated Injury Scale (AIS) was developed in 1971 to provide a systematic method of characterizing injuries that could be used by physicians, engineers, and researchers. The AIS was updated in 1985 [32]. The AIS characterizes the severity of injury to each of six body regions as 1 Minor, 2 Moderate, 3 Serious, 4 Severe, 5 Critical, and 6 not survivable. The six body regions are:
1. Head and neck, including the cervical spine
2. Face, including the facial skeleton, nose, mouth, eyes, and ears
3. Thorax, thoracic spine, and diaphragm
4. Abdomen, abdominal organs, and lumbar spine
5. Extremities, including pelvic skeleton
6. External soft tissue injury
An example of moderate injury (AIS=2) would be a disfiguring injury such as a facial scar. Permanent impairment injuries with AIS greater than or equal to 2 would include knee joint damage and spinal cord damage. Other serious injuries (AIS=3) would be reversible brain concussion and bone fractures. Life threatening injuries with AIS > 3 would include brain damage, thoracic, and abdominal damage.
An Injury Severity Score (ISS) is calculated by summing the square of the AIS scores of the three most injured body regions [33]. The maximum ISS for a survivable injury would be 75, which corresponds to three critical regions that are each rated critical (5).
5.2.2.10 General Applicability
Many of the injury metrics described refer to a specific ATD. These references to specific ATDs should remain as those would be the likely simulated occupants in the analysis. It is important to note that any computational model used as part of the

Full Spectrum Crashworthiness Criteria October 2011 Page 22
analysis undergo a proper validation [34]. Part of the validation includes comparison with testing, so it is important to retain that link.
5.2.3 Applicable Technologies for Occupant Protection
In order to ensure occupant protection, a total system approach is necessary. Every component, from the rotor system to the airframe to flight controls, must be designed to ensure that the occupant is able to survive a crash event. The following technologies are directly applicable to occupant protection, i.e. they are the last in a series of measures to ensure that the occupant survives.
5.2.3.1 Seat Systems
The purpose of seats and restraint systems during a crash impact is to securely restrain the occupants to minimize secondary impacts with the rotorcraft interior and also to reduce the loads experienced by the occupants via stroking. Seat stroke mitigates spinal injury by spreading the crash impulse over time and decreasing the magnitude of the force transmitted to the occupant. The seat stroke is typically accomplished by discrete energy absorbing devices that allow relative motion between the seat bucket and the seat frame attached to the airframe structure. Current seat energy absorber technology includes fixed load energy absorbers (FLEA) that are designed for a specific occupant weight, as well as variable load energy absorbers (VLEA) that can be adjusted for varying occupant weights. MIL-S-58095A includes requirements for both a FLEA and a VLEA. The AH-64A/D and UH-60A/L have FLEAs, however the UH-60M has a VLEA, as well as Navy variants of the H-60. Most troop seat utilize FLEAs although a few new troop seat designs utilize fixed profile EAs (FPEA) which generate a load that increases with stroke. This EA was developed to improve protection over a wider range of occupant sizes. Lap belt restraints do not offer complete protection in an aircraft crash event. Flailing of the arms and upper torso can cause life threatening secondary impacts. Modern restraint system technologies include the 4- and 5-point type restraint systems with low elongation webbing and dual mode locking inertia reels. There are also supplemental restraint system technologies such as Cockpit Airbag Systems (CABS) and belt-retractors to position the occupants correctly prior to the crash impact and to reduce flailing during the crash impact. Airbags also have the ability to prevent impact with obstacles such as the cyclic stick. Belt-mounted inflatable airbags also exist to reduce belt slack and/or reduce head rotation. Full spectrum crashworthiness criteria are at the system level and do not include detailed seat and restraint system design requirements. The requirements include not-to-exceed occupant injury threshold levels. These requirements can be met by system level design integration through a combination of seats and other crashworthy subsystems.
5.2.3.2 Mobile Occupant Restraints
The use of safe personnel restraint systems needs to become standard in rotorcraft requirements and design. While great strides have been made in pilot protection, the

Full Spectrum Crashworthiness Criteria October 2011 Page 23
protection of crew and passangers in the cargo areas has not kept pace. As a result, rear compartment occupants are injured or killed at nearly twice the rate of pilots [35]. Furthermore, the use of a gunner's belt has been shown to result in severe injuries even though it does preserve lives. Gunner's belt design concentrates forces either around the waist or chest and the single lanyard provides no protection from flail trauma during rotorcraft mishaps. New restraint systems, which properly immobilize occupants are essential. Torso suits and multipoint restraints are leading technological candidates. Each rotorcraft occupant should be entitled to an energy absorbing (stroking) seat with four or five point restraints. Occupants required to be out of crashworthy seating at speeds below effective translational lift (ETL) should have restraints which adequately protect them from flailing during mishaps and evenly distribute the inertial load during the impact.
5.2.3.3 Active Crash Protection Systems
Significant on-the-horizon system level technology includes Active Crash Protection Systems (ACPS) that can sense an impending crash or hard landing event and react to provide an increased level of energy absorption and protection. ACPS include sensors, dedicated microprocessor(s), crash activation and control algorithms, all integrated with active crash protection subsystems (e.g. variable load landing gears, external airbags, active crashworthy seats, active restraints, CABS, etc).
5.3 Airframe Crashworthiness
Airframe crashworthiness is fundamental in developing an overall crashworthy aircraft design. It is essential that the airframe be able to withstand crash impacts, while maximizing occupant protection and providing a survivable volume. A key challenge in this area of design is to achieve crashworthiness design goals, while not overdesigning the airframe.
5.3.1 Static Crash Load Criteria
The method of static crash load factor criteria has been in use for many years. The primary reasons are: the method is easy to use and it has been shown to significantly enhance crash survivability and high-mass retention capabilities. Static criteria (as exemplified in Table 5-4), may be applied separately or simultaneously, depending on the design requirements. For criteria specific to a particular aircraft currently in use, refer to the appropriate structural design criteria report.

Full Spectrum Crashworthiness Criteria October 2011 Page 24
Table 5-4: Representative Static Crash Load Criteria
Direction
Applied Separately
Applied Simultaneously
(1) (2) (3) (4)
Longitudinal 20g 20g 10g 10g
Vertical +20g (or 26g(1)), -10g
+10g (or 13g(1)), -5g
+20g (or 26g(1)), -10g
+10g (or 13g(1)), -5g
Lateral 20g 10g 10g 20g
(1) Alternate value to be used in conjunction with a 1g rotor-lift, if more critical. A crash is a dynamic event, because applied deceleration loads (magnitude, direction, and duration) and load paths change rapidly with respect to time. Moreover, because crash loads often exceed ultimate load values, the structure exhibits large scale plastic strain as well as rupture. With this in mind, it may be said that an actual crash event cannot be modeled accurately, because the change in loads and load paths over time and the highly non-linear response of aircraft structure cannot be correctly replicated. Nevertheless, accident research and full scale crash testing have been done to determine values of deceleration that are potentially representative of crash loads and that have been correlated to various combinations of velocity components (longitudinal, lateral, and vertical). According to Reference [33], this information became the basis for calculating equivalent static load factors, which comprise the static criteria currently in use. Because a crash is a dynamic event, it is worth remembering that static criteria may only estimate the effects of a crash, thereby incurring some inaccuracy. However, it must also be remembered that the criteria are not arbitrary (being based on experience and testing), and have been shown to be conservative. Finally, when deciding whether a dynamic or static analysis is optimum to a design effort, several factors must be weighed carefully, including scope and difficulty of analysis, cost, time, analytical competency, among others. It may turn out that only a dynamic analysis can provide an answer, or that a static analysis may prove quite adequate, or that both analysis types are needed.
5.3.2 Dynamic Crash Load Criteria
A crash is a dynamic event. However, determining crashworthiness and survivability using a dynamic analysis approach has been and continues to be very difficult, especially when trying to analyze an overall aircraft. Nevertheless, dynamic analyses have been and are being used to verify crashworthiness of aircraft systems, such as seats and landing gear. Such analyses account for the ability to attenuate energy via load limiting devices, and are based on industry-wide values of maximum sink rates that are developed for each aircraft. Currently, there are several types of finite element programs and simulation codes available that enable increasingly accurate analyses of the dynamic response of an aircraft and its subsystems to a variety of crash impacts. Generally speaking, they include lumped parameter (LP), finite element (FE), and hybrid modeling programs. The FE programs can be divided into two groups: heuristic beam models and continuum mechanics based models which use beam, solid and

Full Spectrum Crashworthiness Criteria October 2011 Page 25
shell elements. The progression of these models over the years followed a pattern of increasing geometric detail, since it was realized that a simple analytical model developed and tuned to fit one or more parameters from a specific test does not ensure accurate prediction for all impact conditions. FE programs also make use of simulation tools. To simulate a crash impact of a full aircraft system, a simulation code should be able to simulate the following subsystems: landing gear, airframe, crashworthy seat with occupant interaction, and fuel and tank response. When looking at the subsystem or component level, occupant reactions should also be analyzed. Reliable and accurate predictions of occupant dynamics during aircraft crashes rely on a biofidelic occupant model that can reasonably replicate the behavior of a human occupant. Where injury mechanisms are known and injury thresholds are defined, such as lumbar compression or head impact, these occupant models can be used to assess injury potential. However, in general, the technology for current state-of-the-art occupant models does not allow broad injury potential assessment since many of the injury mechanisms (e.g., neck flexure, aortic separation) are not well understood [36]. As these simulation tools become more accurate it is feasible that dynamic load standards will become the more accurate and best standard for determining the degree of crashworthiness of an airframe. Finally, while the maturity level of crash simulation has not yet achieved certification and qualification by analysis alone (ATRL 9: Analytical Technology Readiness Level 9, see section 5.7), they have demonstrated maturity levels of ATRL 5 and 6. This achievement enables discrimination between qualitative (ATRL 5) and quantitative (ATRL 6) designs, with trade studies possible once the model has been calibrated. The purpose of all dynamic load testing, with respect to crash survival, is to quantify the effect of airframe structure on occupants during crash situations.
5.3.3 Crashworthiness Index
Traditionally, crash design criteria have been prescriptive. The severity of crash impact conditions have been based on pre-existing crash statistics (that relied on accident investigation data) along with engineering judgment and feasibility of designing to certain conditions. Unfortunately, under this approach, aircraft were often not fully compliant with the requirements of crash criteria, typically due to conflicting design requirements, excessive weight, and cost penalties. The Crashworthiness Index (CI) was conceived as a method to quantify the crashworthiness capability of a rotorcraft design. This index can rate how well a new or derivative design complies with design condition requirements, such as MIL-STD-1290 requirements. However, it can also be expanded to evaluate other crashworthiness attributes that are desired by a specific customer. The CI is a modified version of the crash rating system described in ADS-11B (Table 5-5). The ADS-11B rating is made up of seven assessment areas. Each of these seven areas is assigned a maximum number of points, and the optimum ADS-11B score is 720 points. Each of the seven categories is further broken down into sub-categories as well. The Basic Airframe Crashworthiness Rating (item 5 in Table 5-5) most closely aligns with the MIL-STD-1290A design conditions. In creating the CI methodology, changes

Full Spectrum Crashworthiness Criteria October 2011 Page 26
were primarily made to this section of the ADS-11B rating system (Table 5-6), and are described in Sections 5.3.4.3 through 5.3.4.6. Changes to the Basic Airframe Crashworthiness category (Table 5-7) in. An additional 170 points have been added to the basic airframe crashworthiness rating, and the maximum CI score increases the maximum to 810 points. The majority of the changes involve adding the ability to evaluate rotorcraft that impact various types of surfaces, at various gross weight / CG conditions, and at various impact angles. This change allows for the evaluation to focus on realistic scenarios and probable weight and CG conditions. The CI also reduces subjectivity in scoring for the basic airframe crashworthiness rating, by relying on occupant survivability as the primary measure of effectiveness. Occupant survivability is based on analysis of various occupant loads to ensure survivable levels are maintained.
Table 5-5: ADS-11B assessment areas and scores
Table 5-6: FSC assessment areas and scores

Full Spectrum Crashworthiness Criteria October 2011 Page 27
Table 5-7: Basic airframe crashworthiness
r Basic Airframe Crashworthiness
Crushing of Occupied Areas (Longitudinal Crash.) Evaluate the ability of the aircraft to withstand a 20 ftls longitudinal impact into a rigid abutment without crushing the pilot and copilot stations to an extent that would preclude a livable volume or crew evacuation and at 40 ftls without crushing the passenger/troop compartment by more than 15 percent
Absence of "Plowing" Tendency The nose and belly of the aircraft should have a smooth contour with structural members of sufficient strength underneath to prevent it from plowing a furrow in the earth subsequent to a nose down impact in soil from "run-on" approach speeds.
Resistance to Longitudinal Impact Loads The primary objective is to provide sufficient strength to prevent the roof of the aircraft from moving forward and downward with respect to the floor of the aircraft. Enough wal l structure must be available on either side of the aircraft to prevent collapse due to inadequate shear strength . In this respect, a fuselage with many large openings is undesirable . Continuous beams running from the nose of the aircraft under the floor the entire length of the occupied section are preferable since this type design w ill probably prevent the floor from buckling. Ensure that mass items are restrained to the load levels specified in ADS-36 .
Resistance to Vertical Impact Loads The structure must be evaluated by its resistance to collapse due to vertical impact loads of 5.1 .2 .1 , ADS-36.
If the engine and transmissions are located over the cabin or just aft of the cabin, the design tiedown strength should not be less than +/- 20G in the longitudinal and +20/-1 0 in the vertical direction and +/-18G in the lateral direction (applied separately) to prevent cabin penetration. In addition, these mass items require a simultaneous tri-axial load evaluation in accordance with ADS-36 . Regardless of tiedown strength, the fuselage shell should contain peripheral frames at a close spacing in order that a maximum amount of energy is absorbed before a mass wi ll penetrate the structure .
Cl Scoring
15
15
10
10
80
20
Cl Comment
Shall evaluate for prorated crash mission gross weights. For 20 ft/s requirement.
For 40 ft/s requirement .
No Change from ADS-11 B
No Change from ADS-11 B
Shall evaluate for prorated crash mission GW-CG. Shall evaluate for three terrain surfaces. Shall consider pitch and roll envelope. Shall ensure meet high mass items do not penetrate into cabin or cockpit for a vertical impact capability

Full Spectrum Crashworthiness Criteria October 2011 Page 28
Resistance to Lateral and Roll-Over Impact Loads Evaluate in regard to the probability of cabin collapse during a roll-over or lateral impact as defined in AOS-36. A circular fuselage with few large openings will have maximum integrity during a roll-over If the entire side o the cabin consists of a door, this structure wi ll be very weak and should be evaluated accordingly.
Landing Gear Vertical Force Attenuation The landing gear shal l be evaluated for its energy absorbing capability in both the extended and retracted modes (as applicable). With gear retracted, the design shall be such that the system energy absorption requirement of AOS-36, Table I is satisfied.
Assess high-angle combined longitudinal and vertical component capability Must evaluate for prorated crash
15
15
40
mission GW-CG, on a rigid surface. Must consider pitch and roll envelope. 20 Assess low-angle combined longitudinal and vertical component capability Must evaluate for prorated crash mission GW-CG, on a soi l surface. Must consider ro ll and yaw envelope . 20 An energy absorbing device shall be provided to minimize loads transferred to the tail boom in nose-high landings
Landing Gear Location Evaluate the damage which will be caused by this large mass as it is displaced during a crash. For example, if the gear is located directly under the cabin floor, the probabi lity of its being driven upward into the occupiable area must be evaluated.
Effect of Blade Strike Evaluate whether the design precludes rotor fa ilure and transmission displacement into occupiable space when the main rotor blades impact into a rigid object at operational rotor speed . Analysis must show that transmitted forces from such an impact will not cause main blade separation from the rotor hub nor separation of the hub from the rotor shaft, nor separation of the rotor shaft from the transmission . The analysis must also show that the blade's plane of rotation is not displaced sufficiently to enter occupied areas of the helicopter.
Effect of Fuselage Fracture/Separation A primary consideration is the manner in which the fuselage fails due to a load perpendicular to its longitudinal axis . If it appears obvious that the break in a fuselage will occur underneath a seat row, it is an undesirable design. Evaluate to determine whether the passenger seat structure and occupants ware significantly affected by a fuselage break.
5
5
20
5
Total 295
Shall eva luate fo r prorated crash mission gross weights for the 30 ft/s lateral conditions.
Shall meet static roll over criteria.
Shall evaluate for prorated crash mission GW-CG. Shal l evaluate for three terrain surfaces. Shall consider pitch and roll envelope.
No Change from ADS-11 B
No Change from ADS-11 B
No Change from ADS-11 B

Full Spectrum Crashworthiness Criteria October 2011 Page 29
The Crashworthiness Index will be used to measure how well a design meets criteria, enable trading between design features to minimize weight and cost, and provide a tool for improved communications between designers, program managers, airframe developers (e.g. government and industry teams) and the end user (e.g. the customer). The Crashworthiness Index Is a score based on a customer’s stated design mission and the capability of a design operating in these missions to provide crash survival capabilities. As an aircraft matures and derivative aircraft are proposed, the crash mission scenarios can be updated to reflect how an aircraft is actually used. The crash capability can then be re-assessed, and crashworthiness provisions can be added to maintain or improve the crash protection of the predecessor. For an existing rotorcraft design, a series of crash design scenarios can be introduced, and a crash capability baseline can be established. Baseline ratings of different aircraft can be compared and contrasted based on how they meet the mission requirements. The customer must first identify the missions that will be flown, and the key components that make up that mission (cargo weight, range, etc). Next, the customer must define the percent of time that an aircraft will be performing each mission. The percentage time spent at different locations within the gross weight – center of gravity (GW-CG) envelope will need to be determined. With this information, a designer can analytically show how well their design performs under those crash scenarios. The designer can also show how well their design performs on various impact surfaces, and at various pitch and roll angles. Using historical mishap data, or future Concept of Operation scenarios, the program manager can then weigh a design’s performance based on how often the aircraft is expected to perform in various environments. For example, a Navy or Coast Guard customer may want to emphasize water-impact capability more than an Army customer might. In general, a designer will be able to focus their design to perform its best for a specific mission or environment that they predominantly operate in over a specific terrain.
5.3.4 Calculating the Crashworthiness Index
The following will discuss the parameters that contribute to the calculation of the Crashworthiness Index (CI). Since some of the computations are complicated, a Microsoft Excel file has been prepared to automate and standardize the calculations. While the “Basic Airframe Crashworthiness” section tends to be an objective calculation, other sections of the CI tend to be more subjective, and the calculation of the CI should always include a narrative that describes the designer’s substantiation for assigning the number of points for each particular attribute. At first glance, the CI approach can appear to be a very thorough approach to allow for detailed testing, detailed analysis and multiple calculations. This approach can appear to be very complex and cumbersome, especially during the start of a design effort. The CI can also be greatly simplified to allow for system trades early in the design process. As the design becomes more solidified, and as models become more detailed and verified, the CI can accommodate these improvements. The goal is to have a CI calculating tool that can be used throughout the design process.

Full Spectrum Crashworthiness Criteria October 2011 Page 30
5.3.4.1 Missions
The customer will establish a series of design missions at the beginning of a new rotorcraft development program. The customer will also prorate the number of flight hours spent in each mission (e.g. The percentage of time conducting mission 1 over the life of the aircraft is 45%). During the development program, the designer will analyze and rate the crash capability of the proposed design primarily against the more likely weight / cg conditions (green cells) of all missions combined and secondarily against less likely but still possible weight / cg conditions (yellow cells). As the new aircraft matures and derivative aircraft are proposed, the missions may be updated, or the prorated flight times adjusted to better reflect actual usage. The crash index can then be re-assessed, and crashworthiness provisions can be added to maintain or improve the crash protection of upgraded aircraft. For an existing rotorcraft design, actual mission profiles can be developed, and a crash capability baseline can be established based on known mishap data and mission usage statistics.
Table 5-8 - Notional matrix of percent of time spent at various gross weight / CG conditions
5.3.4.2 GW and CG Envelopes
The crash design conditions of MIL-STD-1290A are defined at a basic design weight. It would be expected that the crash capability at higher or lower gross weights would be different. In calculating the CI the designer will investigate crash capability at various operational gross weights representative of the design missions. The goal of the prorated crash missions is to determine the percentage of time spent at different locations within the gross weight – center of gravity (GW-CG) envelope. The designer will determine the paths through the GW-CG envelope for each mission, and determine

Full Spectrum Crashworthiness Criteria October 2011 Page 31
the percentage of time spent at discrete combinations of gross weight and center of gravity. The prorated mission flight time will help determine the percent time spent in any combination of gross weight and center of gravity. Based on the prorated missions and GW-CG time durations, one can identify the scenarios that best represent a GW-CG combination that the aircraft will most likely be in when a crash occurs.
5.3.4.3 Vertical Crash Capability and Terrain Type
The airframe developer can next assess the vertical crash capability onto three hypothetical crash impact surfaces: rigid, soft soil, and water, at the likely CG-GW crash conditions. The relative importance of each terrain type can be equal or prioritized based on expected usage. One possible method of prioritizing the terrain types is to prorate the terrain types based on historical data (Figure 5-6). For a new rotorcraft design, the customer may decide to use the latest mishap data (The AATD FSC effort, Figure 5-6) to provide a series of ‘FSC surface factors. Thus, crash performance on soft soil would have a greater affect on the CI than crash performance on water.
Figure 5-6: Impact surface distribution from Army and Navy mishap data
For each discrete combination of GW and CG from the design missions, the designer will need to substantiate the vertical crash capability onto the three hypothetical impact surfaces. The vertical crash capability would need to be determined for both the landing gear extended and landing gear retracted scenario, if applicable. The
FSC surface factors

Full Spectrum Crashworthiness Criteria October 2011 Page 32
numerical value of the vertical crash capability (e.g. 26 ft/sec) would be the velocity at which, when the aircraft impacts that surface, at that GW-CG condition, crash survivability is ensured. In other words:
A protective space for occupants is maintained throughout the crash impact sequence
Occupants, cargo, and equipment do not break free of their normal location and positions
The magnitude and duration of accelerations and loads experienced by occupants is within survivable levels described in section 6.2;
No catastrophic injuries / fatalities occur due to contact with barriers, projections, and loose equipment;
The threat to occupant survivability posed by fire, drowning, exposure, entrapment, etc. is negligible.
The vertical crash capability velocity would reflect crash capability throughout the entire aircraft pitch and roll envelope as defined in MIL-STD-1290 (Figure 5-7). However, partial credit could also be given if the capability is determined for a level-orientation only (minimal pitch and roll). Additional credit could also be given for demonstrating capability beyond the MIL-STD-1290 pitch / roll envelope. Mishap data shows that 80% of survivable mishaps occur between +20/-10 degrees pitch and +/-20 degrees roll (Figure 5-8 and Figure 5-9).
Figure 5-7: MIL-STD-1290 pitch / roll envelope (green) versus expanded envelope (blue)

Full Spectrum Crashworthiness Criteria October 2011 Page 33
Figure 5-8: Pitch angles from mishap data. MIL-STD-1290A requirements (green) versus
expanded envelope (blue)
Figure 5-9: Roll angles from mishap data. MIL-STD-1290A requirements (green) versus expanded
envelope (blue)
Consider the vertical sink speed capability of a hypothetical rotorcraft (
Table 5-9). In this example, the landing gear-extended capability for the applicable GW-CG envelope was determined. In general, only the subset of the GW-CG envelope associated with the design missions needs to be considered (green and yellow cells). To reduce analysis time, one can focus on the more likely weight / CG locations (green cells). For the GW-CG combination of 70,000-lb at a CG location of 660-inches (from nose of the aircraft), the vertical sink speed capability is 35-ft/s onto water for all positions within the pitch and roll envelope (designated as F in the second table). For the GW-CG combination of 110,000-lb at a CG station of 600-inches, the vertical sink speed capability is 25-ft/s for a level-only orientation (designated as L in the second table). The process would be repeated to analyze with the landing gear retracted, if applicable.

Full Spectrum Crashworthiness Criteria October 2011 Page 34
Table 5-9: Example of specific surface, Wheels-Extended Vertical Crash Capability
Once these tables are completed, the benefit of the sink speed capability needs to be quantified. The vertical velocity cumulative percentile curve from the latest Full Spectrum Crashworthiness mishap data study could be used (Section 8). A value of 1.0 would be assigned for a vertical sink speed capability of 42-ft/s (historically a 95th percentile vertical impact for military rotorcraft). A value of 0.5 would be assigned if the capability was 26-ft/s which is the 95th percentile vertical impact velocity of civil rotorcraft[37]. Zero points would be given if the numerical value was less than 26-ft/s, but points greater than 1.0 would be possible if the capability was greater than 42-ft/s. Figure 5-10 illustrates this process for one point on the GW-CG envelope.
Rigid
120000 20 22
110000 25 26
90000 29 28 32
70000 30 32 36
540 600 660 720 780 840
Water
120000 25 27
110000 30 31
90000 34 33 37
70000 35 37 41
540 600 660 720 780 840
Soft_Soil
120000 30 32
110000 35 36
90000 39 38 42
70000 40 42 46
540 600 660 720 780 840
GW
CG STA
GW
CG STA
GW
CG STA
Rigid
120000 L L
110000 L F
90000 F F L
70000 F F L
540 600 660 720 780 840
Water
120000 F F
110000 F F
90000 F F F
70000 F F F
540 600 660 720 780 840
Soft_Soil
120000 L L
110000 F F
90000 F F L
70000 F F F
540 600 660 720 780 840
CG STA
GW
GW
GW
CG STA
CG STA

Full Spectrum Crashworthiness Criteria October 2011 Page 35
Figure 5-10: Assessing the Value of a Vertical Crash Capability The next step is to calculate an intermediate score that is the prorated rigid, soft-soil, and water terrain capability for each combination of gross weight and center of gravity, for each mission. The process for one GW-CG combination is illustrated in Table 5-10. The three components of the equation each represent a terrain type, and the values 0.172, 0.025, and 0.803 are the three surface factors which represent the probability of impacting a rigid, water, and soil impact surface respectively (i.e. from Figure 5-6). The value variables are determined from historical data for the rotorcraft’s rigid surface, water, and soft soil vertical sink speed capability (i.e. from Figure 5-10). The pitch and roll value (PR) of 1.0 would be used if the aircraft has demonstrated a vertical velocity capability at any location within the MIL-STD-1290 pitch and roll envelope. A value of 0.79 would be used if only level-attitude capability was claimed. The factor 0.79 was derived from work conducted on the RAH-66 Comanche program where both a full pitch and roll capability and a level-only sink speed capability were established for rigid-surface vertical impacts[38]. A larger value (e.g. 1.5) could be claimed if the pitch/roll capability that encompasses the 80th percentile of pitch roll impacts can be demonstrated (Figure 5-7).
Table 5-10: Prorated Vertical Velocity Capability
The final step involves summing the prorated vertical velocity values in the GW-CG envelope for each mission and multiplying each by the percentage time spent at each GW-CG combination. As can be seen in Table 5-11, there are a lot of combinations where no time is spent, and the crash sink speed velocity at those locations does not influence the CI. There are also weight and CG conditions that minimally affect the CI and therefore could be omitted without significantly affecting the score. The final percentage score should be multiplied by the 80 total points indicated in Table 5-7 for a ‘perfect’ score. Notionally, if a design exceeds requirements (e.g. greater than 42 fps capability, or an expanded pitch and roll envelope) the total score could be greater than 80. The same process is repeated for gear retracted scenarios, but to calculate the number of points for this attribute, the final percentage score should be multiplied by the maximum 40 total points as indicated in Table 5-7.

Full Spectrum Crashworthiness Criteria October 2011 Page 36
Table 5-11: Combined mission percentage scours and cumulative score
5.3.4.4 Longitudinal Crash Conditions
The longitudinal crash capability also contributes to the Crashworthiness Index. MIL-STD-1290A has two longitudinal crash requirements. The first is to provide capability for the pilot and copilot to egress in a 20-ft/s longitudinal impact, and the second is a 40-ft/s requirement where the cabin length must not be reduced by more than 15%. For the CI crash contribution, the longitudinal capability of the aircraft must be determined relative to the crash design missions. The percentage time spent at different mission gross weights is considered in the calculation. For the same hypothetical aircraft, Table 5-12 illustrates the percentage time spent at each gross weight.
Table 5-12: Percent Time Spent at Mission Gross Weights
The capability of the aircraft to provide egress for the pilot and co-pilot must be determined at the different mission gross weights, and a representative neutral CG can be used for each gross weight. The actual variation of center of gravity at each gross weight would have minimal effect in a longitudinal impact. If the MIL-STD-1290A crash capability of 20-ft/s is provided, 100% of the points would be assigned. However, a method is needed to assign partial score since gross weights in excess of the MIL-STD-1290A basic design weight have to be considered. Partial score would be given as long as the velocity was at least 16.1-ft/s. One half of the points would be assigned for 16.1-ft/s capability which is 65% of the energy associated with 20-ft/s. The points would be assigned as a function of energy which is the square of the impact velocity (Figure 5-11). The total percent score would be the scores for each gross weight prorated based on the percent time spent at each gross weight. In the example (Table 5-13), this hypothetical aircraft would get 84.64% of the maximum 15 point score indicated in Table 5-7.

Full Spectrum Crashworthiness Criteria October 2011 Page 37
Figure 5-11: Longitudinal Velocity for Pilot and Co-Pilot Egress
Table 5-13: Example of Longitudinal Velocity Percent Score for Pilot and Co-Pilot Egress
Similarly, the capability of the aircraft to maintain 15% of the cabin length must be determined at the different mission gross weights. A representative neutral CG can be used for each gross weight. If the MIL-STD-1290A crash capability of 40-ft/s is provided, 100% of the points would be assigned. Partial score would be given as long as the velocity was at least 35.8-ft/s. One half of the points would be assigned for 35.8-ft/s capability which is 65% of the energy associated with 40-ft/s. The points would be assigned as a function of energy which is the square of the impact velocity (Figure 5-12). The total percent score would be the scores for each gross weight prorated based on the percent time spent at each gross weight. To calculate the score, the percentage would be multiplied by the maximum 15 point score indicated in Table 5-7
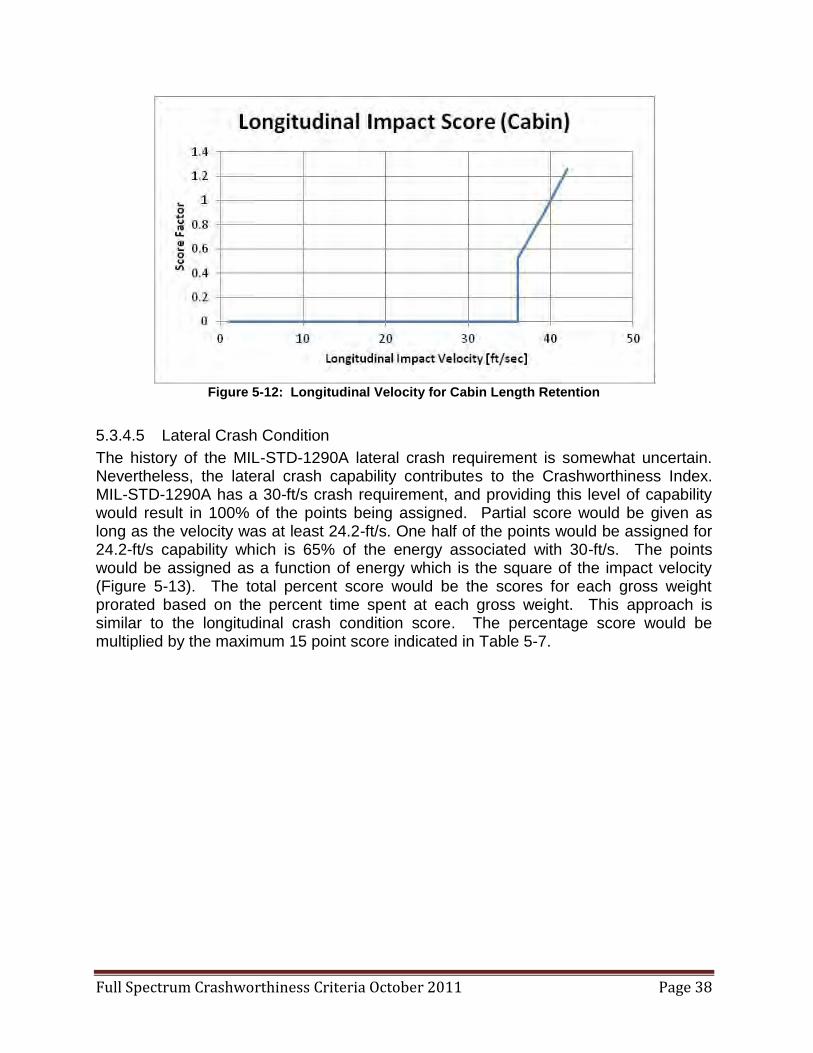
Full Spectrum Crashworthiness Criteria October 2011 Page 38
Figure 5-12: Longitudinal Velocity for Cabin Length Retention
5.3.4.5 Lateral Crash Condition
The history of the MIL-STD-1290A lateral crash requirement is somewhat uncertain. Nevertheless, the lateral crash capability contributes to the Crashworthiness Index. MIL-STD-1290A has a 30-ft/s crash requirement, and providing this level of capability would result in 100% of the points being assigned. Partial score would be given as long as the velocity was at least 24.2-ft/s. One half of the points would be assigned for 24.2-ft/s capability which is 65% of the energy associated with 30-ft/s. The points would be assigned as a function of energy which is the square of the impact velocity (Figure 5-13). The total percent score would be the scores for each gross weight prorated based on the percent time spent at each gross weight. This approach is similar to the longitudinal crash condition score. The percentage score would be multiplied by the maximum 15 point score indicated in Table 5-7.

Full Spectrum Crashworthiness Criteria October 2011 Page 39
Figure 5-13: Lateral Velocity for Cockpit/Cabin Width Retention
5.3.4.6 Combined Vertical and Longitudinal
Although MIL-STD-1290A requires it, the Basic Airframe Crashworthiness Section of ADS-11B does not specifically assess the combined vertical and longitudinal crash capability. Thus, both low-angle and high-angle design conditions have been added to the calculation of the CI. The high-angle, wheels-extended condition requires an assessment of an impact into a rigid horizontal surface with a 42-ft/s vertical component and a 27-ft/s longitudinal component. This 50-ft/s resultant represents a 57.2 degree flight angle. The aircraft is to be assessed at all positions within the pitch and roll envelope (Figure 5-7). This condition would be analyzed just like the pure vertical crash sink speed. When establishing capability, the flight angle should remain at 57.2 degrees. For example, in order to claim a capability of 38-ft/s, there would be a simultaneous 24.4-ft/s longitudinal combination. Like the other design conditions, full score would be given to meeting the 42-ft/s vertical and 27-ft/s longitudinal combination, and a minimum score of 0.5 would be given for achieving the 33.9-ft/s / 21.8-ft/s combination, which is 65% of the energy associated with the full score. The percentage score would be multiplied by the maximum 20 point score indicated in Table 5-7. Scoring is based on demon-strating the uppermost impact velocities at which injury to the crew and occupants is not likely to occur. The low-angle, wheels-extended condition requires an assessment of an impact into a horizontal surface with a 14-ft/s vertical component and a 100-ft/s longitudinal component. The flight angle is 8 degrees, and the same pitch and roll requirements can be used (Figure 5-7). This condition would be assessed for the same surfaces used for the vertical capability and not necessarily one that meets the MIL-STD-1290A California Bearing Ratio of 2.5 requirement. It would be expected that this condition

Full Spectrum Crashworthiness Criteria October 2011 Page 40
would be analyzed similar to the pure vertical crash sink speed. However, the value curve would be replaced by based on historical mishap data for these types of impacts (Figure 5-14). The data in this figure was established by determining the percent of mishaps that were within vertical and longitudinal limits defined by an 8-degree flight path. Like the other design conditions, full score would be given to meeting the 14-ft/s vertical / 100-ft/s longitudinal combination, and a minimum score of 0.5 would be given for achieving the 11.3-ft/s vertical / 80.6-ft/s longitudinal combination which is 65% of the energy associated with the full score. The percentage score would be multiplied by the maximum 20 point score indicated in Table 5-7.
Figure 5-14: FSC Mishap Statistics for an 8-Degree Flight Path
5.3.5 Applicable Technologies
There are a number of applicable technologies that contribute to a fully crashworthy system. The following sections describe those technologies, and how they can affect the Crashworthiness Index.
5.3.5.1 Vehicle Management System (VMS)
Consideration should be given to active means of auto-landing to significantly reduce crash energy prior to impact. VMS systems that are able to detect imminent impact may be able to attenuate crash energy prior to (or possibly during) contact with the impacted surface. Performance will be dependent on the crash scenario and the rotorcraft type and class.
5.3.5.2 Rotor System
Rotor systems can provide substantial energy attenuation prior to impact, depending on the event. Design considerations should be given to achieve good autorotation ability to reduce impact velocity. Autorotation is not always possible when crash events initiate too close to the terrain, or when there is insufficient forward velocity to initiate autorotation. To preclude fatal blade strike of personnel and equipment, the rotor blade must not intrude into occupied space. The main rotor hub and transmission

Full Spectrum Crashworthiness Criteria October 2011 Page 41
should be retained securely enough that if the crash is survivable, there is no danger of the rotor hub or the transmission penetrating occupied space upon impact. The ability to utilize the kinetic energy of the rotor system during crash and hard landing events is a major consideration to reduce the severity of the impact, occupant injuries, and aircraft / mission equipment package damage. A reliable automatic landing/autorotation assist system would reduce the pilot workload during an emergency and enable using the kinetic energy of the rotor system in an optimal manner. The Automatic Autorotation Mode Task Tailored Control Law (TTCL) and Rotor Speed Limiting Carefree Maneuvering (CM) algorithms developed under the U.S. Army Helicopter Active Control (HACT) program represent the current state-of-the-art in rotor system automatic landing technology. High fidelity piloted simulations indicate that the HACT Automatic Autorotation Mode TTCL and Rotor Speed limiting CM algorithms reduce the pilot workload significantly during transitions to unpowered flight. Active Crash Protection System ACPS can also be integrated with automatic landing capable subsystems to obtain additional information regarding the anticipated impact conditions during crashes and hard landings. This information in conjunction with the data from aircraft onboard radar altimeters and inertial navigation systems would greatly increase the accuracy of the ACPS. The benefits of the automatic landing systems can also be further quantified using simulated rotor lift time-histories with the generic aircraft models.
5.3.5.3 Landing Gear
The primary purpose of landing gears in a crash event is to minimize the aircraft damage during hard landings and provide protection to the occupants by absorbing part of the system kinetic energy during crash impacts. The energy absorption capability of the landing gears is provided by the landing gear shock struts. The shock struts typically employ multi-stage oil-nitrogen systems to provide damping for ground resonance as well as energy absorption during crash impacts. Some shock strut designs also employ mechanical or elastomeric second stages to absorb impact energy. If a rotorcraft impacts onto soft soil at crash sink speeds, the landing gear performance is thought to be compromised. However, the deformation of the impact surface does attenuate some of the crash impact energy. A similar analogy is thought to apply for the fuselage-onto-water impacts, as well. LS-DYNA Modeling parameters have been derived for a variety of soil types and simulations could be capable of determining the effectiveness of landing gear impacts on soft soil and the quantification of crash energy by soil deformation. Current landing gear technology is based on fixed hydraulic orifice and metering pin technologies. One drawback of this technology is that the shock strut loads can exceed the design strength allowable at high impact velocities. More advanced landing gear shock struts using pressure sensitive orifice technology to solve this problem have been developed successfully and are beginning to transition into production. The effectiveness of the landing gears, to a large extent, depends on the impact surface. The landing gears may not be effective during crash impacts on water and, to some extent, on soft soil.

Full Spectrum Crashworthiness Criteria October 2011 Page 42
Full spectrum crashworthiness criteria are at the system level and do not include detailed landing gear design requirements. The FSC requirements specify a minimum vertical impact capability. The landing gear design will also need to be adaptive to the changes in aircraft gross weight and center of gravity. Research and development activities are focused on shock strut improvements and others are focused on improving structural efficiency of the landing gear structures. The shock strut improvements include optimizing stroking loads through modulation of orifice size as well as viscosity of the hydraulic fluid. Landing gear structural efficiency improvements have been focused on application of advanced composite materials to landing gear components such as trailing arms and drag braces.
5.3.5.4 Externally Deployable Energy Absorbers
The purpose of externally deployable energy absorbers is to supplement the energy absorbing capability of the rotorcraft system. These systems can be deployed when needed to minimize the aircraft damage by supplementing the landing gears during hard landings as well as to minimize or eliminate occupant injuries by supplementing both landing gears and energy absorbing airframe structures. It is anticipated that the externally deployable energy absorbers will be part of rotorcraft crash activation systems with capabilities to sense an impending crash event and control the appropriate crashworthy subsystems. Externally deployable energy absorbers can provide a technology solution for multi-terrain impacts (water and soft soil) where some of the crashworthy subsystems such as landing gears would not be as effective. They also provide a capability to increase the energy absorption capability as the aircraft gross weight increases and also compensate for center of gravity shifts by selective deployment during crash impact events.
5.3.5.5 Crashworthy Airframe Structure
The primary purpose of the airframe structure during a crash impact is to reduce the airframe accelerations through energy absorption and to maintain a survivable volume for the occupants. Energy absorption can be provided through crushing of the subfloor structure in a controlled manner. Additional energy absorption may also be provided by various energy absorbing mechanisms for the high mass items (engines, transmission, etc) as well as controlled deformation of the cabin frame structures. Tilt rotor configurations can also have energy absorption capability through controlled deformation of the wing structures, as well. In order to meet higher performance requirements, modern (and future) rotorcraft are being designed with composite airframes. In order to ensure crashworthiness requirements are met, innovative designs are necessary to ensure the composite airframe is capable of both absorbing energy and maintaining occupant volume. Recent efforts [39] have shown that it is possible to design composite airframes for both carrying structural load and absorbing crash energy.

Full Spectrum Crashworthiness Criteria October 2011 Page 43
Other airframe technologies that enable improved crashworthiness include pressure resistant skins, alternate load path structures (depending on the impact conditions) and lightweight mass retention systems. Pressure resistant skins improve water impacts by plastically deforming, rather than bursting. By changing this failure mode, occupant volume is maintained and egress time is improved through the limitation of water ingress into the cabin.
5.3.5.6 Kinetic Energy Shedding
A significant amount of kinetic energy may be eliminated from the aircraft system by judiciously designing controlled failure of sacrificial structural subsystems such as the tail boom on a helicopter or wings on a tiltrotor. For example, allowing the lower longerons of a tiltrotor wing to crumple, buckle, or break away at a sufficiently high load, but below the strength of the supporting fuselage bulkhead, prevents collapse of the fuselage (preserving a survivable space) as well as provides controlled downward and outward displacement of the massive nacelles and proprotors.
5.3.5.7 Sensors
Operations in degraded visual environment (DVE) below effective translational lift (ETL) (i.e. hover) require special equipment as the flight visibility can quickly drop to zero and leave the crew unable to successfully cope with the DVE. At present, several options are available to deal with the DVE threat. Sensor technology may be an option for this challenge. The first candidate is 'see through' technology which uses high power millimeter wave radar to view objects through obscuring clouds of dirt or snow and presents the view to the pilot. Another sensor technology candidate is 'see and remember' technology which uses LIDAR to detect obstructions (before the DVE develops) and create a virtual image that is subsequently made available to the pilot during the landing. Flight control law technology is another potential avenue for dealing with DVE. An automatic landing system which could take a helicopter safely to the ground without pilot input would permit routine DVE landings. Alternatively, an 'auto hover' capability, instantaneously available to each pilot could prevent a host of bad DVE outcomes and permit safe landings in conditions with no visibility. These automatic maneuvers could also mitigate the severity of a crash event by maximizing energy dissipation prior to impact with the ground. DVE from particulates is a hovering flight phenomenon. Reduced visibility in cruise is referred to as Instrument Meteorological Conditions (IMC). Fatalities in helicopter mishaps are clustered into cruise flight and controlled flight into terrain (CFIT) as the primary cause. For every fatality due to DVE in hover, more than 20 are caused by cruise CFIT [35].
5.4 Fire Prevention / Suppression
Before the introduction of crash-resistant (or crashworthy) fuel systems, post-crash fire was the leading cause of death in otherwise survivable crashes. Post-crash fires were found to prevent successful emergency egress by causing both fatal thermal injuries and fatal breathing related injuries due to toxic fumes. Crash-resistant fuel systems

Full Spectrum Crashworthiness Criteria October 2011 Page 44
greatly facilitate safe escape by ,minimizing the likelihood of post-crash fires through preventing the spillage of fuel during and after the crash. Fire suppression systems can also be included in rotorcraft system designs to further reduce the risk of fire related injury. These systems can be positioned in the engine compartment in areas susceptible to fire initiation upon impact. They should be automatically activated as part of the aircraft’s integrated crash sensing system, either due to impact acceleration (fire preventive), or when a temperature threshold is exceeded (fire reactive). When activated, fire retardant materials are either dispersed into the compartment, or inert gasses are suddenly blown into the compartment to extinguish the fire.
5.4.1 Crash Resistant Fuel Systems
The primary purpose of crashworthy fuel systems is to minimize and delay the onset of post-crash fires. The systems include components such as break-away valves, frangible connectors, and tear and puncture resistant fuel tanks (MIL-DTL-27422) to minimize spill of fuel and lubricants during crash impacts. FSC requirements are expected to be at the aircraft system level and will not include detailed crashworthy fuel system requirements. The crashworthiness of the fuel system is included in the CI using an approach similar to ADS-11B (see section 6.4), with a scoring based on the fuel system meeting already defined requirements for fuel systems. Depending on where the fuel tank is located, the fuel system can also influence the design of the surrounding airframe structure. The surrounding structure needs to be designed to withstand the hydrodynamic pressures from the fuel tanks during the crash impact. These systems use design features including puncture resistant fuel bladders and self-sealing breakaway fuel lines. Successful implementation of crash resistant fuel systems has virtually eliminated thermal fatalities and injuries in survivable rotorcraft crashes and should be an integral part of any future rotorcraft. Additional background about these systems can be found in MIL-STD-1290 [1] and the Aircraft Crash Survival Design Guide (USAAVSCOM TR 89-D-22E) Volume V – Aircraft Post crash Survival [40].
5.4.2 Technologies applicable to fire detection and suppression
Technologies to prevent and suppress fire conditions include: high strength, high elongation materials, tear and puncture resistant fabrics, self sealing materials or structures, oxygen inerting systems, fuel absorbing materials, smoke / fire detection and suppression systems. These technologies, together with evolving design approaches, will reduce the likelihood of fuel spillage and fuel induced fires.
5.5 Injurious Environment Considerations
An airframe with its mechanical systems and installed components can provide many potential areas for improvement for creating less injurious environments to the occupants. The primary contribution of the airframe structure during a crash impact is to reduce the airframe accelerations through energy absorption and to maintain a survivable volume for the occupants. Energy absorption or energy attenuation is required to reduce impact loads transmitted to occupants and to mitigate damage to

Full Spectrum Crashworthiness Criteria October 2011 Page 45
high priority mission equipment packages. There are various methods to absorb (attenuate) the kinetic energy of a crash event. Energy absorption can be incorporated into the aircraft design for the fuselage through crushable structure, the landing gear through shock like mechanisms and other technologies, and into restraint systems utilizing various technologies, be they a system of cables and pulleys or breakaway links, crushable tubing throughout the aircraft or crushable subfloor structure . Additional energy absorption may also be provided by various energy attenuating mechanisms for the high mass items (transmission, engines, etc.), as well as through controlled deformation of the cabin frame structures. Overall system design is critical to providing adequate energy absorption. Tilt rotor type rotorcraft can also have energy absorption capability through controlled deformation of the wing structures. Structural integrity is critical for occupant restraint, high-mass item retention (or management), maintaining load paths to energy absorbing features, and maintaining occupant space. Consideration should also be given to how the structure will be affected by impact surface variability. In addition to the airframe, the mechanical systems, restrained cargo and installed components should also be given consideration for minimizing injuries to occupants.
5.5.1 Maintaining Survivable Occupant Volume
The aircraft and its systems should maintain a protective, livable space for occupants and high priority mission equipment packages throughout the entire crash sequence. During the initial contact phase, survivable space may change dynamically as various components decelerate (e.g., seats stroke, structure buckles and collapses). Maintaining a survivable volume includes limiting the intensity of accelerations experienced by occupants and critical mission equipment packages to tolerable levels; properly restraining occupants, cargo, and equipment during the crash sequence; preventing injuries resulting from contact with barriers, flailing limbs or torsos, projections, and loose equipment; limiting the threat to survivability posed by fire, drowning, exposure, and entrapment; and enabling safe emergency egress following a crash impact. Anti-plow beams are often incorporated in the nose structure of aircraft to prevent sudden horizontal decelerations. Appropriately placed beams in the nose may also provide added rollover strength to reduce the possibility of blade impingement into the cockpit.
5.5.2 High Mass Management
High mass items that are above or behind occupied space must be managed during the crash sequence so that they do not penetrate the occupied space. These items generally include but are not limited to the main rotor transmission, engine(s), and large cargo. Management of these high mass items could mean retention, especially the helicopter main transmission and engine(s), minimizing penetration or preventing rotor blade penetration into the occupied space. However, management also includes controlled displacement through passive or active energy absorbers. High mass overhead displacement has been shown to be an issue in Army human factor mishaps for single rotor cargo utility helicopters [35].

Full Spectrum Crashworthiness Criteria October 2011 Page 46
5.5.3 Cargo Management
Cargo is customarily not viewed as being high mass items requiring special retention. Instead, retention of cargo is based on load factors (see the appropriate structural design criteria report for the affected rotorcraft) derived from doctrinal use of the aircraft and a maximum gross weight of cargo. These load factors are not part of static crashworthy criteria. Thus, and from an airworthiness point of view, an aircraft may meet cargo load factor criteria, but not necessarily crash load factor criteria. Moreover, when the need arises to exceed the maximum cargo gross weight, a waiver is typically granted (for this case, the aircraft does not meet cargo load factor criteria). Further, there may be a standard operating procedure in place that establishes cargo restraint factors, and these factors may differ from those that a structural design criteria may specify. Cargo management may have significant impact on crash survivability and should be considered in crashworthy design. Waivers to standards and design criteria should also be given careful consideration due to the potential risk involved if a crash should occur.
5.5.4 Strike Hazard Mitigation / Delethalization
Some changes are cultural rather than engineering dependent. The Air Force and the Army do not require all passengers to wear helmets when aboard rotorcraft. Head injury is the leading cause of both injury and death aboard US military rotorcraft. The Navy has maintained an impeccable standard of head protection during helicopter operations and their injury data defines the improvements achievable by the other two service departments. Head protection should be worn by all occupants of rotorcraft. Another cultural issue encountered in military operations is the removing of restraints prior to landing or the initiation of a fast-rope deplanement. Some passengers unbuckle from their restraints a minute out from the landing zone or fast rope exercise. This occurs before the aircraft is either on the ground or stabilized in a hover. When mishaps occur during these operations, the outcomes for the unsecured occupants are predictably poor. Each service department needs to adhere to strict requirements to minimize the chance that someone is unsecured when a mishap occurs[35].
5.5.5 Integration Design for Injured Crew
Survivability systems should be designed with the following in mind:
Ease of use, single hand operation.
Simplicity of operation of components for egress.
Fail safe equipment that still provides functionality when damaged,
Dual use equipment (troop seat used as a tent, seat cushion as a flotation device, cabin soundproofing-blanket, cargo doors-shelter).
5.6 Design for Post-Crash Survival
The survival of aircraft occupants following a crash or ground emergency is often dependent upon the ability of occupants to rapidly evacuate the aircraft before the local environmental conditions (i.e. post-crash fire, toxic gasses, water immersion, etc.) cause injury. Therefore, the aircraft must include an emergency egress system that enables all occupants to perform their own escape before being overcome by

Full Spectrum Crashworthiness Criteria October 2011 Page 47
threatening post-crash environmental conditions. Additionally, systems must be provided that eliminate, mitigate, or protect against post-crash environmental hazards so occupants are not incapacitated before completing their safe escape. This consideration can include integration of crash resistant fuel systems, fire suppression systems, aircraft floatation systems, personal breathing devices, emergency egress lighting systems and an overall aircraft safing system that automatically or manually deactivates aircraft systems that pose potential dangers during egress.
5.6.1 Aircraft Safing
In order to prevent subsequent injury during the egress and escape period, the aircraft and systems should facilitate or automatically accomplish safing from hazards to egress. Electrical power should be terminated to eliminate ignition sources. Major components of the rotor system, hydraulics, power supplies, etc., should either depart the airframe or come to complete stop as soon as possible. During a crash some rotorcraft systems required for flight can suddenly become major post-crash hazards to aircraft occupants. Examples include systems such as electrical systems (generators and batteries) which can become fire ignition sources, and fuel pumps continuing to operate which can increase the risk of dispersed fuel. Engines continuing to operate with rotating blades can also introduce hazards to evacuating occupants. Due to injury and their own survival needs, pilots may not always be able to perform all necessary procedures to shut down such aircraft systems that might still be in an active state after a survivable mishap. For this reason, to facilitate safe evacuation, consideration should be given to including a crash activated safing system that automatically places applicable aircraft systems in the appropriate post-crash mode.
5.6.2 Design for Egress
An adequate number of exits should be provided with sufficient size in order to give occupants a variety of locations to egress the rotorcraft in case some exits are blocked due to the aircraft’s position after the crash. Emergency exits should be clearly identified. A sufficient number of exits must be provided in order for all occupants to quickly evacuate the aircraft during a ground emergency or after a survivable crash. The number of exits, their sizes, geometry, location, and ease of opening has a direct effect on an occupant’s ability to egress rapidly in an emergency before becoming overcome by post-crash environmental conditions such as fire, toxic fumes, and submersion. Helicopters with relatively wide fuselages pose egress difficulties in situations where the helicopter comes to rest on its side, because in that orientation the ground blocks the exits on one side (now down), and the exits on the other side (now up) can be out of reach. With these aircraft configurations it is extremely valuable to have exits in the aircraft’s ceiling and/or floor when possible. Pyrotechnically opened exits have been found to have advantages of being able to reliably open even after sustaining impact deformation that can jam conventional mechanical release mechanisms. Also, pyrotechnically opened exits have been found to have weight advantages, and were for that reason selected for the especially weight sensitive V-22 tilt rotor. In addition to using pyrotechnics to open conventional hatches, line charges can be used to cut open exits in other areas of aircraft structure.

Full Spectrum Crashworthiness Criteria October 2011 Page 48
For safe egress from the crashed or ditched vehicle, the airframe should be designed to provide or retain unobstructed paths to vehicle hatches, doors, or portals - a minimum number of which should remain unobstructed due to vehicle orientations or submersion after the crash event. Hatches and doors should retain sufficient integrity so that they remain operable. In the event of ditching or crash into deep water, the airframe should provide stable buoyancy sufficient to prevent sinking, and to prevent inversion to the maximum extent possible.
5.6.2.1 Localized Entrapment Prevention
Military mishap experience has revealed many ways that impact survivors have been entrapped within an aircraft and then killed by post-crash environmental conditions such as fire, toxic gasses, and submersion. An effective emergency egress system must be developed with an understanding of these real world hazards and include design mitigation strategies. Entrapment is often not caused by a single obstacle to egress, but by the combined effect of several partial restrictions including: airframe deformation resulting in partial loss of occupiable space, jammed exits, shifting of internal cargo and mission equipment that blocks exits, and protrusions in the aircraft interior that cause snag hazards. In aircraft with cargo compartment airbags installed, the Navy has identified a concern that the airbags could become an entrapment hazard in a water impact. Possible solutions could be: to ensure bags that affect this risk remain inert while over water, or bags quickly deflate after the initial impact.
5.6.2.2 Egress assistance
Emergency lighting and fire suppression systems and/or extinguishers should function as necessary. Safe egress can be improved using audio cuing and visual cuing techniques to support situational awareness. Placards and markings designed to aid personnel in locating closest egress and safety gear shall be easily identified and understandable. Specific definition of the required escape route configuration depends on the aircraft type, its seating layout with respect to emergency exits, and the anticipated post-crash conditions of the aircraft. Emergency exits which are located on the aircraft sides may not be accessible in cases where an rotorcraft has rolled onto its side, which is common for rotorcraft. In these cases, special hand-holds may be required to provide access to the exits. Visual cueing that leads to hatches, exits, doors, handholds, guide bars will increase evacuation times. Cueing shall not be dependent on electrical or mechanical systems being operational. Design of these egress routes that will be used for underwater escape must take into account the fact that the occupants will be essentially swimming, pushing, and pulling themselves underwater to their exits. It is vital that hand-holds be interspersed throughout the entire escape path so that occupants can maintain a grip on aircraft structure at all times; from the time they depart their seat until they are outside an aircraft emergency exit. The hand-holds serve the dual purpose of providing fixed points from which occupants can pull themselves through the aircraft interior, and providing critically needed reference points to maintain spatial orientation. In some cases the hand-holds can be continuous guide bars spanning the entire length of the cabin. To assist in

Full Spectrum Crashworthiness Criteria October 2011 Page 49
darkness, the guide bars can be either self-illuminating, or lighted from an external source. Guide bars can also have tactile indicators to identify when an exit has been reached. When a series of single point hand-holds are used, they should also be illuminated with emergency lighting. Emergency egress lighting is needed to enable aircraft occupants to quickly locate emergency egress paths and exits that could otherwise be obscured by smoke or underwater conditions, particularly at night. The emergency egress lighting system should be automatically activated as part of the aircraft’s integrated crash sensing system. Emergency Egress lighting should also operate when other electrical systems are deactivated due to fire prevention measures.
5.6.2.3 Egress Time
The top-level parameter most often used to specify overall performance of an emergency egress system is the total time required to evacuate the aircraft under post-crash conditions. For a specific aircraft application, the actual time limit for emergency evacuation should be determined by an analysis of specific emergency egress needs and threats. The analysis should take into consideration factors such as anticipated post-impact environmental hazards (e.g. fire, toxic gasses, submersion, darkness) and their associated time dependencies and life-threat relationships (Figure 5-15).
Figure 5-15: Emergency Egress Timeline for a Water Crash
Key design parameters include the ratio of the number of exits to the number of occupants, exit sizes and geometry, exit release mechanisms, distance to exits, and a breakdown of the tasks required by occupants to use the emergency egress system. The functions of an emergency egress system are also affected by the performance of other aircraft systems and equipment. For example, aircraft deformation can jam emergency exits, and intrusion of aircraft structure can block escape paths. Because of these and other interrelationships, the emergency egress system must be designed using a systems engineering approach taking into account the various aircraft elements
Impact
Warning Time Emergency Egress Phase Availability of Emergency
Breathing Devices
Inversion/
Rotation
In-Rushing
Water
Disorientation/
Confusion
Exit
Jettison
Harness
Release
Snagging
Reaching
Exit
Darkness
Injury
Water
Temperature
time
Secondary
exit route?
Layout/Configuration
Breath hold
ability

Full Spectrum Crashworthiness Criteria October 2011 Page 50
identified as having a functional impact on emergency egress. The allocation of specific systems and equipment to facilitate emergency egress should be based upon the results of an emergency egress trade study that is part of the overall aircraft design trade study.
5.6.3 Aircraft Flotation
When conventional rotorcraft (non-tilt rotor) ditch or crash in water without aircraft floatation systems they typically invert almost immediately and are often below the surface in less than 15 seconds. This response in water is due to the high center of gravity associated with conventional rotorcraft designs and large aircraft openings that often remain open in-flight due to combat mission requirements. Rapid water entry can also be caused by structural damage incurred during water impact. Examples of high mass items contributing to the high center of gravity in conventional rotorcraft include engines and gear boxes located above the fuselage. Examples of large openings that often remain open in flight include cargo ramps, troop access doors, and gunner windows. Because of this post-crash response in water, rotorcraft occupants can become disoriented during inversion, overcome by in-rushing water, and susceptible to drowning. Tilt rotor aircraft can have a different stability problem of tending to pitch nose down or nose up about the axis of the wing. Regardless of type, rotary wing aircraft have unique and significant floatation issues when crashing into water. Aircraft floatation, whether inherent or supplemental, can provide the additional time and stability needed for occupants to successfully egress the aircraft before submersion. Supplemental floatation systems, generally in the form of deployable floatation bags, are used on some rotorcraft to both stabilize the aircraft in roll and pitch, and to delay submersion for evacuation. Automatic operation increases the probability of the system actually being used in a crash since pilots, due to their own injuries, may not be able to manually activate the system after crashing. Activation should be initiated by the aircraft’s integrated crash sensing system, including sensors that detect contact with water. Deployable flotation bags are required on civil rotorcraft that fly beyond a threshold distance from coastlines. As an alternative or supplement to deployable flotation bags, inherent floatation can also be provided by insuring the rotorcraft has sufficient built-in buoyancy to retard sinking and provide stability. This generally requires that pre-determined compart-ments within the aircraft structure are designed to remain structurally air tight after a ditching or water crash. Because of the human factors associated with underwater escape, the military uses underwater training devices to provide military aircrew and troops with emergency egress practice. These training devices are modular and con-figured for specific aircraft types to train crew to egress from the aircraft type they will be flying. For this reason, aircraft development programs need to coordinate with the military training commands so any unique training requirements are taken into consideration. For example, if crew weapons are to be mounted in escape windows or hatches, means of jettisoning the weapon need to be included in the aircraft design, and added to the training systems.

Full Spectrum Crashworthiness Criteria October 2011 Page 51
5.6.4 Survival Gear
Provisions and gear for post-crash survival should be easily available to egressed passengers. Life rafts, personal flotation devices, shelters, and other equipment should be deployable or retrievable from outside the airframe or automatically dispense or deploy as appropriate. The survival gear should be stowed in a manner that preserves the function and utility of the gear for emergency use. Survival gear should include an emergency locator transmitter and communications as necessary to ensure rescue support can be notified.
5.6.4.1 Life Rafts & Personal Flotation
For rotorcraft operating overwater, provisions must be included in the rotorcraft design for stowage and deployment of life rafts for the maximum number of aircraft occupants. The life raft size, weight, and its stowage provision must take into account the amount of time available for deploying the life raft considering the predicted rotorcraft post-crash orientation in the water and it’s sink rate. In some cases it may be necessary or preferable to have automatically deployable life rafts installed in external sponsons or other aircraft compartments near the outer surface. If automatically deployed, it should be initiated by the aircraft’s integrated crash sensing system. Manual deployment of life rafts can significantly reduce their effectiveness [41], [42]. For military aircraft, personal life preservers are normally included as part of the body borne equipment ensemble, but if not, provisions should be provided in the aircraft for stowage of and quick access to personal life preservers for all occupants. A 1984-1996 study [41], [42] of 15 reported civilian helicopter accidents found only one where a life raft worked successfully. An alternative is to consider making the helicopter float. The Civil Aviation Authority is looking into the potential of side floating helicopters If this is not feasible and there is a requirement that would necessitate a life raft, then:
It should be stowed external to the fuselage, and preferably automatically deployable
Positioning of painter lines should be carefully thought out to ensure retrieval of the raft.
Boarding the life raft from the open ocean is very difficult and must be demonstrated in a relevant, realistic environment (cold, high sea state, rain).
The ability to Erect a canopy, particularly in an elevated sea state and wind conditions needs to be ensured.
The life raft must be designed as an integrated part of the whole helicopter operation, i.e. stowage, deployment, and the steps to conduct a dry shod or wet evacuation from the cockpit and the cabin, wearing different types of immersion suits, and under typical weather conditions, sea and air temperatures.
5.6.4.2 Supplemental Breathing Air
The U.S Navy has developed small underwater breathing devices provided to aircrew and troops flying overwater in rotorcraft. These compressed air sources can attach to survival vests or seats, and generally provide several minutes of emergency breathing air. This supplemental air provides additional time for occupants to overcome egress

Full Spectrum Crashworthiness Criteria October 2011 Page 52
problems they may encounter when performing the difficult task of egressing a rapidly sinking inverted rotorcraft. These systems, referred to as Helicopter Breathing Air Device (HBAD) or Helicopter Emergency Egress Devices (HEEDs), have been very successful in increasing survival rates in Naval mishaps at sea [35]. Breathing air devices have also been found to facilitate egress in ground mishaps where occupants would otherwise be overcome by smoke and toxic fumes. These devices are provided in the form of smoke hoods made from transparent heat resistant materials that enable users to both breathe and open their eyes in smoke and toxic fumes. These devices are sometimes installed in seating systems within reach of seated occupants. Their most common application is for aircrew in fixed wing transport aircraft, but they are now being used in rotorcraft applications, as well.
5.6.4.3 Search And Rescue (SAR) Aids
After successfully egressing an aircraft, occupant survivability can then depend on how quickly the surviving occupants are rescued, taking into consideration any life threatening injuries sustained during the crash requiring medical attention, and outside environmental conditions. In military operations there is the additional factor of being rescued before being captured by hostile forces. Rapid rescue can be facilitated by including an Emergency Locator Transmitter (ELT) that is automatically activated through the aircraft’s integrated crash sensing system. New systems available are capable of receiving position data, including encrypted position data. Aircraft and personnel locator systems should be designed to work with the new capabilities. However, systems must be designed to ensure that hostile forces cannot detect aircraft post-crash transmissions. Aircraft should also be equipped with other signaling equipment such as radios, flares and smoke generators.
5.6.4.4 Drowning Prevention
Water impacts have a potential to have a greater deceleration distance that allows for lower forces on impact and theoretically fewer and less severe human injury. The nature of existing DoD rotary wing platforms are such that when the helicopter impacts water it will invert and sink. This pattern contributes to an increased frequency of drowning by causing an otherwise survivable mishap to be further complicated by reducing the survivable space during the impact phase and adding disorientation to the egress phase. Thus, while water impacts could induce less damage to the occupants, if drowning isn’t prevented the effective crashworthiness is not improved. Ensuring safe egress and drowning prevention can greatly increase occupant survivability in a water impact. An analysis of all the helicopter drowning mishaps that occurred in the US Department of the Navy (DoN) from the period of 1985 – 2005 found that 23 of the 28 cases were before 1995. Furthermore, 105 additional fatalities that occurred during the same period were categorized as “lost at sea.” The cause of death in these cases may have been drowning, trauma, or exposure. Prevention of over-water deaths must therefore

Full Spectrum Crashworthiness Criteria October 2011 Page 53
also include consideration of these factors that are unique to over-water mishaps. The changes made by the DoN in the mid 1990’s created a seven-fold reduction in over-water fatality risk. Forty percent of DoN helicopter fatalities in the first decade were a result of drowning or becoming lost at sea. The DoN reduced the proportion of the fatalities caused by water from 1995 - 2005 to only ten percent [35]. Multiple policies applied to aircrew and passengers caused an improvement in water impacts in the late 1990’s. These included the institution of emergency breathing devices, use of immersion suits, and the mandatory wearing of head protection. In addition, the use of energy absorbing seats for passengers has had a net positive effect in shifting ~20% of injuries and fatalities to less severe trauma [35]. Perhaps the most successful of these policies is the required underwater egress training (UET), also known as “dunker training.” The UET simulates the helicopter water mishap scenario in a mock helicopter flight deck and crew compartment that is lowered into the water and inverted. Dunker training skills focus on techniques that reduce disorientation and prevent additional trauma during egress. Trained crew members become proficient at egress from an upside down restrained position in the dark. [35] Small compressed air bottles are added to the survival vest for helicopter aircrew flying over water. This device includes a regulator and mouth piece similar to typical recreational SCUBA gear. The usual volume is sufficient to provide a few breaths of air depending upon water depth and respiratory rate. Compressed air bottles have provided the additional time required for multiple cases of safe water environment egress. The combined experience of UET training and the availability of compressed air bottles provides an additional unmeasured benefit of confidence that is essential in an underwater helicopter mishap situation [35].
5.7 Information Supporting Design Validation Requirements
The DoD uses Technology Readiness Levels (TRL) and Manufacturing Readiness Levels (MRL) to quantify the maturity of technology and manufacturing capability [43]. A similar approach to assess analytical models was proposed with an Analytical Tool Readiness Level (ATRL). This assessment (Figure 5-16) is based on an analytical tool’s correlation to test data as well as prediction of untested scenarios. Depending on the maturity of a design and the robustness of the modeling tool, various ATRL levels could be necessary to provide validation. Configuration trades can be made with lower ATRL tools, while detailed analysis of specific components would require robust modeling tools to account for variations in crash scenarios (e.g. impact surface, roll, pitch yaw, etc). An informal poll of impact analysts (ca. 2009) indicates that the ATRL for the current generation of explicit transient dynamic finite element codes ranges from 4-5. Note that an ATRL rating of 9 is needed to achieve certification by analysis. Until ATRL 7 is reached, modeling and simulation should be used in a building block approach with component level correlation. A building block approach will help establish confidence between test and simulation at the component level (e.g., statistical Hypothesis Testing) and allow for both calibrated component models and a system level assessment [43].

Full Spectrum Crashworthiness Criteria October 2011 Page 54
Figure 5-16: Analytical Tool Readiness Level. Reprinted from Reference [43].
Given the fact that current generation analytical tools do not have a sufficient maturity level for aircraft certification, design validation will be demonstrated through a combination of structural analyses, computer crash simulations, static loads testing, and dynamic crash testing and simulation at the component, subsystem, and full-scale aircraft levels. During vehicle development, predictions obtained from finite element models will be compared with data collected during component and subsystem testing. Adjustments to the models may be necessary to improve the simulation predictions. This iterative calibration process is necessary to fully understand the importance of parameters used in the model, since not all model inputs are physical quantities that can be measured in a laboratory. Ultimately, the aircraft vendor is requested to develop a system-integrated finite element model of the vehicle that contains accurate physical representations of the individual components that are needed to assess the overall crash performance of the design. These components include the impact surface, landing gears, airframe, seats, restraints, occupants, ballast, fuel systems and internal and external energy attenuating devices. The system-integrated model will be validated through comparison with data obtained during a full-scale crash test. Subsequently, the validated model will be used to evaluate the crashworthy performance of the vehicle for off-nominal impact conditions and for varying impact terrains. The design validation program will require close cooperation and communication between the customer and the aircraft vendor. This section of the document provides general information to assist in the design validation process, including guidelines for impact testing, an overview of modeling and simulation techniques, and a summary of model validation approaches.

Full Spectrum Crashworthiness Criteria October 2011 Page 55
5.7.1 Impact Testing
Obtaining and understanding transient dynamic test data can be challenging. Experimental data must be checked for quality to ensure that it is valid and as accurate as possible, especially if it will be used for model calibration or validation.
5.7.1.1 Objectives
As mentioned previously, the design validation requirements specify a building block approach in which subcomponent, component, and full-scale crash testing is required. The objectives of these experiments are twofold: to evaluate the crashworthy performance of the test article under realistic loading conditions, and to generate data for model calibration. Tests should be performed by a knowledgeable and experienced team of test engineers using recommended engineering practices and a Design of Experiments [44] approach to maximize the amount of information gained from a test, while minimizing the number of experiments required. The experimental program will require close cooperation and communication between the customer and the aircraft vendor.
5.7.1.2 Building Block Approach
The first step in any building block approach is developing accurate properties of the materials to be used in the design. In addition to quasi-static properties, such as Young’s modulus and Poisson’s ratio, the materials should be tested to determine the full stress vs. strain curve including yield stress, hardening modulus, failure strength, strain-at-failure, and strain rate effects. For advanced composite materials, additional data is needed to fully characterize the orthotropic and/or anisotropic material behavior in all three material directions. The experimentalist should pass the material property data to the analyst for use in creating detailed finite element models. While materials testing may seem unnecessary, it is vitally important to verify material properties and associated uncertainties in the laboratory, as vendor-supplied material data sheets may contain errors, or insufficient data may be available to create an accurate material model. As discussed previously, a building block approach is recommended during the aircraft design and validation phase. Part of this approach will require testing of components and subsystems, such as landing gear and fuel tanks, each of which have their own set of design specifications that will not be repeated here. Other component testing might include subfloor crushing under quasi-static and dynamic loads; sled testing of seats, ATDs, and restraint systems; and, testing of internal and external energy attenuating devices such as airbags. The number of component and subsystem tests may depend on the material used in their fabrication. For example, most aircraft vendors are highly familiar with design and development of metallic airframe structures; however, they are much less used to design and development of composite structures. Consequently, additional component or even full-scale testing may be required when advanced material systems are involved.

Full Spectrum Crashworthiness Criteria October 2011 Page 56
5.7.1.3 Instrumentation
Instruments such as accelerometers, pressure transducers, load cells, and strain gages are typically used to collect test data during impact events. These instruments are typically connected to either an onboard or external data acquisition system that is capable of recording data samples at rates of 10-50 kHz. All instruments used during testing should be calibrated and used within manufacture’s recommended ranges. Piezo-resistive accelerometers are recommended for transient dynamic tests since piezo-electric accelerometers do not have adequate low-frequency response characteristics, i.e. piezo-electric accelerometers do not “sense” steady acceleration (Figure 5-17).

Full Spectrum Crashworthiness Criteria October 2011 Page 57
Figure 5-17: Comparison of piezo-resistive and piezo-electric accelerometers mounted together in drop test.

Full Spectrum Crashworthiness Criteria October 2011 Page 58
5.7.1.4 Test Data Evaluation and Filtering
In addition to the actual physical data, there can be electrical noise superimposed on the experimental data. Such noise may be generated by electromagnetic interference, cross-talk between channels, inadvertent over-ranging of the instrument itself, nonlinearities caused by exciting the resonance frequency of the accelerometer, and over-ranging of the instrumentation caused by setting the voltage limits of amplifiers too low, etc. Sometimes it is difficult to distinguish between electrical anomalies and good data. Other electrical anomalies are immediately evident to an experienced test engineer. One example is a force time history plot (Figure 5-18), which was obtained from a lumbar load cell in an anthropomorphic dummy. The high peaks that exceed 6000-lb are examples of electrical transients that are not part of the physical data. Sometimes filtering of the data will remove these electrical transients. However, filtering often does not help and can mask the anomaly making it appear as real physical data. As an example, the dummy load cell data (Figure 5-18) is filtered with a 60-Hz low-pass filter with the resulting lumber load (Figure 5-19). Note that an early peak load of approximately 500-lb occurring at 0.04-seconds now looks like real physical data. However, this peak load is not real, since the actual impact of the airframe did not occur until 0.1-seconds. If an acceleration channel that has electrical anomalies is integrated, the velocity obtained will, at best, be inaccurate and could be completely corrupted (Figure 5-20). Thus, integrating acceleration data to produce velocity plots is useful for data quality checking. Another electrical problem (Figure 5-21) is when the maximum range of the amplifiers has been exceeded. The acceleration pulse has a flat-top peak that occurs around 240 g’s. While this example is fairly obvious, over-ranging can be much more subtle. When in doubt, always set up the instrumentation maximums at least a factor of two above the expected level. Accelerometers often have very high-amplitude, high frequency peaks that must not overload the data acquisition system.

Full Spectrum Crashworthiness Criteria October 2011 Page 59
Figure 5-18: Electrical anomalies in dynamic load cell data
Figure 5-19: Lumbar load cell data filtered with 60 Hz low-pass filter

Full Spectrum Crashworthiness Criteria October 2011 Page 60
Figure 5-20: Unfiltered dummy pelvis acceleration with electrical anomalies
Acceleration data is often difficult to interpret. An experimental structural acceleration pulse recorded from a crash test is composed of a large spectrum of frequencies superimposed together. The structure has many components, each with its own fundamental mode of oscillation, plus many harmonics. In crash dynamics, one is often concerned with the magnitude and duration of the low-frequency (fundamental) acceleration pulse that will be input into the passenger. Consequently, the high frequency ringing of the structural components is of little interest. For example, when a sled test of a seat and dummy is performed, one generally does not have to be concerned with the spectrum of very high frequencies as the sled has been designed to eliminate them. However, the unfiltered acceleration data from a full-scale aircraft crash contains high-amplitude high-frequency information that makes the acceleration plot difficult to interpret. Most crash data is now acquired using digital data acquisition systems. Thus, serious aliasing errors can also be introduced unless the acceleration data is pre-filtered properly before sampling. The fundamental acceleration pulse is input through the structure to the floor to the seat and into the occupant. From its definition, the average acceleration is simply the change in velocity divided by the time interval and is given by the expression:
Aavg = (Vf - Vi)/(Tf - Ti) Equation 1
where Vf is the final velocity, Vi is the initial velocity, Tf is the final time and Ti is the initial time. The instantaneous acceleration is obtained by making the time interval very small. From calculus, the above formula implies that one can differentiate the velocity to obtain the acceleration. Conversely, one can integrate the acceleration trace to get the

Full Spectrum Crashworthiness Criteria October 2011 Page 61
velocity. The initial impact velocity is known in a drop test to be the square root of twice the drop height multiplied by the acceleration of gravity (V2 = 2gh). Therefore as a quality check, AND to more accurately determine the fundamental acceleration pulse duration and rebound velocity, an integration to obtain velocity should always be performed on selected channels. If the integrated acceleration does not produce the impact velocity plus rebound, several checks must be performed. Typical questions are: was the accelerometer zeroed properly, did the acceleration trace come back to zero after impact, were the proper calibration factors used, did the accelerometer rotate or break loose in the impact, was the accelerometer hit by a flying object, was the accelerometer over ranged, was there an electrical problem?
Figure 5-21: Accelerometer data that has over-ranged the amplifiers
The filter used to post-process acceleration data is typically obtained from a standard such as SAE J211/1 [45]. Appendix C of SAE J211/1 presents a general algorithm that can be used to generate a low-pass Butterworth digital filter that does not shift the time phase. SAE has defined a set of Channel Frequency Classes (CFC) for impacts of vehicles, which originally were designed for automobile impacts. These CFC’s are 60, 180, 600, and 1000. However, all standards are general and cannot be applied to specific cases without detailed knowledge of their basis. From physics, the correct low-pass filtering frequency can only be determined from measuring the fundamental acceleration pulse duration. Thus, an event that occurs in a millisecond should not be filtered with the same low-pass filter frequency as an event that occurs in 100 milliseconds. For extremely short duration impacts, the SAE CFC 1000 can be too low, likewise for long pulse durations the CFC of 60 can be too high to extract the underlying fundamental pulse shape. By integrating the acceleration pulse, not only can a quality check of the data be obtained, but the pulse duration of the fundamental mode can also be determined. For

Full Spectrum Crashworthiness Criteria October 2011 Page 62
example, raw acceleration data from a floor-mounted accelerometer on a 30-ft/s vertical drop test of a metallic fuselage section can be plotted (Figure 5-22). From this plot, it is extremely difficult to determine the pulse duration. Is it 0.15 seconds, or 0.175 seconds? What is the peak acceleration? Based on the plot of Figure 5-22, one might suggest that it is obviously about 85 g’s. However, 85-g is the absolute peak of the high frequency oscillatory response, not of the basic fundamental pulse. Also, note that the initial peak acceleration occurs in the negative direction. This behavior may seem strange at first, but it likely occurs due to a modal vibration that is set up at impact for this location. The modal vibration at time zero can be accelerating either up or down depending on the exact physical location.
Figure 5-22: Plot of vertical raw acceleration data
Next, the raw acceleration data (Figure 5-22) was integrated to produce the velocity curve (Figure 5-23). The initial condition was applied, i.e., the velocity at time zero is –30-ft/s (downward). Unlike the complex acceleration curve (Figure 5-22), the velocity curve (Figure 5-23) is relatively simple. The velocity goes to zero at a time of 0.12 seconds, and by approximately 0.125-seconds it has gone positive to approximately 2-ft/s, which is the rebound velocity. Thus, the total velocity change including rebound is 32-ft/s. The duration of the fundamental pulse is about 0.125-seconds. Thus, the fundamental frequency is about 1/T or 8-Hz. To extract the fundamental acceleration pulse, one should use a low-pass filter that has very low attenuation at approximately 8 Hz. Also, an approximation of the maximum acceleration of the fundamental pulse can be obtained by simply computing the maximum slope of the velocity curve from between 0.05- and 0.1-seconds.

Full Spectrum Crashworthiness Criteria October 2011 Page 63
Equation 2
Or, expressed in g-units, 11.2-g’s. Thus, without filtering, one can approximately obtain the maximum acceleration of the fundamental response of about 11.2 g’s.
Figure 5-23: Velocity obtained from integrating the raw acceleration trace in Figure 5-22.
Next, the original acceleration data (Figure 5-22) is filtered using a 2-pole Butterworth low-pass digital filter with varying low-pass filter frequencies ranging from 10-Hz to a maximum of 80-Hz. Since the filter is applied forward and backward in time, the corresponding cut-off frequencies are 8- and 64-Hz. The family of filtered acceleration curves can be calculated as well (Figure 5-24). Each curve is labeled with the 2-pole Butterworth cut-off frequency. For example, f10 represents a 10-Hz 2-pole Butterworth filter applied twice, which effectively yields an 8-Hz cut-off frequency. Note that the 10- and 20-Hz filters show only one basic pulse, and that the maximum acceleration is about 12-g’s, again very close to the value calculated from the slope of the velocity curve. The rise time of the basic pulse can be used to calculate the onset rate, which is approximately 10-g/.05-s = 200-g/s.

Full Spectrum Crashworthiness Criteria October 2011 Page 64
Figure 5-24: Acceleration data filtered with 2-pole Butterworth low-pass digital filters with
frequencies ranging from 10- to 80-Hz
Next, to demonstrate the effect of “over filtering” for this specific example, a low-pass filter with a frequency BELOW 10-Hz will be used. The raw acceleration data (Figure 5-25) is filtered using a 5-Hz 2-pole Butterworth low-pass digital filter. The pulse shape obtained when the raw acceleration data is filtered with a 5-Hz low-pass filter is obviously distorted and spread out in time. This result confirms that the lowest filter frequency should be above 8-Hz. From Figure 5-25, both the 10- and the 20-Hz filters appear to extract the fundamental pulse. However, to be conservative, the 20-Hz filter is recommended for this acceleration. The 20-Hz filter provides the least distortion at time zero, and does not spread the pulse duration. Note that the cut-off frequency for the 20-Hz digital filter is 16 Hz.

Full Spectrum Crashworthiness Criteria October 2011 Page 65
Figure 5-25: Acceleration data filtered with 2-pole Butterworth low-pass digital filters with
frequencies of 5, 10, 20, and 80-Hz. Note that the 5 Hz filter distorts the pulse shape.
Next, each of the filtered acceleration responses, (Figure 5-25), is integrated to obtain the corresponding velocity responses (Figure 5-26) to determine if filtering distorts the velocity trace. The velocity response obtained by integrating the 10-Hz filtered acceleration follows the velocity response obtained from the raw acceleration data quite well. However, it is evident that the velocity response obtained by integrating the 5-Hz filtered acceleration distorts the original velocity data. Data from selected accelerometers should always be integrated as a quality check. In addition, the velocity data could be integrated to obtain displacements. Even more so than with velocity, one would find that the presence or absence of the high frequency data does not influence the displacement of the test article.

Full Spectrum Crashworthiness Criteria October 2011 Page 66
Figure 5-26: Velocity responses obtained from integrating the raw data, and integrating the
filtered 10- and 5-Hz acceleration data.
5.7.1.5 Use of Anthropomorphic Test Devices (ATDs)
The development of Anthropomorphic Test Devices (ATDs) as human surrogates in impact testing has followed the evolution of occupant injury risk criteria over the past 60 years. During this time, the use of ATDs has led to advancements in occupant protection systems for both automobiles and aircraft. Their history has been thoroughly documented [46]; however, a brief summary is provided here as reference. The first crash test dummy, Sierra Sam, was developed in 1949 by the US Air Force for use in ejection seat testing. However, it lacked much of the bio-fidelity needed for frontal impact loading conditions in accurate assessment of injury in the automotive industry. Developments from this original dummy led to the first Hybrid II series of ATDs, which were the first set of standardized dummies used in the automotive industry. The original Hybrid II family of ATD’s was developed in 1972 by General Motors for assessment of restraint systems. This dummy proved to be a valuable tool in the evaluation of restraint systems and was recommended in official guidelines such as the Federal Motor Vehicle Standard 208 [47]. The Hybrid II remained the standard in automotive testing until the Hybrid III family of ATDs was introduced in 1987. The Hybrid III addressed deficiencies of the Hybrid II, mainly in the area of the neck performance and bio-fidelity. The Hybrid III ATD also incorporated a curved spine, which better represented the occupant in a seated position, as opposed to the original Hybrid II straight spine. The Hybrid III is still the standard in automotive crash testing; however, newer specialized ATDs are in development with improved bio-fidelity. The aerospace industry relies heavily on the development of automotive ATDs, yet it must address injuries associated with vertical loading conditions (i.e. an aircraft crash scenario) individually or in conjunction with horizontal loading conditions, which are largely ignored in the automotive world. Thus, the aerospace industry must develop its

Full Spectrum Crashworthiness Criteria October 2011 Page 67
own specialized guidelines. For example, the Federal Aviation Administration (FAA) Federal Aviation Regulation (FAR) 27.562 Subpart C “Emergency Landing Conditions” [48] has established guidelines on occupant injury, including a 1,500-lb limit on vertical lumbar loading from a “…170-lb 50th percentile ATD.” However, the choice of the ATD is not specified. It is common for researchers in the aerospace fields to use a Hybrid III ATD modified to include the straight lumbar spine, which was originally used on the Hybrid II ATD. The straight spine is used in the aerospace industry because it better replicates the more upright seated position of the occupant than a Hybrid III ATD with a curved spine. The differences between the Hybrid II, Hybrid III with curved spine, and the Hybrid III with straight spine were evaluated in 2010 by NASA [49]. One finding of this study was the importance of selecting the appropriate ATD for evaluating injury during aircraft crash events. It is recommended that component and full-scale crash testing be performed using FAA Aerospace Hybrid III ATDs [50] with straight spine configurations representing 5th percentile females, 50th percentile males, and 95th percentile males to cover a wide range of occupant sizes. Note that some injury metrics specify the type of dummy applicable to the criteria and these specifications should be followed.
5.7.1.6 Experimental Error and Uncertainty
Error in experimental data should be minimized and experimental uncertainty should be quantified, where possible. Sources of experimental uncertainties in structural impact testing range from minor variations in material stiffness and strength, to gross errors in weight and mass distribution. Experimental techniques should be used, if possible to minimize error. For example, with the current use of photogrammetric motion tracking methods, it is now possible to accurately determine the impact velocities and attitudes of an aircraft at the moment of impact [51]. In addition, these techniques can be used to measure the CG location of an airframe in three dimensions. Finally, through appropriate selection of instrumentation during an impact test, variations and sensitivities in measured response can be assessed [52].
5.7.2 Modeling and Simulation
Recent advances in computer software and hardware have made possible analysis of complex nonlinear transient dynamic events that were nearly impossible to perform just a few years ago. In addition to the improvement in processing time, the cost of computer hardware has decreased an order of magnitude in just the last few years. With continued improvement in computer workstation speed and the availability of inexpensive computer CPU, memory, and storage, very large crash impact problems can now be performed on modestly priced desktop computers that use operating systems such as LINUX or Windows. Although the software codes can still be relatively expensive, as the number of applications and users increase, the cost of software is expected to decrease, as well. This section of the paper provides a description of the state-of-the-art (SOA) simulation tools, guidelines for model development, occupant modeling and injury assessment, and general issues related to model execution and analytical predictions

Full Spectrum Crashworthiness Criteria October 2011 Page 68
5.7.2.1 State-of-the-Art (SOA) Simulation Tool Capabilities
Aviation safety can be greatly enhanced by the appropriate use of the current generation of nonlinear explicit transient dynamic codes to predict airframe and occupant responses during a crash. Unlike automotive impact testing, which is now a routine part of the development process, crash testing of even small aircraft is infrequently performed due to the high cost of the aircraft and the myriad of impact conditions that must be considered. Currently, crash simulations are used as an aid in designing, testing, and certifying aircraft components such as seats to dynamic impact criteria. Commercial finite element codes, such as LS-DYNA [53], PAM-CRASH [54], Abaqus/Explicit [55], RADIOSS [56], and MD Nastran SOL-700 [57], are available for analyzing the large deformation transient dynamic response of structures, including structures coupled with fluids, when subjected to impact. The main solution methodology is based on explicit time integration; however, implicit solvers are typically available, as well. Code advances have been made to consider manufacturing effects during the design process by chaining the simulation of casting, stamping and forming processes to crash simulations. A wide variety of contact definitions are available including self-contact, surface-to-surface contact, and node-to-surface contact. Spatial discretization is achieved by the use of eight-noded solid elements, two-noded beam elements, three- and four-noded shell elements, truss elements, membrane elements, discrete elements, and rigid bodies. In general, explicit transient dynamic analyses utilize simple, lower order elements that can be analyzed quickly. The solution time is a function of the magnitude of the time step per cycle, which is defined by the Courant condition and must be less than the time it takes a sound wave to traverse the smallest element in the model. Typically, these codes contain hundreds of constitutive models and equations-of-state to cover a wide range of material behavior. Fluid-structure interaction problems are simulated using Arbitrary Lagrange-Euler (ALE) coupling. In addition, particle-based methods such as Smooth Particle Hydrodynamic (SPH) and Element Free Galerkin (EFG) were added to provide additional “hydrocode” capabilities. In general, these codes are operational on a large number of mainframes, workstations, and PC’s, and can be executed using shared memory processors, or with multiple parallel processors.
5.7.2.2 Model Development: Best Practices
Best Practices for Crash Modeling and Simulation [58] contains vital information regarding best practices for crash modeling and simulation. The reader is referred to this document for additional guidance in finite element model development and execution of nonlinear explicit transient dynamic simulations.
5.7.2.2.1 Coordinate frames and systems of units
One of the first steps in developing a model of an aircraft or airframe component is development of the geometry model. However, even before constructing the geometric model, one must decide on a coordinate system and a system of units. Quite often, left-handed coordinate systems are used. For example, in aircraft drawings, fuselage

Full Spectrum Crashworthiness Criteria October 2011 Page 69
station (FS), water line (WL), and butt line (BL) dimensions may be defined using a left-handed system. Finite element programs do not generally accept a left-handed coordinate system since the equations of vector algebra are defined in a coordinate system that obeys the “right-hand” rule. Thus, it is important to choose the origin at an appropriate location and to use a consistent system of the fundamental physical units of length, time, and mass in defining the model. The finite element code will accept any units that are input without error checking. Thus, if engineering units are input using an inconsistent system of units, or a left-handed coordinate system is used, the results will be flawed. The modeler should be careful with units of force, mass, and density, especially when using customary English units commonly used by American aircraft manufacturers. Using this system, the unit of length is typically the inch, the unit of time is the second, and the unit of mass is weight in pounds divided by gravity (386.4-in/s2). Note that weight in pounds is a force and equals mass times the acceleration of gravity. Density is a derived unit often specified in pounds per cubic inch. When using consistent English units, density in lb/in3 must be divided by the acceleration of gravity (386.4-in/s2) to obtain the proper consistent value (Table 5-14).
Table 5-14: Typical Consistent Systems of Units.
Unit Metric MKS English (inch) English (foot)
Length Meter (m) Inch (in) Foot (ft)
Time Second (s) Second (s) Second (s)
Mass Kilogram (kg) lb-s2/in Slug (lb-s2/ft)
Force Newton (N=kg-m/s2 ) Pound (lb) Pound (lb)
Density kg/m3 lb-s2/in4 Slug/ft3
Acceleration m/s2 in/s2 ft/s2
Acceleration of gravity 9.8 m/s2 386.4 in/s2 32.2 ft/s2
Pressure Pascal (N/m2) Psi (lb/in2) lb/ft2
5.7.2.2.2 Geometry Model
Once the coordinate system, origin, and units have been selected, the next step in the simulation process is to develop a geometry model. The geometry model consists of points, curves, surfaces, and solids that are used to define the shape of the structural components. The geometric entities are input into the pre-processing software package and will be discretized later to form the finite element model. There are several methods that can be used to obtain the data needed to create the geometry model. For example, the geometry model may be generated from engineering drawings, photographs, photogrammetric survey, hand measurements, or from an existing finite element model.
5.7.2.2.3 Finite Element Model Development
5.7.2.2.3.1 Element Descriptions Once the geometry model has been created, the lines, surfaces, and solids can be meshed (discretized) to create beam, shell, and solid elements. Typically, the

Full Spectrum Crashworthiness Criteria October 2011 Page 70
geometry is meshed by applying a mesh seed along a curve or line, or along two edges of a surface, or three edges of a solid using the pre-processing software package. The mesh seed does not have to be uniform; both one-way and two-way bias can be applied. The density of the seeding determines the overall fineness or coarseness of the mesh. The mesh discretization should be fine enough to permit buckling, crushing, and large deformations. For efficiency of the simulation, the model discretization should not be as fine as that used in a typical static model. Unlike a static model, which is solved for a small number of load steps, a dynamic model must be solved for each time step. The time step for an explicit dynamic code depends on the time required for a sound wave to move across the smallest element, which can be 1 microsecond or shorter. Thus, a dynamic model that is executed for only 0.1 seconds in real time will be solved 100,000 times. If the initial discretization is found to be too coarse, then mesh refinement can be applied in areas that are needed in later runs. It is not always apparent where the mesh will need to be refined until the model has been executed. The primary elements in dynamic finite element codes are beams (or rods if bending is not required), shells (triangular and quadrilateral), solids (hexagonal, pentagonal, and tetrahedral), and springs. Triangular shells and pentagonal and tetrahedral solids are too stiff and should not be used except when absolutely needed. The elements used in nonlinear transient codes are simple, robust, and highly efficient. Studies have shown that it is more efficient to have a larger number of simple elements than a smaller number of higher-order elements. Although higher-order elements may become available in the near future, solid elements in most explicit codes today have one integration point at the geometric center of the element to calculate stress. Consequently, if it is important to simulate bending using solid elements, at least three elements through the thickness are required. Beam elements are efficient for modeling “beam-like” structures such as stringers, which often have complex cross-sectional geometries. However, if warping of the webs and/or flanges is an important consideration, beam elements cannot be used. In addition, not all beam cross-sections may be built into a particular code. Then, a user-defined cross-sectional geometry can be input. In general, these codes allow for beam offsets from the shear-center or neutral axis, which may or may not be significant depending on the problem. However, this feature allows stringers to be modeled as beam elements using the same nodes that are used to define the shell elements forming the skin. Using the offset feature, the shear center of the stringer beam elements can be correctly located. Quite often the material model may dictate the element type to be used. Composite shell elements formed from ply lay-ups can be constructed fairly easily. The composite shell element must specify the number of plies, orientation, and thickness of each ply. In addition, the material properties of each ply, typically orthotropic, must be specified. Lamination theory is applied within the code, and standard composite failure theories can be specified. However, the current generation of codes for simulating crash dynamics cannot account for delamination as a failure

Full Spectrum Crashworthiness Criteria October 2011 Page 71
mode in composites, without resorting to extraordinary methods that are cumbersome and impractical at this time. In defining each element, the order in which nodes are specified determines the direction of the element normal. The direction of the shell element normal is important in defining contact. The pre-processing software allows viewing of the element normal directions. If some element normal directions require reversing, the pre-processor can perform this task easily. When the model is discretized into elements, connectivity must be considered. Often, duplicate nodes are created for adjacent elements. If the elements are to move together, then these duplicate nodes must be equivalenced, i.e, two or more nodes at the same point in space are equivalenced to one node. Otherwise the elements are not connected and will separate during the analysis. Most pre-processing software packages allow one to view element connectivity and to equivalence nodes. In addition, degrees of freedom must be considered if there are constraints or boundary conditions that limit the motion of nodes for certain elements. If the degrees of freedom are not specified, the code considers all degrees of motion to be allowed. The modeling of mechanisms is important since most standard and energy absorbing aircraft landing gear can be represented using mechanisms. In this context, a mechanism is defined as a linkage, ball joint, sliding joint, etc. Nonlinear transient dynamic finite element codes can also be used to model mechanisms. However, the algorithms are not always stable if large constraint forces occur in a direction that is normal to the motion. 5.7.2.2.3.2 Fluid Structure Interactions The Lagrange solver is the most frequently used solver for structural crash problems. In the Lagrangian approach, the grid points or nodes are fixed to the structure and move with the structure. The mesh can deform, but must not deform too radically or element volume may go negative causing the simulation to stop. Pure fluid flow is typically solved with an Eulerian formulation and the fluid can be a gas, liquid, or solid such as soft soil, defined by an equation of state. In a “pure” Eulerian formulation, the grid is stationary and the fluid flows through the stationary grid. Problems such as a bird strike on a turbine blade can be solved using either Lagrangian or Eulerian formulations or using a combination of the two with the Lagrange and Euler meshes coupled. The bird can be modeled using a Lagrangian mesh if it does not deform radically. However, if it disintegrates, an Eulerian formulation is required. Sometimes it is advantageous for the Euler grid to move (for example the bird), then an Arbitrary Lagrange Euler (ALE) formulation can be applied. LS-DYNA uses the ALE formulation even if the Euler grid is stationary. This approach is used because the original code was Lagrangian with moving grids, so the Eulerian grid velocity is manipulated by the required mathematical transformations. The interaction between the Euler and Lagrange elements can occur in two ways, general coupling or ALE. In general coupling, a closed coupling surface must surround the Lagrangian elements. The interactions between the Eulerian and Lagrangian material takes place through the coupling surface. For impacts of objects into water, an Euler mesh representing a void

Full Spectrum Crashworthiness Criteria October 2011 Page 72
or air must be modeled above the surface of the water to allow wave formation (splash) that occurs at impact. 5.7.2.2.3.3 Lumped Masses Large, heavy items such as the rotor transmission, engines, and fuel tank can be modeled as lumped or concentrated masses with given moments of inertia. Lumped masses may be attached directly to nodes in the finite element model. Often it is advantageous to add a small amount of lumped mass to a node where acceleration data is to be extracted. The small nodal mass “simulates” the accelerometer, mounting block, and wiring in the actual test article. In addition, the lumped mass tends to reduce the high frequency vibrations at that point. 5.7.2.2.3.4 Material Models Many material models have been formulated that are suitable for nonlinear behavior. Even for nonlinear problems, some materials will exhibit a linear elastic response, thus linear elastic material models are included. Rate effects may be extremely important for closed- or open-cell foams with entrapped air, brittle materials such as composites and glass, and even some metals. Experimentation to determine rate effects is difficult and time-consuming, but necessary if the effects are important. Some material models are only appropriate for one type of element such as solids, and other material models may be applied to beams, shells, and solids. One of the most robust formulations is the bilinear elastic-plastic model with strain hardening, with or without failure. This model accurately represents the response of many metals, such as aluminum alloys, that are typically used in aircraft structures. The material is assumed to be elastic until the yield stress is reached. After yield, the material can be perfectly plastic or it can have a strain-hardening slope after yield. The bilinear elastic-plastic material model has various failure criteria. The maximum plastic failure strain criterion is a simple, but effective, criterion for metals such as aluminum. Note that the maximum plastic strain value to be input into the finite element code is the plastic strain after yield has been achieved (not the total strain). Strain rate effects can be included, if known. Aluminum does not exhibit significant strain rate effects for the range of velocities that occur in most aircraft crashes. For isotropic materials that are too complex to be represented with a bilinear elastic-plastic response, constitutive laws in tabular form can be input directly in terms of stress versus engineering (or true) strain. Other solid models allow volumetric crush versus strain to be input. If a tabular input is used, care must be taken to ensure that for large strains or crush, the stress is large enough to keep the element from deforming into an extremely small volume. Otherwise, the element volume can become negative and the analysis will stop executing. A large exponential “bottoming-out stress” at the end of the table may be required to prevent this behavior. In a typical stress versus volumetric-crush for a closed-cell foam material (Figure 5-27), the material response is noted to have a tensile cut-off stress, an exponential bottoming out curve, and an exponential unloading curve. In this example, the “bottoming-out” stress represents compaction of the foam material. Note that in the plot shown, compressive stress is positive, and tensile stress is negative.

Full Spectrum Crashworthiness Criteria October 2011 Page 73
For orthotropic and layered materials, much more work is required to define the material. A series of tests are required to determine unidirectional, transverse, and shear properties on the ply level, which can be used as input to the material model. Composite shell elements are then constructed by specifying the number of plies, orientation, and thickness of each ply. In general, all of the commercial nonlinear explicit transient dynamic codes described herein are capable of simulating multi-layer composite laminates and fabrics using lamination theory coupled with a variety of standard failure theories.
Figure 5-27: Stress versus volumetric crush for a foam material exhibiting a tensile cut-off
stress, an exponential unloading curve, and a large exponential bottoming-out stress.
Eulerian materials exhibit fluid-like behavior. Examples are water, mud, air, voids (no material), various gases, and other fluid-like materials. Since a bird is primarily water, bird strike problems are often executed in which the bird is represented as an Eulerian material. Eulerian materials are typically modeled with an equation of state such as the gas laws where pressure is a function of volume and temperature or, equivalently, of density and internal energy. Equations of state are often written using a linear polynomial model. Successful impact simulations require accurate material representations. In many cases, the plastic material response that occurs after yield is much more important than the original elastic material properties such as the modulus. Plastic material behavior is sometimes difficult to find in handbooks and often must be determined experimentally. In addition, the unloading curve is extremely important as it determines the amount of energy dissipated versus the amount of energy stored and released back into the structure. Two interesting examples are soft soils and foams. Often experimental tabular data of stress versus strain (or crush) can be generated to characterize these

Full Spectrum Crashworthiness Criteria October 2011 Page 74
materials. Although these materials may be rate sensitive, this behavior is generally ignored. Both the loading and unloading curves need to be defined accurately for these materials. For example, objects dropped into soft sand generally exhibit no rebound velocity. This behavior can be deduced from examining the unloading curve of the sand material. The unloading curve drops to zero load almost instantaneously, with little or no energy returned (typically 99% energy dissipated). If the material is not modeled with the correct unloading curve, then elastic energy will be returned from the sand and imparted to the structure and the simulation will incorrectly exhibit a rebound velocity. It is obvious that in an aircraft crash situation, failure is observed for many components of the structure. However, severe deformation such as buckling or crushing of a finite element model does not constitute failure. Although there are algorithms that weaken an element (such as ply failure for composites), material failure in a finite element code generally means that the element is removed from the analysis. Removal of elements in a model, although often necessary, can cause the analysis to deviate from the intended path. Consequently, failure should not be allowed for initial runs of the simulation. After areas of high stress and strain are studied, and the model behavior is well understood, then failure criteria can be added to the material models. 5.7.2.2.3.5 Damping Every structure exhibits damping. For example, if a structure is struck with a hammer, the vibrations will attenuate after a few seconds and eventually stop. Damping occurs due to phenomena such as slippage in joints and fasteners, internal structural friction, visco-elastic effects, and interactions with adjacent media. However, unless damping or failure is introduced, a finite element model of the structure will vibrate continuously. Consequently, the vibratory oscillations set up in a nonlinear dynamic finite element model are generally of high amplitude and may obscure all the underlying low frequency information that is often important in the crash analysis. Finite element programs allow for damping to be applied to the whole model; however, this feature is not often incorporated except for dynamic relaxation problems. Dynamic relaxation is a technique in which the structure is first excited by an impulse and is then highly damped globally to produce a nearly steady-state solution. For example, dynamic relaxation can be used to pre-stress a panel. In addition, specific damping elements can be defined between grid points. Most contact algorithms incorporate some damping to prevent numerical instabilities. 5.7.2.2.3.6 Initial and Boundary Conditions In building a crash model, initial conditions are extremely important, especially if calibration with test data is to be performed. The initial linear and angular velocities of the aircraft, as well as the initial pitch, roll, and yaw angles must all be considered. These values can be determined very accurately using photogrammetry [51]. It has been observed experimentally that an initial attitude change of less than one degree can significantly alter the crushing behavior of an object. For example, if a structure is modeled to impact perfectly flat; whereas, the actual structure impacted with a pitch of one degree, the simulation will not be accurate. These eccentricities are important to include as they remove symmetry from the model. In a real crash, symmetry does not

Full Spectrum Crashworthiness Criteria October 2011 Page 75
exist. The structure always impacts slightly asymmetrically. Even if the structure looks perfectly symmetric on both sides of a plane of symmetry, the physical structure is always weaker on one side or the other due to imperfections, manufacturing tolerances, or other factors. Initial velocities, forces, pressures, etc. can be applied to nodes as needed for a particular problem. Care must be exercised if rigid bodies are attached to non-rigid bodies as the initial velocity condition may change slightly from that input. This situation occurs due to the algorithm that initializes the velocity of nodes that are in close proximity to the rigid body. When initial whole-body angular velocities are required, the x, y, and z-components of the velocity vector v can be computed from the equation,
v = vcg + w x r Equation 3
in which vcg is the velocity vector of the CG, w is the angular velocity, and r is the vector between the center-of-gravity and the point where the velocity v is to be computed. For example, using a pendulum-style swing method for full-scale aircraft crash tests introduces a pitch angular velocity to the aircraft. Thus, in addition to the horizontal and vertical motion of the aircraft CG, the velocity of each point away from the CG must be recomputed taking into account the pitch angular velocity. 5.7.2.2.3.7 Contact Nonlinear dynamic finite element codes have sophisticated contact algorithms. The contact can be defined between surfaces or between surfaces and nodes. For example, an impact surface such as the ground can be defined as a master surface and the nodes on the bottom of the aircraft can be defined as slave nodes. The master surface can also be defined as the faces of elements, either shell elements or solid elements. When a slave node penetrates the master surface, a contact force is generated that pushes the node back. A master surface has a normal vector associated with the front-side of the surface. A master contact surface may be configured to look for contact from both sides, or from only one side and to ignore nodes approaching from the other side. One error to avoid is initial contact where slave nodes have penetrated the master surface at the initiation of the simulation. A warning will be output by the code when this occurs. There are two penalty-based methods of calculating the contact force. In the first method, the contact force on a node is based on a penetration distance times the material stiffness. In the other penalty method, the contact force is calculated using Newton’s Second Law; i.e., the contact force is proportional to the penetration distance divided by the time-step squared (average acceleration) multiplied by an effective mass. Self-contact can also be defined. An example in which self-contact should be defined is a panel that is buckling. If self-contact is not defined, shells in the panel could pass through each other as the panel forms multiple folds during compression.

Full Spectrum Crashworthiness Criteria October 2011 Page 76
Contact surfaces can be defined to have friction. The coefficients of kinetic and static friction can be determined experimentally, obtained from handbooks, or estimated. An example where friction may be needed is when an object impacts a slanted surface. Without friction, the object may slide down the surface before rebounding. With friction, the object will likely rebound from the surface without sliding. There are cases when the default contact stiffness must be scaled to achieve acceptable results. One case is when a very stiff or rigid material impacts a soft material. For example, consider a rigid sphere impacting soft-soil. When the default contact stiffness is used, the soil nodes may move rapidly away from the sphere leaving a large separation distance. This behavior can produce large spikes in the contact force. When the contact stiffness is properly scaled, the soil exhibits the expected response. In general, it is recommended that contact forces be output and analyzed to determine if any unusual behavior is occurring. 5.7.2.2.3.8 Mass Scaling The integration time step for transient finite element codes is dependent upon the shortest natural period in the mesh. The integration time step must be less than the time required for a stress wave to cross the smallest element in the wave. Mass scaling is used to reduce the analysis time by artificially adding mass to the governing small elements. The addition of mass reduces the natural period of the element, which increases the time required for a stress wave to cross that element. Mass scaling should only be used on the smallest elements contained in the model, so as not to affect the overall mass of the system. In general, mass scaling should only be used when absolutely needed to avoid poor or unstable results.
5.7.2.3 Occupant Modeling and Injury Assessment
A number of dummy finite element models such as MADYMO [59], Articulated Total Body (ATB) [60], FTSS [61], and LSTC [53] have been developed to represent human surrogate Anthropomorphic Test Devices (ATDs). These codes are often coupled with nonlinear dynamic finite element codes so that the seat, occupant, and restraint system can be modeled to study their interaction. The dummy models in these codes consist of both rigid and deformable segments to represent each body part. Body parts such as the arms and legs are connected with joints that have defined degrees of freedom, damping, initial torque, etc. Seat and occupant models have been constructed and demonstrated to correlate well with test results. In fact, the FAA has recently issued an Advisory Circular [62] describing the process for seat certification by analysis in which ATDs are represented using occupant models. The circular recommends use of MADYMO [59] or other occupant models representing Hybrid III ATDs. Most of the occupant models mentioned previously were developed primarily for use in automotive crash applications. Since the automotive crash environment involves occupant loading primarily in a front-to-back plane, verification of the dummy models were performed to provide adequate prediction of these responses [63]. However, most aircraft and/or rotorcraft crash events involve high vertical loading, which is not seen in car crashes. Recent tests performed at NASA have identified limitations in occupant

Full Spectrum Crashworthiness Criteria October 2011 Page 77
models in predicting dummy response when subjected to high vertical loading. In addition, these tests have highlighted the need for dummy calibration standards for vertical loading [49]. Another issue with the current generation of dummy models relates to their original development for automotive applications. In general, automotive ATDs incorporate a curved lumbar spine to give the dummy a more slouched position when seated. Consequently, dummy models were developed incorporating the curved lumbar spine. However, ATDs that are recommended for seat certification and for aircraft crash testing have a straight lumbar spine. Currently, none of the commercially available dummy finite element models incorporate a straight spine. Analytical data obtained from dummy models can be used to assess the potential for occupant injury, just as ATD test data would be used. For example, lumbar forces can be obtained by requesting spring and/or joint output forces. Nodal responses in the head, chest, and pelvis can also be output to evaluate HIC, chest deflection, and DRI. Finally, the dummy models described herein typically contain up to 8,000 elements per dummy. Currently, research is ongoing to create bio-fidelic models of the human body that contain over 1,000,000+ elements [64], [65]. The goal of this development is to enable prediction of soft-tissue injury mechanisms including aortic rupture, lung collapse, compression of the brain, etc. At this time, these models are too large for use in system-integrated crash simulations. However, as computational speed increases they may become a viable option in the future.
5.7.2.4 General Issues Related to Model Execution and Analytical Predictions
This section of the report describes quality checks that can be performed to assess model fidelity and other issues related to analytical data.
5.7.2.4.1 Quality checks
One of the first quality checks of a model is to compare the total mass and mass distribution of the model with those of the actual vehicle or component being modeled. The mass of each material should be output and compared with the expected or known mass. Another early quality check is to compare the CG of the model with the CG of the test article, if known. For aircraft structures, the CG is often known since stability and control require the CG to lie within a given range. If the model CG is not within the operational region, then the mass distribution of the model should be modified. Some analysts like to perform a modal analysis before running a dynamic model. This approach is particularly useful if experimental modal data is available [52]. Also, if experimental data is available for elastic loading of the structure (load-deflection data), then the model can be loaded incrementally before the dynamic analysis is performed. These quality tests are useful to verify that the overall stiffness and mass distribution of the model match those of the test article.

Full Spectrum Crashworthiness Criteria October 2011 Page 78
5.7.2.4.2 Issues regarding analytical data
Due to the high frequency content typically seen in analytical acceleration time-histories for a particular node, acceleration data must be filtered using a low-pass digital filter. Present practice is to use a Butterworth digital low-pass filter applied forward and backward in time to avoid phase shifts in time. The choice of filter frequency is important, and engineering judgment must be used to extract the important physical information such as rise time and peak accelerations. In addition, for finite element models, the amount of mass assigned to a node can influence the choice of filter frequency. For practical purposes in test-analysis comparisons, an accelerometer is used to measure acceleration at a point, which corresponds to a node in a model. Since the accelerometer plus mounting block and cable has mass, at least a small amount of concentrated mass should be placed at the node used for test-analysis comparisons. Another approach used by some analysts is to average the response of several adjacent nodes, which acts to numerically smooth the data without using a low-pass filter. As an illustration of the effect of the filter frequency and the effect of mass applied to a node, the filtered acceleration time histories of two nodal positions on the floor of a finite element model of a fuselage section that was drop tested at 30-ft/s are plotted (Figure 5-28, Figure 5-29 and Figure 5-30). In these figures, the acceleration responses were filtered using three different cut-off frequencies corresponding to 200-, 125- and 40-Hz, respectively. The two nodes in the model, Node 3572 and Node 3596, are located on the floor at the left inner seat track. Node 3572 is located on the front edge of the floor and has no concentrated mass associated with it. Node 3596 has 122.8-lb of concentrated mass assigned to it representing a portion of the seat and occupant mass. Note that the acceleration responses are extremely noisy when filtered using a 200-Hz frequency (Figure 5-28). However, the response curve for Node 3596 is much less noisy and has a lower magnitude than that of Node 3572 because it has mass associated with it. The same observation is true for the acceleration responses filtered using a 125-Hz frequency (Figure 5-29). However, when the two acceleration responses are filtered using a 40-Hz frequency, the curves are smooth and provide the underlying crash pulse at both locations (Figure 5-30). Note that many of the filtered data plots do not begin at the origin, i.e., zero acceleration at time equal 0.0-seconds. This phenomenon is an artifact of the filtering process and can be minimized to a certain extent by adding many points before the actual data having negative time and 0 or -1g acceleration, whichever value is appropriate.

Full Spectrum Crashworthiness Criteria October 2011 Page 79
Figure 5-28: 200-Hz filtered acceleration responses of Node 3572 (left) and Node 3596 (right).
Figure 5-29: 125-Hz filtered acceleration responses of Node 3572 (left) and Node 3596 (right).
Figure 5-30: 40-Hz filtered acceleration responses of Node 3572 (left plot) and Node 3596 (right
plot).

Full Spectrum Crashworthiness Criteria October 2011 Page 80
Due to the high frequency content of acceleration time histories in a crash analysis, aliasing errors can occur if the time-step used for writing out the acceleration is too large. The presence of aliasing errors can be determined by integrating the acceleration time history at a node to obtain the nodal velocity. The nodal velocity obtained by integration can be compared with the velocity at the node calculated directly by the finite element program. If the two velocities do not match, aliasing errors are likely the culprit. Unfortunately, if aliasing errors are not detected, then the analytical acceleration results that are output can be misleading or completely wrong. Even writing out acceleration time histories at 10,000 samples per second, which may be the sampling rate used to collect data for a drop test, may not be adequate to avoid aliasing errors. In standard test practice, the acceleration data is pre-filtered so that aliasing errors will not occur. However, one cannot directly pre-filter the analytical acceleration data at a node. Consequently, it contains all of the high frequency components that are in the model. One method to effectively pre-filter the acceleration data is to add a small amount of lumped mass to a node. This technique is highly recommended to avoid aliasing errors in the acceleration. Since inertial loading naturally filters velocity and displacement data, aliasing errors are not generally a problem for these time history responses. Although shell elements can have multiple integration points and can be used to model bending, all of the integration points are through the center of the element. Thus, without expending any energy, adjacent shell elements can deform in-plane into nonphysical “hourglass” shapes. Algorithms have been developed that minimize the occurrence of this phenomenon. However, if too much energy is expended to prevent hourglassing, the solution will not be valid. Consequently, the current codes calculate and output hourglass energy during a simulation. These values should always be checked by the user to determine if excessive hourglass energy is present. A general rule-of-thumb is that the hourglass energy should be less than 10% of the total energy of the solution. Energy is a fundamental physical quantity. The laws of physics cannot be violated in the model, thus the total energy should not grow as the model progresses in time. The time histories of the various forms of energy, i.e., kinetic energy, strain-energy, hourglass energy, etc. should be examined individually as well as the total energy. If the model’s structural rebound height (hence velocity) is much larger than measured (from high-speed video data), then insufficient energy was dissipated by the model. This discrepancy is a common problem for models as they are often too stiff, or the unloading curves selected for the materials may not be correct. If there is a large rebound velocity, then obviously the acceleration time history will not be correct. Either the accelerations will be too high, or the acceleration pulse will be too long.
5.7.3 Validation
As computational capabilities continue to improve and the cost associated with test programs continue to increase, certification of future rotorcraft will rely more on computational tools along with strategic testing of critical components. Past military standards [1] encouraged designers of rotary wing vehicles to demonstrate compliance

Full Spectrum Crashworthiness Criteria October 2011 Page 81
with certification requirements for impact velocity and volume loss by full-scale crash testing and/or analysis. Reliance on computational tools, however, will only come after rigorous demonstration of the predictive capabilities of existing tools. The detailed requirements and challenges associated with certification by analysis are discussed in Reference [66]. Fundamental to the certification effort is the demonstration of verification, validation, calibration, and accreditation for this class of problems. In the technical area of Modeling and Simulation, these terms have accepted definitions, which are defined in References [67],[68],[69],[70], [71] and are repeated, as follows.
Verification is the process of determining that a model implementation accurately represents the developer’s conceptual description of the model and the solution to the model. Stated another way, verification determines whether the model has been properly programmed. One colloquial definition is “has the problem been solved correctly?” Code verification is primarily performed by the code vendor early in the software development process, generally through quality assurance testing of benchmark problems with known solutions [72]. In general, commercial software codes are assumed to be verified when they are released; however, the analyst should be aware that “bugs” might exist in the software. Often, nonlinear explicit transient dynamic finite element codes are labeled “use at your own risk.” Validation is the process of determining the degree to which a model is an accurate representation of the real world from the perspective of the intended uses of the model. Stated another way, the validation process checks if the model actually provides a realistic representation of a real world event. Colloquially, validation is “has the correct problem been solved?” Essentially, validation is the process of comparing the results of code calculations, or predictions, with the results of physical experiments. The primary objective of this activity is to build confidence in the code [67]. Validation encompasses a number of important issues related to model accuracy, which is measured with respect to experimental data, i.e. how well does the model capture the initial and boundary conditions of the problem, the properties of the materials involved, etc. Calibration is the process of adjusting numerical or physical modeling parameters in the computational model for the purpose of improving agreement with experimental data. Generally, calibration is needed due to: modeling uncertainties, incomplete physical data available for input to the model, and the large number of non-physical parameters often required for model input that cannot be measured in the lab [67]. Accreditation is the official certification that a model, simulation, or federation of models and simulations and its associated data are acceptable for use for a specific purpose [68], [69]. Accreditation is

Full Spectrum Crashworthiness Criteria October 2011 Page 82
the determination whether the model should be used for a particular application.
The process of model calibration, which follows the verification and validation phases, involves reconciling differences between test and analysis. Most calibration efforts combine both heuristics and quantitative methods to assess model deficiencies, to consider uncertainty, to evaluate parameter importance, and to compute required model changes [73]. Calibration of rotorcraft structural models presents particular challenges because the computational time, often measured in hours, limits the number of solutions obtainable in a timely manner. Oftentimes, efforts are focused on predicting responses at critical locations as opposed to assessing the overall adequacy of the model. This situation arises from the fact that component and full-scale impact tests are performed with instrumentation placed at discrete locations on the test article. For example, Reference [74] describes the development of a finite element model representing the full-scale crash test of the Sikorsky Advanced Composite Airframe Program (ACAP) helicopter. In addition, Reference [75] reports on a validation effort using anthropomorphic test dummy data from crash tests to validate an LS-DYNA finite element model. Common to both of these calibration efforts is the use of scalar deterministic metrics. It is relatively simple to evaluate test-analysis correlation qualitatively. For example, time sequences of structural deformations of the model can be compared with high-speed video frames taken of the impact event. If the motion and structural deformation of the test article and the simulation look about the same, then most analysts say that they have achieved qualitative agreement. However, it is much more difficult to obtain a figure-of-merit for test-analysis correlation quantitatively. Because of this difficulty, no single validation metric has been established and accepted by the technical community at large. Time histories of velocity and displacement can be quite useful in comparing test with analysis. For example, by examining the velocity responses, one can easily compare the measured and predicted velocity change and pulse duration. In addition, displacement time histories can be compared, for example at a floor location, to assess predicted and measured maximum subfloor crush displacement. Relative error is a simple quantitative metric that can be used to assess the accuracy of these values. However, the comparison of acceleration time histories is much more difficult to make quantitatively. Typical features of filtered acceleration responses that can be compared are onset rate, pulse shape, and peak acceleration. However, even these features may be difficult to assess for some responses. Reference [76] provides an excellent summary of numerical test-analysis correlation metrics for time history responses. One approach that is featured prominently in Reference [76] is by Sprague and Geers [77]. As stated in Reference [76], “This metric quantifies both the wave shape (magnitude) and time-of-arrival (phase) contributions to the test-analysis correlation. Typically separate magnitude and phase metrics are developed, based on either normalized time integrations of the wave forms, or point-wise differences between a measurement and its corresponding computed value. Then, the magnitude and phase metrics are combined to provide a single value, which

Full Spectrum Crashworthiness Criteria October 2011 Page 83
includes the magnitude and the corresponding phase differences. Small values of the combined metric indicate good agreement, and larger numbers indicate poorer agreement.” The single value developed by Sprague and Geers [77] is called the Comprehensive Error Factor. The author of Reference [76] encourages analysts to adopt these methods to remove subjectivity in test-analysis comparisons. These examples represent only a small subset of the work that has been and is currently being performed in the field of model validation. Currently, research performed at NASA Langley is investigating multi-dimensional model calibration based on impact shapes and 2-norm velocity responses as a means of understanding the spatial and temporal relationships of impact loads as they migrate throughout the structure [73]. In general, the selection of metrics for model validation will be made through communication between the customer and the aircraft vendor. However, a list of suggested model calibration metrics is provided in Section 5.7.3.3. Summary descriptions of selected validation standards that are currently being used are provided.
5.7.3.1 Summary of Existing Validation Standards
There are a number of design standards that have been developed for assessing and validating crashworthy designs. Summarized below are several standards that can be used to validate different aspects of crashworthy design.
5.7.3.1.1 NASA-STD-7009
As a consequence of the Space Shuttle Columbia accident and recommendations made by the Columbia Accident Investigation Board (CAIB) [78], NASA developed NASA-STD-7009 [79] “Standard for Models and Simulations.” The purpose of the standard is to ensure that the credibility of the results from modeling and simulation is properly conveyed to those making critical decisions in programs and projects. In particular, the modeling and simulations considered to be applicable to the standard are those that would have a significant-to-controlling influence on engineering decisions. That is, a poor decision based on modeling and simulation results could have a critical or catastrophic outcome resulting in death or permanent disabling injury of crew; loss of major systems, facilities, or vehicle; major schedule slippage, cost overruns greater than 50%, and mission failure. The standard establishes quantification of uncertainties and bounds for modeling and simulation results that are presented to decision makers. Documentation of verification, validation, data sets, recommended best practices, limits of operation of models, quantification of uncertainties, proper units, supporting software, analyst training, document configuration control, peer review, and user feedback are addressed by the standard. The modeling and simulation results are assessed using a Credibility Assessment Scale (CAS). In summary, the CAS is comprised of eight factors. The factors are Verification, Validation, Input Pedigree, Results Uncertainty, Results Robustness, Use History, M&S Management, and People Qualifications. Each factor is divided into levels ranging from 0 to 4, with level definitions describing the evidence necessary for achieving that particular level. Level 0 corresponds to insufficient or no

Full Spectrum Crashworthiness Criteria October 2011 Page 84
evidence, i.e., the simulation produces results, but there is insufficient evidence to warrant even level 1 assessment on that factor. A single, summary score on the CAS is determined by the minimum of the eight factor scores, which produces a single number between 0 and 4. The responsible party (decision maker) assigns the acceptability threshold for the factor for the problem at hand.
5.7.3.1.2 ASME Guide for V&V in Computational Solid Mechanics
After 5 years of discussion and debate, the American Society of Mechanical Engineers (ASME) Standards Committee on Verification and Validation (V&V) in Computational Solid Mechanics published their guide in December 2006 [80]. This guide was inspired by the AIAA Guide for the Verification and Validation of Computational Fluid Dynamics [67] published in 1998 and by the work of the DoD on modeling and simulation V&V published in 2003 [68]. Instead of a typical standard, the ASME V&V Guide only provides a roadmap. More work must be done in this area before typical “standards” are developed. The guide provides details in forming and documenting a V&V plan. The Guide contains four main sections:
1. Introduction – the concepts of verification and validation are introduced and the role of the V&V plan is described.
2. Model Development – the development of the conceptual model, the mathematical model, and the computational model are described.
3. Verification – the process of determining that a computational model accurately represents the underlying mathematical model and its solution. Verification is subdivided into two parts: code verification, which seeks to remove programming and logic errors; and calculation verification, which seeks to estimate numerical errors due to discretization approximations. Hence, verification is in the domain of mathematics.
4. Validation – the process of determining the degree to which a model is an accurate representation of the real world for the problem at hand. Validation is in the domain of physics and requires experimental data generated specifically for the problem at hand to compare with the analytical model. Uncertainty quantification and accuracy are inherent in the validation process.
The physical system in question is first defined. Then, a conceptual model is developed and turned into a mathematical model with defined assumptions. The mathematical model is coded with algorithms into a computer code, which requires physical parameters and discretization. The end product is the computational model – the numerical implementation of the mathematical model. Although expensive and often requiring enormous resources, physical testing is of paramount importance in the V&V process. Also, close cooperation between modelers and the experimentalists is required during all stages of the V&V process. Best practices should be used both in developing the models and in conducting the experimental tests. To avoid “tuning” by analysts, experimental outcomes should not be

Full Spectrum Crashworthiness Criteria October 2011 Page 85
communicated to the analysts until after the analysis is complete. Lastly, uncertainty quantification must be emphasized for both modelers and experimentalists. Code verification must precede Validation. In addition to the code developers, the users assist by providing bug reports. Code outputs are compared with analytical solutions where available. Calculation verification involves establishing errors in the solution due to discretization. Although often skipped, mesh-refinement studies in solid mechanics are one of the most important methods to determine if the solution has converged. In the validation process, a design of experiment approach is generally taken to develop the correct physical model that will produce experimental data with uncertainty quantified. A set of experiments is often needed to achieve the desired accuracy and confidence levels. Note that the V&V plan should specify the accuracy and agreement required between test and analysis beforehand.
5.7.3.1.3 AIAA G-077-1998
In June 2002, the AIAA reaffirmed the “Guide for the Verification and Validation of Computational Fluid Dynamics Simulations” [67] that was originally published in 1998. This document provides guidelines for assessing the credibility of modeling and simulation for computational fluid dynamics. The guideline establishes common terminology, defining the terms verification, validation, and calibration, to be used across a variety of engineering disciplines. In addition, it provides a foundation for addressing fundamental issues related to verification and validation. However, it does not specify recommended standards in these areas.
5.7.3.1.4 FAA Methodology for Dynamic Seat Certification by Analysis
In 2003, the FAA issued Advisory Circular AC 20-146 entitled Methodology for Dynamic Seat Certification by Analysis for Use in Parts 23, 25, 27, and 29 Airplanes and Rotorcraft [62]. The advisory circular establishes an acceptable means of demonstrating compliance with seat testing requirements using computer modeling and analysis techniques. LS-DYNA [53] and MSC/DYTRAN (the precursor of MD Nastran SOL-700 [57]) are the recommended explicit transient dynamic codes, and MADYMO [59] and Articulated Total Body (ATB) [60] are recommended occupant models. This methodology is primarily intended for application in support of dynamic seat test. In special cases, it can be used in lieu of dynamic testing. Validation standards are focused in the following areas: occupant trajectory, which is the overall translational and rotational motion of the occupant; structural response, which focuses on evaluating seat/floor reaction loads and structural deflections of the seat; restraint system responses including belt loads and belt elongation; and occupant responses including HIC, spinal load, and femur compression load. The level of test-analysis agreement for acceptance relies heavily on engineering judgment, and recognizes that acceptable agreement with all performance indices is likely not possible at this time. Vendor application for certification requires extensive documentation of the

Full Spectrum Crashworthiness Criteria October 2011 Page 86
model development and validation process, as well as close communication and coordination between the applicant and the FAA Aircraft Certification Officer [62].
5.7.3.1.5 Sandia Report SAND2002-0341
In March 2002, Sandia National Laboratories published a paper entitled “General Concepts for Experimental Validation of ASCI Code Applications,” [70] that outlines the process used in planning, executing, and assessing experimental validation of Accelerated Strategic Computing Initiative (ASCI) codes. Validation experiments are not intended for the purpose of research or for model calibration, but are instead solely intended for model validation. As such, the validation experiment should be designed jointly by experimentalists and analysts working closely together throughout the program, from inception through final documentation. The document provides a discussion of eight key elements including: Defense Program application; planning; code verification; calculation verification; experimental design, execution, and analysis; metrics; assessment; prediction and credibility; and documentation.
5.7.3.2 Uncertainty in Modeling and Simulation
Uncertainty in modeling and simulation is defined in the AIAA guide [67] as “a potential deficiency in any phase or activity of the modeling process that is due to lack of knowledge.” Together with numerical error, uncertainty is associated with loss of accuracy in modeling and simulation. Sources of error include computer round off, iterative convergence errors, numerical errors in solution procedures, and physical approximations made to simply the simulation. In general, most of these errors are fairly well understood [67]. Sources of uncertainty can range from lack of complete material response data to manufacturing variability in fuselage skin thickness. The AIAA Guide recommends performing an uncertainty analysis, consisting of multiple simulations in which parameter variability is represented using a probability distribution [67]. In performing transient dynamic finite element simulations, many sources of uncertainty exist that can require performing numerous “what-if” sensitivity analyses. As with experimental testing, it is always best to minimize uncertainty through the use of known parameters, and to quantify the range in predicted responses when parameter variations are considered. Reference [81] provides detailed information regarding estimation of total uncertainty in modeling and simulation.
5.7.3.3 Suggested Model Calibration Metrics
Section 5.7.3 of this report has discussed several different approaches for demonstrating design validation, which is based on a building block approach using both testing and finite element based simulations. An important issue regarding modeling and simulation is establishing metrics that can be used to assess the accuracy of the simulation predictions. As stated previously, no single validation metric has been established and accepted by the technical community at large. This situation exists primarily because analytical simulations are used in many varied and complex applications. It is not likely that one metric would be appropriate for all scenarios. Even in the world of transient dynamic finite element simulations for crash applications, the metric to be used depends on the problem being simulated. However, Table 5-15 lists

Full Spectrum Crashworthiness Criteria October 2011 Page 87
suggested model calibration metrics and corresponding acceptance criteria that might be used in the design, development, and validation of crashworthy aircraft. The metrics and criteria in this list are not requirements, but are suggested measures that might be considered. The decision of which model calibration metric is appropriate will be made based on discussion between the customer and the aircraft vendor.
Table 5-15: Suggested Model Calibration Metrics
Type of loading
Type of simulation Model calibration metric
Acceptance criteria
Quasi-static Component crushing Relative error ±15%
Dynamic Component crushing - Acceleration onset rate - Peak acceleration - Pulse duration - Velocity change - Maximum crush
Relative error
±15%
Dynamic Subfloor component crushing -Acceleration time history
Sprague and Geers [76], [77]
±20%
Dynamic Seat/occupant/restraint testing - Peak belt loading - Belt elongation - Peak lumbar load - Peak compression femur load - HIC and chest deflection - Maximum seat deflection
Relative error
±20%
Dynamic Seat/occupant/restraint testing - Seat/floor reaction force - Seat pan acceleration - Occupant pelvis, chest, and head time history responses
Sprague and Geers [76], [77]
±20%
Dynamic Seat/occupant/restraint testing - Occupant trajectory - Seat trajectory
Qualitative comparison of high-speed video and photogrammetry
Good visual agreement
Dynamic Full-scale crash test with ATDs - Aircraft/seat/occupant trajectory
Qualitative comparison of high-speed video and photogrammetry
Good visual agreement
Dynamic Full-scale crash test with ATDs - Maximum subfloor crushing - Maximum seat deflection - Peak belt loading and elongation - Occupant responses (HIC, max lumbar load, chest deflection, femur load, etc.)
Relative error
±20%

Full Spectrum Crashworthiness Criteria October 2011 Page 88
- Airframe accelerometer responses (pulse onset rate, pulse duration, velocity change, and peak acceleration)
Dynamic Full-scale crash test with ATDs - Seat pan accelerations - Occupant pelvis, chest, and head acceleration responses - Occupant lumbar load response - Airframe and ballast mass acceleration responses
Sprague and Geers [76], [77]
±20%
Dynamic Full-scale crash test - Response vector magnitude M is within lower bound a and upper bound b with a probability of 1/n
Prob(a<M<b) Horta, et al [73]
<1/n
Dynamic Full-Scale crash test - Orthogonality of impact test shapes T versus analysis shapes W near identity
Horta, et al [73]

Full Spectrum Crashworthiness Criteria October 2011 Page 89
5.8 Mission Considerations Affecting Crashworthiness
The Aircraft mission encompasses a number of factors that affect the crashworthy design of the airframe. Understanding the aircraft mission is key in developing the most crashworthy design possible for a specific aircraft.
5.8.1 Operational Environment
Operational environment plays a role in the design of an aircraft system for crashworthiness. An aircraft may have a higher probability of crashing in the environment in which it most often operates. Environment includes the terrain, climate, and operating conditions that an aircraft is in when a crash occurs.
5.8.2 Effects of Terrain
Aircraft will conduct operations over all types of terrain, over a large range of temperatures and climates. Various terrains can be categorized into five types: Rural, Urban, Mountainous, Forest, and Water. Designing for crashworthiness over these terrains will present various challenges as described below. While there are locations that have multiple aspects of these terrains combined, a crashworthiness criteria that can address all terrains will be more beneficial to the user and improve the probability of occupant survivability. Rural terrain includes, flat, deforested areas with minimal foliage and few, if any obstructions. Operating in this environment is less of a risk than the other terrains described below. Surfaces can vary significantly: Soft soil, hard soil, rock, sand, ice, snow. Urban terrain include cities, and man-made structures and surfaces. Operating in this terrain limits an aircraft’s speed and mobility, as missions may require direct engagement in this environment. Aircraft may be required to hover, circle at low altitude, or cruise at either high or low altitude above this terrain. During a crash event, an aircraft has a high probability to horizontally impact vertical man-made structures (wires, buildings, towers). This primary impact will then be followed by a secondary impact with the ground. The ground can be un-even and/or prepared, hard surfaces. Mountainous terrain at high altitude with uneven and sloped surfaces can affect impact trajectories and speeds. Although at a high-density altitude, an aircraft may be flying relatively close to the ground (i.e. low AGL). Operating in this environment can limit an aircraft’s available power during a crash event. Horizontal impact velocity into ground may be significant. Surfaces are most likely natural, can be uneven, unprepared, and sloped. Forest terrain includes jungles or areas with foliage that inhibit direct impact with the ground. Operating in a forest terrain presents difficulty in determining exact altitude above ground level. In a crash event, horizontal and vertical impact with trees presents difficulty to the pilot’s ability to crash in a controlled manner. There is a risk of branches penetrating the cockpit or cabin. After a primary impact with trees, and loss

Full Spectrum Crashworthiness Criteria October 2011 Page 90
of rotor lift, secondary impact with the ground could be at a higher velocity and at any angle, as compared to an impact on a flat, deforested terrain. Traditional rotorcraft crash analysis has typically been driven by requirements for impact with a rigid flat surface. For full spectrum crash criteria, two idealized surfaces, water and soft soil, have been added. Army, Navy, and civil studies have characterized impact surfaces differently, but these surface characteristics could be categorized as rigid, soft soil, and water. The aforementioned terrains all have the possibility of the rotorcraft impacting soil or water (in some form). With respect to soil, the type and composition of the soil can vary greatly and could affect energy attenuation significantly during a crash event. In order to ensure a robust crashworthy airframe design, full spectrum crashworthiness requires compliance with impact scenarios onto three idealized surfaces; rigid, water, and soil. If dynamic simulation is to be used to address the soft soil impact requirements, simulation models will most likely need to represent soils of various compositions. Soil can be described based on its percentage makeup of three basic constituents: Clay, Sand or Silt. The United States Department of Agriculture soil texture triangle (Figure 5-31) can be used to describe soil compositions. Livermore Software Technology Corporation (LSTC), has documented a methodology [82] to represent soils in the LS-DYNA large-deformation finite element software. The process of converting soil test data to the input parameters for the MAT5 Soil and Foam material model into LS-DYNA data is obtained by conducting tri-axial compression tests [83],[84]. This process was applied to seven different soil types. Colored dots on the soil texture triangle represent the approximate silt, sand, and clay composition of six of the seven soils. (The location of the seventh, “sandy soil,” is generally expected to be in the lower left hand corner). Table 5-16 lists the seven soils and the references where the soil data were found. A specific soil type will have to be chosen for rotorcraft crash design purposes. The definition will have to be specific enough that a series of modeling parameters can be derived for a large-deformation finite element code. It is expected that the design soil will be sufficiently soft such that the aircraft which will also be designed for rigid-surface crashes will perform well on soils with increasing stiffness.

Full Spectrum Crashworthiness Criteria October 2011 Page 91
Figure 5-31: USDA Soil Texture Triangle
Table 5-16: Soil data
Soil Name Reference
Sandy Soil [82]
Lebanon Sand [85]
Bonnie Silt [86]
Nevada Sand 40% [86]
Nevada Sand 60% [86]
Cuddleback Soil A [87]
Cuddleback Soil B [87]
Carson Sink Wet [87]
Carson Sink Dry [87]
Water terrain includes oceans, lakes, rivers, and marshland areas. Operation in this environment must account for sea-state (if applicable), and type of mission. Navy operations include transportation of supplies between two ships and require low, slow flight with payload. Army operations include transportation of personnel or supplies from sea-bases to shore at cruise speeds at either high or low altitude. The sea-state that a crash occurs in can change the impact velocity and the angle of impact. Sea states range from 1 (calm, no waves) to 9 (phenomenal, over 14m wave swells). The probability of flying in a sea state is dependent on its probability of occurrence, and likelihood that a mission would necessitate flight in that state. Based on the annual probability of sea states (Figure 5-32) a 95-percentile sea state of 6.6 could be a conservative representation of likely occurring sea states.

Full Spectrum Crashworthiness Criteria October 2011 Page 92
Figure 5-32: North Atlantic and North Pacific Cumulative Probability of Sea State
Water terrain also adds a unique crashworthiness aspect in that safe and fast egress is critical for occupant survivability. A person’s ability to remain conscious is a critical component of egress. Impacting water (liquid) also presents challenges for crash systems that were designed to impact the other types of terrain (solid). Fuselage impingement on the water could cause the aircraft skin to burst. Various crash survivability systems such as landing gear may not operate optimally in a water environment. The majority of the crash impacts in Army mishaps occurred on soil, but the second largest number occurred on rigid surfaces. Figure 5-33 compares the cumulative percentile vertical velocity statistics for both the soil and rigid surface impacts. Although there were significantly fewer direct terrain impacts onto a rigid surface, the two curves look very similar. Similarities like this have been shown before. In a 1988 study of Navy mishaps [88], the 95th percentile vertical impact velocity on land was 39-ft/s, and the 95th percentile vertical impact velocity on water was 38-ft/s. Based upon this Navy finding and the FSC Army mishap data, the vertical impact velocity may not be greatly influenced by the terrain type.
0
10
20
30
40
50
60
70
80
90
100
0 1 2 3 4 5 6 7 8 9
Sea State
Cu
mu
lati
ve P
rob
ab
ilit
y
North Atlantic
North Pacific
95 th Percentile

Full Spectrum Crashworthiness Criteria October 2011 Page 93
Figure 5-33: Comparison of Rigid Surface and Soft Soil Velocity Statistics for Direct to Terrain
5.8.3 Climate
Climate includes ambient temperature, precipitation, wind velocity, visibility, and sea states. In a high/hot climate, an aircraft’s autorotation capability is limited. In extreme cold weather climates, energy attenuation systems may operate differently unless care is taken in the design. In poor visibility climates, impact with terrain could occur at higher velocity than otherwise expected due to the reduced reaction time of the pilot. Wind gusts and high sea states could increase the possibility of roll over or initiate impact with terrain. The extent that a system can mitigate variations in climate prior to impact can greatly affect the crashworthiness of the system.
5.8.4 Operating Conditions
How an aircraft is flown could indicate how it will likely crash. Variations in altitude and airspeed can affect how an aircraft will crash into various terrains, and dictate reaction time requirements for active crash protection systems. The mission and flight regime that an aircraft is in when a crash event starts, could affect the performance of the crash survivability design.
Mission Considerations could include:
Tactical vs. Non-tactical missions
Personnel vs. Cargo Transport
Sea-based vs. Land-based
Long vs. Short duration missions
Medical Evacuation

Full Spectrum Crashworthiness Criteria October 2011 Page 94
5.8.5 Operating Weight
For most military aircraft, the term “structural design gross weight” is synonymous with “design gross weight.” For a rotorcraft that is compliant with modern crash criteria defined at structural design gross weight, it would be expected that the crash capability would decrease at higher operational gross weights. Historically, structural design gross weight was tied to an operational mission. However, it is conceivable that a structural design gross weight could lose operational significance as the aircraft matures. Generally as aircraft mature over time and design upgrades become implemented the maximum gross weight of aircraft increases while design gross weight remains the same. The net effect is that over time mishaps occur at gross weights significantly higher than the design gross weight. Thus, consideration must be given to applying crashworthiness criteria to something other than the aircraft design gross weight; perhaps a percentage of maximum gross weight. To maintain crash performance at increased operational gross weights, additional energy attenuation capability would be required on the derivative aircraft. In order to accommodate this change, criteria can be tailored such that the design weight for crash analysis could become a percentage of the maximum takeoff weight, and this change would ensure crash capability is maintained as the aircraft grows.
Other variables to mission considerations that could affect crashworthiness could include:
Weight and Center of Gravity Variability
Rotor Type Considerations
Size Class Considerations
Operational Variability
5.8.6 Applicable Technologies
Crash Survivable Flight Recorders
The science of aviation accident investigation, and consequently crashworthiness analyses, have benefitted greatly from recording devices designed specifically to survive a crash. While originally only recording parametric data, both civil and military designs have advanced to now include acoustic and image data. The DoD largely follows industry standards in this area while augmenting with specific DoD and Service requirements. The ability to record the environment at the time of crash (e.g. rain, sea state) along with real-time impact velocities and accelerations enables improvements in crashworthiness requirements as well as definition of the operating environment.

Full Spectrum Crashworthiness Criteria October 2011 Page 95
6. Requirements
The requirements section is ordered to correlate to Section 5. For example, Sections 5.2 and 6.1 deal with occupant protection, Sections 5.2 and 6.2 deal with airframe crashworthiness, etc. The overall Crashworthiness Index (CI) shall be based on a modified ADS-11B rating system (Table 6-1), with modification primarily to the assessment area 5 “Basic Airframe Crashworthiness Rating” (Section 6.3)
Table 6-1: Modified ADS-11B rating system summary
Assessment Areas Optimum Score Section
1 Crew Retention System Rating 85 6.2.3
2 Passenger Retention System Rating 85 6.2.4
3 Basic Airframe Crashworthiness Rating 295 6.3
4 Post Crash Fire Potential - Spillage 128 6.4.1
5 Post Crash Fire potential - Ignition 127 6.4.2
6 Injurious Environment Rating 30 6.5
7 Evacuation Rating 60 6.6
Total Optimum Score: 810
Establishing an achievable minimum Crash Index score is a complex process that must be undertaken by the procurement agency (both the program manager and the customer). Note that the following are notional scores. Ongoing FSC work under other efforts should help refine these 'minimum' scores. Minimum scores can be based on various aspects deemed a priority to the customer. For example notional requirements may be:
Ensuring a specific area meets a certain threshold: The summation of all mission profiles shall have a minimum vertical impact score of 60 out of 120. The score of 45 is based on meeting a threshold vertical impact capability on all three impact surfaces, while a score of 120 is based on meeting the objective for extended and retracted landing gears.
Ensuring several areas meet a minimum threshold: A summation of the combined mission profiles and impact scenarios shall have a minimum basic airframe crashworthiness rating of 108 out of 295, where a score of 108 is calculated as being equivalent to meeting MIL-STD-1290A impact scenario requirements, and an average assessment of other ADS-11B requirements (i.e. anti-plow, landing gear location, blade strike, fuselage fracture/separation, etc)
Ensuring a specific area is not marginalized inasmuch as negating the benefits of crashworthiness. The “Post crash fire potential – Spillage” rating shall be a minimum of 120 out of 128 (i.e. MIL-DTL-27422).
Ensuring general compliance. The overall CI shall have a minimum score of 648 out of 810 (i.e. meeting 80% of all requirements).
Notwithstanding, minimum threshold requirements must be set prior to the design phase and be based on the specific requirements of the customer. Establishing achievable CI scores that do not marginalize performance or survivability is the

Full Spectrum Crashworthiness Criteria October 2011 Page 96
responsibility of the customer working closely with industry to understand the state of technologies.
6.1 Occupant Protection Requirements
6.2 Occupant protection requirements are described below. These requirements form the basis for meeting an impact capability and are based on methods described in Section 5.2.
6.2.1 Threshold Occupant Protection Requirements
In order to meet a certain crashworthiness capability, occupant protection shall be demonstrated on each occupant category (pilot, crew, passenger) to ensure the following injury criteria are met. In order to receive a CI score (e.g. lateral impact capability of 20-fps) in the Basic Airframe Crashworthiness assessment, the designer must demonstrate that under a specific crash condition, no occupants experience loads greater than those outlined here. The minimum capability demonstrated under which all occupants are injury free (based on modeling and test) is the value that is used in the Basic Airframe Crashworthiness section. Head impact criteria are evaluated to ensure head strike does not occur, or is within tolerable levels. Combined neck moment and load limits are evaluated to ensure neck injury does not occur. Seat strap loads are evaluated to ensure no injury to the chest. Lumbar loads are evaluated to ensure there is no injury to the spinal column. Tibia load limits are required in cases where an occupant could impact an object with their legs, such as in a pilot seat. Tibia limit loads are evaluated to ensure impact forces, if present, are tolerable to allow for safe egress. Demonstration that these criteria have been met will be accomplished through: full-scale crash testing, crash simulation, a building block approach of testing (with analysis correlation) of subcomponents, up to a full-scale crash test and simulation.
6.2.1.1 Head Impact Tolerance
The resultant acceleration at the center of gravity of the head shall be such that the Head Injury Criterion (HIC):
Equation 4
shall not exceed 700, where ‘a’ is the resultant acceleration expressed as a multiple of g (the acceleration of gravity), and t1 and t2 are any two points in time during the acceleration of the head, which are not separated by more than a 15 millisecond interval.
6.2.1.2 Combined Neck Moment and Load Limits
The maximum combined cervical force and moment limit, expressed as Neck Injury Criteria (Nij), is 0.5, as measured at the occipital condyles (C0-C1). The maximum Nij

Full Spectrum Crashworthiness Criteria October 2011 Page 97
as measured at the cervical vertebrae (C7-T1) is 1.5 (Table 6-2). Nij is calculated from Equation 5:
i nti nt M
M
F
FN
yzi j
Equation 5
where: Fz = the axial tension/compression load Fint = the critical intercept load (defined in table below) My = the flexion/extension bending moment. Mint = the critical intercept moment (defined in table below) Note: The resultant of each sub-component of the Nij expression is positive. Table 6-2: Critical Intercept Values for Nij Calculation at C0-C1 and C7-T1 for specific Occupant
Sizes
6.2.1.3 Seat Strap load limits
The maximum load in any torso strap shall remain below 1750-lb and in total, if more than one strap is used, remain below 2000-lb.
6.2.1.4 Lumbar Load Limits
The maximum lumbar force limits are defined in Table 6-3.
Table 6-3: Maximum Values for Lumbar Injury for specific Occupant Sizes
Small Female Hybrid III Type ATD (103 to 118 lbs)
Mid-Size Male Hybrid II Type ATD (170 Lbs)
Mid-Size Male Hybrid III Type ATD (170 lbs)
Large Male Hybrid III Type ATD (200 to 245 lbs)
Compression (lb)
933 1500 1395 1757
6.2.2 Additional Occupant Protection Requirements
The ability to analyze for the following occupant protection requirements is not currently feasible on a large scale, or during an aircraft design process. The following injury criteria are protection requirements that could be feasible in the future. They can also
Small Female Hybrid III
Type Manikin (103 to 118 lbs)
Mid-Size Male Hybrid III
Type Manikin
Large Male Hybrid III
Type Manikin (200 to 245 lbs)
Tension (lb) (+Fz) 964 1530 1847
Compression (lb) (-Fz)
872 1385 1673
Flexion (in-lb) (+My) 1372 2744 3673
Extension (in-lb) (-My)
593 1195 1584

Full Spectrum Crashworthiness Criteria October 2011 Page 98
be required in specific instances or conditions where it is evident that these types of injury mechanisms may play a significant roll in an occupants survival (e.g. a gunners side facing seat may require an assessment of neck lateral bending and rotation).
6.2.2.1 Tibia Load Limits
Tibia load limits shall be required in cases where an occupant could impact an object with their legs, such as in a pilot seat. The maximum combined tibial force and moment limit, expressed as the Tibia Index (TI), is 1.0. TI is calculated from Equation 6:
Equation 6
where: M(t) is the resultant bending moment P(t) is the absolute value of the corresponding axial compressive force at time t MC is the critical intercept moment (defined in Table 6-4) PC is the critical intercept force (defined in Table 6-4)
Table 6-4: Critical Intercept Values for TI Calculation for Specific Occupant Sizes
Small Female Hybrid III Type Manikin (103 to 118 lbs)
Mid-Size Male Hybrid III Type Manikin (170 lbs)
Large Male Hybrid III Type Manikin (200 to 245 lbs)
Moment (in-lb) 1018 1991 2717
Compression (lb) 5148 8071 9937
6.2.2.2 Neck X and Z Moment Limits
In cases where the lateral neck bending moment exceeds 350 in-lb, the tolerance of the neck in tension is reduced to 472 lb. In all cases, the lateral neck bending moment must remain below 700 in-lb.
6.2.2.3 Arm Load Limits
Arm load limits are required in cases where an occupant could impact an object with their arms, such as in a pilot seat, or crew station that is near a bulkhead. The maximum Arm force and moment limits are defined in Table 6-5.
Table 6-5: Maximum Values for Arm Injury for specific Occupant Sizes
PC
tP
MC
tMTI
)()(
Small Female Hybrid III
Type Manikin (103 to 118 lbs)
Mid-Size Male Hybrid III
Type Manikin
Large Male Hybrid III
Type Manikin (200 to 245 lbs)
Moment (Nm) TBD TBD TBD
Compression (N) TBD TBD TBD

Full Spectrum Crashworthiness Criteria October 2011 Page 99
6.2.3 Crew Retention System rating
As outlined in ADS-11B, and modified below, crew retention shall be evaluated based on the following modified areas and scores:
Table 6-6: Crew retention rating
Crew retention System rating Score
Restraint webbing geometry and strength 25
Seat Longitudinal Strength 10
Seat Lateral Strength 10
Seat Vertical Strength 10
The absence of castings in stressed areas 10
Shoulder strap pull-off angle 5
Lap belt angle to seat cushion 5
Lap belt tiedown strap 5
Inertial reel type 5
Total: 85
Further guidance on scoring is provided in ADS-11B as well as Section 7.
6.2.4 Troop / Occupant Retention System rating
As outlined in ADS-11B, Troop / Occupant retention shall be evaluated based on the following modified areas and scores:
Table 6-7: Occupant retention rating
Occupant retention System rating Score
Restraint webbing geometry and strength 25
Seat Longitudinal Strength 10
Seat lateral Strength 10
Seat Vertical Strength 10
The absence of castings in stressed areas 10
Shoulder strap pull-off angle 5
Lap belt angle to seat cushion 5
Lap belt tiedown strap 5
Inertial reel type 5
Total: 85
These requirements have been modified from those in ADS-11B to be the same as crew retention requirements. ADS-11B had a different scale, where inertia reels are not considered for troops. This assumption may no longer be applicable. For aircraft that do not carry occupants, this occupant assessment area will be deleted. Further guidance on scoring is provided in ADS-11B, as well as section 7

Full Spectrum Crashworthiness Criteria October 2011 Page 100
6.3 Basic Airframe Crashworthiness Rating
The basic airframe crashworthiness rating shall be evaluated based on the following areas and scores in Table 6-8. The designer shall provide substantiation that their aircraft is capable of meeting a minimum Basic Airframe Crashworthiness score based on the following:
6.3.1 At a minimum four flight profiles (missions) that the aircraft will be conducting over its operational life.
6.3.2 At a minimum, the four most common gross weight and CG conditions that the aircraft will be operating in under each flight profile.
6.3.3 At a minimum the five most common gross weight and CG conditions based on all flight profiles being conducted at their projected percentage intervals over the life of the aircraft.
6.3.4 A probability of impacting a rigid surface X% of the time, water Y% of the time and soft soil Z% of the time. X, Y, and Z will be determined by the service that will be using the aircraft (Army, Navy, Air Force, etc) and either their respective historical mishap rates on the various surfaces or their projected intended usage spectrum.
6.3.5 A Pitch/Roll (PR) weighting factor based on the ability of the aircraft to crash over the full roll and pitch envelope based on historical mishap data as an objective (PR=1.5), with an intermediate envelope as described in MIL-STD-1290 (PR=1.0) or at level impact only (threshold) on each surface described in section 6.3.4(PR=0.79) (Figure 6-1).
6.3.6 A vertical impact capability threshold of 26-ft/s and an objective of 42-ft/s, with gear extended, on the surfaces described in section 6.3.4, and a vertical impact capability threshold of 20-ft/s and an objective of 26-ft/s with landing gear retracted on the surfaces described in Section 6.3.4 (Figure 6-2). The capability demonstrated is that velocity at which all occupant loadings, described in section 6.1, are below the injurious thresholds.
6.3.7 A 57.2 degree flight path impact angle threshold capability of 33.9-ft/s vertical and 21.5-ft/s longitudinal and an objective capability of 42-ft/s vertical and 21.8-ft/s longitudinal onto a rigid surface (Figure 6-3). The capability demonstrated is that velocity at which all occupant loadings, described in section 6.1, are below the injurious thresholds.

Full Spectrum Crashworthiness Criteria October 2011 Page 101
6.3.8 A longitudinal impact into a rigid barrier capability threshold of 16-ft/s and a objective of 20-ft/s for pilot and co-pilot protection, and a longitudinal impact capability threshold of 35-ft/s and an objective longitudinal impact capability of 40-ft/s for crew protection (Figure 6-4 and Figure 6-5). The capability demonstrated is that velocity at which all occupant loadings, described in Section 6.1, are below the injurious thresholds.
6.3.9 A lateral impact capability threshold of 24 ft/s and a objective of 30-ft/s (Figure 6-6).
6.3.10 An 8 degree flight path impact angle capability threshold of 11-ft/s vertical and 80-ft/s longitudinal and an objective of 14-ft/s vertical and 100=ft/s longitudinal (Figure 6-7). The capability demonstrated is that velocity at which all occupant loadings, described in Section 6.1, are below the injurious thresholds.
The basic airframe crashworthiness rating shall be calculated ( Equation 7) as a summation of each of the conditions that the aircraft will be in under each flight profile:
Equation 7
Where: CIscore = Crash index score Tx = terrain weighting factor PRx = pitch / roll capability factor Vx = impact velocity capability score
𝐶𝐼𝑆 𝑜𝑟 = ( 𝑥 × 𝑃𝑅𝑥 × 𝑥)

Page 102
Table 6-8: Basic Airframe Crashworthiness Rating
l Basic Airframe Crashworthiness
Crushing of Occupied Areas (Longitudinal Crash.) Evaluate the ability of the aircraft to withstand a 20 ftfs longitudinal impact into a rigid abutment without crushing the pilot and copilot stations to an extent that would preclude a livable volume or crew evacuation and at 40 ftfs without crushing the passenger/troop compartment by more than 15 percent.
Absence of "Plowing" Tendency The nose and belly of the aircraft should have a smooth contour with structural members of sufficient strength underneath to prevent it from plowing a furrow in the earth subsequent to a nose down impact in soil from "run-on" approach speeds.
Resistance to Longitudinal Impact Loads The primary objective is to provide sufficient strength to prevent the roof of the aircraft from moving forward and downward with respect to the floor of the aircraft Enough wall structure must be available on either side of the aircraft to prevent collapse due to inadequate shear strength . In this respect, a fuselage with many large openings is undesirable. Continuous beams running from the nose of the aircraft under the floor the entire length of the occupied section are preferable since this type design will probably prevent the floor from buckling. Ensure that mass items are restrained to the load levels specified in ADS-36.
Resistance to Vertical Impact Loads The structure must be evaluated by its resistance to collapse due to vertical impact loads of 5.1 .2 .1 , ADS-36.
If the engine and transmissions are located over the cabin or just aft of the cabin, the design tie down strength should not be less than +/- 20G in the longitudinal and +20/-1 0 in the vertical direction and +/-18G in the lateral direction (applied separately) to prevent cabin penetration . In addition, these mass items require a simultaneous tri-axial load evaluation in accordance with ADS-36. Regardless of tiedown strength, the fuselage shell should contain peripheral frames at a close spacing in order that a maximum amount of energy is absorbed before a mass will penetrate the structure.
Cl Scoring Cl Comment
15
Shall evaluate for prorated crash mission gross weights. For 20 ft/s requirement.
15 For 40 ft/s requirement.
10 No Change from ADS-11 B
10 No Change from ADS-11 B
80
20 I
Shall evaluate for prorated crash mission GW-CG. Shall evaluate for three terrain surfaces. Shall consider pitch and roll envelope. Shall ensure meet high mass items do not penetrate into cabin or cockpit for a vertical impact capability

Full Spectrum Crashworthiness Criteria October 2011 Page 103
I
Resistance to Lateral and Roll-Over Impact Loads Evaluate in regard to the probability of cabin collapse during a roll-over or lateral impact as defined in AOS-36. A circular fuselage with few large openings will have maximum integrity during a roll-over . If the entire side o the cabin consists of a door, this structure will be very weak and should be evaluated accordingly.
Landing Gear Vertical Force Attenuation The landing gear shall be evaluated for its energy absorbing capability in both the extended and retracted modes (as applicable) . With gear retracted, the design shall be such that the system energy absorption requirement of AOS-36, Table I is satisfied.
Assess high-angle combined longitudinal and vertical component capability. Must evaluate for prorated crash
15
15
40
mission GW-CG, on a rigid surface. Must consider pitch and roll envelope. 20 Assess low-angle combined longitudinal and vertical component capability. Must evaluate for prorated crash mission GW-CG, on a soil surface. Must consider roll and yaw envelope. 20 An energy absorbing device shall be provided to minimize loads transferred to the tail boom in nose-high landings .
5
Landing Gear Location 5 Evaluate the damage which will be caused by this large mass as it is displaced during a crash . For example , if the gear is located directly under the cabin floor, the probability of its being driven upward into the occupiable area must be evaluated .
Effect of Blade Strike 20 Evaluate whether the design precludes rotor failure and transmission displacement into occupiable space when the main rotor blades impact into a rigid object at operational rotor speed . Analysis must show that transmitted forces from such an impact will not cause main blade separation from the rotor hub nor separation of the hub from the rotor shaft, nor separation of the rotor shaft from the transmission. The analysis must also show that the blade's plane of rotation is not displaced sufficiently to enter occupied areas of the helicopter.
Effect of Fuselage Fracture/Separation 5 A primary consideration is the manner in which the fuselage fails due to a load perpendicular to its longitudinal axis . If it appears obvious that the break in a fuselage will occur underneath a seat row, it is an undesirable design. Evaluate to determine whether the passenger seat structure and occupants ware significantly affected by a fuselage break.
Total 295
Shall evaluate for prorated crash mission gross weights for the 30 ft/s lateral conditions.
Shall meet static roll over criteria.
Shall evaluate for prorated crash mission GW-CG. Shall evaluate for three terrain surfaces. Shall consider pitch and roll envelope.
No Change from ADS-11 B
No Change from ADS-11 B
No Change from ADS-11 B

Full Spectrum Crashworthiness Criteria October 2011 Page 104
Figure 6-1: Pitch and roll capability weighted factor
Figure 6-2: Score (Vsurface) for vertical impact capability on each surface type (Vsurface)

Full Spectrum Crashworthiness Criteria October 2011 Page 105
Figure 6-3: High impact angle capability versus score
Figure 6-4: Longitudinal Velocity capability for Pilot and Co-Pilot Egress versus score

Full Spectrum Crashworthiness Criteria October 2011 Page 106
Figure 6-5: Longitudinal Velocity for Cabin Retention capability versus score
Figure 6-6: Lateral impact capability versus score

Full Spectrum Crashworthiness Criteria October 2011 Page 107
Figure 6-7: Low angle impact capability versus score
6.4 Post Crash Fire Protection
Post crash fire protection has two significant ratings in the CI: spillage control and ignition control. Both areas are broken down into several factors that are rated separately for the degree of protection provided.
6.4.1 Post-crash fire potential – Spillage
As outlined in ADS-11B, the post crash fire potential rating (spillage control) shall be evaluated based on the following areas and scores:
Table 6-9: Post-crash fire potential – Spillage
Spillage Control Score
Fuel Containment 601
Flammable Fluid Containment (e.g. oil and hydraulic fluid)
20
Sealing Flammable fluid lines 30
Firewall protection 9
Fuel flow interrupters 9
Total 128
1 If a range extension system is included in the evaluation allow 40 points for primary fuel
system, and 20 points for the range extension system.

Full Spectrum Crashworthiness Criteria October 2011 Page 108
6.4.2 Post-crash fire potential – Ignition Control
As outlined in ADS-11B, the post crash fire potential rating (ignition control) shall be evaluated based on the following areas and scores:
Table 6-10: Post-crash fire potential – Ignition Control
Ignition Control Score
Induction & Exhaust flame location 30
Location of Hot Metals and Shielding 30
Engine Location and retention Strength 15
Battery Location and retention Strength 12
Electrical Wire Routing 12
Boost Pump Location and retention Strength 7
Inverter Location and retention Strength 6
Generator Location and retention Strength 6
Lights Location and retention Strength 5
Antenna Location and retention Strength 4
Total 127
Further guidance on scoring is provided in ADS-11B as well as Section 7.
6.5 Injurious environment rating:
As outlined in ADS-11B, injurious environment protection requirements for all crew and occupants shall be evaluated based on the following areas and scores:
Table 6-11: Injurious environment rating
Injurious Environment assessment areas Score
Proximity of Cockpit controls and other structure or Inclusion of air bag systems
10
Retention of interior equipment 10
Rudder Pedal area 5
Absence of injurious objects in cabin 5
Total 30
Further guidance on scoring is provided in ADS-11B as well as section 7.

Full Spectrum Crashworthiness Criteria October 2011 Page 109
6.6 Evacuation Rating
As outlined in ADS-11B, Evacuation requirements shall be evaluated based on the following areas and scores:
Table 6-12: Evacuation Rating
Evacuation assessment area Score
Ease & Reliability of exit operations 15
Ratio of usable exits to occupants 15
Identification of Exits 10
Availability of exits in rolled aircraft 10
Emergency Lighting 10
Total: 60
Further guidance on scoring is provided in ADS-11B as well as Section 7.
6.7 Design Requirements Validation
Demonstration of compliance with the crashworthy design requirements that have been established in this document will be performed incrementally throughout the entire development cycle of the aircraft. Compliance of the crash protection system shall be demonstrated through a combination of structural analyses, computer crash simulations, static loads testing, and dynamic crash testing at both the subsystem and full-scale aircraft levels. System-integrated finite element simulations will be developed to represent the full-scale crash test of the aircraft. Predictions obtained from the finite element models will be calibrated using data collected during component and full-scale crash testing. Following calibration, data from an independent set of tests will be used to validate the model. The validated model will be used to evaluate the crashworthy performance of the vehicle for off-nominal impact conditions and for varying impact terrains. As outlined, the design validation program will require close cooperation and communication between the customer and the aircraft vendor. The requirement for a full-scale crash demonstration test may seem to place an undue burden on the aircraft vendor. However, such a test is deemed necessary for the following reasons. First, this test serves as a culmination of the development of a crashworthy aircraft that was designed using a systems approach for crashworthiness. As such, individual components and subsystems were designed, fabricated, and tested to demonstrate acceptable impact performance. However, a full-scale impact test is needed to verify that all of the individual parts work together as a system to provide the required level of crash protection. Secondly, the full-scale test is needed to demonstrate that occupant loads do not exceed design requirements specified in Section 6.1. Occupant responses shall be obtained from instrumented Anthropomorphic Test Devices (ATDs) that are used as human surrogates during the crash test. Data collected from these occupants are used to assess injury risk potential. Finally, as described in Section 5.7, Analytical Tool Readiness Levels

Full Spectrum Crashworthiness Criteria October 2011 Page 110
(ATRL) for nonlinear, explicit transient dynamic finite element simulations are currently deemed insufficient for crash certification by analysis [43], [66]. Consequently, full-scale crash testing continues to be the best approach for requirements validation. Greater confidence in the predictive capabilities of analytical simulations will be achieved through continued model improvement efforts. Consequently, the development and validation of a system-integrated finite element model is an important aspect of the crashworthiness requirement. In the future, as the ATRL rating continues to improve, more reliance on analytical methods may one day significantly reduce the need for component, subsystem, and/or full-scale testing.
6.7.1 Full-Scale Crash Testing
Full-scale crash testing may be performed using several different experimental techniques. For example [89], a combined velocity impact test of a Huey helicopter was conducted at Yuma Proving Ground using a crane and drop tower with guide beam (Figure 6-8). Another example [90] of this type of guide beam system (Figure 6-9) is a combined velocity impact test of an MD-500 helicopter that was conducted at the Boeing Structures Test Lab in Mesa, Arizona. For these tests, the aircraft was attached to a guide beam through a set of rollers, which allows free translation along the length of the beam. Prior to the test, the aircraft was pulled back to the end of the beam away from the drop tower using a winch and a quick release hook. The end of the guide beam was then lifted using a crane to achieve the desired inclination angle. The inclination angle and travel distance is selected such that when the aircraft is released, it travels along the guide beam achieving the desired longitudinal and vertical impact velocity as it comes off the guide beam. The height of the aircraft from the impact surface as it comes off the guide beam adds to the vertical velocity such that the desired combination of vertical and longitudinal impact velocities is achieved at the point of impact [90].

Full Spectrum Crashworthiness Criteria October 2011 Page 111
Figure 6-8: Full-scale crash tests at YPG for impact test of a Huey onto water and soil

Full Spectrum Crashworthiness Criteria October 2011 Page 112
Figure 6-9: Illustration of full-scale crash test approach. Reprinted from Reference [90].
Another approach for conducting full-scale crash testing is to utilize the Landing and Impact Research (LandIR) Facility located at NASA Langley [91], [92]. The LandIR gantry is a steel A-frame structure that is 240-ft. high, 400-ft. long, and 265-ft. wide at the base. Full-scale crash tests are performed at LandIR using a parallel pendulum swing technique (Figure 6-10). Equidistant pivot-point platforms are located at the top of the gantry, two on either side that connect to four swing cables. Winches are used at each of the pivot points to control the lengths of the swing cables. The two sets of parallel swing cables connect to the aircraft at locations that are the same distance apart as they are at the top of the gantry, thus forming a large parallelogram. Ideally, the position of the aircraft’s Center-of-Gravity (CG) is located midway between the two swing cable attachment points. Note that the attachment point locations on the aircraft can be adjusted to provide a wide range of roll, pitch, or yaw attitudes at impact. A pullback platform is located on the underside of the movable bridge that traverses the rear 200-ft. length of the gantry. This platform also supports a winch for pulling back the test aircraft. The swing and pullback cables are typically mounted to hard points on the airframe. Ideally, these hard points are located such that a line connecting them passes through the CG of the test article. During the test, the aircraft is raised via the pullback cable to the desired drop height. Following a countdown, the pullback cable is cut, releasing the aircraft to swing towards the impact surface. Just prior to impact, the swing cables are pyrotechnically separated from the aircraft such that it is completely unrestrained during the impact. This test technique minimizes the induced pitch angular velocity obtained during a pendulum swing. High-speed cameras and photogrammetry for motion tracking; a family of Anthropomorphic Test Devices (ATDs) representing human surrogates ranging from a 5th percentile female to a 95th percentile male; onboard digital data acquisition systems for collecting 320+ channels of high speed data; and, a full selection of instrumentation including accelerometers, load cells, strain and pressure gages are available at LandIR for use during testing. The current capacity of the LandIR pullback winch is 64,000-lb and a Hydro Impact Basin (HIB) was recently added to the facility to enable water impacts.

Full Spectrum Crashworthiness Criteria October 2011 Page 113
Regardless of the approach taken for conducting the full-scale crash test, several aspects of the test should be established based on communication between the customer and the vendor. The impact conditions (longitudinal, lateral, and vertical velocities), the impact attitudes (roll, pitch, and yaw), and the impact terrain (rigid surface, soft soil, or water) should be specified by the customer based on the most likely crash scenario given the primary mission of the vehicle. Other test parameters include the number and type of ATD crew and troop passengers, the number and types of seats and restraints used, the target gross weight, and the location and amount of ballast. Selection of the actual type and model ATD is an essential issue for consideration in the model validation process. Dummy calibrations will play an extremely important role in the assessment of test results and may influence occupant injury risk analyses. Consequently, the type of ATD should be selected with the appropriate injury criteria in mind. Another critical element of the test is the selection of instrumentation and data acquisition system. Given the expense associated with full-scale crash testing, it is highly recommended that an experienced team of engineers conduct the crash test.
Figure 6-10: Schematic of the LandIR Facility.
Following the full-scale crash test, the vehicle’s crash protection system will be evaluated to ensure occupant protection from the hazards of a crash. The performance of all aircraft elements that contribute to crash protection such as airframe structures, landing gear, seats, restraints, fuel systems, cargo restraints, and aircraft floatation systems will be assessed individually. In addition, the integrated system will be evaluated to determine if it efficiently achieved the specified level of crash protection. These evaluations will be conducted through post-test visual inspection, viewing the high-speed videos, and data reduction and analysis. Occupant survivability

Full Spectrum Crashworthiness Criteria October 2011 Page 114
will be assessed by comparing ATD responses with known injury risk criteria, defined in Section 6.1.
6.7.2 Modeling and Simulation
As mentioned previously, the aircraft vendor is required to develop a “system-integrated” finite element model (FEM) of the aircraft, so called because it should contain accurate physical representations of the impact surface; landing gear; external energy attenuating devices, such as airbags; the airframe itself including any internal crushable structures, such as the subfloor; seats, restraints, and occupants; internal energy attenuating devices, such as cockpit airbags; ballast used to represent engines, fuel, and the rotor transmission; and, any additional features that might be important to the simulation, such as flotation systems during a water impact simulation. The aircraft vendor will select the level of detail used in developing the system-integrated FEM and the choice of simulation tool (e.g. LS-DYNA, RADIOSS, ABAQUS-Explicit, PAM-CRASH, MD Nastran SOL-700, etc.). The development of a system-integrated FEM of the aircraft is required for several reasons. First, the FEM shall be used to assess the energy absorbing features of the aircraft during pre-test simulations. If issues are discovered, they can be addressed prior to the full-scale crash test. Second, analytical predictions obtained from the simulations are compared to test data for calibration of the model. The model calibration process will reveal areas in which the FEM is inadequate and improvements, such as mesh refinement, selection of more accurate material models or element formulations, shall be undertaken, if needed. This iterative process of post-test model calibration and improvement is informative and helps to increase the overall Analytical Tool Readiness Level (ATRL) by highlighting modeling deficiencies and needed advances in analytical techniques. A dedicated set of tests shall be used to validate the calibrated model. Subsequently, the validated model is then used to simulate off-nominal impact attitudes, different velocity conditions, and multi-terrain surfaces that are not feasible through full-scale crash testing. Finally, as described in Reference [93], analytical methods can be used effectively for optimization of energy absorption performance, while minimizing structural weight.
6.7.3 Model Calibration and Validation
Today, models are typically “validated” through comparison of experimental and analytical acceleration time history responses at discrete locations on the aircraft. These comparisons are generally made by filtering the test data and analytical predictions using equivalent filters, as recommended by the SAE [94], and plotting the results together on the same graph. Comparisons of acceleration onset rate, initial peak, shape and duration of the pulse are made. Depending on channel location, often the time histories are integrated to provide velocity- and displacement-time histories, from which items such as total velocity change and maximum displacement can be made. Such comparisons are useful to the analyst as they seek to improve and evaluate numerical models. Based on these simple metrics, relative error between test and analysis can be evaluated at channel locations. Thus, the focus of this type of

Full Spectrum Crashworthiness Criteria October 2011 Page 115
model validation is on predicting responses at critical locations as opposed to assessing the overall adequacy of the model. Some suggested model calibration metrics are listed in Table 5.6-2. Ultimately, the selection of which calibration metrics are used will be determined through discussions between the customer and the aircraft vendor. It is hoped that by applying simple validation metrics, the utility of such metrics in the assessment activity will be made evident. In addition, the use of metric-based comparisons is highly encouraged as a means of reducing subjectivity and building confidence in the use of computational tools for design. In one example of a system-integrated simulation, the kinematic code, KRASH [95], [96], was used to simulate a full-scale crash test of the Sikorsky Advanced Composite Airframe Program (ACAP) helicopter. Reference [97] describes the development of the full aircraft KRASH model, and test-analysis correlation. The KRASH model (Figure 6-11(a)), consisted of 75 beam elements, 23 spring elements, and 53 discrete masses to represent the overall stiffness and inertial properties of the aircraft. As stated in Reference [97], the model was used during early aircraft design to estimate fuselage crushing load-stroke relationships and landing gear hydraulic responses. In addition, predicted acceleration responses of high mass items were used for initial airframe sizing. Data from component testing of the subfloor structure and landing gear were used to update and revise the original KRASH model. Impact loads were applied to the flexible model to assess structural integrity and occupant survivability [97]. In general, reasonable comparisons with full-scale crash test data were demonstrated for high mass items such as the main transmission (Figure 6-11(b)), and for the seat and occupant responses [97]. This example highlights the tremendous benefit in utilizing analysis methods during component design, as well as full-scale crashworthiness evaluation.
(a) KRASH model of the Sikorsky ACAP helicopter. (b) Test-analysis comparison.
Figure 6-11: KRASH model and test-analysis comparison for the main transmission mass. Reprinted from Reference [97].

Full Spectrum Crashworthiness Criteria October 2011 Page 116
More recently, the development of nonlinear explicit transient dynamic finite element codes, such as LS-DYNA, PAM-CRASH, RADIOSS, ABAQUS-Explicit, and MD Nastran SOL-700 have ushered in a new era in crash simulation. These codes rely on simple element formulations that can be processed quickly using explicit time integration. Thus, large models consisting of millions of elements can be simulated in a matter of hours on workstation computers. Recently, a system-integrated FEM of an MD-500 helicopter was developed for execution in LS-DYNA to simulate two full-scale crash tests [98], [99], [100],[101], [102], [103]. The FEM (Figure 6-12(a)) included physical representations of the impact surface, skid gear, shock struts, airframe, seats, restraints, external energy absorber, and ballast. The inclusion of all components in a single comprehensive computational model allows for interactions that might be neglected when analyzing systems using separate models. Modeling detailed representations of the vehicle, seats, restraints, and occupants into a single FEM is now common practice within the automotive crashworthiness community [104], [105]. Efforts to conduct integrated simulations have progressed along with advances in computing power. The model (Figure 6-12(a)) contained approximately 400,000 elements, including four occupant models that are available from LSTC, the company that markets LS-DYNA. The MD-500 test article (Figure 6-12(b)), is a 3000-lb light utility and commercial transport helicopter. Two full-scale crash tests were conducted at LandIR, one in which the helicopter was outfitted with an external deployable energy absorber and the second in a baseline configuration without external energy absorbers [98], [102]-[103]. The model was developed prior to the first full-scale crash test. Pre-test simulations were helpful in reorienting the energy absorbers for optimal impact performance and in assessing the effect of the energy absorbers on floor-level acceleration levels [100]. Test-analysis comparisons for the first crash test, documented in References [99] and [100], indicated reasonable prediction of structural responses (Figures 6-12(c) and (d)). However, comparisons with occupant responses were poor. For the pelvic acceleration, the analysis significantly over predicts the test response, but the opposite occurs for the lumbar load. These results indicate inconsistency in the ability to predict occupant responses using the LSTC dummy model. In one case, injury prediction based on the simulation results would be conservative, in the other case not.

Full Spectrum Crashworthiness Criteria October 2011 Page 117
(a) FEM of the MD-500 helicopter. (b) Pre-test photograph.
(c) Pilot seat box vertical acceleration. (d) Passenger floor vertical accel.
Figure 6-12: MD-500 helicopter with crushable honeycomb FEM and pre-test photograph.
Subsequently, a multi-dimensional model calibration effort was undertaken [73]. Model calibration of impact problems has traditionally assessed model adequacy by comparing time histories from analytical predictions to experimental data at only a few critical locations. Although this approach provides for a direct measure of the model predictive capability, overall system behavior is only qualitatively assessed using full vehicle animations. In order to understand the spatial and temporal relationships of impact loads as they migrate throughout the structure a more quantitative approach is needed. As described in Reference [73], impact shapes derived from time history data were used to conduct sensor placement and to assess model adequacy using orthogonality and time based metrics. An approach for model calibration was presented that included definition of metrics, uncertainty bounds, parameter sensitivity, and numerical optimization to estimate parameters to reconcile test with analysis. Finally, several different occupant models with varying levels of bio-fidelity are currently available. The selection of occupant models used in the system-integrated FEM should be made during discussions between the customer and the aircraft vendor. The LS-DYNA occupant models used in the MD-500 helicopter crash simulations contained

Full Spectrum Crashworthiness Criteria October 2011 Page 118
approximately 4,000 elements each and were selected primarily for speed of execution. Following the crash tests, dummy models developed by First Technology Safety Systems (FTSS) were compared side-by-side with the LS-DYNA models during vertical impulsive loading simulations [106]. The FTSS dummy model contains approximately 8,000 elements and is more representative of the ATD. Consequently, test-analysis comparisons showed better correlation with the FTSS model. Development of higher fidelity ATDs and improved ATD and human occupant modeling are focus areas of considerable research at the current time. Technology advances are expected as ATDs and occupant models become more human-like in the near future.
6.8 Special Requirements
6.8.1 Cargo Retention
Restraints will keep the cargo from shifting while in flight even in extreme weather conditions. If the structure of the fuselage and floor is not strong enough to withstand the cargo crash loads, load limiters shall be used to limit the loads transmitted to the structure.
6.8.2 Litter Retention
Litter retention shall be designed to withstand the most common impacts that can be severe in nature by providing as much contact area and support as practical.
6.8.3 Crash Survivable Flight Recorder
Shall comply with requirements of EUROCAE ED-112[107] as augmented by Service and DoD safety guidance. CSFRs shall deploy upon, or immediately prior to, impact and include parametric, acoustic and image recording capabilities. All interfaces and data formatting shall comply with open industry standards and strictly forbid any of proprietary claim. Any flight recorder system should provide a common memory source for all programs including the CSFR, Military Flight Operations Quality Assurance (MFOQA) and any engine or airframe monitoring systems.

Full Spectrum Crashworthiness Criteria October 2011 Page 119
7. Crash Index Example Calculation
7.1 Scenario
A Heavy Vertical Lift rotorcraft is needed to carry cargo, troops, vehicles, and to conduct air refueling missions. Maximum cargo weight is on the order of 30 tons. Maximum range is 400 miles, and maximum endurance time is 8 hours. The operational environment for this aircraft is expected to be equally distributed over urban and rural areas, and missions can be sea based and include ship-to-ship resupply. The primary mission is cargo resupply, followed by vehicle transport, followed by troop transport, followed by air resupply. Each of the subfactors will be given a point value proportional to the desirable qualities outlined in ADS-11B. A total systems approach will be used in assigning values. For example, specific shortcomings in ignition control or evacuation need not be partially or totally penalized if spillage control is substantiated. A less than 12” seat stroke can be compensated for in landing gear attenuation and fuselage deformation features, as long as the end result is manageable loads applied to the occupant. By the same token, a single critical flaw can result in penalizing an entire factor. An example of this would be an inadequate seat restraint, which negates most of the other good features in the occupant retention system.
7.2 Occupant Retention System Rating
7.2.1 Crew retention system rating
Crew retention systems can be evaluated in the following manner. Deviations from the method described below should be substantiated with corresponding analysis and test.
7.2.1.1 Restraint webbing geometry and strength:
Optimum Score: 25
Webbing characteristics % of total points Maximum points
Webbing thickness 10% 2.5
Strength and width of lap belt 40% 10
Strength and width of shoulder straps 40% 10
Strength and width of belt tiedown strap 10% 2.5
7.2.1.2 Seat Strength
Optimum Score: 30 The seat longitudinal, lateral and vertical strength shall be demonstrated to be adequate to withstand a crash event without causing injury to occupant, cause ejection of occupant or preventing evacuation. Capability of seat shall exceed that of the aircraft system, as described in section 7.3. MIL-S-58095A Table II can be used as a guide to demonstrate this capability.

Full Spectrum Crashworthiness Criteria October 2011 Page 120
7.2.1.3 Absence of castings in stressed areas
Optimum Score: 10 If castings are used in stressed areas the rating should be zero, unless the casting material has been specially processed to ensure ductility and its use has been approved by the procuring activity.
7.2.1.4 Shoulder strap pull-off angle
Optimum Score: 5 The shoulder strap guide should be located at 27 inches (+/-0.5 inch) above the seat cushion and not permit more than ½ inch of lateral movement.
7.2.1.5 Lap belt angle to seat cushion
Optimum Score: 5 The lap belt centerline should project an angle of 45-55 degrees in profile with respect to the seat cushion. The centerline should be 1.5 to 2.0 inches forward of the seat intersection with the seat cushion.
7.2.1.6 Lap belt tiedown strap
Optimum Score: 5 The lap belt shall be retained in place on the pelvis by a tie down strap. Preferably, the strap should be located on the seat pan centerline between 14 and 15 inches forward of the seat reference point.
7.2.1.7 Inertia Reel Type
Optimum Score: 5 Inertia reels should demonstrate the ability to limit loads onto the occupant and retain the occupant throughout the crash event. Crew required to conduct roles in a standing position will reduce overall score, unless retention systems are in place to provide equivalent protection.
7.2.2 Troop / Occupant retention system rating
Troop and occupant retention evaluation will then be conducted in a similar manner as crew. Areas of interest where further analysis may be required could include: - occupants in seats different than crew members - occupants in lateral or rear facing seats

Full Spectrum Crashworthiness Criteria October 2011 Page 121
- occupants with different weight requirements as crew (e.g. 365 lb troop with equipment)
- occupants in litters
7.3 Basic Airframe Crashworthiness Rating
Threshold and objective values are based on historical mishaps and minimum acceptable values. Performance criteria (Table 7-1) can be based on the specific customer, and their threshold and objective requirements. For example, pitch and roll capability will be weighted, whereby 100% of the score will be given if the MIL-STD-1290A pitch/roll envelope is met. If only level impact capability is attained, 79% of the score will be given (Table 7-1). A higher, prorated, score can be given if the pitch and roll envelope exceeds the MIL-STD-1290A envelope, but will not be described in this example. Performance criteria with threshold and objective values for the various impact scenarios are determined as well. Based on the vehicle concept of operation, the Crashworthiness Index factors that are affected are those in the basic airframe crashworthiness rating, specifically: Crushing of cockpit, Crushing of cabin, Vertical impact resistance (With gear extended and retracted), High angle impact capability and low angle impact capability and lateral impact resistance (Table 7-2).

Full Spectrum Crashworthiness Criteria October 2011 Page 122
Table 7-1: Performance criteria

Full Spectrum Crashworthiness Criteria October 2011 Page 123
Table 7-2: Basic Airframe CI areas affected by operating mission (highlighted)
7.3.1 Design Conditions
Based on the operating scenario, the designer will develop a matrix that identifies the percent time that the aircraft will operate at various gross weights and the change in the longitudinal CG location (Table 7-3). Based on the usage and mission priority, the percentage of time that an aircraft will be conducting a specific mission can also be calculated (life percent time). Combining these missions and weighting the lifetime percentage, a ‘combined mission’ matrix can be developed (Table 7-4). In this example, based on the four missions and weight and CG variations, a total of eight weight / CG conditions are identified. These can be reduced to the highest percentage conditions, in order to reduce the amount of analysis (Table 7-5).

Full Spectrum Crashworthiness Criteria October 2011 Page 124
Table 7-3: Operation time matrix
Table 7-4: Combined mission matrix
Table 7-5: Reduced Combined mission conditions

Full Spectrum Crashworthiness Criteria October 2011 Page 125
7.3.2 Condition analysis – vertical impact capability
Based on the design conditions, the designer will analytically demonstrate, and validate through test, the vertical impact capability of their specific design when it is in a certain weight / CG condition. A matrix will be populated that identifies the impact capability (vertical, lateral, combined, etc) and the corresponding pitch / roll envelop capability (Table 7-6). The impact velocity values are based on an analysis that shows that the occupant protection requirements are met (i.e. do not experience excessive, debilitating loads during the crash event), the structure maintains sufficient volume to protect the occupants, and exits are readily available and not obstructed. For water impacts, analysis must also show that the occupant loads are low enough so as to preclude losing conciseness. This analysis is provided to the Government program manager (and the customer), by the designer in order to substantiate their CI assessment. The reduced mission conditions (green) would be required to be demonstrated / analyzed, while all mission conditions (green and yellow) could be optional for demonstration or analysis. Each weight / CG condition will be analyzed based on impacting various surfaces: rigid, water, and soft soil. Based on the operating scenario, equal probability of impacting the various surfaces could be assumed (e.g. 33%). Based on the weighted percentage of time in each condition, a overall score can be calculated for the vertical impact capability as a percentage of the maximum score (Table 7-7) and combined into a total score. This analysis can be conducted for both the ‘gear extended’ condition and the ‘gear retracted’ condition. Table 7-6: Example of (a) vertical impact capability in each condition (b) full pitch / roll envelope
or level impact only

Full Spectrum Crashworthiness Criteria October 2011 Page 126
Table 7-7: Example of vertical impact capability score
7.3.3 Condition analysis - Low and High impact angle
An analysis would be conducted for the aircraft impacting at the low impact angle and the high impact angle. In these analyses, the impact angle would be kept constant, and the magnitude would be determined. Only impacting a rigid surface would be analyzed for this scenario. Pitch and roll capability would also be determined. The demonstrated capability would be weighed against the criteria and historical data to determine the score.
7.3.4 Condition analysis - longitudinal impact into a rigid barrier and lateral impact
Analysis will be conducted based on the aircraft impacting a rigid barrier with weight variations (CG variations would have minimal affect on this analysis). The time percentages determined would be used to calculate the overall score (Table 7-8). The value of each capability would be weighted based on historical data and value (Figure 7-1). A similar calculation will be conducted for the cabin area in a longitudinal impact (Table 7-9, Figure 7-2) and an analysis for a lateral impact onto the side of the aircraft (Table 7-10, Figure 7-3).
Table 7-8: Longitudinal impact capability to ensure cockpit is not compromised

Full Spectrum Crashworthiness Criteria October 2011 Page 127
Figure 7-1: Trend of capability versus score weight (Cockpit)
Table 7-9: Longitudinal impact capability to ensure occupant space is not compromised (Cabin)
Figure 7-2: Trend of capability versus score weight (Cabin)

Full Spectrum Crashworthiness Criteria October 2011 Page 128
Table 7-10: Lateral impact capability
Figure 7-3: Cabin example and lateral impact example
7.3.5 Scoring
Once these analyses are complete, the scores can be added and an overall Basic Airframe Crashworthiness Rating can be determined. In this example summary (Table 7-11), the rating was determined to be 256.9 out of a possible 295. Note that there are other areas that need to be calculated in the Basic Airframe Crashworthiness Rating (e.g. absence of plowing tendency, etc) as well as six other categories (Crew / troop retention rating, post-crash fire potential, etc). Determining these scores is outlined in ADS-11B (which further references ADS-36). While some aspects may be more subjective, a consensus rating can typically be reached based on rationale provided by the designer.

Full Spectrum Crashworthiness Criteria October 2011 Page 129
Table 7-11: Example of Basic Airframe Crashworthiness rating Summary

Full Spectrum Crashworthiness Criteria October 2011 Page 130
The following is excerpted from ADS-11B and provides explanation for the various assessment areas and scoring considerations. Absence of plowing tendency Optimum rating: 10 The nose and belly of the aircraft should have a smooth contour with structural members of sufficient strength underneath to prevent it from plowing a furrow in the earth subsequent to a nose down impact in soil from “run-on” approach speeds. Resistance to longitudinal impact loads Optimum rating: 10 The primary objective is to provide sufficient strength to prevent the roof of the aircraft from moving forward and downward with respect to the floor of the aircraft. Enough wall structure must be available on either side of the aircraft to prevent collapse due to inadequate shear strength. In this respect, a fuselage with many large openings is undesirable. Continuous beams running from the nose of the aircraft under the floor for the entire length of the occupied section are preferable since this type of design will probably prevent the floor from buckling. Ensure that mass items are restrained when subjected to the load levels encountered in a survivable crash, or as specified in ADS-36. Static rollover Optimum rating: 15 Evaluate in regard to the probability of cabin collapse during a roll-over or lateral impact as defined in Section 7.3.4. A circular fuselage with few large openings will have maximum integrity during a roll-over. If the side of the cabin consists of a large door or doors, this structure could be very weak and should be evaluated accordingly. Landing gear location Optimum rating: 5 Evaluate the damage which will be caused by this large mass as it is displaced during a crash. For example, if the gear is located directly under the cabin floor, the probability of its being driven upward into the occupiable area must be evaluated. Effects of blade strike Optimum rating: 20 Evaluate whether the design precludes rotor failure and transmission displacement into occupiable space when the rotor blades impact into a rigid object at operational rotor speed. Analysis must show that transmitted forces from such an impact will not cause blade separation from the rotor hub nor separation of the hub from the rotor shaft, nor separation of the rotor shaft from the transmission. The analysis must also show that

Full Spectrum Crashworthiness Criteria October 2011 Page 131
the blade’s plane of rotation is not displaced sufficiently to enter occupied areas of the aircraft. Note that this requirement applies to both main vertical thrust rotors as well as anti-torque or forward thrust rotors / propellers. Effect of fuselage fracture or separation Optimum rating: 5 A primary consideration is the manner in which the fuselage fails due to a load perpendicular to its longitudinal axis. If it appears obvious that the break in a fuselage will occur underneath a seat row, it is an undesirable design. Evaluate to determine whether the passenger seat structure and occupants are significantly affected by a fuselage break.
7.4 Post Crash Fire Potential
7.4.1 Spillage
Spillage of flammable fluids can be evaluated in the following manner. Deviations from the method described below should be substantiated with corresponding analysis or test. Fuel Containment Optimum score: 60 Location accounts for 20% of the containment rating. Location of the fuel tank should be evaluated with respect to the anticipated impact area, the occupant area, large mass items and primary ignition sources. Vulnerability accounts for 20% of the fire containment rating. Capability of a fuel tank should be evaluated with respect to rupture resistance when exposed to various aircraft structural failures. Landing gear failure or structural collapse onto the tank. Failures associated with structural displacement, such as rupture around the filler neck, of the fuel line entry and exit areas, and tiedown devices should also be considered. Construction technique accounts for 50% of the containment rating. Construction technique is evaluated for two primary considerations: Geometry and Material. Smooth contoured shapes are given the highest number of points whereas irregular shapes and other multi protuberance type tanks are given the lowest number. The construction technique is then rated against the following order of preference:
- Crash resistant per MIL-DTL-27422 (100% of geometry score) - Crash resistant per MIL-T-5578 (40%) - Metal canister (0%) - Integral (0%)
Fuel Boost System accounts for 10% of the containment rating. The fuel boost system should be evaluated from the standpoint of its susceptibility to cause fuel spillage due to fuel cell rupture or line failure. Included is the fuel boost pump location and method of fuel cell attachment.

Full Spectrum Crashworthiness Criteria October 2011 Page 132
Oil and Hydraulic fluid containment Optimum rating: 20 Location accounts for 34% of the optimum rating. The location of the tanks should be evaluated from the standpoint of their proximity to the anticipated impact area, large mass items, and primary ignition sources. Vulnerability accounts for 34% of the optimum rating. Vulnerability should be evaluated from the standpoint of rupture resistance from other aircraft structure such as control linkage failures. Construction and tiedown adequacy accounts for 32% of the optimum rating. Construction methods to evaluate in descending order of ability to contain fluid: Cellular – 100% of optimum rating. Bladder – 67% Sheet metal – 33% Tiedowns should be evaluated primarily with the emphasis toward the adequacy of the system to support the tanks during the typical accelerations encountered during the crash. Flammable fluid lines Optimum rating: 30 Construction accounts for 33% of the optimum rating. The construction of fuel lines should be judged in accordance with the hose material and couplings. Experience has shown that rigid lines fail before flexible type, thus flexible lines are given the most points. MIL-H-8796 construction is desirable. Also included in this phase of the evaluations are the couplings. The fewer couplings, the better. Ninety degree couplings are less desirable than straight type and any coupling is less desirable than a continuous hose. Aluminum fittings usually fail before steel ones. Routing accounts for 33% of the optimum rating. The routing of the fuel lines is an important consideration. The lines must not pass through areas where they can get trapped, cut, or pulled. Extra hose length (20% in areas of anticipated large structural deformation) should be provided. Holes through which the fuel lines pass should be considerably larger than the Outer Diameter (OD) of the hose. Breakaway fittings account for 33% of the optimum rating. Breakaway fittings or self sealing breakaway valves should be installed at strategic locations throughout the system including each line that enters or exits the fuel tank. Firewall Optimum rating: 9

Full Spectrum Crashworthiness Criteria October 2011 Page 133
The firewall shall be evaluated from the standpoint of how well it will function as a shield between crash induced fuel spillage and the various engine ignition sources. Fuel flow interrupters Optimum rating: 9 Since these devices can interrupt the flow of spilled flammable fluid, their inclusion in the design is very desirable. Innovative inclusion could affect the fuel containment rating as well.
7.4.2 Ignition
Ignition of flammable fluids be evaluated in the following manner. Deviations from the method described below should be substantiated with corresponding analysis and test. Induction and exhaust flame location Optimum rating: 30 Evaluate from the standpoint of where expelled flames will go when they occur, in relation to where the flammable liquids are likely to be and where fuel ingestion is occurring. Location of hot metals and shielding Optimum rating: 30 Evaluate from the standpoint of how well the hot items (temperatures above 400 degrees F) are shielded or protected from fuel spillage. Components included are: Engine (external and internal), exhaust systems, heaters and APU. Engine location and tiedown strength Optimum rating: 15 Consider the consequences of engine separation. Where will the engine go, and how will it affect the fuel cell, the exhaust system, the various electrical wirings, the fuel, oil and hydraulic lines, and the assumed fuel spillage patterns associated with typical aircraft accidents? Retention strength is more important for aircraft in which the engine may be located above or just behind the fuel cell. It is of less consequence for pod mounted engines. When the engine is located above occupants or near the fuel cell, 100% of the score will be based on the engine’s ability to withstand the loads developed when the aircraft impacts at the max vertical impact capability determined in section 7.3. Battery location and tiedown strength Optimum rating: 12

Full Spectrum Crashworthiness Criteria October 2011 Page 134
Evaluate from the standpoint of causing occupant injury and of vulnerability of the battery location and attached wiring to damage in relation to where the spilled flammable fluids are likely to be. Electrical wire routing Optimum rating: 12 Evaluate from the standpoint of crashworthiness of routing and vulnerability to damage during crash. Note that power wiring is more critical than data wiring as power wiring has a greater potential for ignition. Also part of wire routing is providing extra length so that deformation resulting from a crash will not pull the wire to failure similar to fuel and hydraulic lines Fuel Boost pump location and tiedown strength. Optimum rating: 7 The fuel boost system should be evaluated with respect to potential fuel spillage. The order of preference ranging from desirable to undesirable is: Suction system, engine mounted pump only; air driven, tank mounted or inline boost pump; electrically operated, tank mounted or inline boost pump. Inverter location and tiedown strength Optimum rating: 6 Evaluate from the standpoint of tiedown and of vulnerability of the inverter location and attached wiring to damage in relation to where the flammable fluids will probably be. The significance of this would be reduced if a crash predictive system shuts down the electrical system prior to impact. Generator location and tiedown strength Optimum rating: 6 Evaluate from the standpoint of tiedown and of vulnerability of the generator location and attached wiring to damage in relation to where the flammable fluids will probably be. The significance of this feature would be reduced if a crash predictive system shuts down the electrical system prior to impact. Lights (Beacon, Search and Navigation) Optimum rating: 5 If the light filament and / or the wires immediately surrounding the light attachments are hot, are they in a position that would place them in an area where spilled fluid is likely to be? The significance of this feature would be reduced if a crash predictive system shuts down the electrical system prior to impact.

Full Spectrum Crashworthiness Criteria October 2011 Page 135
Antenna location and tiedown strength Optimum rating: 4 Evaluate the avionics, the antenna system and their wiring from the standpoint of vulnerability to damage in relation to where the spilled flammable fluids will likely be. The significance of this feature would be reduced if a crash predictive system shuts down the electrical system prior to impact.
7.5 Injurious Environment Rating
Injurious environment can be evaluated in the following manner. Deviations from the method described below should be substantiated with corresponding analysis and test. Proximity of cockpit control panels and other structure. Optimum rating: 10 Check if cockpit occupant is able to contact controls and panels when restrained. Check if shoulder harness allows lateral movement and what structure can be contacted in this manner. Evaluate these throughout the adjustment range of the seat, as well as the stroke of the seat during a crash. Check that the cyclic stick threat has been minimized where stroking type seats are installed. Retention of interior equipment Optimum rating: 10 Check that the tiedown design strength of all mass items which would pose a hazard to personnel during a crash have been mitigated to the crash impact capability of the basic airframe identified in section 7.3. Mitigation techniques include fasteners, straps or enclosures to prevent items from becoming projectiles. This particularly applies to items which may be used during the mission or post-crash, such as mission equipment, fire extinguishers and survival equipment such as rafts. Anti torque / rudder pedal area Optimum rating: 5 Evaluate the possibility of trapping the feet between rudder pedal and adjacent structure. Check if area may collapse easily onto the feet during crash. Check that the area under a stroking seat is blocked off to preclude trapping of feet. Absence of injurious objects in cabin Optimum score: 5 Check, for example, sharp corners and protrusions in the vicinity of the occupants. Ensure that head impact protection provisions conform to the occupant protection requirements.

Full Spectrum Crashworthiness Criteria October 2011 Page 136
7.6 Evacuation Rating
Evacuation assessment can be evaluated in the following manner. Deviations from the method described below should be substantiated with corresponding analysis and/or test. Ease and reliability of exit operations: Optimum rating: 15 Evaluate from the standpoint of simplicity of operation. Include the regular entrance doors. Look for a “single motion” jettison feature on all doors. Check for possibility of jamming during a crash due to fuselage distortion, etc. check equal distribution of emergency exits throughout aircraft to insure that all passengers move about the same distance from their seats to an exit. Ratio of usable exits to occupants Optimum rating: 15 When computing a ratio, include only those exits that are available to those occupants; i.e. do not include cockpit exits in the ratio for cabin occupants. Assign a rating to this ratio which reflects an evacuation time of 30 seconds desired for all occupants. It is recognized that this is a difficult requirement but it is realistic when post-crash fire or water landings are considered. Identification of exits Optimum rating: 10 Check internal emergency markings for conformance to TM 55-1500-345-23 Availability of exits in rolled aircraft. Optimum rating: 10 Use the above ratio considering the aircraft rolled on either side, thereby blocking a certain number of exits. Take into account the size of the available exits and the height above the opposite wall. Does the occupant have to reach too high to climb up and out of an exit? Emergency lighting Optimum rating: 10 Check for system used: impact switch (G limit) or hand operated combination is preferred. Check retention strength. Keep in mind that any system is better than none. Check for independent power supply.

Full Spectrum Crashworthiness Criteria October 2011 Page 137
7.7 Crashworthy System Cost-Benefit Analysis
Building crashworthy aircraft systems are inherently cost effective if planned and developed properly. Military and civil research and field experience have shown that the initial cost and weight increases associated with incorporating crash protection features are offset by the cost-benefits of reduced personnel injury and reduced structural damage over an aircraft’s life cycle[26]. The occupant crash protection system defined in JSSG-2010-7 is required to eliminate injuries and fatalities in relatively mild impacts, and minimize them in severe, survivable mishaps. Minimizing personnel losses in crashes conserves the military’s human resources, reduces medical and disability expenses, provides a positive morale factor, and thereby improves the effectiveness of the services both in peacetime and in periods of conflict. Consequently, new generation aircraft are now procured under a requirement to implement a systems design approach in the development of occupant crash protection. Ultimately a cost benefit analysis can show areas where crashworthy design trade-offs would be most beneficial and can provide insight for developing the best crashworthy aircraft in the most cost effective manner. Lifesaving design does not require that an aircraft be excessively weighty or costly. It does, however, mean that to achieve the best solution, full consideration of crashworthiness must begin at the design phase, rather than in the development phase for a new aircraft. A successful crashworthiness design is one that protects occupants from serious injury in potentially survivable crashes while limiting weight increase, costs, and additional maintenance to acceptable levels. Under-design of the system results in unexpected injuries and deaths while over-design of these elements result in unnecessary costs and weight. To avoid either eventuality, the author of the design specification, as well as the designer, should thoroughly understand:
Crash conditions that are survivable and the characteristics that make aircraft crashworthy.
Human kinematic response to input accelerations
Human tolerance to abrupt accelerations o Whole body o Regional (i.e., head, neck, abdomen, femur)
Human variability in anthropometry and impact tolerance
Injury mechanisms
Performance, weight, cost, and cost-benefits of crash protection features / subsystems
The effect of aircraft configuration / design features on aircraft crash response and occupant survivability potential
The most effective crash protective systems are ones where the design specifications were based on a correct prediction of the crash environment and an accurate assessment of human exposure limits. Since a protective system cannot protect occupants in all crashes under all anticipated conditions, trade-off decisions have to be made in the development of protective

Full Spectrum Crashworthiness Criteria October 2011 Page 138
system design specifications. In general, there are four inter-related factors that need to be considered in making these trade-off decisions:
Anticipated survivable crash impact conditions (input variables) - velocity, force, attitude, environment, etc.
Maximum acceptable injury level, and life cycle cost savings of reduced injuries and fatalities
Host restrictions - space, weight, hard-point availability.
Life cycle cost for all elements of the crash protective system. The weight given to each factor depends on the particular aircraft application. When retrofitting a protective system into an existing aircraft, for example, host restrictions (integration constraints) and cost are usually the dominant factors since the new protective system must adapt to existing space and hard points, and costs are invariably fixed. In new aircraft designs, host restrictions are usually more flexible and can be adapted as necessary to accommodate the desired protection systems. However, in new aircraft programs the portion of available funds allocated to safety systems is not fixed, and safety and protective equipment must compete for weight and cost with all other aircraft systems. In this climate, program managers can be reluctant to trade performance for safety. As implied above, cost and host restrictions tend to drive the decision making process in protective system implementation. However, the first two technical factors of the four listed above can easily be overlooked in the process. A thorough understanding of all four factors is absolutely imperative for making informed trade-off decisions. Design of an appropriate protective system also requires an understanding of the crash and occupant survivability history for the specific aircraft application under consideration. This information can be estimated from a collective analysis of the crash history of similar class aircraft (i.e. type, size, gross weight, and mission) over an extended period of time. This analysis can then complement other analytical methods for determining the required crash protection envelope including impact velocities, attitudes, and surfaces. Ultimately, the “right” level of crash protection for a particular application is determined by balancing the four crash design considerations cited above. Once that level has been determined, a systems approach is recommended for developing the crash protection system based on the principles provided in this document.

Full Spectrum Crashworthiness Criteria October 2011 Page 139
8. Most Recent Rotorcraft Crash Data Analysis
8.1 Analysis Foundation
The analysis for this section is, for the most part, taken directly from the final report[3] for the Research, Development and Engineering Command (RDECOM) titled Rotorcraft Crash Data Analysis, RDECOM TR 09-D-45, Section 2, Summary of Effort Conducted. The analysis is based on an investigation of US Army rotorcraft mishap data. Several highlighted sections are based on a separate study on DoD helicopter mishaps, findings and recommendations [35] This investigation gathered and analyzed detailed information describing aircraft crashes and their outcomes for the purpose of revising the crashworthiness design criteria applied to US military rotorcraft. The study covered nine aircraft types. Two generations of attack helicopters were studied: AH-1 and AH-64. Two generations of utility helicopters were studied: UH-1 and UH-60. Three observation helicopters were studied: OH-6, OH-58A/C and OH-58D. The OH-58D was studied as a separate aircraft from the OH-58A/C because the D-model is substantially redesigned compared to the A and C models. In particular the main rotor design is fundamentally different. The CH-47 is a twin main rotor helicopter and the largest helicopter in the study. The C-23 was initially included in the study with the expectation that this light, fixed wing aircraft could serve as a surrogate for the V-22 aircraft in airplane mode. However, there were only three C-23 crashes and all three proved to be non-survivable and hence no information on crashworthiness could be extracted. The detailed data on the crashes came from the US Army Aviation Safety Database at the Combat Readiness Center. The information from the database included parameters describing the aircraft and its flight prior to the emergency, parameters describing the kinematics of the crash, and parameters describing the outcome of the crash in terms of damage to the aircraft and the injuries to the occupants.
8.2 Crash Analysis Methodology
The primary interest of this investigation is to improve the crashworthiness of aircraft; therefore, the first step was to select the crashes out of all the mishaps recorded in the database. This selection process was accomplished by reviewing all of the narratives and checking the description in the narrative against the impact velocity data. A mishap was defined to be a crash, if the aircraft obviously impacted the terrain or an object AND there was measurable damage to the aircraft. In cases where the damage was so minor that the crew continued to fly the aircraft, the event was not a crash. The database differentiates between in-flight impacts and terrain impacts. In-flight impacts are those where the aircraft impacts an obstacle above the terrain level and then subsequently lands or crashes into the terrain (for brevity these crashes are referred to as either IT&TA crashes or post-obstacle crashes). The author anticipated that crashes following an in-flight impact would have different kinematic characteristics than the crashes that occurred directly into terrain (crashes directly into the terrain are referred to either as T crashes or direct to terrain crashes). Consequently, the two

Full Spectrum Crashworthiness Criteria October 2011 Page 140
types of crashes were identified, and the data maintained in separate groups so that the crash kinematics and injury outcomes could be compared. Once each mishap had been identified as to whether or not it was a crash, queries were written to extract the desired data for only the events identified as crashes. The queries were executed to extract the data by aircraft type and crash type, so each aircraft had two queries in each data category. Each query was written to extract one category of data such as kinematic parameters. For the post-obstacle crashes two kinematic queries are needed, one to extract the kinematic information for the terrain impact and one to extract the kinematic information for the in-flight impact. A pair of queries for each aircraft type extracted data about the aircraft in general, the mission, the phase of flight, gross weight, altitude and the number of people on board. Another pair of queries was written to extract data describing the damage to the aircraft in terms of hull crush, and dislocation of major components. Yet another pair of queries gathered data on the crash site, including the nature of the surface, a description of the general terrain, and the obstacles in the vicinity of the landing site. A pair of queries gathered data describing post-crash fires and the consequential burn injuries. Data were also gathered on the protective equipment available to the occupants, its use, and its performance. A pair of queries gathered information on the injuries to the occupants and the roles of these occupants. Logic statements were used to select and manipulate values while mathematical calculations could be applied to the quantitative data. The data in this early stage of analysis are presented as graphs and tables in an extensive appendix to the final report.
8.2.1 Angle Sequence Methodology
The accident mishap reporting form, DA Form 2397-6-R, requires that the pitch, roll, and yaw must be entered in to Block 2f. (Figure 8-1) When converting from the ground to the airframe axis system, SAFE chose to use the Euler angle sequence of roll first, pitch second, and yaw third to define the matrix transformation order. However, one might assume that the investigators were taught to use a sequence of pitch, roll, and then yaw from the order that the Euler angles are recorded in the accident report. Others would contend that using these angular terms imply a standard convention of yaw first, pitch second, and roll third. Without consideration of any specific convention, there are six possible angular sequences of yaw, pitch, and roll. Several studies were conducted to determine the relative effect in mishap statistics by considering the six different matrix transformations. The first study tabulated the 95th cumulative percentile of downward vertical velocity for survivable and partially survivable mishaps into terrain (T, S=1, 2). (Table 8-1) The fleet statistics indicated a 95th percentile varying from 41.4 to 45.0 ft/s. If these values were used to define a vertical crash design impact velocity for future rotorcraft, the energy associated with the impact could differ by as much as 18% since the energy is a function of the velocity squared. That difference is thought to be significant.
Table 8-1: 95th Percentile Downward Vertical Impact Velocity (T, S=1,2)

Full Spectrum Crashworthiness Criteria October 2011 Page 141
Figure 8-1: Sample Section of Accident Mishap Report
Matrix Order Vertical Rotation Order
Velocity (ft/s) 1st 2nd 3rd
[GP][GR][GY] 45.0 yaw roll pitch
[GR][GY][GP] 44.9 pitch yaw roll
[GR][GP][GY] 44.9 yaw pitch roll
[GY][GP][GR] 41.7 roll pitch yaw
[GP][GY][GR] 41.5 roll yaw pitch
[GY][GR][GP] 41.4 pitch roll yaw

Full Spectrum Crashworthiness Criteria October 2011 Page 142
8.3 Crash Analysis Results
The largest difference between this study and previous similar studies is the separation of the crashes into two types on the basis of whether the aircraft had made prior contact with some obstacle. In approximately 30 percent of the crashes studied, the aircraft struck some obstacle above ground level prior to impacting the “ground.” These obstacles included other aircraft, wires, buildings, vehicles and most frequently trees. In some cases, striking the obstacle was itself the cause of the crash as in a wire strike; while in other cases the impact was coincidental to an emergency approach to the ground. It was expected at the outset, that the outcomes for the “post-obstacle” crashes would be different from the crashes directly into terrain. The direct terrain crashes were entirely survivable in 73 percent of the events, whereas the post-obstacle crashes were entirely survivable in just 55 percent of the events. The differences in outcomes proved to be easier to reveal and quantify than the differences in crash characteristics, especially the kinematics. This study includes data for the AH-1, the UH-1, and OH-58AC aircraft. These three aircraft accounted for 419 crashes compared with 207 crashes for the comparable, later generation aircraft: AH-64, UH-60, and OH-58D.
8.3.1 Kinematics – Velocities
The nature of the crash velocity data is such that it covers a very wide range of values. Consequently, when the means or medians are calculated, very large standard deviations result. Large standard deviations make demonstrating that statistically significant differences exist very difficult. Testing the velocity data from individual aircraft revealed only a few cases where the difference between the mean or median velocity for terrain (T) crashes was statistically different from the same velocity for the terrain impact following in-flight contact with an obstacle, or (IT&TA) crashes.
8.3.2 Kinematics – Angle
Plots of the flight path and impact angle distributions show a difference between the direct terrain impacts and the post-obstacle impacts (Figure 8-2). The direct terrain impacts occur markedly more frequently with low flight path and low impact angles than do the post-impact crashes. In contrast, the post-obstacle crashes occur almost twice as often for a near vertical flight path and impact angles than do the direct terrain crashes and at higher vertical velocity (Figure 8-3).

Full Spectrum Crashworthiness Criteria October 2011 Page 143
Figure 8-2: Comparison of flight path angle for obstacle (IT-T&TA) and non-obstacle (T) crashes
Figure 8-3: Comparison of vertical velocity for obstacle (IT-T&TA) and non-obstacle (T) crashes

Full Spectrum Crashworthiness Criteria October 2011 Page 144
The distributions of attitude angles cluster tightly around the nominal aircraft attitude (each angle equals zero). The post-obstacle crashes exhibit a lower peak frequency at zero and a correspondingly broader distribution. In particular, the pitch angle distribution for the post-obstacle crashes is characterized by more nose down events which would tend to be more injurious for pilots and to partially neutralize the protection provided by the landing gear. The roll angle distribution for the post-obstacle has a small second peak in the frequency curve between -80 and -110 degrees (left roll). Crashes at this attitude are effectively lateral crashes on the left side. Once again, no benefit is obtained from the energy absorption strategy, which is effective for predominantly vertical crashes at nominal attitudes. Analysis for statistical significance found that the difference between the direct terrain crashes and the post-obstacle crashes were statistically significant for the pitch angle distributions of individual aircraft types and of all the aircraft combined. The more frequent nose down attitude in the post-obstacle crashes was confirmed. The statistical analysis failed to find a statistical difference in the roll angle means or medians, but it did confirm that the post-obstacle crashes showed a broader distribution of frequencies. Likewise, a similar finding was made for the yaw angle.
8.3.3 Operational Information
This data was perhaps the least revealing area studied. The expectation for analyzing this data was to reveal information about the events leading up to the crash. Unfortunately, this portion of the database is less well populated than other areas and the data that are present were not revealing. For example, the phase of operation is reported at three times in the crash sequence: as planned, at emergency, and at termination. The as-planned datum is seldom provided. For all three of these fields combined, the three most commonly reported phases are landing (27 percent), autorotation (12 percent), and cruise (11 percent). The most useful phase information appears to be that labeled as Phase at Emergency. This field is the closest information available to identifying the operation mode at the onset of the emergency. At the time of the emergency, cruise (19.4 percent) is the most commonly reported phase, followed by landing (14.3 percent). Combining the three low level flight regimes “low level,” “NOE (Nap of the Earth),” and “contour” accounts for 12.1 percent of the crashes and combining IGE (In Ground Effect) hover with OGE (Out of Ground Effect) hover accounts for a further 11.4 percent.
8.3.4 Impact Severity
The data on the impact forces were difficult to analyze. In many cases, the values of the standard deviations were larger than the mean values due to a few extraordinarily large values reported. The mean values incorporated both positive and negative values which tended to bring the mean values closer to zero. The fraction of all crashes with impact directions opposite to the conventional direction was surprising. Cumulative percentile plots were created using absolute values of the impact severities and these clarified the analysis significantly (Figure 8-4). The plots revealed a smooth increase in the crash severity up to about 40 G. Beyond this level, large jumps in the severity values appear, indicating that there may be some difficulty in estimating the

Full Spectrum Crashworthiness Criteria October 2011 Page 145
actual values. Average values were calculated using the absolute values and these means proved quite revealing. Comparing the mean absolute values for the direct terrain crashes to the means for the post-obstacle crashes, the post-obstacles crashes generally had equal or higher values than the direct terrain impacts. This difference is one clear indicator of why the post-obstacle crashes are more injurious than the direct terrain crashes.
Figure 8-4: Example of impact severity plot
8.3.5 Airframe Damage
The airframe damage is recorded as three or four levels of displacement for 18 regions around the airframe. The damage at each region is also coded for whether that damage contributed to an injury or not. The data are presented in the form of aircraft maps (Figure 8-5). These maps report the damage frequencies for each region of the aircraft. For each damage level in a region, the frequency that damage in that region led to an injury is reported. The frequency is reported as a percentage of the crashes by that aircraft type.

Full Spectrum Crashworthiness Criteria October 2011 Page 146
Figure 8-5: Example of a damage map
8.3.6 Retention of High Mass Items
For the AH-64, comparing the frequency that high mass items are displaced in direct terrain crashes to the frequency for post-obstacle crashes reveals more frequent displacements for the post-obstacle crashes.
8.3.7 Impact Surface
An impact surface was reported for approximately 89 percent of all the crashes analyzed. Sixty-six percent of the crashes where the surface was reported occurred

Full Spectrum Crashworthiness Criteria October 2011 Page 147
onto sod which is a term for a broad range of unprepared, natural surfaces. Just 16 percent of crashes occurred onto prepared surfaces. These relative frequencies remained consistent between both survivable and non-survivable crashes and between crashes directly to terrain and post-obstacle crashes.
8.3.8 Crash Site Obstacles
Obstacles at the crash site are not necessarily those impacted, but are obstacles in the vicinity of the crash site. Trees were reported as obstacles near 40 percent of the sites for survivable and partially survivable crashes directly into terrain. Trees were reported near 56 percent of sites for non-survivable crashes directly into terrain. Trees were reported as obstacles near 72 percent of the sites for survivable and partially survivable post-obstacle crashes. The corresponding frequency for non-survivable crashes was reported as 60 percent. The next most frequently reported obstacle is “rocks.”
8.3.9 Injury Data
The data on injuries is recorded in two tables in the database. One form is reported in the ”aircraft information” table and consists of the number of people onboard the aircraft injured at various severity levels including those without injuries. These people are identified as either civilian or military. The other form of data is reported in the “injury information” table and consists of detailed information about the injuries to each person and information about the injured person including the person’s role aboard the aircraft. The number of personnel covered in these two data sets did not correlate well. The table with detailed injury and role information did not include the uninjured personnel, nor did it appear to include all personnel with the lower severity injuries. Nor did the number of people in major injury categories agree from one table to the other. The data from each table were treated separately and data from each table were presumed to be at least consistently reported between aircraft types within each table. Injury maps were created similar to those originally presented in the Aircraft Crash Survival Design Guide. These maps display the frequency of injury to various regions of the human body. The frequencies are reported as the fraction of injuries to the body region as a percentage of the number of injuries reported. An injury map is presented for all personnel combined and one map is presented for each of three personnel roles on the aircraft: pilots, non-pilot crew, and passengers. A second set of injury maps was created that reports the frequency of individuals injured in each body region. These maps report the fraction of individuals injured in each body region as a percentage of the number of individuals with reported injuries.
8.3.10 Injuries Due to Post-crash Fire
Sixteen of eighteen fire fatalities are attributed to just two crashes. In both crashes, non-crashworthy, auxiliary fuel systems provided the source of flammable material to sustain the fire.

Full Spectrum Crashworthiness Criteria October 2011 Page 148
8.3.11 Protection Equipment
Four pieces of protective equipment were studied: lap belt, shoulder harness, inertia reel and seat. In general, pilots, as a group, have all of these items available to them and use them. The situation in the cabin is difficult to generalize. In many cases the equipment is not available to all personnel; and even when it is available, the equipment frequently is not used. More functional failures also are reported for the cabin. Equipment usage is higher in both models of the OH-58 where the cabin is smaller and more contiguous with the cockpit than usage in the larger aircraft where the cabin and cockpit are less contiguous. In larger aircraft there is more passenger equipment usage due to the proximity of the passengers to the equipment. The difference may also be attributed to the difference in the time available to entering passengers for finding and securing their restraints. A difference in performance by protective equipment is recorded between the direct terrain impacts and the post-obstacle impacts. With exceptions for specific devices in the attack helicopters, a higher percentage of “injuries prevented” is reported for direct terrain crashes than for post-obstacle crashes. This trend applies to all four devices and to both the cockpit and the cabin. Aside from the low usage rates for protective equipment in the cabin, the most remarkable feature of these data is the seat performance. Twenty-one instances of pilot seats “producing injury” were reported as were ten failures to function. In the cabin, seven instances of the seat producing an injury were reported for the UH-1 and ten seat failures were reported between the UH-1 and the UH-60. While airbags for passengers and crew were not studied, their successful use in the OH-58D portends a major role for them in future prevention of crash related trauma.
8.3.12 Transition Velocity Analysis
An analysis used previously to compare the crashworthiness of two aircraft was modified and applied in this work. The analysis identifies that velocity above which all crashes result in severe injury to all of the occupants. The analysis done previously used fatalities, but this work expands the criterion to include missing, totally disabled and partially disabled persons. The revised method also simplifies the approach by plotting the fraction of personnel with severe injuries for each crash rather than grouping crashes into velocity increments. For the vertical speed, the analysis finds that the transition velocity for direct terrain crashes is generally higher than the transition velocity for post-obstacle crashes. The exceptions are the UH-1 and the AH-64. By regrouping the aircraft, by rotor technology, it became apparent that the transition velocity associated with the direct to terrain crashes may be associated with the autorotation characteristic and the rotor system configuration, whereas the transition velocity for the post-obstacle crashes is more characteristic of the structural integrity of the airframe. The application of transition velocity analysis to the ground speed was not productive. Clear transition speeds were difficult to determine or the resulting velocities were

Full Spectrum Crashworthiness Criteria October 2011 Page 149
extremely high. This result is attributed to the presence of low impact angle crashes for each aircraft type. In these type accidents, the aircraft slides out over a long distance reducing the deceleration forces to tolerable levels and allowing partial survivability. The velocities of these crashes are often widely spaced, thus making the determination of a transition velocity less meaningful. In several cases, the crash with the highest calculated longitudinal velocity was a partially survivable crash rather than a non-survivable crash.
8.3.13 Regression Analysis
Two forms of regression analysis were performed: linear regression using the fraction of severe injuries as the response variable and ordinal logistic regression using the crash survivability as the response variable. Neither analysis approach achieved predictive models, that is to say models that can predict crash outcomes given the characteristics from a particular crash. However, the models have confirmed the importance of variables such as the vertical speed and ground speed and have quantified their relative importance. While simple to run and easy to understand, the linear regression models disappointed in that the resulting models had low predictive values. One statistic generated by the regression software indicates what percent of the total variability displayed in the response variable is predicted by the regressor (input) variables. These values were generally in the ten to thirty percent range, far short of the percentages that one would hope for in a model to be considered truly predictive. These results mean either that important regressor variables are absent from the model or that the there is too much variation in the regressor variables. Many variables that were expected to be important in determining crash outcomes were found not to be statistically significant. Among the crash variables that failed to be predictive were the three attitude angles at impact, the crash type, and the disk loading. None of the aircraft design variables were found to be statistically significant either, including the rotor system, number of main rotor blades, landing gear type, or tail rotor position. The ordinal logistic regression analysis is more complex to run and its results are far from easy to interpret. However, this model consistently found the same parameters significant and predicted similar coefficients for five of the eight aircraft types. Specifically, Table 8-2 summarizes the coefficients for all of the ordinal logistic models. Grouping the aircraft according to the design generation, a trend becomes apparent. For the vertical speed, the coefficients for the older-generation aircraft are almost twice as large as the coefficients for the second-generation aircraft. This finding means that the probability of a crash being survivable decreases almost twice as fast with each ft/s increase in vertical speed for the earlier generation aircraft compared to the later generation.

Full Spectrum Crashworthiness Criteria October 2011 Page 150
Table 8-2: Logistic Regression Coefficients
Furthermore, the ordinal logistic model consistently included the crash type as significant in determining the survivability of a crash. In another study, overall aircraft design was found to be a factor in survivability. Mapes et al [35] demonstrated the poorest outcomes for conventional helicopters with substantial mass over occupied space. Attack helicopters, with mass aft of occupied space fared better. Twin rotor helicopters had the highest percent of occupants escape without injury in human factor mishaps. In non-human factor mishaps, the benefit of design was obscured by training effects and outcomes were better.
8.4 Conclusions
This study divided the crashes into two types: crashes direct-to-terrain (T) and crashes into terrain following an impact with some obstacle above ground level (IT&TA or “post-obstacle”). Approximately 30 percent of all the crashes studied were post-obstacle crashes. The survivability of the two crash types differ: 73 percent of direct-to-terrain crashes are fully survivable (S=1), compared with 55 percent of the post-obstacle crashes. The AH-64 and the UH-60 experience a greater fraction (38 percent) of post-obstacle crashes than the earlier generation of attack and utility helicopters (31 percent). This comparison suggests that the trend is toward a greater frequency of post-obstacle

Full Spectrum Crashworthiness Criteria October 2011 Page 151
crashes and thus, the 30 percent figure stated above will be a low estimate for current and future activity.
8.4.1 Kinematics
The cumulative velocity curves recording ground speed (earth reference frame) are very similar for both direct-to-terrain crashes and post-obstacle crashes. The cumulative velocity curve recording vertical speed (earth reference frame) for the post-obstacle crashes is higher than the corresponding curve for direct-to-terrain at nearly all percentiles. As characterized by the 95th percentile partially survivable crash, the vertical velocity (aircraft reference frame) for the direct-to-terrain crashes is very similar to that in the ACSDG’71 at 41-ft/s. The 95th percentile for the post-obstacle crashes is slightly higher at 45-ft/s. The 95th percentile longitudinal velocity (aircraft reference frame) for direct-to-terrain partially survivable crashes is 100 ft/s compared to 50 ft/s in the ACSDG’71. The 95th percentile longitudinal velocity for the post-obstacle crashes is lower at 80 ft/s. The 95th percentile lateral velocity (aircraft reference frame) for direct-to-terrain partially survivable crashes determined in this study is 18 ft/s. No corresponding value was determined in the ACSDG’71 for comparison. The same parameter for post-obstacle crashes is 28-ft/s. Direct-to-terrain crashes occur more frequently with low flight path and low impact angle than do the post-obstacle crashes. In contrast the post-obstacle crashes occur almost twice as often with near vertical flight path and impact angles. Consistent with previous studies, the attitude angles are tightly clustered around the normal flight attitude (pitch, roll, and yaw = 0). The two crash types have different frequency distributions for the attitude angles. The post-obstacle crashes show lower peak frequencies at the zero values, broader distributions and more extreme values. A regression analysis of the angle data confirmed the larger angle variation in the post-obstacle crashes. The mean impact severities for the post-obstacle crashes are equal to or higher than the mean impact severities for the direct-to-terrain crashes. Sixty-six percent of all crashes occurred on sod. Just 16 percent occurred on prepared surfaces. These relative frequencies remained consistent between both survivable and non-survivable crashes and between crashes directly to terrain and post obstacle crashes. Trees are the most common obstacles associated with crashes. Trees are present in the vicinity of 40 percent of survivable and partially survivable crashes directly-to-terrain. They were present near 72 percent of the post-obstacle crashes.

Full Spectrum Crashworthiness Criteria October 2011 Page 152
8.4.2 Other Considerations
Crashworthy fuel systems have virtually eliminated deaths due to post-crash fires. Only two accidents occurred with multiple deaths due to post-crash fire and both involved non-crashworthy auxiliary fuel systems. Protective equipment, lap belts, shoulder harnesses, inertia reels and seats, are widely used by pilots and are generally effective. The same equipment is less available, less often used, and less effective (when used) for people in the cabin. An analysis was conducted to identify the velocity at which the crashes by each aircraft type resulted in severe injuries (fatal or disabled) to all onboard. Above the severe injury transition velocity all occupants experience severe injuries. The severe injury transition velocity can be interpreted as one measure of the crashworthiness of the aircraft. The vertical transition velocities for the direct-to-terrain crashes were generally higher than the transition velocities for the post-obstacles crashes of the same aircraft type. The UH-1 and AH-64 were exceptions. Grouping the aircraft by rotor system and looking at the vertical transition velocity reveals that the OH-58D with the bearingless rotor system has a much lower transition velocity than the OH-58A/C with a teetering rotor system (28- vs > 42-ft/s). The UH-60 has the highest vertical transition velocity in the analysis and, as such, could be considered the most crashworthy aircraft by this measure. However, actual outcome data indicate that in the Army, the Chinook (H-47) has the best overall history of crashworthiness [35]. Similar comparisons for the post-obstacle crashes reveal that the OH-58A/C and D have virtually identical transition velocities. This outcome suggests that the transition velocity for these crashes has more to do with the structural integrity and personal protective equipment than the rotor system. This inference is supported by the fact that the transition velocity for the AH-64 is far higher than for the AH-1 and, likewise, the UH-60 is significantly higher than the UH-1. Actual outcome data indicate that the most important variable is the presence of heavy aircraft components above occupiable space[35].
8.5 Study Recommendations
Some of the findings in this report suggest that a fundamental re-evaluation of crashworthiness strategy should take place. The current strategy concentrates on vertical energy absorption. The findings in this study indicate that the strategy should be more robust to impacts that occur off the normal aircraft attitude. The fact that 30 percent of the crashes in this study were post-obstacle crashes and that these crashes have significantly lower survivability suggests that the aircraft crashworthiness is less effective in non-vertical events. That the post-obstacle crashes lead to greater variation in the impact attitude suggests that the crashworthiness mitigation technologies should be more robust to non-normal attitude angles. The fact that only

Full Spectrum Crashworthiness Criteria October 2011 Page 153
16 percent of crashes occur on prepared surfaces suggests that the mitigation technology should also be robust to variations in the surface stiffness. A shift toward greater design tolerance may lead to less reliance on landing gear for energy absorption with the weight being re-allocated to more robust structure and other means of absorbing energy that are more effective in the lateral directions and on softer surfaces. The need to reevaluate the approach to crashworthiness is supported by the fact that the current generation aircraft represented by the AH-64 and the UH-60 are experiencing post-obstacle crashes at a frequency of 38 percent, rather than the 30 percent for the whole study population of crashes.

Full Spectrum Crashworthiness Criteria October 2011 Page 154
APPENDIX A: Acronyms and Abbreviations
ACSDG Aircraft Crash Survival Design Guide ACAP Advanced Composite Airframe Program ADS Aeronautical Design Standard AGL Above Ground Level AH Attack Helicopter ALE Arbitrary LaGrangian Eulerian ASME American Society of Mechanical Engineers ATD Anthropomorphic Test Devise ATRL Analytical Tool Readiness Level CABS Cockpit Airbag Systems CH Cargo Helicopter CI Crashworthiness Index DGW Design Gross Weight DoD Department of Defense DoN Department of the Navy DRI Dynamic Response Index DVE Degraded Visual Environment ETL Effective Translational Lift FAA Federal Aviation Administration FOD Foreign Object Damage FSC Full Spectrum Crashworthiness FTSS First Technology Safety Systems HIC Head Injury Criteria IARV Injury Assessment Risk Values IGE In Ground Effect IT In-flight plus Terrain JFTL Joint Future Theater Lift JMR Joint Multi-Role LIDAR Light Detection And Ranging LS-DYNA Software code developed by LSTC Software, Inc. MRL Manufacturing Readiness Levels NASA National Aeronautics and Space Administration NOE Nap Of Earth NTSB National Transportation Safety Board OGE Out of Ground Effect OH Observation Helicopter RAH Reconnaissance Attack Helicopter R&D Research and Development RDECOM Research, Development and Engineering Command SEA Specific Energy Absorption: energy/mass T Aircraft impacted only terrain TA Terrain after In-flight TRL Technology Readiness Level UAS Unmanned Aerial System UET Underwater Egress Training UH Utility Helicopter US United States VEA Volumetric Energy Absorption: energy/volume V&V Verification and Validation

Full Spectrum Crashworthiness Criteria October 2011 Page 155
APPENDIX B: Works Cited
[1] US Government, Military Standard Light Fixed and Rotary-Wing Aircraft Crash Resistance, September 1988.
[2] S. Desjardins et. al, Aircraft Crash Survival Design Guide, USAAVSCOM, December 1989.
[3] Safe, Inc, Rotorcraft Crash Mishap Analysis, Ft. Eustis, VA: Aviation Applied Technology Directorate, May 2009.
[4] L. T. B. C. Hudson Carper, “Evolving Crashworthiness Design Criteria,” in Conference Proceedings of Energy Absorption of Aircraft Structures as an Aspect of Crashworthiness, 1989.
[5] Simula, Inc, Development of Categorized Crashworthiness Design Criteria for US Army Aircraft, USAAVSCOM, May 1990.
[6] Shanahan, “Basic Principals on Crashworthiness,” 2004.
[7] Center for Rotorcraft Innovation, "Task 2 – Identification of System Level Technologies Final Report under Army Technology Investment Agreement W911W6-05-2-0003," Aviation Applied Technology Directorate, Ft. Eustis, VA, May, 2010.
[8] Phillips, Nolan, Bell Helicopter, “Strategic Research Planning and Management,” Grapevine, TX, May 2009.
[9] R. S. Kent, “Injury and Fatality Patterns in US Navy Rotory Wing Mishaps: A descriptive Review of Class A and B Mishaps from 1985 to 2005,” in AHS 65th Annual Forum, Grapevine, TX, May 2009.
[10] T. a. B. P. Barth, “ Comparison of Heart and Aortic Injuries to Head, Neck, and Spine Injuries in US Army Aircraft Accidents from 1983 to 2005,” in Proceedings of the American Helicopter Society Forum 66, Phoenix, Arizona, May 10-13, 2010..
[11] D. R. B. M. W. B. D. J. K. R. a. B. J. Van Gowdy, “A Lumbar Spine Modification to the Hybrid III ATD for Aircraft Seat Tests”.
[12] “About Aerospace and Military Dummies,” Humanetics, [Online]. Available: http://www.humaneticsatd.com/crash-test-dummies/aerospace-military. [Accessed 19 August 2011].
[13] C. W. Gadd, “Use of a Weighted-Impulse Criterion for Estimating Injury Hazard,” in Proceedings of the Tenth Stapp Car Crash Conference, New York, 1966.
[14] Code of Federal Regulations, Occupant Crash Protection, Washington D. C: U. S. Government Printing Office, 1987.
[15] a. P. L. Mertz H.J., “Strength and Response of the Human Neck,” in Stapp Car Crash Conference, 1971.
[16] L. P. J. P. C. a. W. D. Carter, “Tensile Neck Injury Criterion Development,” in Annual SAFE Symposium., 2000 .
[17] R. S. E. K. S. a. S. R. Eppinger, Supplement: Development of Improved Injury Criteria for the Assessment of Advanced Automotive Restraint Systems,

Full Spectrum Crashworthiness Criteria October 2011 Page 156
National Highway Traffic Safety Administration, March 2000.
[18] J. Nichols, “Overview of Ejection Neck Injury Criteria,” in Annual SAFE Symposium, 2006.
[19] H. Mertz, “Anthropomorphic Test Devices,,” Accidental Injury Biomechanics and Prevention, 2002.
[20] M. W. J. F. P. Y. N. P. F. a. S. S. Philippens, “ES2 Neck Injury Assessment Reference Values for Lateral Loading in Side Facing Seat,” in Stapp Car Crash Journal, November 2009.
[21] H. J. Mertz, A Procedure for Normalizing Impact Response Data, May 1984.
[22] H. J. I. A. L. M. J. W. S. R. a. B. M. S. Mertz, Size, Weight and Biomechanical Impact Response Requirements for Adult Size Small Female and Large Male Dummies, March 1989.
[23] Anon, “General Aviation Crashworthiness Project,” National Transportation Safety Board, 1985.
[24] A. M. Eiband, “Human Tolerance to Rapidly Applied Accelerations: A Summary of the Literature,” Washington D.C, June 1959.
[25] E. L. a. P. P. R. Stech, “Dynamic Models of the Human Body,” Wright-Patterson Air Force Base, Ohio, 1969.
[26] J. S. S. Guide, Crew Systems Crash Protection Handbook, Department of Defense, October 30, 1998.
[27] S. Desjardins, “Establishing Lumbar Injury Tolerance for Energy Absorbing Seats,” in Proceedings of the American Helicopter Society Forum 64, Montreal, Canada, April 29-May 1, 2008..
[28] M. a. A. B. Keown, “Review of Lower Leg Injury Criteria and Physical Surrogates,” Biokinetics and Associates Ltd, Ottawa, Canada, October 2003.
[29] J. Pellettiere, “Computational Strength Determination of Human Long Bones”.
[30] H. Yamada, Strength of Biological Materials, Baltimore, Maryland.: Williams and Wilkens, 1970.
[31] H. J. Mertz, Injury assessment values used to evaluate Hybrid III response measurements, March 22, 1984.
[32] Anon, The Abbreviated Injury Scale, 1985 Revision, Des Plaines, Ill: American Association for Automotive Medicine, 1985.
[33] S. P. Baker, B. O’Neill, J. W. Hadden and W. B. and Long, “The Injury Severity Score: a method for describing patients with multiple injuries and evaluating emergency care,” The Journal of Trauma, vol. 14, pp. pp 187-196, 1974.
[34] J. a. K. T. Pellettiere, “Occupant Model Validation,” Advances in Applied Digital Human Modeling, 2011.
[35] P. K. R. W. R. Mapes, “DoD Helicopter Mishaps FY 85 – 05: Findings and Recommendations,” Defense Safety Oversight Council, 2008.
[36] Center for Rotorcraft Innovation, “Report, Modeling Tools Evaluation and Recommendations Task 5 - Final Report under Army Technology Investment Agreement W911W6-05-2-0003,” Aviation Applied Technology Directorate, Ft.

Full Spectrum Crashworthiness Criteria October 2011 Page 157
Eustis, VA, 31 December 2009.
[37] J. B. A. L. D. Coltman, “Analysis of Rotorcraft Crash Dynamics for Development of Improved Crashworthiness Design Criteria,” Federal Aviation Administration Technical Center, Atlantic City, NJ, 1985.
[38] Center for Rotorcraft Innovation, "Identification of Design and Environment Implications on Crash Performance," Aviation Applied Technology Directorate, Ft. Eustis, VA, May 31 2010.
[39] C. Kindervater, R. Thomson, A. Johnson, M. David, M. Joosten, Z. Mikulik, L. Mulcahy, S. Veldman, A. Gunnion, A. Jackson and S. Dutton, “Validation of Crashworthiness Simulation and Design Methods by Testing of a Scaled Composite Helicopter Frame Section,” in AHS 67th Annual Forum Conference Proceedings, Virginia Beach, VA, May, 2011.
[40] S. P. e. a. Desjardins, Aircraft Crash Survival Design Guide,, Ft Eustis, VA: US Army Applied Technology Laboratory, AVRADCOM, 1990.
[41] C. a. R. K. Brooks, “Survival: 20 Years Canadian Forces Aircrew Experience. Aviation, Space and Environmental Medicine,,” 1984.
[42] D. C. Brooks, “The Abysmal Performance of the Inflatable Liferaft in Helicopter Ditchings,” in NATO RTO Conference Proceedings, San Diego, CA, 1998.
[43] a. S. C. Harris S. W., “Strategic Research Planning and Management,” Grapevine, TX, 2009.
[44] A. M., “Design of Experiments,” The Industrial Physicist, no. September, pp. 24-26, September 1997.
[45] Society of Automotive Engineers, “Surface Vehicle Recommended Practice: Instrumentation for Impact Test – Part 1, Electronic Instrumentation,” no. J211/1, July 2007.
[46] a. M. J. Nahum A.M., Accidental Injury: Biomechanics and Prevention, 2nd Edition ed., New York: Springer-Verlag, 2002.
[47] U.S. Department of Transportation, “Federal Motor Vehicle Safety Part 571, Standard 208 – Occupant Crash Protection,” 11 September 2011. [Online]. Available: www.fmcsa.dot.gov. [Accessed 11 September 2011].
[48] FAA, “Federal Aviation Regulations for Aviation Maintenance Technicians , Part 27 Airworthiness Standard: Normal Category Rotorcraft,” Federal Aviation Administration.
[49] a. L. J. Polanco M.A., “Vertical Drop Testing and Simulation of Anthropomorphic Test Devices,” Virginia Beach, May, 2011.
[50] a. M. H. Backaitis S.H., “Hybrid III: The First Human-Like Crash Test Dummy,” no. SAE PT-44, 1994.
[51] L. J.D., “Large Field Photogrammetry Techniques for Aircraft and Spacecraft Impact Testing,” Indianapolis, IN, June, 2010.
[52] B. L. a. J. K. Lyle K.H., “Evaluation of Test/Analysis Correlation Methods for Crash Applications,” vol. 47, no. 4, pp. 219-232, 2002.
[53] H. J. Q., “LS-DYNA Keyword User’s Manual Volumes I and II Version 971,” August 2006.

Full Spectrum Crashworthiness Criteria October 2011 Page 158
[54] ESI Group, “PAM-CRASH,,” 11 September 2011. [Online]. Available: www.esi-group.com/products/crash-impact-safety/pam-crash. [Accessed 11 September 2011].
[55] Simula, “Abaqus/Explicit 6.11,” 11 September 2011. [Online]. Available: www.simulia.com/products/abaqus_explicit.html. [Accessed 11 September 2011].
[56] Altair HyperWorks, “RADIOSS,” [Online]. Available: www.altairhyperworks.com/. [Accessed 11 September 2011].
[57] MSC Software, “MD Nastran SOL-700,” [Online]. Available: www.scribd.com/doc/20954989/MD-Nastran-R3-Explicit-Nonlinear-SOL-700-User’s-Guide. [Accessed 2011].
[58] a. J. K. Fasanella E.L., “Best Practices for Crash Modeling and Simulation,” NASA and US Army Research Lab, NASA Langley Research Center , October 2002.
[59] Department of Injury Prevention, “MADYMO Users’ Manual 3-D Version 4.3,” Dutch Institute of Applied Scientific Research – Road/Vehicles Research Institute, Department of Injury Prevention, October 1988.
[60] G. T. K. I. F. J. Obergefell L.A., “Articulated Total Body Model Enhancements, Volume 2: Users Guide,” USAF, Wright-Patterson Air Force Base, January 1988.
[61] First Technology Safety Systems, “FTSS LS-DYNA Model of the Hybrid III 50th Percentile Male Dummy User Manual,” December 2008.
[62] Department of Transportation, “Methodology for Dynamic Seat Certification by Analysis for Use in Parts 23, 25, 27, and 29 Airplanes and Rotorcraft,” May 19, 2003.
[63] a. K. T. Pellettiere J.A., “Verification, Validation, and Accreditation (AA&A) for Human Models,” Society of Automotive Engineers, 2003.
[64] Toyota, “Total Human Model for Safety (THUMS),” Toyota, [Online]. Available: http://www.toyota.com/esq/articles/2010/. [Accessed 2011].
[65] C. J.J., “Status of the Global Human Body Models Consortium,” in Proceedings of the 3rd International Symposium on Human Modeling and Simulation in Automotive Engineering, May 26-27, 2011.
[66] F. E. a. L. K. Jackson K.E., “Crash Certification by Analysis-Are We There Yet?,” in Proceedings of the 62nd Annual Forum of American Helicopter Society, Phoenix AZ, May 2006.
[67] AIAA, Guide for the Verification and Validation of Computational Fluid Dynamics Simulations, American Institute of Aeronautics and Astronautics, June 2002.
[68] Department of Defense, “DOD Instruction 5000.61: Modeling and Simulation (M&S) Verification, Validation, and Accreditation (VV&A),” Defense Modeling and Simulation Office, Office of the Director of Defense Research and Engineering, 29 April 1996. [Online]. Available: www.dmso.mil/docslib. [Accessed 11 September 2011].
[69] Department of Defense, “Verification, Validation, and Accredization (VV&A) Recommended Practices Guide,” Defense Modeling and Simulation Office,

Full Spectrum Crashworthiness Criteria October 2011 Page 159
Office of the Director of Defense Research and Engineering, 28 October 1996. [Online]. Available: www.dmso.mil/docslib. [Accessed 11 September 2011].
[70] P. M. O. W. Trucano T.G., “General Concepts for Experimental Validation of ASCI Code Applications,” Sandia National Laboratory, March 2002.
[71] T. T. a. H. C. Oberkampf W.L., “Verification, Validation, and Predictive Capability in Computational Engineering and Physics,” Sandia National Laboratories, February, 2003.
[72] Anonymous, “LS-DYNA Software Quality Assurance,” March, 2006.
[73] R. M. A. M. a. J. K. Horta L.G., “Multi-Dimensional Correlation of Impact Dynamic Models,” in Proceedings of the IMAC-XXIX Conference and Exposition on Structural Dynamics, Jacksonville, Florida, January 31 - February 3, 2011.
[74] F. E. B. R. a. L. K. Jackson K.E., “Full-Scale Crash Test and Finite Element Simulation of a Composite Prototype Helicopter,” August, 2003.
[75] a. W. J. Tabiei A., “Validated Crash Simulation of the Most Common Guardrail System in the USA,” vol. 5, no. 2, pp. 153-168, 2000.
[76] S. L.E., “Validation metrics for response histories: perspectives and case studies,” vol. 23, pp. 295-309, 2007.
[77] G. T. Sprague M.A., “Spectral elements and field separation for an acoustic fluid subject to cavitation,” Journal of Computational Physics, vol. 184, pp. 149-162.
[78] Columbia Accident Investigation Board (CAIB), Report Volume 1, vol. I, N. A. a. S. Administration, Ed., US Government Printing Office, August 2003.
[79] National Aeronautics and Space Administration, “Standard for Models and Simulation,” NASA, Washington, D.C., July, 2008.
[80] Anon, “Guide for Verification and Validation in Computational Solid Mechanics,” American Society of Mechanical Engineers, NY,NY, December 2006.
[81] D. S. R. B. D. K. a. A. K. Oberkampf W.L., “Estimation of Total Uncertainty in Modeling and Simulation,” Sandia National Laboratories, April, 2005.
[82] L. Schwer, “Class notes associated with the short course “Concrete and Geomaterial Modeling with LS-DYNA”,” Livermore, CA, 2006.
[83] “Standard Test Method for Unconfined Compressive Strength of Cohesive Soil,” ASTM International, West Conshohocken, PA, 2000.
[84] “Standard Test Method for Consolidated Undrained Triaxial Compression Test for Cohesive Soils,” ASTM International, West Conshohocken, PA, 2004.
[85] S. A. R. J. V. H. R. a. B. B. Shoop, “Constitutive Model for a Thawing, Frost-Susceptible Sand,” U.S. Army Corps of Engineers, Engineer Research and Development Center,, Cold Regions Research and Engineering Laboratory, February 2005.
[86] K. M. K. H. M. F. L. Arulmoli, “VELACS Verification of Liquefaction Analyses by Centrifuge Studies Laboratory Testing Program Soil Data Report,” National Science Foundation , Irvine, CA, March 1992.
[87] M. A. C. D. E. G. M. L. T. C. M. Thomas, “Constitutive Soil Properties for Cuddeback Lake, California and Carson Sink, Nevada,” August 2008.

Full Spectrum Crashworthiness Criteria October 2011 Page 160
[88] J. A. S. Coltman, “The Naval Aircraft Crash Environment: Aircrew Survivability and Aircraft Structural Response,” Naval Air Development Center, Warminster, PA, 1988.
[89] G. S. M. S. A. R. M. Wittlin, “Airframe Water Impact Analysis Using a Combined MSC/DYTRAN-DRI/KRASH Approach",” in AHS 53rd Annual Forum, Virginia Beach VA, 29 April - 1 May, 1997.
[90] B. T. W. R. S. J. C. Y. H. W. R. R. W. N. a. W. J. Bolukbasi A., “Rotorcraft Active Crash Protection System,” in 67th Annual Forum of the American Helicopter Society, Virginia Beach, VA, May 2011.
[91] K. E. a. F. E. L. Jackson, “NASA Langley Research Center Impact Dynamics Research Facility Research Survey,” vol. 41, no. 3, pp. 511-522, June 2004.
[92] K. E. B. R. L. F. E. L. J. L. a. L. K. H. Jackson, “A Summary of DOD-Sponsored Research Performed at NASA Langley's Impact Dynamics Research Facility (IDRF),” vol. 51, no. 1, pp. 59-69, January 2006.
[93] C. S. C. S. A. K. S. M. R. a. J. C. Tho, “Efficient Helicopter Skid Gear Landing Gear Dynamic Drop Simulation Using LS-DYNA,” vol. 49, no. 4, pp. 483-492, October 2004.
[94] Society of Automotive Engineers, “Recommended Practice: Instrumentation for Impact Test – Part 1, Electronic Instrumentation,” Society of Automotive Engineers, March 1995.
[95] M. Gamon, “General Aviation Airplane Structural Crashworthiness User's Manual Volume I Program KRASH Theory,” Federal Aviation Administration, February, 1978.
[96] M. W. G. a. L. B. Gamon, “KRASH85 User's Guide- Input/Output Format,” May 1985.
[97] J. C. C. F. K. a. C. B. Perschbacher, “Advanced Composite Airframe Program (ACAP) Militarization Test and Evaluation (MT&E) Volume V – Airframe Drop Test,” US Army Aviation Applied Technology Directorate, Ft. Eusitis, VA, March 1996.
[98] S. J. K. E. a. L. J. D. Kellas, “Full Scale Crash Test of a MD-500 Helicopter with Deployable Energy Absorbers,” Phoenix, AZ, May 11-13, 2010.
[99] M. S. a. P. M. A. Annett, “System-Integrated Finite Element Analysis of a Full-Scale Helicopter Crash Test with Deployable Energy Absorbers,” Phoenix, AZ, May 11-13, 2010.
[100] M. S. Annett, “LS-DYNA Analysis of a Full-Scale Helicopter Crash Test,” Dearborn, MI, June 6-8, 2010.
[101] M. a. H. L. G. Annett, “Comparison of Test and Finite Element Analysis for Two Full-Scale Helicopter Crash Tests,” Denver, CO, April 4-7, 2011.
[102] L. J. D., “Full Scale Crash Test of an MD-500 Helicopter,” Virginia Beach, VA, May, 2011.
[103] J. D. Littell, “A Comparative Analysis of Two Full-Scale MD-500 Helicopter Crash Tests,” Uncasville, Connecticut, June 13 - 16, 2011.
[104] T. a. S. M. Khalil, “Vehicle Crashworthiness and Occupant Protection in Frontal

Full Spectrum Crashworthiness Criteria October 2011 Page 161
Impact by FE Analysis – An Integrated Approach,” 1997.
[105] C. M. D. B. G. T. a. B. N. E. Kan, “Crashworthiness Evaluation using Integrated Vehicle and Occupant Finite Element Models,” vol. 6, no. 3, pp. 387-397, 2001.
[106] M. a. L. J. D. Polanco, “Vertical Drop Testing and Simulation of Anthropomorphic Test Devices,” Virginia Beach, VA, May 3-5, 2011.
[107] European Organization for CivilAviation Electronics, “Minimum Operational PerformanceSpecification for Crash Protected Airborne Recorder Systems,” EUROCAE, March, 2003.