full report the cost of homelessness services in london · 3 homelessness expenditure and income in...
TRANSCRIPT

The Cost of Homelessness Services in London
An LSE London project for London Councils
Full report
Authors: Kath Scanlon and Christine Whiteheadwith Annie Edge and Chihiro Udagawa

1
Table of contents Executive summary 2 1 Introduction 6 2 Research questions and methodology 7 3 Homelessness expenditure and income in London 8 4 What the HRA was expected to change 10 5 Official data sources: challenges of monitoring 11 6 Borough experience with the HRA 14 7 Improving forecasts of borough homelessness expenditure 25 8 Discussion and conclusions 31 References 34 Annex A: MHCLG’s new burdens assessment and the LSE
London model 35
Annex B: Data tables 49 Annex C: Case studies of innovative practice 52

2
Executive Summary
Core findings
In 2017/18, London local authorities spent over £900 million assessing, assisting and accommodating homeless households. Some £200 million of this money came from their own general funds (i.e. costs not met from specific central government homelessness grant funding or from income received – such as from rental payments).
As intended, the Homelessness Reduction Act (HRA) has increased the number of households approaching boroughs for assistance since its introduction in April 2018. In the first year of the HRA, around 55,000 households were assessed by a London borough homelessness service as compared to an average of under 30,000 per annum over the previous ten years.
Looking forward, our estimates suggest that on the most likely (central) scenario, the call on boroughs’ general funds will rise from £201 million in 2017/18 to £237 million in 2022/23, in real terms. From the year preceding the HRA’s introduction to 2022/23, London boroughs will spend an extra £80 million as a result of anticipated increases in homelessness and the costs of managing these services.
While this increase in homelessness and its associated costs has wider drivers than solely the HRA, to date the government has only provided some £30 million for managing the new duties specifically resulting from the Act—leaving boroughs to find £50 million from their own resources over the period to 2022/23.
This analysis highlights that government’s calculations used in the HRA new burdens assessment severely understated the costs of new duties in London. This is because MHCLG used countrywide unit cost estimates rather than London-specific figures, and assumed better prevention would effectively reduce numbers accepted as homeless without taking account of wider housing-market conditions in the capital and the impact of factors such as welfare reform.
Our calculations suggest that the unit cost of handling a homelessness case in London is more than twice as much as in England as a whole. This report finds that the cost of managing a homelessness acceptance – the most expensive type of case – is over £9,500 per case in London, compared to MHCLG’s nationwide estimate of £4,200. For homelessness prevention and relief cases, the true cost to boroughs is almost five times the MHCLG estimate used in the new burdens assessment; more than £2,500 per case in London compared to the £530 estimate used by MHCLG. This report highlights the higher costs of homelessness provision in London and the extent to which these costs were underestimated in the MHCLG new burdens assessment.
This review also suggest that the government may have underestimated the number of homelessness acceptances in the capital over the first five years of the HRA by around 50%.
Detailed findings
Changes in expenditure: Interviewees agreed that the HRA had led to changes in the amount and distribution of local-authority expenditure on homelessness but said it was far from the only driver. Successive restrictions on welfare payments (especially housing benefit) and the very high cost of private housing in London both also contribute. Some interviewees said central government now recognised the financial impact on local authorities, but that the additional funding provided (e.g. the new burdens money) was often time-limited, meaning they could not plan strategically.

3
Availability of temporary accommodation (TA): Interviewees said it was a constant—often daily—struggle to find enough accommodation for households needing TA. Many boroughs placed almost all such households in private accommodation including hostels, bed and breakfast (B&Bs) and private rented sector (PRS) units often leased by the boroughs. Over 40% of family households accepted in London are now placed outside their own borough. Across London there is huge variation in the amount of local-authority housing boroughs have available and in their criteria for allocating it. Some boroughs have themselves become private landlords so they can accommodate more households in their own (non-social) stock.
Numbers coming forward: The HRA was expected (and intended) to increase the numbers of households presenting as homeless and the early H-CLIC statistics confirm that this has occurred; the number of prevention and relief cases in particular grew strongly. However, the magnitude of the change has varied widely across London and in some areas was below expectations. Some authorities said the new people coming forward often had additional needs – involving higher costs. On the other hand, some were given Personal Housing Plans but never returned for further assistance. The new duty to refer has increased the number of households that boroughs are required to assess, but agencies often provide little information about potential claimants, while some refer them to more than one borough.
Working Practices: The HRA has changed working practices across the sector. Many of these changes have been positive, and London boroughs support the intentions behind the HRA in terms of the quality and scope of service provided. However, they are concerned about the administrative burden imposed, particularly as a result of the introduction of the new H-CLIC data system.
Staffing: Post-HRA, many boroughs have employed significant numbers of additional staff, often using costly agency workers partly because it is all they can find and partly because the temporary nature of funding streams makes it risky to hire permanent employees. We heard that experienced staff were leaving—some poached by other authorities; others disillusioned by the changing, more administrative, nature of their work.
Data quality: Official data on both income and expenditure on homelessness are reported in very different ways across boroughs and are therefore inconsistent. Our own data-collection exercise found that costs, income and grants were all under-reported. The new, comprehensive data-collection system brought in with the HRA may eventually provide better information but interviewees said it was introduced too quickly; that it increased workloads, and therefore costs, significantly; and that its design showed little regard for the working practices of relevant staff.
Longer term outlook
The government conceded that the HRA would cost local authorities more in the short- to medium-term but contended that in the long term (and indeed after three years) it will save them money, as fewer households will be accepted as homeless and have to be housed in temporary accommodation. The government also assumed that the cost of prevention was relatively small compared to the cost of acceptances. Our analysis suggests that these views are too optimistic, at least in the capital.
A year on from the implementation of the Act, our interviewees said a long term cost-neutral outcome was highly unlikely. Some (mainly in outer London) did expect numbers in TA to decline but none expected the overall cost of homelessness provision to fall. Many said it was hard to foresee a fall in the number of households in TA because of increasing pressures in the housing market. The government’s assumptions, they said, took no account

4
of boroughs’ increasing difficulties in moving households out of TA into suitable secure accommodation.
Turning to our quantitative analysis, the, conservatively estimated central scenario suggests that in London, net costs will not fall to zero after three years. Rather they will remain at a higher and slowly increasing level as compared to the hypothetical, non-HRA situation. The factors behind the increased costs include the higher number of cases presenting (an explicit intention of the Act); more involved administrative procedures (preparation of Personal Housing Plans, use of the H-CLIC monitoring system, and handling referrals from other agencies) and increased responsibilities for prevention and relief to a wider range of households, as well as housing market factors which make it increasingly difficult to move households on into secure tenancies.
Our calculations suggest that the cost of providing homelessness services in London will continue to rise, and that the costs met by borough general funds in particular will rise from £201 million in 2017/18 and to £226 million in 2020/21 (the period covered by the upcoming, short term spending round). Costs will continue to increase thereafter to around £237m by 2022/23. The proportion of homelessness costs met through boroughs’ general funds will increase from 21.8% in 2017/18 to 23.1% in 2022/23.
The goal of the HRA is to enable more people to stay in their homes rather than becoming homeless in the first place. If this goal can be achieved, the wellbeing of many thousands of households will be improved. However, in London’s extremely tight housing market, the policy is highly unlikely to be cost neutral in terms of either the resources used for prevention and relief; or the costs of helping those who are accepted as homeless.
The research
The objectives of the research were (i) to provide as good an estimate as possible of the costs of delivering homelessness services in London in a post-HRA landscape and (ii) to examine how these costs might evolve over the first five years of its implementation and into the next Spending Review period. We also looked at the experience of London boroughs’ homelessness services following the introduction of the Act and Flexible Homelessness Support Grant (and in light of wider market and related policy pressures), and highlighted a range of innovative responses being developed by boroughs to tackle homelessness more broadly.
The research approach is explained in more detail in section two; involving a mixed-methods approach that included:
• a desk-based review of recent literature and statistics related to homelessnessprovision,
• qualitative research (including interviews with informed stakeholders such asborough housing directors and advocacy groups),
• a questionnaire of London borough housing directors on changes in service demandand structure, and
• a financial data survey developed jointly with the Society of London Treasurers.
The research methodology enabled the creation of a model for estimating the cost to boroughs over the next four years of providing homelessness services, including temporary accommodation, in the wake of the HRA and other policy changes, such as welfare reform.

5

6
1 Introduction National governments have long turned to local authorities to prevent, reduce and relieve homelessness. There is a large and frequently changing body of legislation and guidance that governs local authorities’ responsibilities in this area. From April 2018, the Homelessness Reduction Act (HRA) requires local authorities to provide advice and support to anyone at risk of being homeless within 56 days (rather than the previous 28)—even if they have no responsibility to house them.
London boroughs have welcomed the intentions behind this change, which enables more households to get help from their local authority and to address issues at an earlier stage. But the new duties have added to the pressures on authorities in the capital. Boroughs are experiencing high demand for homelessness services, but their options are constrained. They can almost never place homeless people immediately into long term secure housing because they have little or no available social housing and relatively few of London’s private rented sector (PRS) homes rent for below the current Local Housing Allowance (LHA) cap (the maximum rent for which housing benefit/UC is available – now well below the 30th percentile of local rents) – so most of those leaving temporary accommodation must make a significant contribution to their rent after benefits.
Boroughs must accommodate statutorily homeless households, but the legal constraints within which they operate mean that rather than finding them long term homes they have no choice but to place them in costly temporary accommodation. Financially, authorities have little room for manoeuvre as they have almost no independent taxation capacity. Central government controls both sides of the equation: they set the rules for what services must be provided, and they control the funding arrangements. On their own, local authorities cannot change the way the system operates; they must convince central government of the need for reform.
The Homelessness Reduction Act, which was broadly welcomed and indeed reflected what many authorities in London were already doing, was accompanied by additional ‘new burdens’ funding of £73 million over three years for England as a whole, of which London authorities received just under £30.2 million (42%). However, councils argue that this amount did not cover the cost of the additional work involved, and often went to pay more general increases in homelessness costs.
Benefit and welfare reforms have combined to increase pressure on low-income tenants and make it harder for local authorities in high-cost areas to find suitable housing for homeless households. Relevant changes include
• the introduction of Universal Credit,• the freeze of LHA at 2016 levels, which does not allow for increases in PRS rents
and other living costs,• the 2013 introduction of the spare room subsidy tax (aka bedroom tax) for housing-
benefit recipients renting housing association or council homes,• the welfare cap, which particularly hits larger households, and• the limit of benefit for single under-35s to shared accommodation rate even if they
are not sharing.
In late 2018 London Councils and the London Housing Directors’ Group together commissioned LSE London to carry out research into funding requirements to sustain London borough homelessness services following the introduction of the HRA and in light of a changing funding, welfare and market environment. We also looked at how boroughs are

7
approaching these challenges, with five case studies of best practice. The results will be used to inform London Councils policy and to inform discussions with central government in the context of the forthcoming Spending Review.
2 Research questions and methodology The research questions were:
• How has the HRA, together with recent changes to the provision ofhomelessness grant funding (e.g. the introduction of Flexible HomelessnessSupport Grant) and the welfare system, affected London borough expenditure onhomelessness services?
• What level of funding do borough homelessness services require over the courseof the forthcoming Spending Review period?
• What innovative approaches have boroughs taken to improve homelessnessservices and address financial pressures?
We used a mixed-methods approach with the following elements:
1. Desk review of recent literature on homelessness provision from think tanks,advocacy groups and academic sources, and of recent legislation affectinghomelessness. Collection of available statistics on homelessness cases, on local-authority expenditure and grant income on homelessness services, and on private-sector rents and LHA rates.
2. Qualitative research including semi-structured interviews with informed stakeholders.Short case studies of five boroughs that have used innovative approaches in theirhomelessness services, involving on-site observation and interviews.
3. Online questionnaire for London borough housing directors, asking how manymembers of staff worked on homelessness services, how the HRA and other recentpolicy changes had affected their service, and how various sources of grant incomewere used.
4. Online survey of London borough finance directors to compile a consistent set ofdata about expenditure on, and income related to, homelessness services. This wasnot part of the original research design, but we felt it was necessary given theshortcomings of the existing data.
5. Creation of a model for estimating the cost to boroughs over the next four years ofproviding homelessness services, including temporary accommodation, in the wakeof the HRA and welfare changes. Our estimation method was based on that used byMHCLG in the run-up to the HRA. Our estimated future costs are compared tocounterfactual costs –i.e. compared to costs as they would have been if the HRA hadnot been introduced. The difference between the two figures represents theadditional costs arising from these changes.

8
Throughout the project we consulted with London borough directors of housing and finance, and officers responsible for homelessness services, at a series of round tables and meetings.
3 Homelessness expenditure and income in London
From April to December 2018, the first three quarters after the introduction of the Homelessness Reduction Act, some 41,700 households were assessed by London local authorities under homelessness legislation; the full-year figure will likely be around 55,000. This compares to an average of 28,500 decisions per annum in the preceding 10 years. (Figure 1). This step-change indicates that the HRA has had the desired effect of increasing the number of households approaching local authorities for help by a very significant amount.
Figure 1: Total homelessness decisions in London, 2008/09 to 2018/19
Source: MHCLG Table 784 and MHCLG Initial Assessments table *2018/19 figure: LSE London estimate based on data first three quarters
According to government statistics, in 2017/18, the most recent year for which figures are available and the last before the HRA, London local authorities spent a total of more than £900 million on homelessness services including temporary accommodation (Table 1). (The figure does not include capital expenditure such as the purchase or construction of housing.) Temporary accommodation accounted for about 80% of expenditure overall. Most of this was recovered through income from rent payments (from housing benefit and from residents themselves) and, to a lesser degree, government grant, leaving £253 million in net current expenditure from boroughs’ general funds according to the MHCLG Revenue Outturn data.1
1 LSE London analysis of MHCLG Revenue Outturn data on housing services (RO4)
0
10000
20000
30000
40000
50000
60000
2008-09 2009-10 2010-11 2011-12 2012-13 2013-14 2014-15 2015-16 2016-17 2017-18 2018/19
Total decisions

9
Table 1: Government figures for London borough expenditure on homelessness, 2017/18
(£ millions) Temporary accommodation Other homelessness Total
Expenditure 757 158 915 Income (from grants, rent etc) 612 50 662 Net current expenditure 145 108 253
Source: LSE London analysis of MHCLG Revenue Outturn data on housing services (RO4)
Since 2013-14, local authorities have funded expenditure on homelessness from three main sources: council tax, retained business rates, and grant funding (including ringfenced and non-ringfenced grants). The level of business rates the government expects each local authority to keep for itself (after some equalisation through a system of tariffs and top-ups) is called the Baseline Funding Level (BFL). The main non-ringfenced grant is called Revenue Support Grant (RSG). These two components (BFL and RSG) together comprise the Settlement Funding Assessment (SFA). While SFA overall is not ring-fenced (i.e. local authorities are free to use it as they see fit), the government maintains that it includes notional funding for homelessness prevention of around £80m (out of a total of £14.6bn across England) in 2019-20. London boroughs’ share of this notional funding is £35m. However, as SFA is technically not ringfenced, the government does not take a view on what authorities ‘should’ contribute to their homelessness service, or indeed how much should come from council tax or other general funding.
The government plans to reform the finance system in 2021-22, by increasing the level of business rates retention from 50% to 75%, removing RSG completely and resetting the funding formula to determine new Baseline Funding Levels. The recent government consultation on these changes makes clear that local authorities are expected to meet most of the costs of homelessness services from a combination of their own resources including retained business rates. The document says:
Nationally, the average proportion of lower tier authorities' net current service expenditure that related to homelessness in this year was less than 5%. However, for some outlying authorities the proportion of expenditure was higher, and in the case of eight authorities accounted for more than 10% of expenditure.
On the basis that homelessness on average represents a relatively small proportion of net expenditure for the majority of councils and the fact that there is no separate funding formula for homelessness in the current methodology, the Government believes that it would be disproportionate to introduce further complexity into the needs assessment for this service area. As a result, the Government is minded to account for homelessness within the Foundation Formula (MHCLG 2018b, p 36).
Thus the main current source of core funding from central government to local authorities (SFA) only has a small notional element for homelessness services and the latest proposals for its replacement suggest the government is not minded to include any specific recognition of the costs of homelessness from 2021-22.

10
While local authorities are expected to meet most of the costs of homelessness out of their general funds, there are two specific additional grants to help cover the cost of homelessness provision2; in 2017/18 these totalled £128.6 million for London (Table 2), or 14% of boroughs’ gross expenditure on the service. While not specifically a homelessness grant, some authorities also use Discretionary Housing Payments as a homelessness prevention tool.
Table 2: Homelessness grant funding for London boroughs, 2017/18 – 2019/20 (£ millions)
Flexible Homelessness Support Grant
HRA new burdens funding
2017/18 117.8 10.8 2018/19 110.9 9.9 2019/20 103.8 9.4
Source: LSE London analysis of MHCLG announcements of grant allocations
4 What the Homelessness Reduction Act was expected to change3
The Homelessness Reduction Act (HRA) 2017, which came into force in April 2018, was intended to effect three major changes in the way local authorities dealt with homelessness: first, to require them to intervene at an earlier stage to prevent homelessness; second, to extend support to more types of household; and third, to improve the quality of information given to homeless households. The expectation was that households would be better supported to remain in their existing homes or find suitable new ones before ever becoming homeless, thus improving outcomes for the households involved and, eventually, reducing costs for local authorities.
Pre-HRA, authorities had to assist eligible households who were threatened with homelessness within the next 28 days. Under the HRA this period is expanded to 56 days and the duty now applies to all household types. Authorities are required to take steps to enable households to remain in their current accommodation or to secure suitable alternative accommodation.
Before the HRA came into effect, basically only local households with children (or other vulnerable members defined as being in ‘priority need’) who were deemed to have become homeless through no fault of their own were likely to be entitled to accommodation from their local authority. Other types of household, including single people and childless couples, were entitled to advice but not to other types of help, although some local authorities chose to provide it. The HRA widened the duties of local authorities, who are now required to provide certain types of advice and support (but not necessarily accommodation) to all homeless individuals or households.
One criticism of the previous system was that homeless households did not always receive good or consistent advice about their options. The HRA now requires local authorities to
2 There are also grants specific to rough sleeping, which is not covered here. 3 This section summarises the most relevant elements of the changes; LGIU (2018) provides a fuller treatment of the details of the legislation and how local authorities are affected.

11
provide each household with a Personal Housing Plan at their first meeting. The PHP sets out their housing options and the steps that the applicant and the local authority should undertake to resolve the situation. MHCLG recognised that the provisions of the Act would place new requirements on local authorities, and that these would entail additional costs in the short- to medium-term. Under the new burdens principle, central government gives financial compensation to local authorities who are required to perform new or changed activities, to offset the additional cost involved. The MHCLG’s new burdens assessment for the HRA (DCLG 2017a) gives the government’s calculations as to the overall impact of the HRA on local authorities in England. These calculations are discussed in more detail below. The expectation incorporated in the spending model was that increased prevention activity would be offset by enough of a decline in costly main-duty acceptances, that additional costs would fall to zero by Year 3. The official new burdens estimate was that English local authorities would have to spend an additional £72.7 million over three years, above what they otherwise would have spent, in order to perform their additional duties under the HRA. This amount was distributed to English local authorities, with London boroughs receiving some £30.2 million, or 42% of the total (well below London’s proportion of households presenting as homeless or of those accepted as being owed a main duty). The funds were distributed over three years in declining tranches, with the first tranche coming in 2017/18 in order to allow authorities to prepare for the HRA (Table 2). The final tranche will be received in 2019/20.
5 Official data sources: challenges of monitoring There are two main official sources of information about the number of homelessness cases and the cost to local authorities of providing homelessness services. Both are published by MHCLG and are based on data provided by local authorities to central government. Figures about how many households approached local authorities, how their cases were classified, and what actions were taken to help them (including provision of temporary accommodation) were until 2018 based on the P1E form. Local authorities were required to provide aggregate figures quarterly. In April 2018 the P1E was replaced by Homelessness Case-Level Information Classification (H-CLIC, see below), an information system designed to produce more granular, case-level data. Local authorities’ projected and actual expenditure on homelessness services appears in MHCLG’s Revenue Account and Revenue Outturn statistics respectively. These are based on returns from local authority finance departments and cover all local authority activities. Within the Revenue Outturn statistics (hereafter RO), expenditure on homelessness is a subdivision of housing services, and is further divided into four major categories:
• Temporary accommodation (generally the largest category of expenditure, at least in London)
• Homelessness administration • Homelessness prevention • Support

12
The underlying data are reported by local authority finance divisions, who follow guidance about what should be included in each category; the official guidance is based on CIPFA’s Service Reporting Code of Practice (SERCOP), the ‘bible’ of local authority accounting practice. In principle, then, the data should allow for comparison across local authorities, and for aggregation at regional and national levels. When looking at the most recent figures for London boroughs, we found that the data were not reported consistently. For 2017/18, some boroughs report nil gross expenditure on TA, homelessness administration, prevention and/or support. For those that did report expenditure, the ratio of expenditure between the highest- and lowest-spending borough on some activities was as high as 6000:1. A few authorities even reported negative gross expenditure under some headings. Overall expenditure on homelessness
Because of our concerns about the accuracy of these data, we decided to cross-check the information by asking boroughs to provide new figures on a consistent basis. The SLT, made up of the finance directors of London boroughs, generously offered to conduct its own data-collection exercise around homelessness expenditure and to share the results with us. A small working group of local-authority finance professionals and LSE academics designed a spreadsheet to collect consistent information broken down by type of expenditure rather than (as the RO data) by case type. It asked for budgeted and actual revenue expenditure on temporary accommodation and homelessness, broken down by type of expenditure:
• Employees • Other operating costs • Rents • Bad debts
And by budget source within the local authority:
• From the General Fund • From the Housing Revenue Account
It also asked for information about income from rents and government grants, and about capital expenditure on homelessness provision. The survey was distributed to all borough treasurers in March 2019, and by late April achieved a 100% response rate, which in our experience is unprecedented for an exercise of this type. The total amount that London boroughs reported spending on homelessness in 2017/18 on the SLT survey appears in Table 3, together with the corresponding numbers from Revenue Outturn statistics. Some 17 of the 33 London local authorities attributed income from their Housing Revenue Accounts to homelessness but these contributions were relatively minor, accounting for less than 2% of homelessness-related income. Comparing the two sets of figures, the SLT returns indicate that London borough are spending more on homelessness than the RO statistics suggest but are also receiving more in income and grant. These differences merit further investigation and MHCLG has commissioned a piece of work looking at the design of the Revenue Outturn form for homelessness.

13
Table 3: Actual general-fund homelessness expenditure by London boroughs 2017/18 Revenue Outturn (RO) vs Society of London Treasurers (SLT) survey
(£ millions)
RO4 Society of London Treasurers
Expenditure TA 757 730
Non-TA 158 189
Income TA -612 -615
Non-TA -50 -104
Net expenditure 253 201
Source: LSE London comparison of Society of London Treasurers/LSE survey and Revenue Outturn statistics H-CLIC The HRA coincided with the introduction of a new data-collection system called H-CLIC, which replaced the existing system for collecting local-authority-level data around homelessness. In contrast with the previous P1E form, which reported only aggregate data, H-CLIC is meant to produce granular information that will make it possible to track the progress of individual households through the system and permit more sophisticated analysis of trends and expenditure (DCLG 2017c). The system is designed to be used by housing officers to capture a range of information about the characteristics of households presenting as homeless, their circumstances and housing need, and the authority’s responses. One academic we interviewed said that compared to its very basic predecessor, H-CLIC was ‘the Rolls Royce of data collection’ (the data specification in MHCLG 2019 runs to 139 pages). Data collection is expected to take place in real time, with housing officers entering information using a computer or laptop, although some authorities have chosen to separate the data-entry function. The H-CLIC system has ten sections, each of which contains several subcategories of information4. The number of sections that must be completed depends on what stage the case has reached and is a minimum of three.
4 Per MHCLG 2018, the ten H-CLIC sections are:
1. Main – information on the applicant and details of the homelessness application for the household. 2. People – the characteristics of each household member. 3. Support – any support needs in the household. 4. Prevention – activity if the Prevention Duty is owed. 5. Relief – activity if the Relief Duty is owed. 6. Decision – activity if the case proceeds to an assessment for a final homelessness duty, (the
section 193(2) duty, the section 193C(4) duty, or the section 195A(1) duty). 7. Final duties – activity if the case was assessed as owed a final homelessness duty. 8. Assistance – assistance with support needs received by the household. 9. Temporary accommodation – provision of temporary accommodation and/or if a temporary
accommodation duty is owed. 10. Reviews – any reviews requested of decisions made by the local authority.

14
In preparation for H-CLIC, many local authorities invested in upgrading their IT facilities and buying dedicated H-CLIC software, which was supplied by a range of private firms rather than by central government. MHCLG made available funding of £3 million nationally to finance the required investment. The funds were distributed equally amongst the 326 local authorities concerned, with each receiving about £9,000. In principle H-CLIC (which was based on a similar data-improvement exercise in Scotland) should provide much richer and more detailed information about the progress of individual households through the system. This type of analysis was impossible to do previously. The new system also captures information about all households presenting to the local authority rather than focusing as before on those who were statutorily homeless. However local authorities say the new system, which required a step change in procedure, was introduced too quickly and with too many changes in specification, and that its design showed little regard for the working practices of the staff who would be expected to use it. Some authorities have taken on additional staff specifically to complete the H-CLIC forms. Users reported teething problems after H-CLIC was introduced, and several told us that they would have little confidence in the statistics produced for the first few months. A report from the Local Government Association on the implementation of the HRA says:
The most significant challenge for councils in the implementation of the Act – both prior to implementation and six months on – is H-CLIC. For 40 per cent of respondents, it presents “significant” issues relating to the lateness of the guidance and subsequent changes to reporting requirements, problems entering data into the system, and the amount of time needed to provide the required information (LGA 2019, p. 5).
6 Borough experience with the HRA We conducted interviews with local-authority housing and finance officers and with other experts including academics, consultants and advocacy groups. The conversations were structured around interview pro-formae, which served as discussion guides. We also conducted a round table with borough housing directors, a focus group with finance directors, and presented emerging findings to various meetings of local-authority housing officers. To enable the interviewees and participants to respond frankly, we have not identified individuals or local authorities. The context: market conditions and welfare changes All the interviewees agreed that the HRA had led to changes in the amount and distribution of local-authority expenditure on homelessness, but emphasised that the HRA was far from the only driver. There was broad agreement about the main contextual factors. Changes in the housing market meant that the housing situations of many low-income renting households had become more precarious. London’s strong economy and shifting tenure trends had exacerbated the city’s already tight rental market, pushing up private rents across the board and limiting the numbers where the rent falls below the LHA cap. Households who were on the edge financially might not be able to pay an increased rent, nor could they necessarily find affordable alternative accommodation in the same area. They therefore could end up becoming homeless. Some landlords had deliberately chosen to

15
move upmarket, refurbishing their units to appeal to higher-income tenants or indeed to let through Airbnb. The rental market had strengthened across the whole capital but there were some hotspots (e.g., Stratford or Hackney in the wake of the Olympics) that had experienced really fundamental change over a relatively short period of time in what one interviewee called ‘the Shoreditch effect’. In addition, changes in the structure of welfare benefits (Universal Credit and LHA in particular) made benefit-dependent tenants less appealing to landlords. Some landlords are prevented by their insurance companies and/or lenders from renting to benefit recipients. Over 90% of private tenants on benefit – including those on full HB – are now paying some of their rent themselves (Joyce et al 2017). The overall result has been increased difficulty in finding affordable accommodation and a large increase over the last decade in the proportion of households presenting as homeless because they had been evicted by private landlords. The ability of landlords in England to carry out ‘no-fault’ Section 21 evictions meant no PRS tenancy could be regarded as entirely secure.
In the old days we were dealing mainly with the vulnerable. Now it’s far more about affordability rather than vulnerability.
Outer London housing director
The night shelters are starting to see a real change in the clientele – there are more people with complex needs and because of the numbers you may have a middle-aged middle-class person who has lost his job (sleeping) next to someone with drug/alcohol addiction.
Inner London housing director The tight housing market also affects local authorities’ ability to secure temporary accommodation and to carry out successful prevention work. While some parts of the TA stock such as hostels sit outside the mainstream market, many units could be used either as temporary accommodation or as conventional rented housing. Boroughs’ legal duties to accommodate homeless households meant they often faced a difficult choice between two unattractive alternatives: either paying very high rents or nightly rates locally or securing accommodation some distance away (often disruptive for tenants). Almost all London boroughs have a shortfall of local, affordable accommodation for prevention or TA. Many choose to procure housing in other local authorities. Over 40% of family households accepted in London are now placed outside their borough. The majority of these placements (77% in Q3 2018/19) are within their sub-region and about 92% on average are within London, according to figures collected through the Inter-Borough Accommodation Agreement (IBAA) system. Even so, some households are placed outside the capital and increasingly boroughs are looking beyond south east England. These out-of-area placements often compete with the local authority responsible for that area and/or with other authorities with the same shopping list so they in turn have to look further afield. Collectively the boroughs have taken steps to reduce competition, work collaboratively and limit costs. Recent initiatives include the IBAA, which aims to prevent bidding wars between boroughs for properties (London Councils 2011) and Capital Letters, a not-for-profit organisation that will procure accommodation on behalf of its (currently thirteen) member boroughs, again with the aim of reducing competition between councils.

16
Profile of TA We heard that the mix of types of accommodation used varied enormously across London, depending on local market conditions in the PRS, on the amount and nature of the borough’s own housing stock (boroughs with a larger council stock have more options) and on political decisions taken by elected councillors. Policy changes in other areas also constrain boroughs’ choices: cuts in local housing allowance (LHA) rates and the long term decline in the social housing stock have both made it more difficult to accommodate people locally, especially in high-cost areas. Interviewees said it was a constant—often daily—struggle to find enough accommodation for households needing TA. Many boroughs placed almost all households requiring TA in private accommodation of some kind. Bed-and-breakfasts (B&Bs) are privately run and have shared facilities, and boroughs are allowed to place households with children in them for up to six weeks. Boroughs have varying numbers of leases for self-contained private dwellings that can be used for TA, but we heard that it is becoming harder to agree long term contracts. Some landlords are happy to let their properties to a local authority for use as TA in return for a hassle-free income, but a growing subset of landlords realise they can earn much more by renting accommodation at nightly TA rates rather than longer term leases which is driving up overall costs. Boroughs offer a variety of incentives to encourage private landlords to work with them but often find themselves in competition with other London authorities who are looking in the same market. Boroughs also use properties they own, either within the Housing Revenue Account or the general fund, for TA. Such properties include hostels, some of which are specifically for families. Those boroughs that have them (not all do) may also use council homes that are scheduled for demolition as part of estate regeneration schemes. (One inner London borough told us they had even accommodated people in offices on such estates.) Regeneration schemes can take many years to complete, and in the interim this ‘short-life housing’ can accommodate families without overcrowding. However, at some point the programmes would be complete and this source of TA would dry up often with knock-on impacts on those on the waiting list. Because of the financial pressure that TA exercises on the councils, and the personal and social stress occasioned for residents, many authorities are experimenting with innovative approaches; five of these are described in Annex C. These include erecting modular ‘meanwhile’ housing on council-owned land (see Case Study 1, about Lewisham). Another increasingly common approach is for boroughs to buy existing dwellings, either within the borough or elsewhere (see Case Study 5, about Enfield and Islington). They may buy the homes to use as TA or as settled accommodation (discussed below). Boroughs reported bulk buys from developers, purchases of street properties, and joint purchases with RSLs. Our roundtable participants expressed concern that government was considering capping the amount of Right to Buy receipts that local authorities could spend on such purchases; this would reduce boroughs’ ability to use this avenue.
(Our authority) has bought about 250 properties in the last 18 months including some ex-council properties in the borough and even some in other boroughs. This allows it to make savings on nightly-paid accommodation. Eventually it could even look outside London.
Inner London borough

17
Importance of local decisions Although many aspects of homelessness service provision are tightly prescribed by central government, others are left entirely to the discretion of the local authority. The political decisions of elected councillors inevitably condition borough homelessness expenditure. These include policies not only about whether homeless households requiring TA will be accommodated within the local-authority boundaries but also about allocation systems for the limited amount of available local-authority housing (waiting list or homeless first?) and the use of regeneration stock. As a matter of policy, some London boroughs aim to accommodate all statutorily homeless households in-borough as far as is possible, although no borough has been able to entirely do this given local housing pressures. This is an entirely legitimate political decision but one that has significant cost implications: LHA is often not enough to cover TA rents in central/inner London, so the borough must make up the difference if (as is usually the case) the tenant cannot. Other boroughs have different policies — some will place households in neighbouring local authorities but not further afield (around two-thirds of placements are typically in a borough’s sub-region); some will place them anywhere in greater London; some will occasionally go well beyond London. About 7-8% of all London placements are outside the capital; these are primarily made by boroughs on the edges of London. They most commonly look to neighbouring areas with relatively short journey times (e.g., Harlow, Slough, Maidenhead), especially if the household has children in London schools5, but in some cases boroughs will look as far as Newcastle (though only if the move is acceptable to the household concerned). Sending authorities must notify receiving authorities when making a placement. The receiving authorities may oppose these out-of-area placements but cannot legally stop them. Boroughs also differ hugely in the amount of local authority housing they have and in the criteria they use for allocating it. Southwark for example owns 38,490 council homes, while Richmond owns none, having transferred them all in 2000 to a newly created housing association. By law homeless people must be given ‘reasonable preference’ for social housing, but there is no definition of what that means. Some authorities prioritise homeless households in TA when vacancies arise in the council stock, while in other boroughs such households may have almost no realistic chance of moving into council housing. These factors can have a knock-on effect on homelessness expenditure because many homeless households strongly prefer to move on to a social tenancy — and preferably a council tenancy. Use of the PRS as settled housing A council can ‘discharge’ its homelessness duty by offering a household a secure social tenancy or (since the 2011 Localism Act) a twelve-month PRS tenancy. Boroughs have different policies (not necessarily along clear political lines) about whether they will ask
5 In line with the ‘Westminster case’ (Nzolameso v City of Westminster [2015] UKSC 22), where the Supreme Court ruled that by placing a mother and five minor children in TA in Bletchley rather than in a closer authority, Westminster Council had not taken sufficient account of the children’s education or of the mother’s medical needs.

18
statutorily homeless households to accept settled housing in the private rented sector: although it is legally permissible, many councils do not do so. Their view is that private rented accommodation is likely to be unsuitable in the long term because of the rent level, insecurity of tenure, the condition of the property, and/or because it is out of area. Some interviewees said so-called Private Rented Sector Offers (PRSOs) were often effectively setting tenants up to fail because they would not be able to afford the rent payments, as market rents were well in excess of LHA levels (one outer London interviewee said much of the PRS in their area rented for ‘50% to 100% more than LHA’) — and they would end up presenting again as homeless. Others by contrast felt PRS offers were the only hope for households to get a settled home, and out-of-borough offers meant they could live in cheaper, more affordable areas.
Realistically, only if they get a PRS offer for a household will they be able to move out of TA.
Inner London housing director Several boroughs told us about how they had tweaked their allocations criteria to incentivise households to consider accepting PRSOs.
If people work with us and take a PRS offer despite it being suboptimal, we will keep them on the housing register.
Housing department officers, London borough
Homeless households who accept a PRS offer within the borough can continue to bid for social housing although they would be low on the list. (Our politicians) are discussing whether to allow those in the PRS outside the borough to stay on the list for up to say three years.
Outer London housing director Although there is a range of practice, many authorities said they were moving, sometimes reluctantly, to greater use of the PRS, especially for relief. Given the gap between market rents and what (prospective) tenants were able to pay given the reduction and then freeze in LHA rates, the boroughs often provided financial support packages which might for instance include help with some or all of the deposit or paying some of the rent up front. Several authorities said they paid landlords financial incentives to accept tenants; one reported paying up to £4,000/year per property. PRSOs also often entail ongoing costs: landlords may request further incentives in the course of the tenancy, and the authority may incur tenancy sustainment support costs. While such a package was not cheap it was recognised that it was more cost-effective than putting (or keeping) a household in temporary accommodation. Most boroughs have a group of landlords with whom they work regularly: one borough said they worked with about 50, while for another it was 400. The subset of landlords that specialise in TA are well informed about their niche market, and we heard that they can often play the boroughs off against one another, knowing the pressures that authorities are under to place households. Boroughs have sought to contain price escalation through adopted measures such as the IBAA. Securing PRS stock was generally becoming more difficult. Local authorities told us that some private landlords were pulling out of this part of the market, either because they were

19
selling up entirely or because they had decided to target higher-income tenants or to move to AirBnB. This was seen as a reaction to recent changes in the regulatory and legal framework for landlords, including increases in HMO enforcement, changes in the tax treatment of mortgage interest and, most recently, the consultation on abolishing S21 no-fault evictions. One inner London borough had surveyed the private landlords with which it works; some 90% of those responding said they would stop working with the council if S21 were abolished. London local authorities are also themselves becoming private landlords. While many boroughs lease PRS properties to use as TA, they cannot legally discharge a homeless household through a Private Rented Sector Offer (PRSO) into such a home. However, if they purchase the dwellings — perhaps through a council-owned company or the council’s pension fund — they are able to do so.
[One outer London borough] for example has been buying up properties outside London and operating them as a private landlord. It can then discharge households to itself, but as a private rather than social landlord.
Advocacy group Thirteen London boroughs have now signed up to a scheme called Capital Letters, a not-for-profit company that will procure accommodation from private landlords for homeless Londoners and those at risk of homelessness. Capital Letters, which is collectively owned by the participating boroughs and supported by £38 million of grant funding from MHCLG, will enable member boroughs to access more accommodation across London and will provide a framework for placing households as close as possible to their home borough. The scheme has procured its first property and will expand procurement activity throughout 2019. There is interest from major build-to-rent landlords for whom it is attractive to deal with a single customer. Participating boroughs agree to procure at least 50% of their in-London accommodation for homeless households through the scheme in order to receive the additional MHCLG grant funding. Introduction of the Homelessness Reduction Act The intentions behind the HRA were good, our interviewees felt, especially in that it focused more attention and resource on single homeless people, most of whom had previously been left without any right to assistance as the threshold for ‘vulnerability’ was so high. Another intention was to shift local authority attitudes away from gatekeeping to prevention. In many areas the Act enshrined what London authorities already regarded as best practice.
Since 2002 we’ve been increasing our focus on advice and homelessness prevention. In the past 10 years prevention has grown to more than 50% of activity, and that’s not changed since the HRA.
Outer London housing director
We have fewer households for whom we have accepted a main duty, but our pre-HRA focus was on prevention anyway so it hasn’t been a step change.
Outer London housing director Some advocacy groups took issue with the claim that boroughs were already taking the HRA approach, saying that London boroughs had focused heavily on preventing family homelessness but had in fact done little to help single people.

20
While boroughs supported the intentions behind the HRA, they felt that some of the measures had been introduced without enough preparation, that monitoring and data- assembly costs were high and that the overall effect on local authorities had been underestimated. Numbers of households presenting as homeless The HRA was expected to increase the numbers of households presenting as homeless and the early H-CLIC statistics confirm that this occurred; the number of prevention and relief cases in particular grew strongly. Boroughs said that they were seeing higher numbers of single people and couples coming forward (as was the intention of the Act). One housing director said
Since the HRA was implemented in April there has been a significant increase in numbers – they are up by 31% on average over the last ten months. The change was almost immediate – by the end of the first week numbers had shot up. We think this means people were aware of the changes in advance – maybe through social media? Numbers have settled down since but are still much higher than before.
Inner London housing director However, the magnitude of the change varied across London and in some areas was below expectations.
I’m fairly sure that fewer people are coming forward. However, there’s still a higher workload because of the increased time per person.
Outer London borough Numbers presenting are up about 10%, not huge.
Inner London borough No change. Broadly speaking, we’re seeing about the same numbers.
Inner London borough Many said the overall mix of those coming forward had not changed significantly. Given the focus of the HRA on single homeless people, who were previously largely excluded from the system, boroughs had expected to see a large increase in the numbers and proportions of such households presenting; one was worried that dissemination of the change through social media would cause an avalanche. Several interviewees said that this had not occurred to the extent anticipated, but some also noted that an unexpectedly high proportion of those single people who did present had complex needs which were time-consuming and costly to address.
What is happening is that the cases are more complex and it’s more time-consuming to deal with them because we’re trying to act within the spirit of the law.
Inner London borough We are increasingly seeing people with very complex needs. Mental health problems in (this borough) are eight times the national average, and approximately 20% of the single people presenting have multiple needs. … Domestic violence is also growing,

21
as is gang/youth violence, with an increasing number of people asking to be moved because of this.
Inner London housing director Equally, however, several boroughs said preparing Personal Housing Plans for ‘new’ households coming forward (those who in pre-HRA days might not have approached the borough at all) involved considerable expenditure, but that many such households never followed up after the first interview. Boroughs also observed that people were going away disillusioned, saying local authorities had nothing to offer that was not already available before the HRA. Duty to refer The duty to refer requires other public authorities (hospitals, prisons, social services) to refer households who may become homeless to the local authority’s Housing Options team. This has created more work in some places (not all). Many of the referring authorities had not interacted before with housing departments and interviewees said the Act had raised unrealistic expectations about the support boroughs could provide. The other agencies did not necessarily know to which borough they should refer, and some therefore made multiple referrals. The duty to refer had increased the number of households that boroughs needed to assess but more importantly, boroughs often received only a few pieces of information about the household (sometimes nothing more than a name and mobile number), leaving officers to try to find the person and assess their situation. Often their search was unsuccessful. Some boroughs had set up new systems to deal with this stream of referrals.
The worst bit of the HRA is the duty to refer. Housing will always be in huge demand but the duty to refer exacerbates it because it raises expectations among clients and other agencies… It generates almost a whole new workstream and admin burden, and we’re just not set up to deal with it. The agencies have this duty but they don’t understand what we can and can’t do, and they can refer anywhere not just where the client has ties. Some of them refer to many councils at once in a random, scattershot way. Every Friday afternoon we get an influx of people released from prison; they might not even be from here.
Outer London borough Record-keeping and record-making The advent of the HRA purposely coincided with the introduction of a new record-keeping system for tracking homeless households, known as H-CLIC. This new digital system, described above, aims to collect detailed information about individual households presenting as homeless, in order to allow more granular analysis. It replaces the P1E form on which local authorities previously submitted aggregate information only. H-CLIC might provide good-quality information at some point in the future, we were told, but so far it was hugely unpopular with local authorities. They said it had been introduced too fast and required a major (and, most thought, detrimental) change in working practices.
To cope with the requirements of the HRA the housing officer needs to go into the interview with a laptop and type, which really puts clients off. There’s a generational gap in terms of staff — the older ones learned to touch type in secretarial courses, and the younger ones have grown up with computers, but in the middle people

22
mainly write by hand. We have decided to spare our frontline staff H-CLIC and have brought in dedicated admin staff to deal with it. … Whatever is written on the computer goes straight onto the system, but the notes really should be checked first. The system doesn’t produce better statistics for us yet though it eventually might. The scheme of data came too late, and the numbers it’s producing aren’t meaningful. There’s a risk that it becomes just a tick-box exercise at the expense of good qualitative work… The housing officers are frustrated with the time taken by bureaucracy; they said we could do much more for clients if we had more time. Caring and empathy is completely lost—the form takes over.
Outer London borough It has gone from a system where we reported by groups, to one where you have to record 63 bits of data for every individual. We have staff who are very good at dealing with people who are at risk of homelessness—they could negotiate, solve problems. These are not the skillsets that are required to write a plan and record data. Some of these staff aren’t proficient at typing—their work was talking to people, negotiating, not typing words into a computer. It’s demoralising for them.
Inner London borough
The HRA also requires authorities to prepare a Personal Housing Plan for each applicant, whether or not they accept a main duty. The PHP sets out what the applicant and the council need to do to ensure the applicant has somewhere suitable to live for the next six months. The idea is that the document should give the applicant a realistic picture of their housing options and make clear their own responsibility for addressing their housing situation. Interviewees agreed that applicants should be encouraged and assisted to take responsibility for their housing but said that in light of the systemic shortage of affordable housing in much of London, the time-consuming PHP process (which at least doubled the length of initial assessments, we heard) was not the best use of resources. Interviewees said the PHP could be useful in opening a dialogue with some applicants, but that others ‘laughed at it’ because it just confirmed what they already knew. The HRA had reportedly raised homeless households’ expectations of securing a social tenancy and some applicants would not engage with other aspects of the plan. Housing officers regularly spent time preparing PHPs for applicants who never appeared for further interviews, at least in part because of the process. Expectation of net positive effect on expenditure in Year 3 MHCLG’s ‘new burdens’ calculation for the HRA supported the government’s expectation that the change in emphasis from dealing with statutory homelessness to preventing homelessness would cost local authorities more in the short term but that by year 3 overall net expenditure would fall, as fewer households would be entering costly TA. This calculation, designed to capture in a rigorous way the financial effects on local authorities of new legislation, estimated that the overall cost to English local authorities of the HRA would be £72.7 million in the first two years (MHCLG 2017). The assumptions behind this calculation and the method used are further discussed in Section 7. A year in from the implementation of the Act, our interviewees were pessimistic about a net positive result in year 3. Some (mainly in outer London) expected numbers in TA to decline but none expected that the overall cost of homelessness provision would fall. Some noted that there had been no analysis of whether and how the HRA might affect the ease with which local authorities could identify suitable move-on secure accommodation.

23
(This borough) expects no savings. Basically, more people are now coming forward and it takes longer before we make a final decision. We are providing a better service, including ensuring people have access to other relevant council services. But more people are coming forward and their needs are often more complex. We’re now putting a smaller proportion of those coming forward into TA (around 60% – it was 70%) but the total numbers presenting are going up and are expected to carry on doing so. We therefore do not think there will be savings in the next three years, or even the next ten if the drivers don’t change.
Inner London borough [Q: Will there be savings in three years?] No! Because new people are always coming into the system, and you can’t stop that. The root causes of homelessness —relationship breakdown, death in the family, eviction — these things continue to happen. We can’t prevent those things!
Inner London borough Main-duty acceptances are the most expensive type of case for boroughs, as temporary accommodation is so costly. Interviewees recognised that the HRA had led to a drop in main-duty acceptances initially but said this was partly because the prevention stage lasted longer: after this one-time decline the numbers could well begin to rise again. The HRA had also increased borough responsibilities for prevention and relief and increased the number of cases presenting; both of these entailed higher costs. (The drivers of cost are explored in more detail in Section 7, below.) The overall feeling was that boroughs were providing a better service post-HRA, but at a higher cost. Reviews Households presenting as homeless may request a review of borough decisions with which they disagree. This possibility already existed but the HRA has increased the number of elements of the process that can be reviewed. Before the Act was implemented it was widely expected that the number of reviews (and consequent cost) could increase sharply, but we heard that so far there had been little change. Some boroughs said the new review provisions were likely to be a ‘slow burner’, with the number of applications for review increasing as knowledge about the process spread. Staffing requirements The HRA imposed some new duties on local authorities and meant existing processes became more time-consuming, meaning many boroughs had taken on additional staff. The hiring was going on not only in London but all over the country, leading to competition (and salary increases) for experienced housing options officers. Many housing directors told us they were unable to hire permanent employees because the central government grant that covered the cost of new posts was time-limited. Equally they were losing staff more rapidly because of the increase in demand across authorities. They said they had no choice but to rely on agency staff, even though they cost much more. Several roundtable participants said roughly a third of their housing staff were now from agencies.
We’re spending more on staffing. I think I have about ten additional staff at the moment. We have taken quite a cautious approach; some boroughs took on more than 30 staff in anticipation of increased workloads, but we were more suck it and

24
see. I started with seven or eight new people, then two more, and another two soon—we’re working out how many we need. Most of the new employees are frontline staff who are dealing with the public, then there’s a group who are in the back office supporting people in TA or trying to source affordable PRS.
Inner London borough
After HRA we added 20% to our staff. We’re struggling to keep people — we’ve seen early retirement of long term staff and now many lack experience. There are lots of vacancies and we rely on agency staff.
Outer London borough It is a struggle to recruit staff, especially in London. It’s not clear whether this is systemic or just a transitional issue. Some is probably the latter — the system is new and people will get used to it. But there is an underlying workforce issue that needs to be sorted.
Advocacy group In taking on additional staff, some boroughs were returning to the numbers they had in earlier years; one outer London borough said they had had to cut staff by 15% in 2015/16 and by a further 20% in 2016/17 due to budgetary pressures. Finally, some boroughs reported that the demands of the new system had led to serious issues of staff morale and mental health. One outer London borough reported that their ‘staff was on the verge of meltdown’; another said ‘(Our) frontline staff have very demanding jobs but they don’t get the same supervision and emotional support as social workers. For social work there’s a whole formal framework, but not for housing officers necessarily.’ Reorganisation of services Several boroughs said that in recent years they had carried out major organisational reforms affecting the way they provided a range of services including homelessness. The reorganisations, some of which took place well before the HRA, generally involved merging several service-provision teams including housing and benefits; wider services such as NHS Clinical Commissioning Groups might also take part. Such restructuring allowed authorities to offer a single point of contact, and continuity of service, for vulnerable households. (Case Study 3 gives details of one example, in Barking & Dagenham.) Boroughs said this enabled them to provide a better service and might ultimately save money, although in the short term the reorganisation itself entailed costs and staff members needed training to be able to cover all the demands of their new, wider roles.
In 2014 a service reorganisation brought the Benefit Service and Housing Needs teams together – there are good synergies and it works well. Operational managers have one job spec and can move around the service. All are benefits based but working in homelessness as well. Everyone has one main objective: to prevent homelessness.
Inner London borough In anticipation of the HRA we took on staff. Our structure almost doubled, from 32 before the HRA to 56 after the restructure, but it wasn’t just about HRA because they are also providing new services in health and social care. In preparation for the HRA

25
we have reorganised our service, so now we are jointly commissioning with Adult Social Services and the CCG. Since April we are seeing many clients with high support needs. Their problems aren’t acute enough for social services involvement but they couldn’t live independently. In previous years they would have been looked after by adult social services (ASS) but no longer. These are clients with multiple and complex needs but they don’t hit the thresholds for ASS as they keep raising them, so we need to provide some kind of floating support.
Outer London borough
Multiple funding streams Some interviewees acknowledged a change in attitude from central government, with a greater willingness to provide additional funding to support homelessness reduction. However, these extra funding streams (e.g. the new burdens money) were often time-limited, meaning local authorities could not plan strategically. The structure of the funding had knock-on effects for service provision: insecure funding meant local authorities facing higher demand for services could not hire permanent staff and found it difficult to invest in staff training.
(The HRA) has changed attitudes and priorities, and now there are lots of pots of money — but they are siloed and small and costly to get!
Outer London borough (We took on 24 additional staff but) the issue is revenue funding for these positions.
Outer London borough My concern is that the government won’t review this system until next year, which will be too late! By the middle of this year I need to start reviewing the budget for next year. What do I tell my staff – will they have a job?
Inner London borough
In addition, some of the later new funding streams were allocated through competitive bidding processes. Preparing bids took a significant amount of staff and manager time, reducing their availability for client-facing work and adding to the pressure on frontline staff.
7 Improving forecasts of borough homelessness
expenditure MHCLG Revenue Outturn data records that in the year prior to the introduction of the HRA in April 2018 London boroughs spent £253 million from general funds to support homelessness related activity that was not funded by specific government grant or other income (such as rental income). SLT figures show that net general fund expenditure was £201 million; they made contributions from their Housing Revenue Accounts of a further £15 million. In advance of the HRA’s introduction, MHCLG produced a new burdens assessment to capture and cost the additional requirements imposed on local authorities by the Act. The total figure produced was £72.7 million for England as a whole over three years, of which London boroughs received £30.2 million (42%). The main extra costs identified were the

26
result of more households presenting as homeless, and additional prevention duties. The MHCLG analysis indicated that expenditure in some areas would rise and remain at the new, higher levels, but that the net cost effect would be neutral or positive after three years because acceptances — the most costly type of case — would fall so much. This prediction is particularly difficult to test now, as early post-HRA data reflect the longer period between a household’s initial presentation and acceptance of main duty, and there have been difficulties with data collection in the new format. Any ex ante calculation of this kind has to be based on assumptions, and MHCLG analysts produced a careful piece of work that clearly set out why they made the choices they did. Many of the assumptions however appear unlikely to be realised, especially in the London context, notably with respect to staff costs and presentations. In addition, the unit costs of handling different types of case were national averages and did not capture London’s very different housing market situation. Moreover, the assumptions made excluded the possibility that the HRA might impact on authorities’ capacity to find secure accommodation for those moving out of TA. With the benefit of statistics from most of the first year of the HRA, we have conducted an updated analysis of the likely additional costs to London boroughs because of the duties imposed by the HRA. Our method is based on the MHCLG’s new burdens assessment but differs in several ways:
1) We use the most recent figures available, including actual figures for most of 2018/19 (the first year of the HRA), drawn from our own data-collection exercise
2) We extend the projections over five years (to 2022/23) rather than stopping in 2019/20
3) We explicitly set out the method of calculating unit costs 4) Our caseload projections do not assume that net costs fall to zero by Year 3, as this
assumption is not supported by data available so far and the insights of London housing directors
5) We use London-specific inputs.
Unit costs Both sets of calculations—MHCLG’s and ours--for the additional cost imposed on boroughs by the HRA multiply the unit cost of dealing with a homelessness case by the change in the number of such cases after the HRA. Full details of the methodology are set out in Annex A. Our calculations suggest that the unit costs of dealing with new homelessness cases in London are more than twice as high as the MHCLG’s estimates of England-wide costs (Table 4). Our figures also indicate that under the new legislation, the unit cost of a prevention case is more than 25% of the unit cost of an acceptance – double the ratio implied by the MHCLG estimates – and highly relevant to the assessment of net costs going forward.

27
Table 4: LSE London and MHCLG estimates of post-HRA unit cost of homelessness by user type, 2018/19
(£) LSE London
(London only) MHCLG new burdens
(England average)
1 Acceptances 9,566 4,200
2 Intentionally homeless 5,402 2,200
3 Not in priority need 2,110 730
4 Not homeless 938 260
6 Prevention & relief 2,517 (26% of the cost of an acceptance)
530 (13% of the cost of an
acceptance)
Source: LSE London calculations
Caseloads Turning to the change in caseload, the MHCLG new burdens calculations incorporate the assumption that the number of acceptances would fall by 30% over three years. (Note that this is not an outcome of the MHCLG modelling but rather an a priori assumption.) Our modelling suggests that in the case of London this is too optimistic. Our central scenario is that after an initial sharp fall, acceptances begin to grow again at the previous rate while prevention and relief cases also grow, reflecting the wider eligibility for these services. Additional HRA costs Table 5 gives the additional costs to boroughs of implementing the requirements of the HRA, compared to the counterfactual situation (i.e. a situation where the HRA has not been introduced). The MHCLG new burdens calculations assumed that net costs would be zero by Year 3 of the Act, but our central estimates indicate that the HRA does not become cost-neutral for London over three years or even over five. Rather, under the central scenario the additional cost to boroughs is £11.2 million in the current financial year and continues to grow slowly over time. This is of course based on the assumption that there is a slow growth in numbers coming forward – which is consistent with the qualitative evidence that we received. It would need significant additional changes to regulation and the market – e.g., the removal of no-fault eviction in the private rented sector; a decline in the popularity of AirBnB or rises in the LHA, for declines to occur. Such declines are factored into the optimistic scenario, under which cost neutrality is achieved in 2022/23.

28
Table 5: LSE London estimates of additional costs of homelessness services in London under HRA (Post-HRA costs less counterfactuals under three scenarios)
(£ millions, inflation adjusted) Scenarios central pessimistic optimistic
2018/19 11.2 11.2 11.2 2019/20 12.6 31.8 8.1 2020/21 14.0 58.0 4.7 2021/22 15.4 91.3 1.1 2022/23 16.9 133.7 -2.8 5-year total 70.0 326.0 22.2 annual average 14.0 65.2 4.4
Revised HRA new burdens assessment Table 6 compares our central estimate of increased costs for London (from Table 5) with the new burdens amounts allocated by MHCLG to London local authorities (breakdown in Annex B). Although the HRA took effect in April 2018 the first tranche of funding was allocated in the previous financial year, to enable preparations to be made. The new burdens funding for London totalled £30.2 million over three years, including £10.8m prior to the implementation of the Act to assist with borough preparations, and is due to end in 2019/20. Our analysis indicates that the HRA changes will not be cost-neutral for London even in the medium term (five years). Using our central estimate, the shortfall in funding for HRA-related costs is estimated at £50.8 million over the five-year projection period from 2018/19 to 2022/23.
Table 6: LSE London central estimates vs new burdens allocations (£ millions, inflation adjusted)
LSE central estimate
of additional costs
MHCLG
new burdens allocations
2017/18 [10.8]6 10.8 2018/19 11.2 9.9 2019/20 12.6 9.4 2020/21 14.0 0 2021/22 15.4 0 2022/23 16.9 0 6-year total 80.9 30.1 6-year shortfall
50.8
6 The specification of the model did not allow us to estimate additional costs in 2017/18, the year prior to HRA implementation. We have assumed that the £10.8 million of new burdens funding given to boroughs in 2017/18 was all spent on preparations in the course of that year, and that it covered additional costs in full.
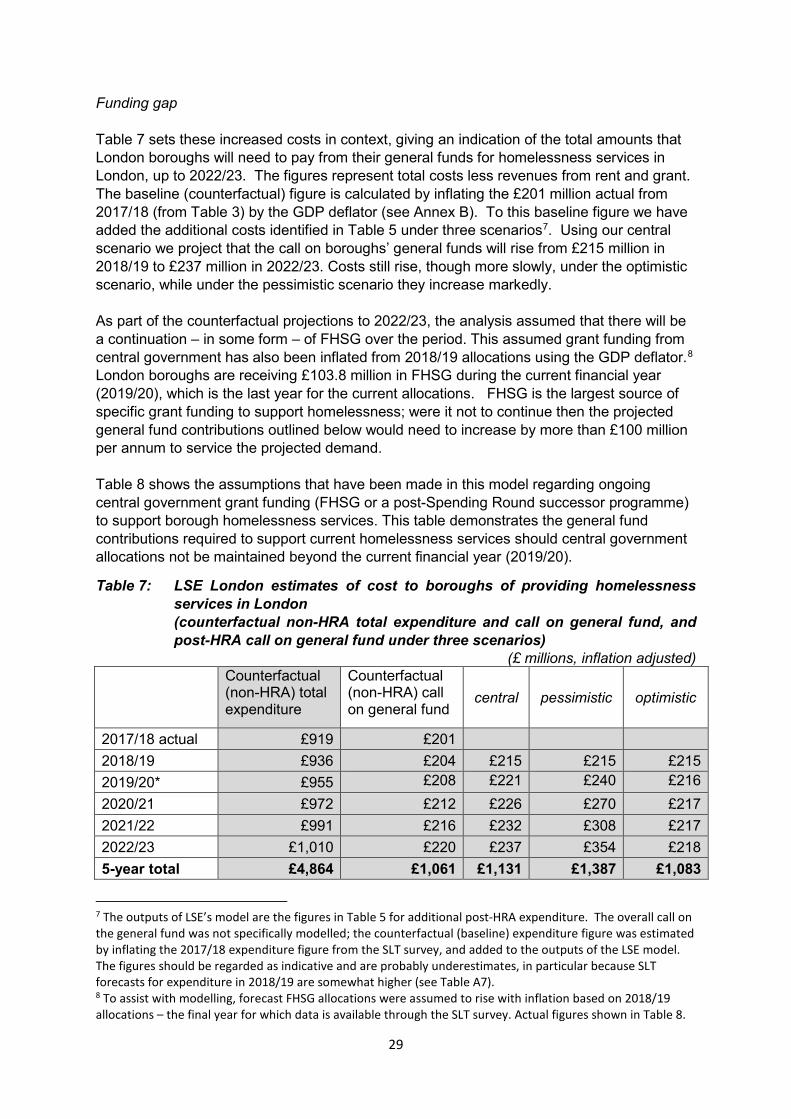
29
Funding gap Table 7 sets these increased costs in context, giving an indication of the total amounts that London boroughs will need to pay from their general funds for homelessness services in London, up to 2022/23. The figures represent total costs less revenues from rent and grant. The baseline (counterfactual) figure is calculated by inflating the £201 million actual from 2017/18 (from Table 3) by the GDP deflator (see Annex B). To this baseline figure we have added the additional costs identified in Table 5 under three scenarios7. Using our central scenario we project that the call on boroughs’ general funds will rise from £215 million in 2018/19 to £237 million in 2022/23. Costs still rise, though more slowly, under the optimistic scenario, while under the pessimistic scenario they increase markedly. As part of the counterfactual projections to 2022/23, the analysis assumed that there will be a continuation – in some form – of FHSG over the period. This assumed grant funding from central government has also been inflated from 2018/19 allocations using the GDP deflator.8 London boroughs are receiving £103.8 million in FHSG during the current financial year (2019/20), which is the last year for the current allocations. FHSG is the largest source of specific grant funding to support homelessness; were it not to continue then the projected general fund contributions outlined below would need to increase by more than £100 million per annum to service the projected demand. Table 8 shows the assumptions that have been made in this model regarding ongoing central government grant funding (FHSG or a post-Spending Round successor programme) to support borough homelessness services. This table demonstrates the general fund contributions required to support current homelessness services should central government allocations not be maintained beyond the current financial year (2019/20).
Table 7: LSE London estimates of cost to boroughs of providing homelessness services in London (counterfactual non-HRA total expenditure and call on general fund, and post-HRA call on general fund under three scenarios)
(£ millions, inflation adjusted)
Counterfactual (non-HRA) total expenditure
Counterfactual (non-HRA) call on general fund
central pessimistic optimistic
2017/18 actual £919 £201 2018/19 £936 £204 £215 £215 £215 2019/20* £955 £208 £221 £240 £216 2020/21 £972 £212 £226 £270 £217 2021/22 £991 £216 £232 £308 £217 2022/23 £1,010 £220 £237 £354 £218 5-year total £4,864 £1,061 £1,131 £1,387 £1,083
7 The outputs of LSE’s model are the figures in Table 5 for additional post-HRA expenditure. The overall call on the general fund was not specifically modelled; the counterfactual (baseline) expenditure figure was estimated by inflating the 2017/18 expenditure figure from the SLT survey, and added to the outputs of the LSE model. The figures should be regarded as indicative and are probably underestimates, in particular because SLT forecasts for expenditure in 2018/19 are somewhat higher (see Table A7). 8 To assist with modelling, forecast FHSG allocations were assumed to rise with inflation based on 2018/19 allocations – the final year for which data is available through the SLT survey. Actual figures shown in Table 8.

30
Table 8: Assumed central government grant funding through FHSG or equivalent
successor programme and modelled impact on required general fund support to maintain homelessness provision
(£ millions, inflation adjusted) Assumed ongoing FHSG
allocations in counterfactual financial model
Estimated general fund gap without FHSG continuation
from 2020/21 2020/21 £115.20 £341.23 2021/22 £117.43 £349.02 2022/23 £119.73 £357.03
Total forecast London borough homelessness spend Summarising the analysis, Table 9 highlights the total expected homelessness spend by the London boroughs in the years to 2022/23. This shows that the expected cost of delivering homelessness services in London is forecast to increase year on year in the post-HRA policy environment, to over £1 billion a year by 2021/22. Much of this cost is assumed to be met through specific grant funding (such as FHSG or a successor) and income such as rental payments. However, the modelling forecasts a continuing upward trend in borough general fund contributions to maintain current levels of service provision, highlighting a widening gap between the resources available to councils for the specific purposes of addressing homelessness and the cost of delivering the duties placed on them. Our calculations suggest that the overall call of homelessness on boroughs’ general funds will rise from £201 million in 2017/18 to £226 million in 2020/21 (the period covered by the upcoming, short term spending review), and will continue to increase after that to around £237.3m by 2022/23. Over the period, the proportion of homelessness costs met through boroughs’ general funds will increase from 21.8% in 2017/18 to 23.1% in 2022/23. Table 9: Total forecast borough homelessness spend and general fund
contributions 2017/18 – 2022/23 (£ millions, inflation adjusted)
Total forecast borough
homelessness spend
(post-HRA, central scenario)
Of which
Expected general fund contributions (post-HRA)
Forecast proportion of spend met by
borough general funds
Amount assumed in
model to be met through ongoing FHSG/equivalent
grant funding
Estimated additional
cost to boroughs
of delivering
HRA duties
2017/18 actual £919.48 £200.59 21.8% £117.80 £ - 2018/19 £947.02 £215.34 22.7% £110.90 £11.20 2019/20 £967.13 £230.11 23.8% £113.12 £12.60 2020/21 £986.12 £226.02 22.9% £115.20 £14.00 2021/22 £1,006.36 £231.58 23.0% £117.43 £15.40 2022/23 £1,027.23 £237.30 23.1% £119.73 £16.90 5-year total (2018/19-22/23)
£4,933.86 £1,140.37 23.1% £567.06 £70.10

31
8 Discussion and conclusions Homelessness accounts for a relatively small percentage of local authority expenditure in the country overall but the burden is unevenly distributed and falls very disproportionately on London. In 2017/18, London local authorities spent over £919 million assessing, assisting and accommodating homeless households. Most of that expenditure was covered by income from rent paid by housing benefit and by tenants themselves. Boroughs also receive specific grants from central government to pay for elements of homelessness expenditure, but they cover only a fraction of the cost to boroughs: London local authorities received £128.6 million in Flexible Homelessness Support Grant and New Burdens funding in 2017/18 (over half the amount distributed nationally) but were still left to find £201 million from their general funds, and a further £15 million from their Housing Revenue Accounts. The financial pressure of homelessness on London comes from the interaction of four factors. The 2018 implementation of the Homelessness Reduction Act was responsible for two of them: an increase in the number of households presenting as homeless, and an increase in local authorities’ responsibilities towards those households. But the successive restriction of welfare benefits and the very high cost of private housing in London both also play an important part. The reduction of the LHA from the 50th percentile of local rents to the 30th at the beginning of the decade put extra pressure on tenants trying to find accommodation within the benefit limits, particularly in areas with high proportions of low-income private tenants. The situation got rapidly worse after 2016, when government introduced a four-year freeze on LHA rates. Although LHA rates were fixed, market rents continued to rise, so now many rents below the 30th percentile may be well above the (frozen) LHA level. At the same time, the overall welfare cap was reduced, further increasing pressure on low-income tenants. This situation is currently expected to continue to 2020. These changes not only affect demand for low-cost PRS accommodation, but also have an impact on supply: landlords know it will be harder for tenants to pay their portion of the rent and may therefore be less inclined to take tenants on housing benefit; some may indeed use S21 to evict existing tenants on benefit because of concern about possible future arrears. This research looked at experience in London from the first year of operation of the HRA. It is the government’s contention that the HRA will cost local authorities more in the short term but will in the long term (after three years) save them money, as fewer households will be accepted as homeless and be housed in temporary accommodation. Our analysis suggests that this is too optimistic, at least in the capital. MHCLG conducted a careful appraisal of the likely costs of the HRA in its 2017 new burdens assessment. Taking their methodology as a baseline, we have refined the model to capture the specific situation in London, where the costs of accommodating homeless households in TA are much higher than in the rest of the country and the relationship between the costs of preventions and acceptances is different. We have also updated the calculations with the most recent presentations figures, which take account of most of the first year post-HRA data. Finally, we have extended the projection period from three years to five. We found the expenditure statistics on which MHCLG based its initial calculations to be unexpectedly poor, with major inconsistencies in how expenditure was classified and

32
reported across authorities. We had so little confidence in the figures that we conducted our own data-collection exercise, together with SLT, to produce consistent expenditure numbers for all London boroughs. Our central scenario suggests that in London, net costs will not fall to zero after three years but will remain at a higher and slowly increasing level as compared to the hypothetical, non-HRA situation unless other changes in regulation or the market occur. The factors behind the increased costs include the higher number of cases presenting (an explicit intention of the Act), more involved bureaucratic procedures (preparation of PHPs, use of the H-CLIC monitoring system, and handling referrals from other agencies) and greater responsibilities for prevention and relief. These new responsibilities will continue to require corresponding new expenditure. Our calculations suggest that the overall call of homelessness on boroughs’ general funds will rise from £201 million in 2017/18 to £226 million in 2020/21 (the period covered by the upcoming, short term spending review), and will continue to increase thereafter. MHCLG’s expectation, as expressed in its new burdens calculations, was that higher costs occasioned by some elements of the HRA would be offset by a large fall in the number of acceptances. In the short term there has indeed been a dramatic drop. To some extent this is an artefact of the new rules, which mean that cases take longer to wind their way through the system to reach a final decision point. When the new procedures have fully bedded in this delay will fall out of the quarterly statistics. Our interviewees said they then expected to see numbers rise consistently. More importantly, the MHCLG expected acceptances to continue to fall because the HRA was meant to give authorities more tools to prevent and relieve homelessness. By using these tools – intervening earlier, writing PHPs, helping more types of household, working with other agencies – the expectation was that authorities could keep more households in their existing homes or find them new ones before they ever became statutorily homeless. This would be entirely logical if the PRS (because in London it almost always is the PRS) could give such households a long term stable home. Unfortunately, the capital has far too little appropriate, secure housing that is genuinely affordable to low-income (and often otherwise vulnerable) households. The danger is that prevention and relief will buy such households only a few months or a few years at most, and that cases recorded as successful preventions one year end up accepted as homeless the next. Equally those trying to exit TA in a tight housing market such as London are in competition with those who are prevented from homelessness so time in TA may be extended. The evidence does not support MHCLG’s expectation that the improved service will definitely result in lower costs over the long term. Authorities will incur lower costs if they can successfully prevent or relieve homelessness by keeping households in their current homes (predominantly in the PRS) or finding them new settled accommodation (again in the PRS). The extent to which this is possible depends on conditions in the local rental market and the proportion of rents covered by LHA. It also depends on the ratio of costs for prevention and relief as compared to accepting a main duty. It is clear that the costs of prevention have increased – as a matter of policy. It is unclear what the impact has been and will be on the time and cost of accommodating those already in TA and the ability of the local authorities and the households themselves to find secure move-on accommodation. Both prevention and relief activity and moving people out of TA are particularly challenging in London because private rented housing is a seller’s market and many landlords prefer not to rent to households on benefits.

33
The HRA has changed working practices across the sector. Many of these changes have been positive: London boroughs fully support the intentions behind the HRA in terms of the quality and scope of service provided. The Act is meant to enable local authorities to help more households, and to intervene earlier so that help is more effective. The goal is that more people can stay in their homes rather than becoming homeless in the first place. If this goal can be achieved the wellbeing of many thousands of households will be improved. The way to improve the situation is not just to emphasise entry into the system (acceptances) but to address issues around exit from the system. Local authorities in London are continually under pressure to house a wide range of households facing extremely difficult housing conditions in addition to those already accommodated in TA. The focus should be on providing affordable, secure, stable accommodation of the right kind and in the right places, so that the transition from both potential and actual homelessness to settled accommodation can be a permanent one.

34
References Department for Communities and Local Government (2017a) New burdens assessment pro forma: Homelessness Reduction Act https://assets.publishing.service.gov.uk/government/uploads/system/uploads/attachment_data/file/652196/HRA_new_burdens_assessment_pro_forma.pdf Department for Communities and Local Government (2017b) Homelessness Reduction Act New Burdens: Method note for allocation of funding to local authorities https://assets.publishing.service.gov.uk/government/uploads/system/uploads/attachment_data/file/652257/Distribution_methodology_note.pdf Department for Communities and Local Government (2017c) H-CLIC Frequently Asked Questions V1.0 https://gss.civilservice.gov.uk/wp-content/uploads/2017/12/HCLIC-FAQs-v1-0.pdf Housing, Communities and Local Government Select Committee (2019) Homelessness Reduction Act – One Year On Oral evidence http://data.parliament.uk/writtenevidence/committeeevidence.svc/evidencedocument/housing-communities-and-local-government-committee/homelessness-reduction-act-one-year-on/oral/100895.html Joyce, R., Mitchell, M. and Keiller, A.N. (2017) The cost of housing for low-income renters Institute for Fiscal Studies https://www.ifs.org.uk/uploads/publications/comms/R132.pdf Local Government Association (2019) Homelessness Reduction Act Survey 2018 - Survey Report March 2019 Local Government Information Unit (2018) ‘Briefing: Homelessness Reduction Act 2017’ file:///C:/Users/brads/Downloads/LGIU_homelessness-reduction-act-2017.pdf London Councils (2011) Pan London Agreement on InterBorough Accommodation Placements http://pdfs.local.gov.uk/12%20Working%20with%20other%20councils/London%20IBAA%20agreement.pdf
Ministry of Housing, Communities and Local Government (2019) The Homelessness Case Level Information Collection (H-CLIC) Specification for monitoring the Homelessness Reduction Act 2017 Version 1.4.4 Issued: 11th April 2019
Ministry of Housing, Communities and Local Government (2018a) The Homelessness Case Level Information Collection (H-CLIC) For the monitoring of the Homelessness Reduction Act 2017: Guidance for the completion and return of H-CLIC data Version 1.1 (consistent with v1.4.3 of the data specification) Issued: 28th September 2018 Ministry of Housing, Communities and Local Government (2018b) A review of local authorities’ relative needs and resources: Technical consultation on the assessment of local authorities’ relative needs, relative resources and transitional arrangements https://assets.publishing.service.gov.uk/government/uploads/system/uploads/attachment_data/file/764487/Review_of_Local_Authorities__Relative_Needs_and_Resources_consultation_document.pdf

35
Annex A: MHCLG’s new burdens assessment and the LSE London model
This annex sets out details of our revised and updated calculations for London borough expenditure on homelessness post-HRA. How MHCLG estimated the cost of the HRA: the new burdens assessment
Under the government’s New Burdens Doctrine, when government ‘require(s) councils to do something new or different that they would otherwise need to fund through council tax rises, Government should ensure councils are fully funded to meet these changes’ (MHCLG 2017 p.5). The calculations of the additional funding councils would need to fulfil the new duties imposed by the HRA appear in a new burdens assessment (MHCLG 2017), which is available online. According to this calculation, the new responsibilities imposed by the HRA were expected to add £72 million in all to the costs of local authorities in England over the first three years of the Act. This amount was distributed to local authorities using a set of formulae based on their homelessness expenditure, the number of cases they handled, and local levels of deprivation. London boroughs received £30,188,984 (42% of the national total). Annex B gives the amounts allocated to each London borough.
In performing its calculations, the MHCLG used figures for • The expected post-HRA change in the caseload for five types of case • The unit cost of dealing with each type of case, and • The unit cost of performing each new duty required by the Act.
The resulting figures were multiplied to produce annual cost estimates under three scenarios. In simplified form, the equation has three main elements, shown as A, B and C below. (LSE London’s interpretation of MHCLG calculations):
A [(Annual number of additional prevention & relief cases) * (unit cost per case)] –
B [(Annual reduction in number of acceptance cases) * (unit cost per case)] +
C [(Annual number of new activities carried out) * (cost per activity)] =
Additional cost(saving) per year
Elements A and C (additional prevention and relief cases, and new responsibilities) were expected to result in increased costs for local authorities; element B (fewer acceptance cases) was expected to reduce costs. MHCLG’s contention was that the fall in element B would offset the increases in elements A and C. The following subsections describe the constituent elements of the MHCLG calculations. Post-HRA caseload scenarios The MHCLG new burdens assessment employed three caseload scenarios, which fed into the calculations for elements A and B above. These scenarios are contrasted with a

36
counterfactual, which projected existing trends (mostly of increasing caseloads) in a straight line over three years. The counterfactual and the three caseload scenarios are set out in Tables 7.1 and 7.2, which are derived from MHCLG 2017. Table 7.1 also gives actual outcomes in Wales in the first year after the passage of the Welsh Act. All three scenarios reflect the same implicit logic model: that in the wake of the Act more households will approach local authorities before they are owed a main homelessness duty (rows 2-4) and will receive more prevention support (row 5), meaning they are less likely to become costly acceptances (row 1). The scenarios are based around what happens to acceptances (the most expensive cases for the local authority) and can be summarised as follows:
1. optimistic (acceptances fall significantly and by Year 3 are 40% lower than
counterfactual; other types of caseload rise) 2. central (acceptances have fallen by 30% in Y3; other types of caseload rise) 3. pessimistic (acceptances fall a little; other types of caseload rise)
The scenarios differ only in terms of expectations about acceptances and prevention activities. Importantly, the change in the number of households approaching local authorities before they are owed a main duty (rows 2-4) does NOT vary by scenario—all three scenarios incorporate the same large step-change in Year 1, then a plateau at the new, higher level. Finally, all three scenarios envision an overall fall in homelessness acceptances over the three years post-HRA; the difference is in the magnitude of the fall. The new burdens document states that the MHCLG assessment was informed by Year 1 experience in Wales, but several of the assumptions used in the English scenarios are so different that it is hard to see the parallel: Wales saw a marked Year 1 fall in homeless households presenting (Table A1, rows 2 and 3), whereas the three scenarios for England all envisioned significant increases (Table A2, rows 2 and 3). The new burdens document does observe that Year 1 Welsh data ‘shows significant reductions across all homelessness caseloads’ but does not explain the discrepancy in the assumptions used for England.
Table A1: Caseloads: the counterfactual and Wales example used in MHCLG new
burdens assessment Counterfactual
(trend projection) Wales (Y1 actuals then
counterfactual)
Year 1
Year 2
Year 3
Year 1 Year 2
Year 3
1 Unintentionally homeless and in priority need (acceptances) +4% +4% +4% -64% +4% +4%
2 Intentionally homeless and in priority need +5% +5% +5% -48% +5% +5%
3 Homeless but not in priority need +0% +0% +0% -50% +0% +0%
4 Not homeless -2% -2% -2% +124% -2% -2%
5 Action to prevent and/or relieve +2% +2% +2% +55% +2% +2%

37
Table A2: The three caseload scenarios from the MHCLG new burdens assessment
Optimistic* (Acceptances down
strongly; other cases rise)
Central (Acceptances
down 30% by Y3, other cases rise)
Pessimistic (Acceptances down a
little, other cases rise)
Year 1
Year 2
Year 3 Year 1
Year 2
Year 3
Year 1
Year 2
Year 3
1 Unintentionally homeless and in priority need (acceptances)
-10% -12% -15% -7% -8% -9% -3% -4% -4%
2 Intentionally homeless and in priority need
+38% +5% +5% +38% +5% +5% +38% +5% +5%
3 Homeless but not in priority need
+32% +0% +0% +32% +0% +0% +32% +0% +0%
4 Not homeless +29% -2% -2% +29% -2% -2% +29% -2% -2%
5 Action to prevent and/or relieve
+36% +3% +3% +37% +4% +4% +38% +5% +5%
Note: In the MHCLG document the optimistic and pessimistic scenario numbers are apparently reversed; they are corrected here.
There are several assumptions (some implicit) behind all three MHCLG scenarios:
• prices rise by 1% per annum over the three years. (The explanation given for this choice was that it was consistent with the public-sector pay cap; however the same rate of inflation was applied to all the cost elements included in the calculations, including private-sector rents.)
• the number of households presenting would rise significantly in Year 1 • after the one-off increase in Year 1, the number of households presenting would
stabilise at the new, higher level • from the new, higher level the number of cases would increase gradually in
subsequent years • local-authority prevention and relief activities would follow the same pattern: step
change then stabilisation • prevention and relief activities would be largely successful and fewer households
would progress to main-duty acceptance, as their homelessness would have been prevented or relieved at an earlier stage.
This final point is key: the reduction in acceptances was an assumption, not an outcome of the modelling.

38
Based on these assumptions, MHCLG produced formulae to forecast the evolution of caseloads over three years, under the three scenarios. The formulae are simple multiplication; no sophisticated statistical techniques were used. The caseload projections (for the central scenario only) appear in MHCLG 2017 (p16) and are not repeated here. The numbers forecast a decline in main-duty acceptances over three years, with over 20,000 fewer acceptances in Year 3 under the central scenario was compared to the counterfactual. As pointed out above, the model was intentionally designed to produce a 30% caseload reduction over three years. Post-HRA unit costs Having produced estimates for the number of cases local authorities would be handling in future, the MHCLG assessment goes on to address the unit cost of dealing with the various types of case. The table of unit costs is reproduced below, as Table A4. The document does not set out in detail how these numbers were produced, saying only they are based on ‘a combination of the Revenue Outturn data local authorities provide on homelessness, the P1E returns and Shelter/Acclaim published assumptions.’ Elsewhere there is a suggestion that 2014/15 Revenue Outturn figures for expenditure by category were divided by numbers of households in each case category (p. 4). The figures are national averages for all of England; no disaggregation was done by region or type of authority. Importantly, the same unit costs are used for the counterfactual (without HRA) and for post-HRA spending. Table A4: Unit costs of dealing with various types of homelessness case, per MHCLG
Caseload type DCLG Wales Shelter/ Acclaim
Shelter
Unintentionally homeless and in priority need (acceptances) £4,200 £2,520 £2,270 n/a
Intentionally homeless and in priority need £2,200 n/a n/a n/a
Homeless but not in priority need £730 £380 n/a n/a
Not homeless £260 £190 n/a n/a
Action to prevent and/or relieve £530 £990 £890 £690
Source: MHCLG New Burdens assessment 2017, p. 17 Table A4 makes clear that acceptances are the most costly type of case for local authorities. It is also evident that the various sources give significantly different figures. The MHCLG figures are based on official government data, which should in principle be reliable--indeed the document refers to ‘robust data supplied by local authorities and contained within the Revenue Outturn tables’ (MHCLG 2017 p.5). However, we do not regard the RO data as reliable for the reasons discussed above. With the caseload scenarios and unit costs, elements A and B of the overall equation can be calculated. These elements cover the expected additional cost to local authorities of dealing with more prevention and relief cases, and the expected savings due to fewer acceptance cases (together described in the new burdens document as ‘Earlier intervention coupled with duties to assess and help to prevent and relieve homelessness’). These elements contributed the bulk of the expected change in costs: on a national level (no regional figures were published) they were expected to cost £30 million in year 1 and £5 million in year 2, with a saving of £22.5 million in year 3.

39
New duties
The final element of the calculations was to estimate the resource implications of the new duties imposed on local authorities by the HRA. The MHCLG identified four such duties:
• provision of information and advice to all households, not just those in priority need • preparation of PHPs • dealing with reviews of prevention and relief cases (broken down into officer time and
accommodating households whose cases were under review) • suitability checks of PRS properties
Each of these extra costs was separately assessed. The calculations used a range of inputs including the number of hours of officer time required to deal with each case, the cost of temporary accommodation and the rate of inflation. Table A5 presents the overall results of the MHCLG new burdens calculations. It shows that costs were expected to be highest in year 1, and that earlier intervention (elements A and B of the simplified equation set out above) accounted for 63% of the expected cost increase in the first year. In year three the net change in costs was expected to be negative because of the earlier intervention—that is, local authorities would be spending less on homelessness services overall than they otherwise would have. The various new duties imposed by the Act made up only a small proportion of additional costs in year 1 but were expected to remain fairly steady or to rise over time (in the case of extended review accommodation). In year 3 these additional costs were forecast to total £22 million, which would be offset by the expected £22.5 million saving expected because of earlier intervention. Table A5: Total new burdens funding for years 2018/19 to 2020/21, England
(£ millions; highest to lowest by cost in Year 1) LSE
categories MHCLG
categories 2018/
19 2019/
20 2020/
21 3-year total
Elements A and B
Earlier intervention coupled with duties to assess and help to prevent and relieve homelessness
£30.0 £5.0 -£22.5 £12.5
Element C
Extra suitability £5.3 £4.9 £4.5 £14.7 Enhanced information and advice £5.2 £5.4 £5.5 £16.1 PHP £4.6 £4.4 £4.3 £13.3 Extended review accommodation £2.3 £4.8 £7.5 £14.6 Extended review admin £0.5 £0.3 £0.2 £1.0
£47.9 £24.8 -£0.5 £72.2 Source: LSE London analysis of MHCLG new burdens assessment The LSE cost calculations The accuracy of the new burdens calculations depends heavily on the assumptions used in its calculations. Of course, any ex ante calculation has to be based on assumptions, and MHCLG analysts produced a careful piece of work that clearly set out why they made the choices they did. Many of the assumptions however appear unlikely to be realised especially in the London context. Our scenarios make it clear where we think they are least likely to be correct. However only time will tell.

40
Table A6 summarises the key assumptions underlying the MHCLG calculations and indicates which were revised in the LSE London calculations. We have provided a spreadsheet containing detailed calculations to London Councils. Table A6 Comparing the assumptions/inputs to the models: MHCLG and LSE
MHCLG 2017 inputs LSE revised inputs Relevant forecasting period 3 years Relevant forecasting period 5 years Base year for expenditure data 2014/15 Base year for expenditure 2017/18 Assumption of 30% fall over 3 years in main duty acceptances across all scenarios Three scenarios for evolution of acceptances
Prices rise 1% per annum for three years Prices rise in line with inflation Unit costs are the same for London as rest of England London-specific unit costs
TA costs £260/week, and is same in London as elsewhere in England
Cost of TA no longer separately modelled; incorporated in unit costs
Caseload figures based on data to 2014/15 Most recent data used The approach used for the MHCLG new burdens assessment is well-understood and legitimate (though there are other possible techniques), and the calculations provide a helpful framework for systematically considering the expenditure implications of the HRA. We therefore reverse-engineered a spreadsheet to reproduce the MHCLG calculations, then updated and simplified these calculations for London boroughs using more recent information and a more realistic set of assumptions. Our calculations differ in five main ways from the original new burdens calculations:
1) they use the most up-to-date figures, including actuals for most of 2018/19, and official inflation rates
2) the projections extend over five years (to 2022/23) rather than stopping in 2019/20 3) the method of calculating unit costs is set out explicitly 4) the caseload projections do not assume that net costs fall to zero by year 3 5) inputs are London specific.
Each of these elements is discussed below. 1 Use of most recent figures
The MHCLG new burdens assessment used projections of caseloads under the HRA, but since the Act has now been in effect for more than a year we were able to use some actual figures. We drew on MHCLG’s experimental caseload figures for the first three quarters of 2017/18 based on H-CLIC data. There was a strong view amongst interviewees that figures for Q2 2018 (the first after H-CLIC was introduced) were likely to be unreliable because local authorities were still familiarising themselves with the system (a view that the Minister accepted at the Select Committee hearing in April). We therefore computed averages for Q3 and Q4 2018 and multiplied by four to estimate annual counts by household user type. See Annex B, Table 2 for detailed figures. For expenditure we used information from our survey of London borough treasurers (both 2017/18 actuals), inflated to current prices.
We followed the approach of HM Treasury (2018) in using the GDP deflator to adjust estimates of public expenditure, rather than the 1% figure that was applied across the board by MHCLG (2017). Annex B gives ONS and OBR figures for observed inflation to 2017/18, and projections to 2020/21 respectively.

41
2 Five-year projection period As discussed above, the original new burdens assessment foresaw net costs falling to zero in Year 3, driven by an assumed 30% fall in acceptances over that period. However if we drop the a priori assumption that costs return to neutral over three years and instead model the cost effects, we find that they stretch over a longer period. We have chosen to extend the forecasting period to five years from implementation of the Act (that is, to 2022/23). 3 Calculation of London unit costs
Our unit cost calculations cover all costs of homelessness provision, not just the additional costs arising from the HRA. They are also somewhat simpler than those in the MHCLG model. We broadly followed the MHCLG’s approach in allocating costs to the different (legal) categories of homeless household, reflecting their relative use of local-authority funds. Using the most recent statistics on the number of households presenting as homeless in London in 2018/19 (see above), we estimated the number of applicants for homelessness services in six categories, as in the MHCLG calculations. These are
1. Acceptances 2. Intentionally homeless 3. Not in priority need 4. Not homeless 5. Not eligible9 6. Prevention & relief
Of these, case types 1 and 6 (acceptances and prevention & relief) account for by far the highest proportion of costs. In addition to new households presenting each year, there are those households who are already accommodated in TA. We estimated these numbers from the 2017/18 homeless statistics and P1E forms with a 2% mark-up to reflect estimated growth in household numbers in TA in the last year. The numbers in each category across London for the most recent financial year are given in Table A6. Our unit-cost model attributes all expenditure on homelessness services to these eight groups: six types of households presenting within the year, plus two types of household already in the system. Note that the new burdens assessment did not calculate costs for households already in TA (groups 7 and 8) because it was looking only at costs for new cases. Because our approach allocates costs across all cases we have included them in the tables for completeness.
9 This category does not appear in the MHCLG new burdens calculations. For the sake of completeness we included it in our modelling but the amounts involved are very small and are not reported here.

42
Table A6 LSE estimates of the number of homelessness cases in London, 2018/19
New cases: households presenting in the year by case type
Acceptances 7,520
Intentionally homeless 860
Not in priority need 1,640
Not homeless 1,180
Not eligible 1,030
Prevention & relief 51,360
Existing cases: households in TA at the start of the year
Still in TA at year end 47,308
Left during the year 8,058
Source: LSE London estimates based on MHCLG experimental statistics and P1E data According to the SLT/LSE Survey, the total cost to London local authorities of providing homelessness services was expected to be £978.6 million in 2018/19. This is a gross figure for general-fund expenditure only (that is, not including the Housing Revenue Account). The survey split expenditure into TA and non-TA, and into running costs and employee costs10, as shown in Table A7. Table A7 Predicted expenditure on homelessness by all London local authorities for
2018/19 (revenue account only) (£ 000)
cost type amount
Temporary accommodation Employees 12,481
Running costs 803,136
Administration Employees 51,933
Running costs 58,857
Prevention Employees 16,542
Running costs 16,175
Support Employees 10,913
Running costs 8,578
Total 978,615
Source: LSE London analysis of Society of London Treasurers/LSE London survey of borough finance directors In order to calculate unit costs we allocated the sub-costs from Table A7 across the various case types, from Table A6. The results are given in Table A8. The rows at the bottom of the table give total expenditure for each case type and unit costs for one year only (highlighted). The final row of the table gives counterfactual unit costs. These were 10 The categorisation of homelessness expenditure in the SLT/LSE Survey is less disaggregated than the Revenue Outturn figures used for the counterfactual unit cost (see below).

43
calculated in a similar way, albeit with different distributional weights among the homelessness user groups. Initial estimated results were inflated to 2018/19 prices using the GDP deflator.

44
Table A8 Calculation of unit costs for different case types, 2018/19
(£000)
Case type (new households)
Case type (households in TA at the start of the year)
Total
(from SLT/LSE survey) Cost type 1 2 3 4 5 6
7 In TA end
year
8 Leave TA
in year
TA Employees 937 57 39 11 0 131 10,419 887 12,481 Running costs 62,875 3,830 2,624 755 0 10,838 665,532 56,681 803,136
Admin Employees 3,493 320 305 110 5 35,781 10,986 936 51,933 Running costs 3,958 362 345 124 5 40,551 12,450 1,060 58,857
Prevention Employees 0 0 0 0 0 16,542 0 0 16,542 Running costs 0 0 0 0 0 16,175 0 0 16,175
Support Employees 379 43 83 59 0 5,175 4,767 406 10,913 Running costs 298 34 65 47 0 4,068 3,747 319 8,578
Total for type 71,940 4,646 3,461 1,107 10 129,260 707,901 60,289 978,615 Unit cost (one year) 9,566 5,402 2,110 938 10 2,517 14,964 7,482 Counterfactual 8,790 5,011 2,048 893 1,215
Source: LSE London analysis

45
Table A9 summarises our estimates of post-HRA unit costs for each user group and counterfactuals. As expected, the biggest difference between post-HRA LSE estimates and the counterfactual is for prevention and relief cases, which cost about twice as much post-HRA as pre-HRA. Because the HRA introduced more detailed review, planning and support for non-prevention and relief cases, other types also see some increase from the counterfactual levels. Unit costs from the MHCLG new burdens assessment are also provided in Table A9 for comparison. Note that the MHCLG applied the same unit costs pre- and post-HRA (i.e. they do not account for increasing costs as a result of new processes/responsibilities). Their figures are averages for England, not London, and omit the costs of certain additional duties imposed by the HRA, which were calculated separately. Table A9: LSE London estimates of post-HRA and counterfactual unit cost of homelessness by user type, 2018/19
(£ 000) LSE estimates (London) MHCLG
new burdens
(England)
Post HRA Counterfactual (non-HRA)
1 Acceptances 9,566 8,790 4,200 2 Intentionally homeless 5,402 5,011 2,200
3 Not in priority need 2,110 2,048 730 4 Not homeless 938 893 260
6 Prevention & relief 2,517 1,215 530 Source: LSE London calculations
Our unit costs capture all costs, not just the specific elements that were affected by the HRA. They also include some expenditure that was not captured in the new burdens model, particularly incentive payments to private landlords which are important in London.
4 Revised projections for caseload growth under HRA
Using these whole-year 2018/19 estimates, we calculated year-on-year rates of change since the introduction of the HRA (Table 3 of Annex B). The second quarter after the Act came into force saw substantial increases in prevention and relief cases compared to the pre-Act situation, and decreases in other case types. (Presumably this was also the case in the first quarter after the Act, but we have not used these data because of reliability concerns.) Q4 2018, which started six months after the Act came into force, saw a reversal of direction: the number of acceptances rose from the preceding quarter and the number of prevention & relief cases fell. These are the two key case types in terms of cost. This suggests that in the short term the HRA may have caused a step-change in caseload, followed by some reversion towards previous levels.
Final estimates
Our estimation period is 5 years. For the counterfactual growth rates (Table A10), we used the average change over the preceding decade for acceptances, and for other case types the average over the preceding eight years because a longer data series was not available. (See Table 4 in Annex B.)

46
Because we have observed data for most of 2018/19, we used the same growth rates for that year across the three modelling scenarios. The rates of change for caseloads in the central scenario are the same as those of the counterfactual from Year 2--that is, the rate of change will revert to trend but from the new, lower level. This is true for all case types except for prevention & relief, where the counterfactual (trend) rate of change was -0.5%. However because the HRA changed the eligibility for prevention & relief services and widened the pool of eligible households we believe it is inappropriate to apply the previous trend figure. Instead, the central expectation is that the prevention and relief caseload will increase by 2% per annum from Year 2.
Under the pessimistic scenario, the rates of change are such that caseload numbers would return in five years’ time to same level as they would have been under the counterfactual scenario—that is, that after an initial sharp drop, caseloads return to previous levels. This applies to all case types except for prevention and relief, which continues to increase. This is not entirely implausible: acceptances will only stay down if prevention and relief efforts are successful in the medium- and long term. Market pressures in the private rented sector in London suggest that some (perhaps many) households whose homelessness is initially prevented or relieved will eventually lose their homes and be accepted as statutorily homeless. The optimistic scenario is that the numbers of all case types come down and stay down or continue to decline with a rate of change of 0% from Year 2 (for case types where the counterfactual was positive) or, where the counterfactual was negative, with a continued decline. Table A10: Three scenarios for annual rates of change in caseload by case type +
counterfactual Central Pessimistic Optimistic Counterfactual Acceptances 2.3 23.3 0.0 2.3% Intentionally homeless 3.9 32.1 0.0 3.9% Not in priority need -0.5 20.9 -0.5 -0.5% Not homeless -5.7 32.7 -5.7 -5.7% Prevention & relief 2.0 3.0 0.0 -0.5%
See Annex B for source tables. Counterfactuals use ten-year simple average for acceptances; eight-year simple average for the rest.
Table A11 gives the final estimates of the post-HRA costs of homelessness services in London, compared to the counterfactual (non-HRA) situation. Under the central scenario, the HRA does not become cost-neutral for London over three years or over five. The additional cost averages £14 million per year, and continues to grow slowly over time. Under the pessimistic scenario costs grow over the next five years, driven by the return of acceptances to previous levels (although they would then plateau if the projection were carried further). Under the optimistic scenario, the HRA becomes cost-neutral for London in Year 4.

47
Table A11: Estimated additional post-HRA costs of homelessness services in London Post-HRA costs under three scenarios less counterfactuals
£ millions, inflation adjusted Scenarios central pessimistic optimistic
2018/19 11.2 11.2 11.2 2019/20 12.6 31.8 8.1 2020/21 14.0 58.0 4.7 2021/22 15.4 91.3 1.1 2022/23 16.9 133.7 -2.8 5-year total 70.0 326.0 22.2 annual average 14.0 65.2 4.4
Table A12 (repeated in the main body of the report as Table 7) sets these increased costs in context, giving an indication of the total amounts that London boroughs will need to pay from their general funds for homelessness services in London, up to 2022/23. The figures represent total costs less revenues from rent and grant. The baseline (counterfactual) figure is calculated by inflating the £201 million actual from 2017/18 (from Table 3) by the GDP deflator (see Annex B). To this baseline figure we have added the additional costs identified in Table 5 under three scenarios11. Using our central scenario we project that the call on boroughs’ general funds will rise from £215 million in 2018/19 to £237 million in 2022/23. Costs still rise, though more slowly, under the optimistic scenario, while under the pessimistic scenario they increase markedly.
Table A12: LSE London estimates of cost to boroughs of providing homelessness services in London (counterfactual non-HRA total expenditure and call on general fund, and post-HRA call on general fund under three scenarios)
(£ millions, inflation adjusted)
Counterfactual (non-HRA) total expenditure
Counterfactual (non-HRA) call on general fund
central pessimistic optimistic
2017/18 actual £919 £201 2018/19 £936 £204 £215 £215 £215 2019/20 £955 £208 £221 £240 £216 2020/21 £972 £212 £226 £270 £217 2021/22 £991 £216 £232 £308 £217 2022/23 £1,010 £220 £237 £354 £218 5-year total £4,864 £1,061 £1,131 £1,387 £1,083
11 The outputs of LSE’s model are the figures in Table 5 for additional post-HRA expenditure. The overall call on the general fund was not specifically modelled; the counterfactual (baseline) expenditure figure was estimated by inflating the 2017/18 expenditure figure from the SLT survey, and added to the outputs of the LSE model. The figures should be regarded as indicative and are probably underestimates, as SLT forecasts for expenditure in 2018/19 are somewhat higher (see Table A7).

48
Table A13 compares the central estimate of increased costs for London with the amounts received by London local authorities through the new burdens allocations. (Although the HRA took effect in April 2018 the first tranche of funding was allocated in the previous financial year, to enable preparations to be made.) The new burdens funding for London totalled £30.2 million, including £10.8m prior to the implementation of the Act to help preparations, and is due to end in 2019/20. Our analysis indicates that the HRA changes will not be cost-neutral for London in the medium term. The shortfall in funding is £50.8 million over the five-year projection period from 2018/19 to 2022/23. Table A13: LSE London central estimates vs new burdens allocations
(£ millions, inflation adjusted)
LSE central estimate
of additional costs
MHCLG
new burdens allocations
2017/18 [10.8]12 10.8 2018/19 11.2 9.9 2019/20 12.6 9.4 2020/21 14.0 0 2021/22 15.4 0 2022/23 16.9 0 6-year total 80.9 30.1 6-year shortfall
50.8
12 The specification of the model did not allow us to estimate additional costs in 2017/18, the year prior to HRA implementation. We have assumed that the £10.8 million of new burdens funding given to boroughs in 2017/18 was all spent on preparations in the course of that year, and that it covered additional costs in full.

49
Annex B Data tables Table B1: HRA New burdens funding received by London boroughs
Borough 2017/18 2018/19 2019/20 3-year total Barking and Dagenham £367,442 £336,576 £318,371 £1,022,389 Barnet £353,391 £323,706 £306,196 £983,293 Bexley £203,370 £186,287 £176,211 £565,868 Brent £449,600 £411,833 £389,557 £1,250,990 Bromley £254,713 £233,317 £220,697 £708,727 Camden £315,732 £289,211 £273,567 £878,510 City £6,571 £6,019 £5,693 £18,283 Croydon £464,460 £425,446 £402,433 £1,292,339 Ealing £415,925 £380,988 £360,379 £1,157,292 Enfield £459,674 £421,062 £398,286 £1,279,022 Greenwich £367,215 £336,369 £318,175 £1,021,759 Hackney £495,866 £454,213 £429,644 £1,379,723 Hammersmith and Fulham £224,899 £206,007 £194,864 £625,770 Haringey £444,170 £406,860 £384,853 £1,235,883 Harrow £182,810 £167,454 £158,396 £508,660 Havering £232,196 £212,692 £201,187 £646,075 Hillingdon £281,444 £257,802 £243,858 £783,104 Hounslow £313,049 £286,753 £271,242 £871,044 Islington £389,295 £356,594 £337,306 £1,083,195 Kensington and Chelsea £188,256 £172,442 £163,115 £523,813 Kingston upon Thames £100,673 £92,217 £87,229 £280,119 Lambeth £487,175 £446,252 £422,114 £1,355,541 Lewisham £443,488 £406,235 £384,262 £1,233,985 Merton £157,294 £144,081 £136,288 £437,663 Newham £577,130 £528,651 £500,056 £1,605,837 Redbridge £311,260 £285,114 £269,692 £866,066 Richmond upon Thames £100,008 £92,523 £87,519 £280,050 Southwark £474,625 £434,757 £411,240 £1,320,622 Sutton £151,492 £138,766 £131,260 £421,518 Tower Hamlets £558,565 £511,646 £483,970 £1,554,181 Waltham Forest £427,920 £391,974 £370,772 £1,190,666 Wandsworth £297,159 £272,197 £257,474 £826,830 Westminster £352,267 £322,677 £305,223 £980,167 LONDON TOTALS £10,849,134 £9,938,721 £9,401,129 £30,188,984

50
Table B2: GDP deflator inflation: observed and estimated 2017-18 = 100 change (% p.a.) 2014-15 95.143 1.28 2015-16 95.904 0.80 2016-17 98.088 2.28 2017-18 100.000 1.95 2018-19 1.78 2019-20 2.00 2020-21 1.84
Source: ONS (2019) for observation. OBR (2019) for forecast. Table B3 Estimated count by HL user type for 2018/19
Case type Quarter Quarterly
case count
% change Annual
count for 2018/19 From
preceding quarter
From same
quarter previous
year
Acceptances Q32018 1,860 -1.1 -57.7 7520 Q42018 1,900 2.2 -48.5
Intentionally homeless
Q32018 230 4.5 -61.7 860 Q42018 200 -13.0 -61.5
Not in priority need
Q32018 340 25.9 -64.2 1,640 Q42018 480 41.2 -44.2
Not homeless Q32018 370 -31.5 -73.0 1,180 Q42018 220 -40.5 -82.4
Prevention & relief
Q32018 13,560 8.1 87.0 5,1360 Q42018 12,120 -10.6 71.4
Table B4 Caseload growth rate under HRA for 2018/19 by HL user type cost type Year Count Annual
change
Acceptances 2017/18 15,480
-51.4 2018/19 7,520
Intentionally homeless 2017/18 2,170
-60.4 2018/19 860
Not in priority need 2017/18 3,600
-54.4 2018/19 1,640
Not homeless 2017/18 4,910
-76.0 2018/19 1,180
Prevention & relief 2017/18 30,790
66.8 2018/19 51,360 Source: MHCLG Homeless Statistics for 2017/18. Authors’ analysis for 2018/19.

51
Table B5 Caseload count (first column) and annual growth rate (second column) by homelessness service user type
Acceptances Intentionally homeless Not in priority need Not homeless Prevention & relief
Count % change Count %
change Count % change Count %
change Count % change
2007/08 13,800 n.a. n.a. n.a. n.a.
2008/09 12,780 -7.4% n.a. n.a. n.a. n.a.
2009/10 9,470 -25.9% 1,670 3,920 8,100 32,620
2010/11 10,180 7.5% 1,770 6.0% 4,460 13.8% 8,910 10.0% 32,920 0.9%
2011/12 12,730 25.0% 1,890 6.8% 4,040 -9.4% 8,180 -8.2% 29,810 -9.4%
2012/13 15,660 23.0% 2,330 23.3% 4,470 10.6% 8,400 2.7% 30,300 1.6%
2013/14 17,030 8.7% 2,270 -2.6% 5,080 13.6% 7,910 -5.8% 34,100 12.5%
2014/15 17,530 2.9% 2,360 4.0% 4,870 -4.1% 7,260 -8.2% 31,080 -8.9%
2015/16 19,180 9.4% 2,560 8.5% 4,260 -12.5% 6,000 -17.4% 29,520 -5.0%
2016/17 18,070 -5.8% 2,580 0.8% 3,940 -7.5% 5,070 -15.5% 29,720 0.7%
2017/18 15,480 -14.3% 2,170 -15.9% 3,600 -8.6% 4,910 -3.2% 30,790 3.6% Source: P1E quarterly. Note: Four-quarter sums may not agree with annual totals due to rounding

52
Annex C: Case Studies of innovative practice
We undertook five case studies of innovative borough practices around homelessness. Each involved interviews with relevant borough officers and we made several site visits.
1) New building technologies LB Lewisham: PLACE/Ladywell
Almost all London boroughs are finding it increasingly difficult to secure temporary accommodation for homeless households. One solution is the use of precision manufactured accommodation, which has been pioneered by the London borough of Lewisham. A large council-owned site just south of Lewisham town centre became vacant a few years ago when an aging leisure centre was replaced by new facilities nearby. Anticipating a protracted debate over the future long term land use, the council saw an opportunity for an interim use and decided to construct purpose-built housing for homeless families with children using pioneering modular construction techniques. In 2014, when the proposals were starting to move forward, modular construction had been used for hotels and for some schools but not to any great extent for residential use and not for affordable housing. Working with the architectural practice Rogers Stirk Harbour + Partners, Lewisham chose to use timber frames with magnesium oxide panels—one of a number of possible modular methods. The planning application was submitted at the end of 2014 and, following consultation, permission was granted in May 2015. Construction started on site in September 2015 with the rest of the year spent on groundwork. Rather than full foundations the modules rest on concrete pads 0.5m deep. The units themselves are manufactured from standard timber components and fully fitted out with bathroom, kitchen, flooring and all finishes in the factory. Each apartment is made up of two ‘boxes’, one comprising the bedrooms and the other the bathroom, kitchen and living area with electrical and water connections. In February 2016, the apartments and four community/retail units were transported by road from the factory in Derbyshire and lifted into place, then linked together. Construction on site had largely finished by May 2016 and June was spent on fitting out the ground floor non-residential units. Each of the 24 apartments provides a high quality homes that exceeds the London Space Standards by 10%. Floor-to-ceiling heights are 2.6m, and full-height windows and doors give a feeling of spaciousness. Fixtures and fittings are of a better quality than in much new-build accommodation. Inevitably with a new building technology there have been lessons learnt both in the design and in the construction process, and future projects will likely take only 9-11 months from initial on-site work to occupation. LB Lewisham is currently taking forward a further three sites to be delivered using innovative precision manufacturing techniques. One site will provide 34 units of temporary accommodation and the other two will provide 78 permanent council homes. All homes will be high quality and genuinely affordable homes. Whilst PLACE/Ladywell was designed to be dismantled and reused on another site, the next generation will be permanently in place. Each of the new sites will provide more accommodation than PLACE/Ladywell, and start to move towards delivering new Council homes at scale using this technology.

53
The speed of modular construction is a clear advantage helping Councils to deliver more accommodation efficiently. Furthermore, as in the case of PLACE/Ladywell, it also offers good opportunity for the interim use of otherwise vacant sites. Not counting the value of the land, PLACE/Ladywell cost about £160,000 per two-bed flat (including lifts and walkways fitted on site), compared to approximately £200,000 for a standard build two-bed flat. The next generation of modular units may entail higher building costs, but will continue to benefit from the advantages of an efficient and precise manufacturing process. Off-site manufacture in controlled conditions results in far less waste, shorter construction times, reduced on-site disruption. The timber frames are more sustainable than traditional building methods, with the purpose-built and -designed units promoting improved housing management and reduced maintenance costs. Cost and programme certainty help Councils to manage risks and plan for the future, delivering new homes to meet a growing variety of local needs.
2) Innovative use of financial resources LB Camden
The central-London borough of Camden has some of the highest-priced housing in the UK (indeed the world), and the price of private accommodation has risen steeply over recent years. The demographics of the borough have changed correspondingly. Over the last decade or so, lower- and middle-income households unable to afford rents in the private rented sector (PRS) in Camden have moved out of the borough or out of London entirely. The households that remain tend to be either very wealthy or relatively poor, and those presenting as homeless often have very complex needs. Some time ago, Camden decided to centre its homelessness services on the principle of prevention. As this strategy had been previously adopted, Camden was already fulfilling many of the obligations of the Homelessness Reduction Act when it came into effect in April 2018. When a household approaches Camden for help, the first instinct is to try to prevent them losing their home or help them resolve the problem for themselves. If homelessness cannot be prevented in this way the preferred option is to support people into the PRS. If a household voluntarily accepts a PRS placement through the prevention route, they are offered up to three suitable properties. Once a choice has been made and accommodation accepted the household remains in the social-housing allocation process, receiving additional points for accepting the PRS tenancy and a doubling of points six months into the tenancy. If, however, the household rejects all three PRS properties or is accepted as homeless under the main duty, only one offer of PRS accommodation is provided and the household is disqualified from the social housing allocation process. As a result, the PRS is used for the majority of new cases each year; those households that do enter temporary accommodation have often refused a PRS offer or are deemed to be too vulnerable to be suitable for a private tenancy at that time. A significant focus of officers’ work is thus procurement of suitable private sector properties. Like most boroughs, Camden has found it necessary to pay financial incentives to PRS landlords to encourage them to work with the borough; they also sometimes provide a legal cover insurance policy. The borough predominantly negotiates 12-month fixed term ASTs and may also guarantee rent for the first year; and in certain circumstances offers a support package for two years. Because of Camden’s tight housing market, it is increasingly difficult to find suitable PRS accommodation within the borough. Growing numbers of households are placed in neighbouring boroughs or elsewhere in London (although even in outer London boroughs, rents are now are becoming prohibitively expensive).

54
In all cases the council’s intention is to achieve a sustained tenancy rather than a ‘revolving door’ so it provides all new PRS tenants with training in ‘Good Tenancy’ and provides a floating support worker to help households adapt to their changed circumstances. Because of the success of this approach, as well as the demographic trends noted above, Camden has an unusually low number of households in TA compared to other inner London boroughs. Key lessons Camden’s example suggests that using resources to help households achieve sustainable PRS tenancies can help reduce the numbers in temporary accommodation.
3) Re-designing services LB Barking & Dagenham
In recent years the demographics of LB Barking and Dagenham have changed rapidly. The population is increasingly diverse, and the borough has a growing and relatively transient young population, but at the same time many of the social and poverty challenges have remained. In response to these changes, and to ongoing financial pressures, the council decided to rethink its approach to supporting resident wellbeing. In a process known as Community Solutions, the borough took 18 different services and reorganised them into five different units called ‘lifecycles’, each aimed at a certain group of residents with varying needs and self-sufficiency. The services involved included libraries, employment, housing and homelessness, anti-social behaviour, safeguarding and parts of children’s services, adult social care, further education etc. In the wake of the reorganisation over 450 employees received new job descriptions. After a design process that took 18-24 months, a soft launch was held in October 2017 and Community Solutions went live in April 2018. By breaking down the old silo mentalities, the intention was to get employees to bring new ideas to achieve four main objectives:
• to foster resilience and independence by helping people to help themselves; • to resolve problems early by intervening with challenges such as family debt or
behaviour issues; • to manage demand through providing services in a range of places across the
borough and working collaboratively and, finally, • to reduce costs and generate savings.
Homelessness services were changed so as to be more accessible and responsive. New Homes and Money Hubs support residents with money, debt and housing worries. Housing advice and homelessness prevention support is now available in nine locations across the borough, with a tenth specifically for homeless on the day, in contrast to the previous single location. Borough officers say implementation cost approximately £800,000 (largely on consultant support). They expect the reorganisation to lead to savings in future as the new approach enables earlier and more effective intervention with target households, £5m expected over 4 years with £3m already realised.

55
Key lessons The reorganisation seems to have boosted both performance and outcomes. Under the previous structure, LB Barking and Dagenham was usually ranked in the bottom third of London boroughs across a range of services, and for seven of nine key indicators including homelessness it was in 30th, 31st or 32nd place. Now it has moved to 16th place. Since April 2018 when Community Solutions went live to the end of March 2019, the total number of households in TA has fallen from 1865 to 1697. The numbers of new households in temporary accommodation also fell significantly, while monthly homelessness preventions more than doubled. Borough officers attribute these changes to the introduction of Community Solutions.
4) Partnership approach to single homelessness LB Brent
A 2016 outcomes-based review in Brent identified a group of vulnerable people, largely singles and frequently with mental health, drink or drug problems, who did not meet the legal vulnerability threshold for priority need and whose housing needs were not being adequately addressed. Anticipating increased demand from this cohort following passage of the Homelessness Reduction Act, the borough put together a successful bid for Trailblazer funding. This government pot provided £900,000, which was match funded by Brent for a total of £1.8m. Understanding that this is a problem it can’t solve alone, LB Brent decided to commission a service led by voluntary sector providers with more direct experience with this particular cohort. The new service, known as the new Single Homelessness Prevention Service (SHPS), began operation in September 2017. The delivery partners are Crisis and Thames Reach, who are supported by Bridges Fund Management through its Homelessness Social Impact Bond. When a potentially eligible person approaches the borough, LB Brent carries out an initial assessment. If the individual is either homeless or threatened with homelessness, eligible, and in priority need, LB Brent retains responsibility. Individuals not considered to be in priority need are referred to SHPS to prevent or relieve their homelessness. Rather than commissioning the service and paying up front, the local authority pays the providers based on specified outcomes, as follows:
• Completion of a Personal Housing Plan. For each plan completed and agreed with an applicant, a payment of £300 is made.
• Prevention or relief of homelessness. Following quality checks on the accommodation and on the outcome of the prevention, SHPS invoices for a further £750.
• Tenancy outcome sustained. After eight months, investigations are made to ensure that the tenancy is continuing with no threats of eviction etc or risks of homelessness. If this outcome is achieved SHPS invoices for a further £750.

56
Before the service began to operate there was concern clients might ‘ping-pong’ back and forth between the local authority and SHPS, but close partnership working has averted this: the organisations have a shared understanding, especially of the appropriate level of vulnerability to make a referral to SHPS. Before April 2018, the borough expected to see a post-HRA increase in the numbers of single people coming forward. Pre-HRA, around 70% of single applicants were deemed not to be high priority, so the borough expected to refer the same proportion to SHPS. In practice Brent found that the number of single people presenting did rise, but that more of them are vulnerable and therefore remain the borough’s responsibility. During the planning phase the expectation was that SHPS would deal with roughly equal numbers of relief and prevention cases. However, in the event the proportion of applicants who are already homeless has been closer to 80%. In response the partners have worked to raise awareness in the community and encourage people to come forward before they are homeless. There was an issue around expectations, as some single people believed they would be eligible for council housing once the HRA came into effect. Once they learned that they would be seen by SHPS and offered accommodation in the PRS, a proportion dropped out and never attended their interviews. Families have been accommodated in the PRS since 2012, but this has been less common for singles and there has been an element of myth busting and managing expectations as the scheme has unrolled. Other boroughs are now following Brent’s lead, with 13 boroughs joining in an application to the Life Chances Fund to extend the scheme in phases. An in-principle grant of £4.73m has been awarded to Bridges and the boroughs now working towards the full grant. The boroughs involved are expected to learn from one another; there are clearly common issues, but the model allows each borough to specify its own requirements. Key lessons This model has an inherent flexibility that allows it to evolve over time. The incentive system built into the contract is key: SHPS regularly chases Brent for referrals, because unless it delivers outcomes it earns no income. The approaches taken by SHPS to achieve targets have also been both flexible and innovative. Bridges provides the funding through the social impact bond and absorbs much of the risk. The resulting approach of procurement and payment by results means that the borough only pays when a client’s homelessness is successfully prevented or relieved, ensuring a greater focus on long term results.
5) New approaches to borough-owned and -leased housing LB Enfield and LB Islington
In recent years several boroughs have initiated schemes to acquire additional properties to use for TA. LB Enfield and LB Islington offer two contrasting approaches In 2014, the borough of Enfield set up its own wholly-owned company known as Housing Gateway Ltd., with the intention of purchasing local housing in order to reduce the pressure exercised by TA on the council’s budge specifically to provide alternative afflordable and secure prs housing to enable the Council to discharge its duty and also to acquire and lease back to the council temporary accommodation at cost. Initially it was charged with acquiring 500 properties in five years, a target it met 18 months early. These properties include 300

57
street properties, mainly two- to four-bed houses, as well as a block of 124 flats in Enfield and another in Harlow, Essex, with 83 flats. Housing Gateway also assists when the borough is looking to use homes on a meanwhile basis pending regeneration. The vacated properties are refurbished and let to homeless families on private tenancies enabling discharge of duty. These properties suit families who do not want to move into conventional PRS homes, though they are advised that they are not a permanent solution. Some regeneration properties are available for up to 7 years (vs 2.5 years for the average PRS let). As well as buying its own property, Enfield works proactively with landlords and letting agents to procure private rented housing to try to reduce the amount of nightly-paid TA they use. They have recently taken on an additional 5 posts to make a total of 8 people trying to source PRS. The borough has established Enfield Lets and taken the domain name to provide a clear branding, and believes that local letting agents are now advising landlords, particularly small-scale operators, to consider working with the council because it offers guaranteed rent, fewer voids and less hassle. In 2006 Enfield was in contact with around seven local agents, but now deals regularly with 400. The policy has been very successful; officers estimate that Enfield saved £2m per year on the cost of nightly-paid accommodation since 2014. Housing Gateway has recently had a growth plan approved as part of its new Business Strategy which will see further investment into property acquisition including for special needs groups to assist adult social care priorities and childrens services in regard to care leaver and young people’s housing. In Islington the starting point for the acquisition strategy was, like Enfield, concern about the amount spent on private accommodation for TA, which had reached about £9 million per annum. At the same time there were concerns about the standards of the accommodation being provided, as the LHA and benefits cap limited searches to the bottom decile of the property market. The acquisitions programme started in September 2018 with a target to purchase 50 properties for TA within the year. Six months later Islington had acquired 49 properties and 15 had been let. All 49 are within Islington and the majority of the properties are ex right to buy properties on council estates. A ceiling of £400,000 per property means that most of the purchases are two- and three-bed flats. Islington’s success in acquiring the properties can be partly attributed to experienced staff with good negotiating skills, who are adept at building relationships with local estate agents. But Islington also presented as a cash buyer, able to progress the sale quickly and consequently was appealing to many sellers. Acquisitions were partly funded with RTB receipts. The borough’s analysis showed that the strategy would deliver significant savings over ten years, but there is now a question mark over whether the government will continue to allow the use of RTB receipts for this purpose. Through these and other actions, Islington’s overall target is to reduce reliance on the PRS by 30% by 2020. Whilst good progress has been made in achieving this, there is concern that the proposed abolition of S21, whilst potentially benefiting tenants, might make it harder to find landlords prepared to take on local authority tenants. Key lessons By acquiring properties outside the Housing Revenue Account boroughs may be able to accommodate homeless households more quickly and economically.

London Councils 59½ Southwark Street London SE1 0AL www.londoncouncils.gov.uk
Publication date: September 2019Images: Photofusion/Thinkstock