full report sibor 3-2017 - martino...
TRANSCRIPT
Table of Contents Staten Island Residential Overview 2 Staten Island Residential Key Metrics 3 North Shore Residential Overview 4 Greater St. George Metrics 5 North Shore Metrics 6 Mid Island Residential Overview 7-8East Shore Metrics 9The Hills Metrics 10The Lakes Metrics 11Heartland Metrics 12South Shore Residential Overview 13Gateway Metrics 14South Shore Metrics 15Overall Staten Island Detailed Metrics 16-25
Charles Martino and Martino Realty are pleased to present our First Quarter 2017 Staten Island Residential Market Report.
We sincerely hope that the information found within assists you in making the correct decisions regarding your property or a potential property you may be interested in acquiring.
Martino Realty is always here to help. Do not hesitate to call or email us at any time, and we will answer any questions you may have.
Charles Martino President-Martino Realty
Martino Realty 7448 amboy road, Staten island, NY 10307
www.Martino-Realty.com (718) 608-9400
First Quarter 2017 Staten Island Residential Real Estate Report
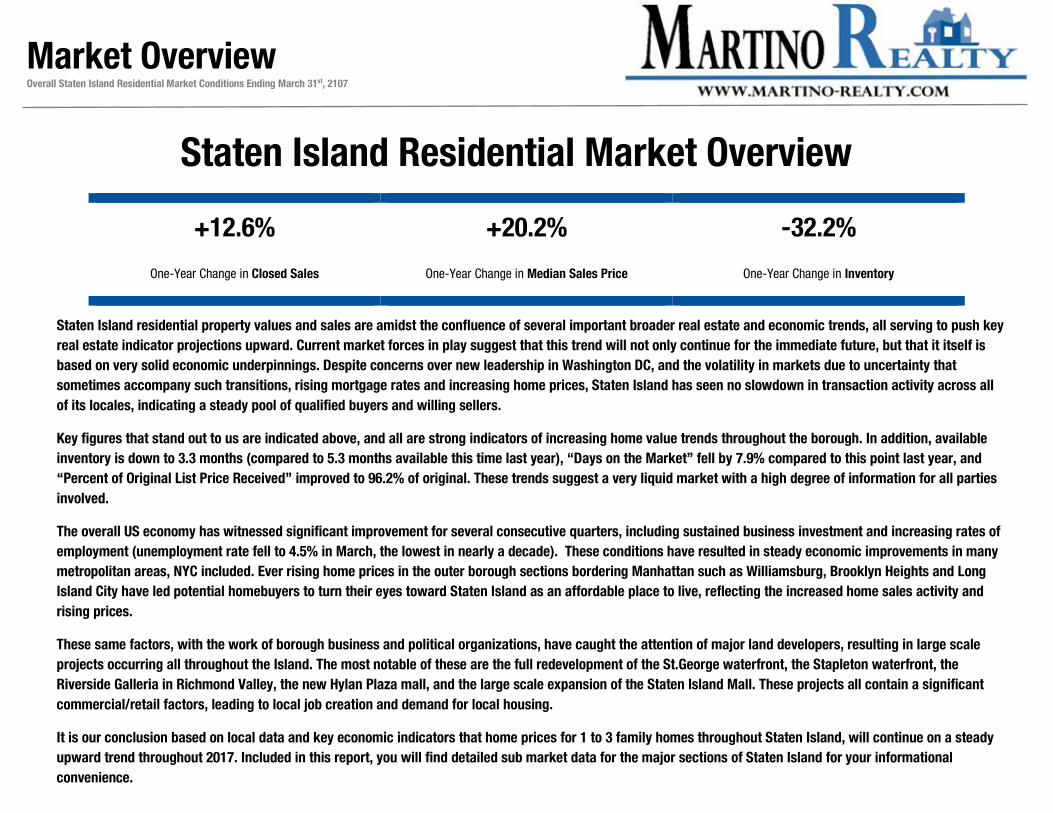
+12.6% +20.2% -32.2%
One-Year Change in Closed Sales One-Year Change in Median Sales Price One-Year Change in Inventory
Staten Island residential property values and sales are amidst the confluence of several important broader real estate and economic trends, all serving to push key real estate indicator projections upward. Current market forces in play suggest that this trend will not only continue for the immediate future, but that it itself is based on very solid economic underpinnings. Despite concerns over new leadership in Washington DC, and the volatility in markets due to uncertainty that sometimes accompany such transitions, rising mortgage rates and increasing home prices, Staten Island has seen no slowdown in transaction activity across all of its locales, indicating a steady pool of qualified buyers and willing sellers.
Key figures that stand out to us are indicated above, and all are strong indicators of increasing home value trends throughout the borough. In addition, available inventory is down to 3.3 months (compared to 5.3 months available this time last year), “Days on the Market” fell by 7.9% compared to this point last year, and “Percent of Original List Price Received” improved to 96.2% of original. These trends suggest a very liquid market with a high degree of information for all parties involved.
The overall US economy has witnessed significant improvement for several consecutive quarters, including sustained business investment and increasing rates of employment (unemployment rate fell to 4.5% in March, the lowest in nearly a decade). These conditions have resulted in steady economic improvements in many metropolitan areas, NYC included. Ever rising home prices in the outer borough sections bordering Manhattan such as Williamsburg, Brooklyn Heights and Long Island City have led potential homebuyers to turn their eyes toward Staten Island as an affordable place to live, reflecting the increased home sales activity and rising prices.
These same factors, with the work of borough business and political organizations, have caught the attention of major land developers, resulting in large scale projects occurring all throughout the Island. The most notable of these are the full redevelopment of the St.George waterfront, the Stapleton waterfront, the Riverside Galleria in Richmond Valley, the new Hylan Plaza mall, and the large scale expansion of the Staten Island Mall. These projects all contain a significant commercial/retail factors, leading to local job creation and demand for local housing.
It is our conclusion based on local data and key economic indicators that home prices for 1 to 3 family homes throughout Staten Island, will continue on a steady upward trend throughout 2017. Included in this report, you will find detailed sub market data for the major sections of Staten Island for your informational convenience.
Staten Island Residential Market Overview
Market Overview Overall Staten Island Residential Market Conditions Ending March 31st, 2107
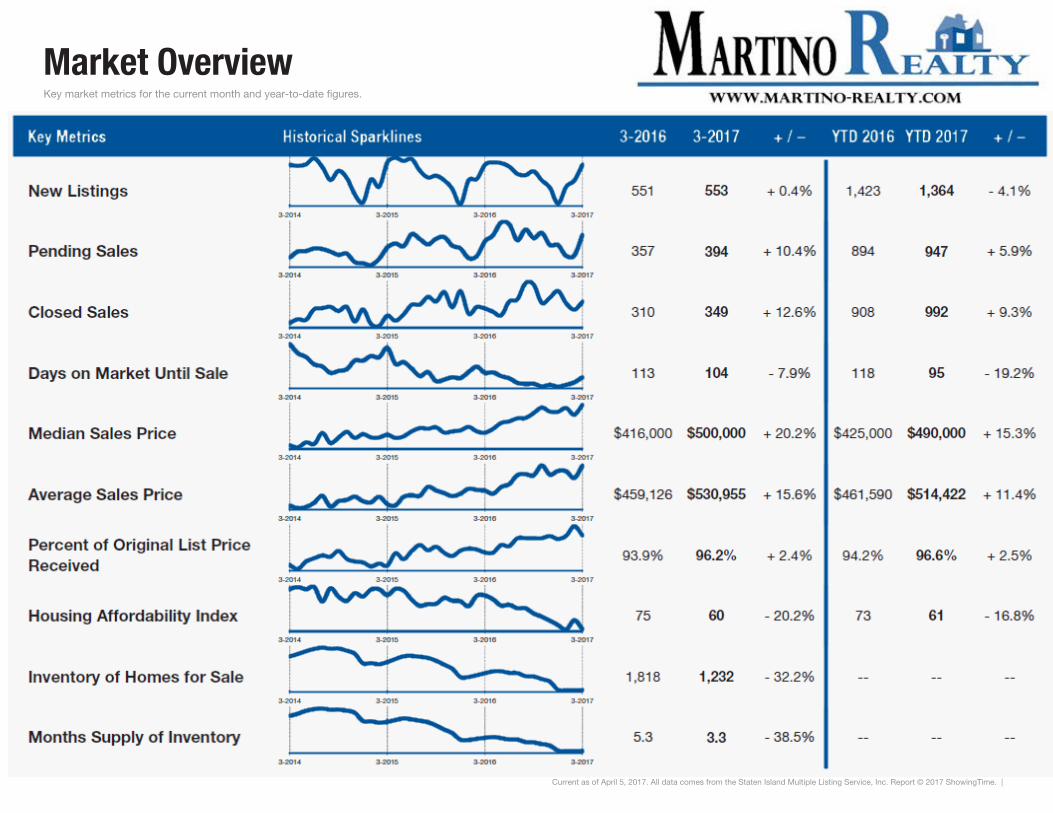
Market Overview Key market metrics for the current month and year-to-date figures.
Current as of April 5, 2017. All data comes from the Staten Island Multiple Listing Service, Inc. Report © 2017 ShowingTime. |
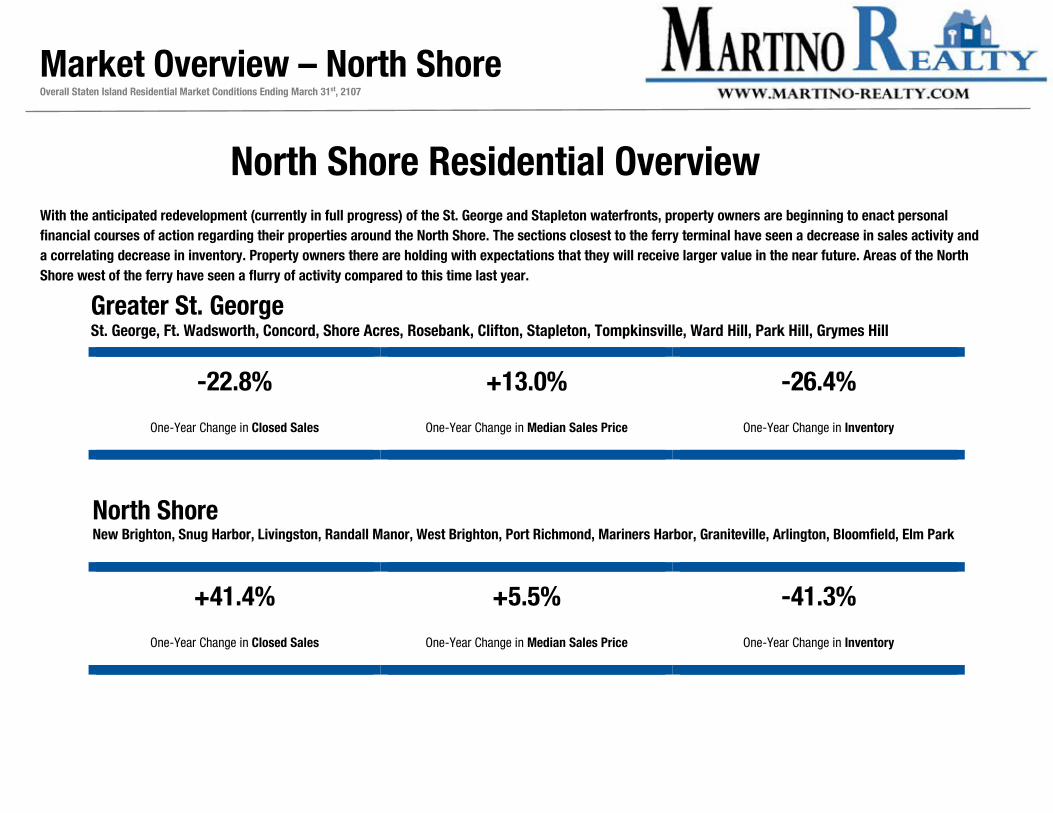
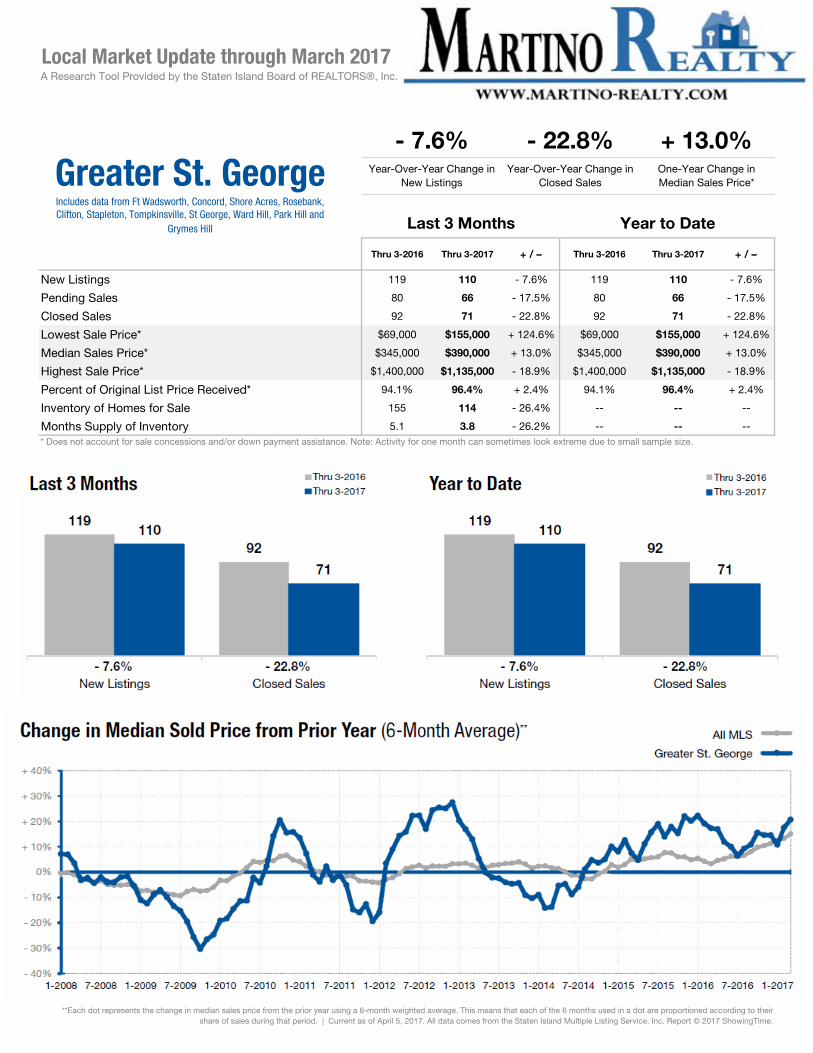
-22.8% +13.0% -26.4%
One-Year Change in Closed Sales One-Year Change in Median Sales Price One-Year Change in Inventory
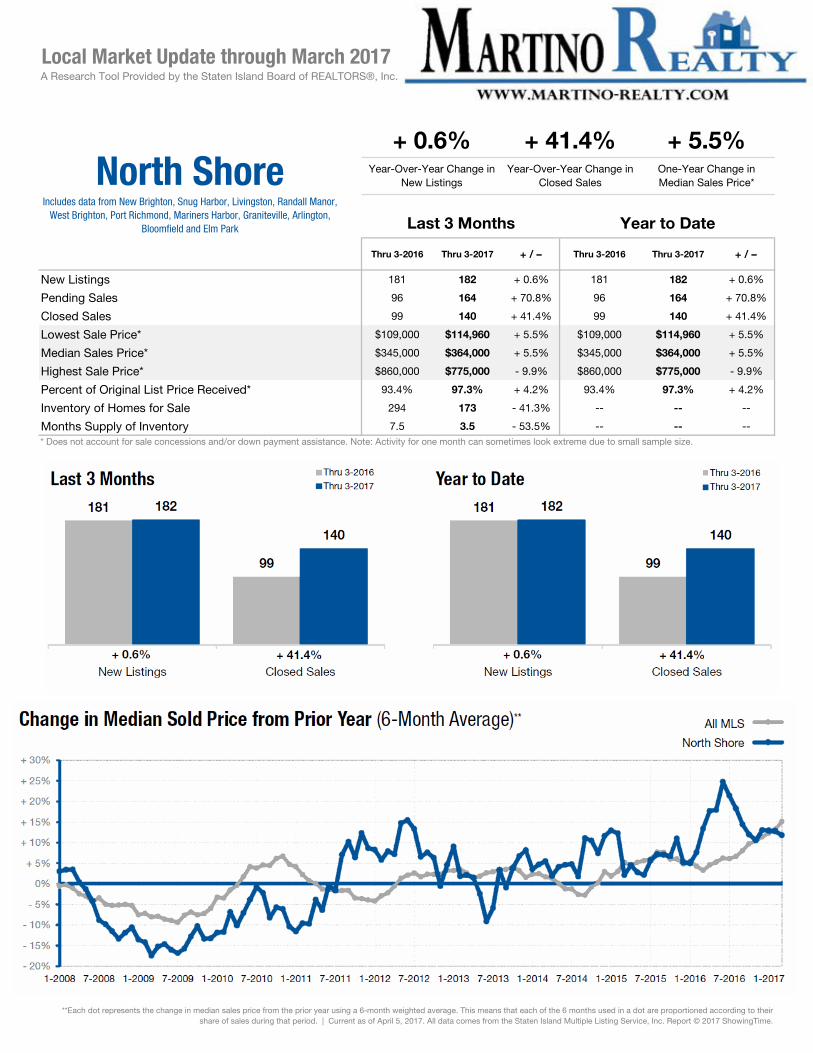
+41.4% +5.5% -41.3%
One-Year Change in Closed Sales One-Year Change in Median Sales Price One-Year Change in Inventory
Market Overview – North Shore
Overall Staten Island Residential Market Conditions Ending March 31st, 2107
North Shore Residential Overview With the anticipated redevelopment (currently in full progress) of the St. George and Stapleton waterfronts, property owners are beginning to enact personal financial courses of action regarding their properties around the North Shore. The sections closest to the ferry terminal have seen a decrease in sales activity and a correlating decrease in inventory. Property owners there are holding with expectations that they will receive larger value in the near future. Areas of the North Shore west of the ferry have seen a flurry of activity compared to this time last year.
Greater St. George St. George, Ft. Wadsworth, Concord, Shore Acres, Rosebank, Clifton, Stapleton, Tompkinsville, Ward Hill, Park Hill, Grymes Hill
North Shore New Brighton, Snug Harbor, Livingston, Randall Manor, West Brighton, Port Richmond, Mariners Harbor, Graniteville, Arlington, Bloomfield, Elm Park
Thru 3-2016 Thru 3-2017 + / – Thru 3-2016 Thru 3-2017 + / –
New Listings 119 110 - 7.6% 119 110 - 7.6%
Pending Sales 80 66 - 17.5% 80 66 - 17.5%
Closed Sales 92 71 - 22.8% 92 71 - 22.8%
Lowest Sale Price* $69,000 $155,000 + 124.6% $69,000 $155,000 + 124.6%
Median Sales Price* $345,000 $390,000 + 13.0% $345,000 $390,000 + 13.0%
Highest Sale Price* $1,400,000 $1,135,000 - 18.9% $1,400,000 $1,135,000 - 18.9%
Percent of Original List Price Received* 94.1% 96.4% + 2.4% 94.1% 96.4% + 2.4%
Inventory of Homes for Sale 155 114 - 26.4% -- -- --
Months Supply of Inventory 5.1 3.8 - 26.2% -- -- --
+ 13.0%Year-Over-Year Change in
New ListingsYear-Over-Year Change in
Closed SalesOne-Year Change in Median Sales Price*
Last 3 Months Year to Date
* Does not account for sale concessions and/or down payment assistance. Note: Activity for one month can sometimes look extreme due to small sample size.
**Each dot represents the change in median sales price from the prior year using a 6-month weighted average. This means that each of the 6 months used in a dot are proportioned according to their share of sales during that period. | Current as of April 5, 2017. All data comes from the Staten Island Multiple Listing Service, Inc. Report © 2017 ShowingTime.
Local Market Update through March 2017A Research Tool Provided by the Staten Island Board of REALTORS®, Inc.
- 7.6% - 22.8%
Greater St. GeorgeIncludes data from Ft Wadsworth, Concord, Shore Acres, Rosebank, Clifton, Stapleton, Tompkinsville, St George, Ward Hill, Park Hill and
Grymes Hill
Thru 3-2016 Thru 3-2017 + / – Thru 3-2016 Thru 3-2017 + / –
New Listings 181 182 + 0.6% 181 182 + 0.6%
Pending Sales 96 164 + 70.8% 96 164 + 70.8%
Closed Sales 99 140 + 41.4% 99 140 + 41.4%
Lowest Sale Price* $109,000 $114,960 + 5.5% $109,000 $114,960 + 5.5%
Median Sales Price* $345,000 $364,000 + 5.5% $345,000 $364,000 + 5.5%
Highest Sale Price* $860,000 $775,000 - 9.9% $860,000 $775,000 - 9.9%
Percent of Original List Price Received* 93.4% 97.3% + 4.2% 93.4% 97.3% + 4.2%
Inventory of Homes for Sale 294 173 - 41.3% -- -- --
Months Supply of Inventory 7.5 3.5 - 53.5% -- -- --
+ 5.5%Year-Over-Year Change in
New ListingsYear-Over-Year Change in
Closed SalesOne-Year Change in Median Sales Price*
Last 3 Months Year to Date
* Does not account for sale concessions and/or down payment assistance. Note: Activity for one month can sometimes look extreme due to small sample size.
**Each dot represents the change in median sales price from the prior year using a 6-month weighted average. This means that each of the 6 months used in a dot are proportioned according to their share of sales during that period. | Current as of April 5, 2017. All data comes from the Staten Island Multiple Listing Service, Inc. Report © 2017 ShowingTime.
Local Market Update through March 2017A Research Tool Provided by the Staten Island Board of REALTORS®, Inc.
+ 0.6% + 41.4%
North ShoreIncludes data from New Brighton, Snug Harbor, Livingston, Randall Manor,
West Brighton, Port Richmond, Mariners Harbor, Graniteville, Arlington, Bloomfield and Elm Park
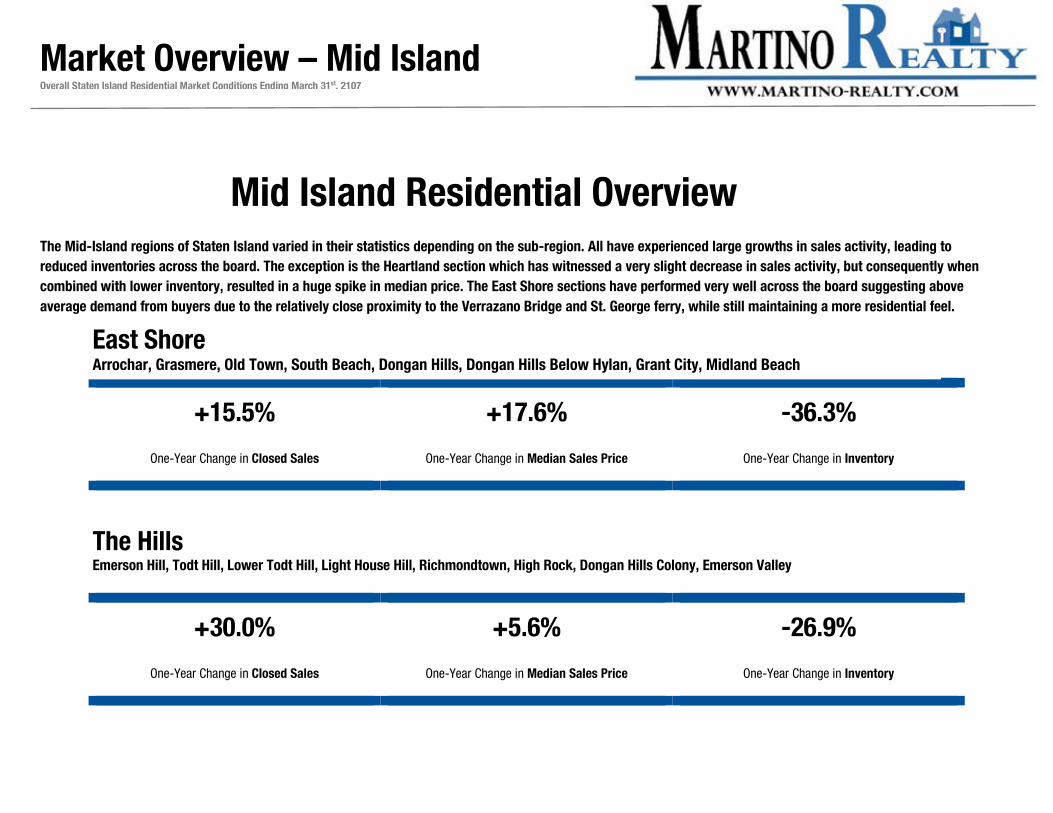
+15.5% +17.6% -36.3%
One-Year Change in Closed Sales One-Year Change in Median Sales Price One-Year Change in Inventory
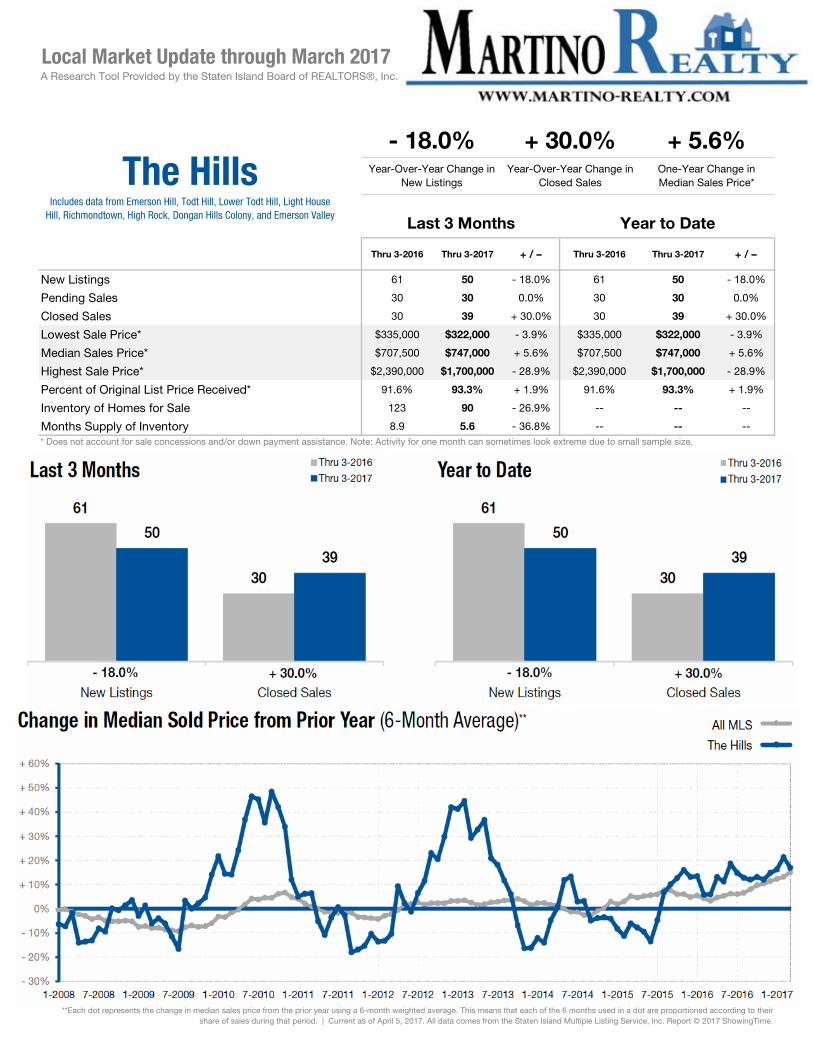
+30.0% +5.6% -26.9%
One-Year Change in Closed Sales One-Year Change in Median Sales Price One-Year Change in Inventory
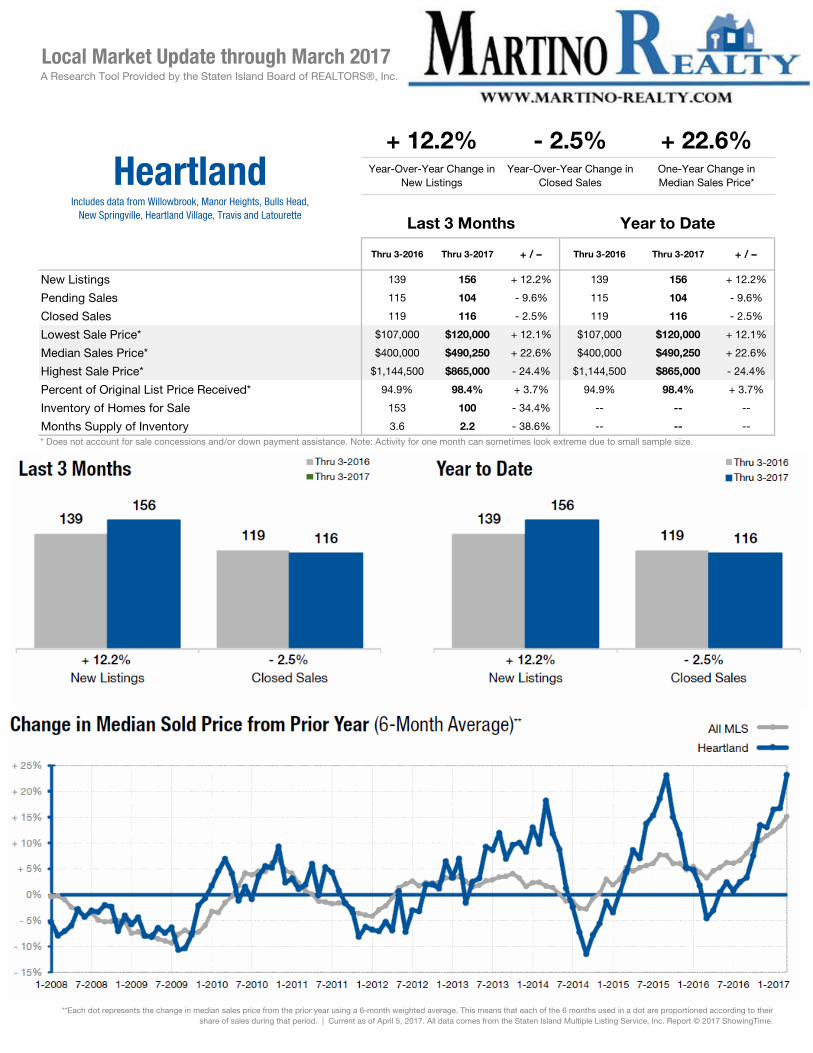
Mid Island Residential Overview The Mid-Island regions of Staten Island varied in their statistics depending on the sub-region. All have experienced large growths in sales activity, leading to reduced inventories across the board. The exception is the Heartland section which has witnessed a very slight decrease in sales activity, but consequently when combined with lower inventory, resulted in a huge spike in median price. The East Shore sections have performed very well across the board suggesting above average demand from buyers due to the relatively close proximity to the Verrazano Bridge and St. George ferry, while still maintaining a more residential feel.
East Shore Arrochar, Grasmere, Old Town, South Beach, Dongan Hills, Dongan Hills Below Hylan, Grant City, Midland Beach
The Hills Emerson Hill, Todt Hill, Lower Todt Hill, Light House Hill, Richmondtown, High Rock, Dongan Hills Colony, Emerson Valley
Market Overview – Mid IslandOverall Staten Island Residential Market Conditions Ending March 31st, 2107
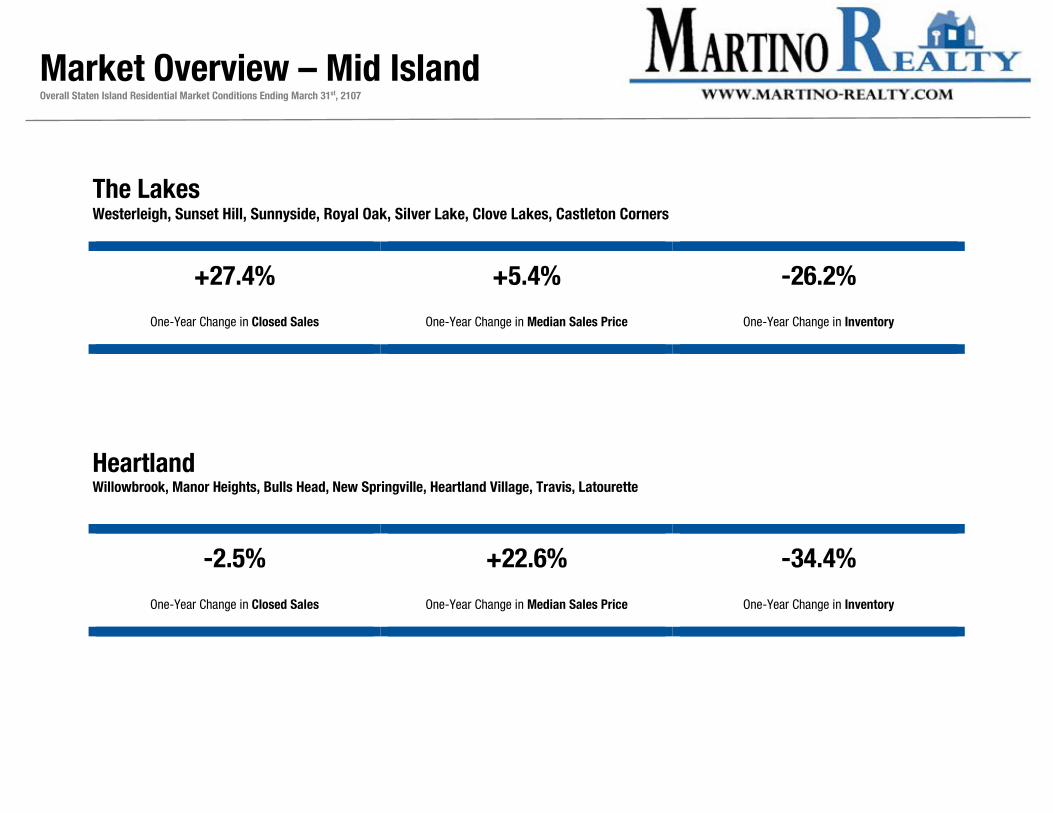
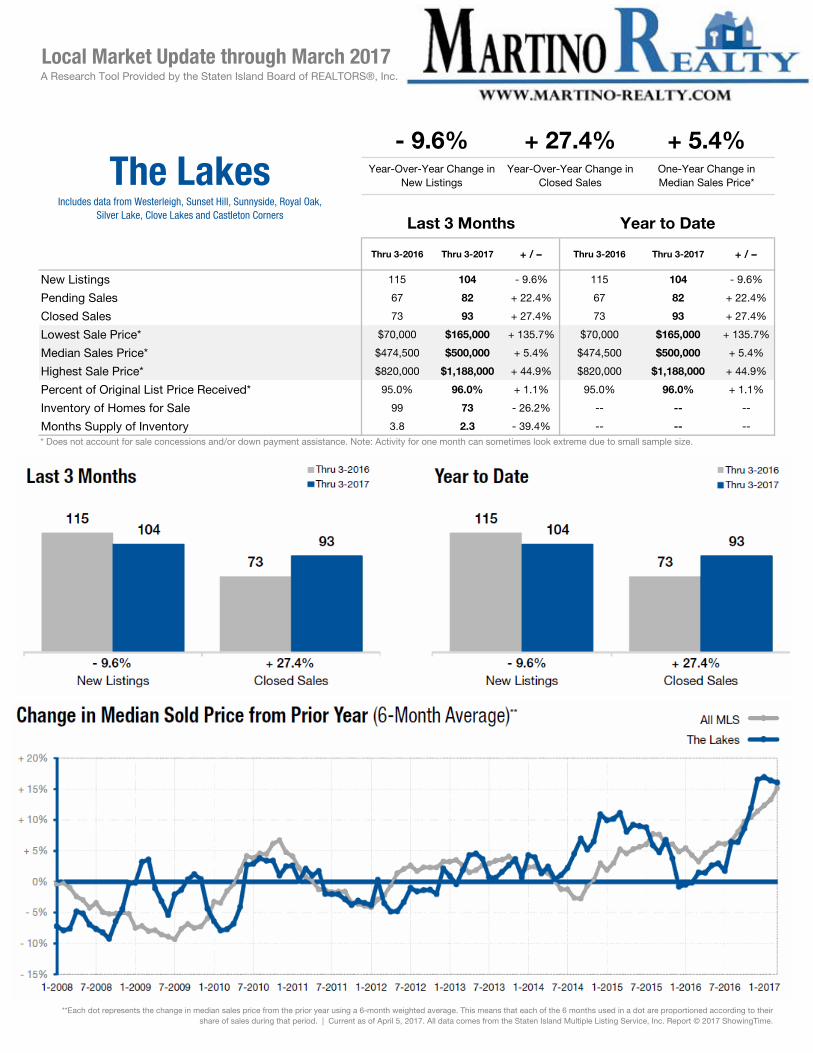
+27.4% +5.4% -26.2%
One-Year Change in Closed Sales One-Year Change in Median Sales Price One-Year Change in Inventory
-2.5% +22.6% -34.4%
One-Year Change in Closed Sales One-Year Change in Median Sales Price One-Year Change in Inventory
Market Overview – Mid IslandOverall Staten Island Residential Market Conditions Ending March 31st, 2107
The Lakes Westerleigh, Sunset Hill, Sunnyside, Royal Oak, Silver Lake, Clove Lakes, Castleton Corners
Heartland Willowbrook, Manor Heights, Bulls Head, New Springville, Heartland Village, Travis, Latourette
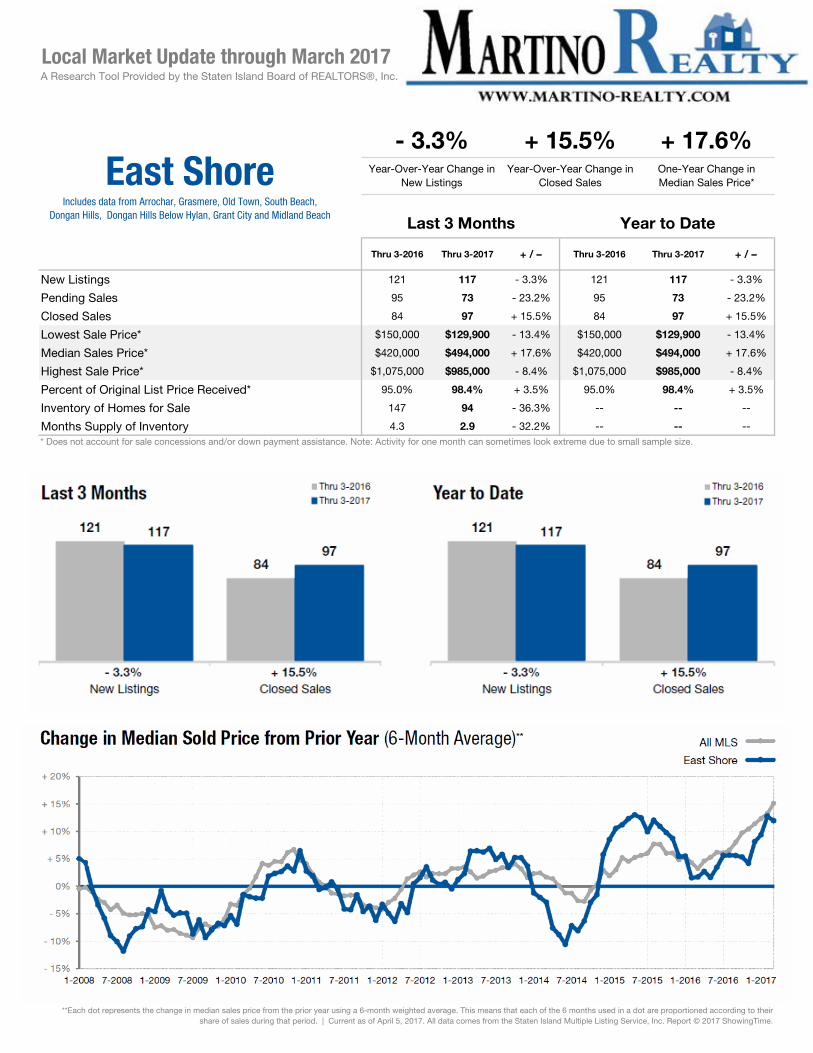
Thru 3-2016 Thru 3-2017 + / – Thru 3-2016 Thru 3-2017 + / –
New Listings 121 117 - 3.3% 121 117 - 3.3%
Pending Sales 95 73 - 23.2% 95 73 - 23.2%
Closed Sales 84 97 + 15.5% 84 97 + 15.5%
Lowest Sale Price* $150,000 $129,900 - 13.4% $150,000 $129,900 - 13.4%
Median Sales Price* $420,000 $494,000 + 17.6% $420,000 $494,000 + 17.6%
Highest Sale Price* $1,075,000 $985,000 - 8.4% $1,075,000 $985,000 - 8.4%
Percent of Original List Price Received* 95.0% 98.4% + 3.5% 95.0% 98.4% + 3.5%
Inventory of Homes for Sale 147 94 - 36.3% -- -- --
Months Supply of Inventory 4.3 2.9 - 32.2% -- -- --
+ 17.6%Year-Over-Year Change in
New ListingsYear-Over-Year Change in
Closed SalesOne-Year Change in Median Sales Price*
Last 3 Months Year to Date
* Does not account for sale concessions and/or down payment assistance. Note: Activity for one month can sometimes look extreme due to small sample size.
**Each dot represents the change in median sales price from the prior year using a 6-month weighted average. This means that each of the 6 months used in a dot are proportioned according to their share of sales during that period. | Current as of April 5, 2017. All data comes from the Staten Island Multiple Listing Service, Inc. Report © 2017 ShowingTime.
Local Market Update through March 2017A Research Tool Provided by the Staten Island Board of REALTORS®, Inc.
- 3.3% + 15.5%
East ShoreIncludes data from Arrochar, Grasmere, Old Town, South Beach,
Dongan Hills, Dongan Hills Below Hylan, Grant City and Midland Beach
Thru 3-2016 Thru 3-2017 + / – Thru 3-2016 Thru 3-2017 + / –
New Listings 61 50 - 18.0% 61 50 - 18.0%
Pending Sales 30 30 0.0% 30 30 0.0%
Closed Sales 30 39 + 30.0% 30 39 + 30.0%
Lowest Sale Price* $335,000 $322,000 - 3.9% $335,000 $322,000 - 3.9%
Median Sales Price* $707,500 $747,000 + 5.6% $707,500 $747,000 + 5.6%
Highest Sale Price* $2,390,000 $1,700,000 - 28.9% $2,390,000 $1,700,000 - 28.9%
Percent of Original List Price Received* 91.6% 93.3% + 1.9% 91.6% 93.3% + 1.9%
Inventory of Homes for Sale 123 90 - 26.9% -- -- --
Months Supply of Inventory 8.9 5.6 - 36.8% -- -- --
+ 5.6%Year-Over-Year Change in
New ListingsYear-Over-Year Change in
Closed SalesOne-Year Change in Median Sales Price*
Last 3 Months Year to Date
* Does not account for sale concessions and/or down payment assistance. Note: Activity for one month can sometimes look extreme due to small sample size.
**Each dot represents the change in median sales price from the prior year using a 6-month weighted average. This means that each of the 6 months used in a dot are proportioned according to their share of sales during that period. | Current as of April 5, 2017. All data comes from the Staten Island Multiple Listing Service, Inc. Report © 2017 ShowingTime.
Local Market Update through March 2017A Research Tool Provided by the Staten Island Board of REALTORS®, Inc.
- 18.0% + 30.0%
The HillsIncludes data from Emerson Hill, Todt Hill, Lower Todt Hill, Light House
Hill, Richmondtown, High Rock, Dongan Hills Colony, and Emerson Valley
Thru 3-2016 Thru 3-2017 + / – Thru 3-2016 Thru 3-2017 + / –
New Listings 115 104 - 9.6% 115 104 - 9.6%
Pending Sales 67 82 + 22.4% 67 82 + 22.4%
Closed Sales 73 93 + 27.4% 73 93 + 27.4%
Lowest Sale Price* $70,000 $165,000 + 135.7% $70,000 $165,000 + 135.7%
Median Sales Price* $474,500 $500,000 + 5.4% $474,500 $500,000 + 5.4%
Highest Sale Price* $820,000 $1,188,000 + 44.9% $820,000 $1,188,000 + 44.9%
Percent of Original List Price Received* 95.0% 96.0% + 1.1% 95.0% 96.0% + 1.1%
Inventory of Homes for Sale 99 73 - 26.2% -- -- --
Months Supply of Inventory 3.8 2.3 - 39.4% -- -- --
+ 5.4%Year-Over-Year Change in
New ListingsYear-Over-Year Change in
Closed SalesOne-Year Change in Median Sales Price*
Last 3 Months Year to Date
* Does not account for sale concessions and/or down payment assistance. Note: Activity for one month can sometimes look extreme due to small sample size.
**Each dot represents the change in median sales price from the prior year using a 6-month weighted average. This means that each of the 6 months used in a dot are proportioned according to their share of sales during that period. | Current as of April 5, 2017. All data comes from the Staten Island Multiple Listing Service, Inc. Report © 2017 ShowingTime.
Local Market Update through March 2017A Research Tool Provided by the Staten Island Board of REALTORS®, Inc.
- 9.6% + 27.4%
The LakesIncludes data from Westerleigh, Sunset Hill, Sunnyside, Royal Oak,
Silver Lake, Clove Lakes and Castleton Corners
Thru 3-2016 Thru 3-2017 + / – Thru 3-2016 Thru 3-2017 + / –
New Listings 139 156 + 12.2% 139 156 + 12.2%
Pending Sales 115 104 - 9.6% 115 104 - 9.6%
Closed Sales 119 116 - 2.5% 119 116 - 2.5%
Lowest Sale Price* $107,000 $120,000 + 12.1% $107,000 $120,000 + 12.1%
Median Sales Price* $400,000 $490,250 + 22.6% $400,000 $490,250 + 22.6%
Highest Sale Price* $1,144,500 $865,000 - 24.4% $1,144,500 $865,000 - 24.4%
Percent of Original List Price Received* 94.9% 98.4% + 3.7% 94.9% 98.4% + 3.7%
Inventory of Homes for Sale 153 100 - 34.4% -- -- --
Months Supply of Inventory 3.6 2.2 - 38.6% -- -- --
+ 22.6%Year-Over-Year Change in
New ListingsYear-Over-Year Change in
Closed SalesOne-Year Change in Median Sales Price*
Last 3 Months Year to Date
* Does not account for sale concessions and/or down payment assistance. Note: Activity for one month can sometimes look extreme due to small sample size.
**Each dot represents the change in median sales price from the prior year using a 6-month weighted average. This means that each of the 6 months used in a dot are proportioned according to their share of sales during that period. | Current as of April 5, 2017. All data comes from the Staten Island Multiple Listing Service, Inc. Report © 2017 ShowingTime.
Local Market Update through March 2017A Research Tool Provided by the Staten Island Board of REALTORS®, Inc.
+ 12.2% - 2.5%
HeartlandIncludes data from Willowbrook, Manor Heights, Bulls Head,
New Springville, Heartland Village, Travis and Latourette
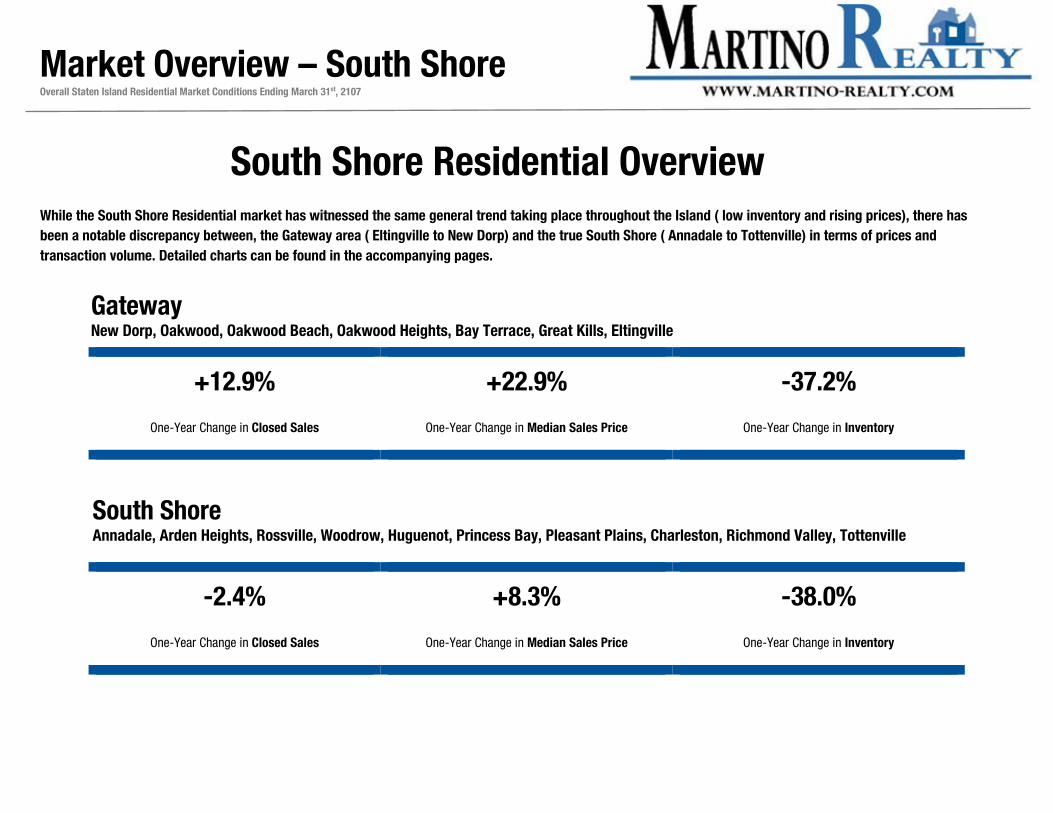
+12.9% +22.9% -37.2%
One-Year Change in Closed Sales One-Year Change in Median Sales Price One-Year Change in Inventory
-2.4% +8.3% -38.0%
One-Year Change in Closed Sales One-Year Change in Median Sales Price One-Year Change in Inventory
Market Overview – South Shore
Overall Staten Island Residential Market Conditions Ending March 31st, 2107
South Shore Residential Overview While the South Shore Residential market has witnessed the same general trend taking place throughout the Island ( low inventory and rising prices), there has been a notable discrepancy between, the Gateway area ( Eltingville to New Dorp) and the true South Shore ( Annadale to Tottenville) in terms of prices and transaction volume. Detailed charts can be found in the accompanying pages.
Gateway New Dorp, Oakwood, Oakwood Beach, Oakwood Heights, Bay Terrace, Great Kills, Eltingville
South Shore Annadale, Arden Heights, Rossville, Woodrow, Huguenot, Princess Bay, Pleasant Plains, Charleston, Richmond Valley, Tottenville

Thru 3-2016 Thru 3-2017 + / – Thru 3-2016 Thru 3-2017 + / –
New Listings 237 250 + 5.5% 237 250 + 5.5%
Pending Sales 162 173 + 6.8% 162 173 + 6.8%
Closed Sales 171 193 + 12.9% 171 193 + 12.9%
Lowest Sale Price* $90,000 $60,000 - 33.3% $90,000 $60,000 - 33.3%
Median Sales Price* $430,000 $528,500 + 22.9% $430,000 $528,500 + 22.9%
Highest Sale Price* $1,200,000 $950,000 - 20.8% $1,200,000 $950,000 - 20.8%
Percent of Original List Price Received* 93.5% 96.3% + 3.0% 93.5% 96.3% + 3.0%
Inventory of Homes for Sale 252 184 - 26.9% -- -- --
Months Supply of Inventory 4.3 2.7 - 37.2% -- -- --
+ 22.9%Year-Over-Year Change in
New ListingsYear-Over-Year Change in
Closed SalesOne-Year Change in Median Sales Price*
Last 3 Months Year to Date
* Does not account for sale concessions and/or down payment assistance. Note: Activity for one month can sometimes look extreme due to small sample size.
**Each dot represents the change in median sales price from the prior year using a 6-month weighted average. This means that each of the 6 months used in a dot are proportioned according to their share of sales during that period. | Current as of April 5, 2017. All data comes from the Staten Island Multiple Listing Service, Inc. Report © 2017 ShowingTime.
Local Market Update through March 2017A Research Tool Provided by the Staten Island Board of REALTORS®, Inc.
+ 5.5% + 12.9%
GatewayIncludes data from New Dorp, Oakwood, Oakwood Beach, Oakwood Heights, Bay Terrace, Great Kills and Eltingville
Thru 3-2016 Thru 3-2017 + / – Thru 3-2016 Thru 3-2017 + / –
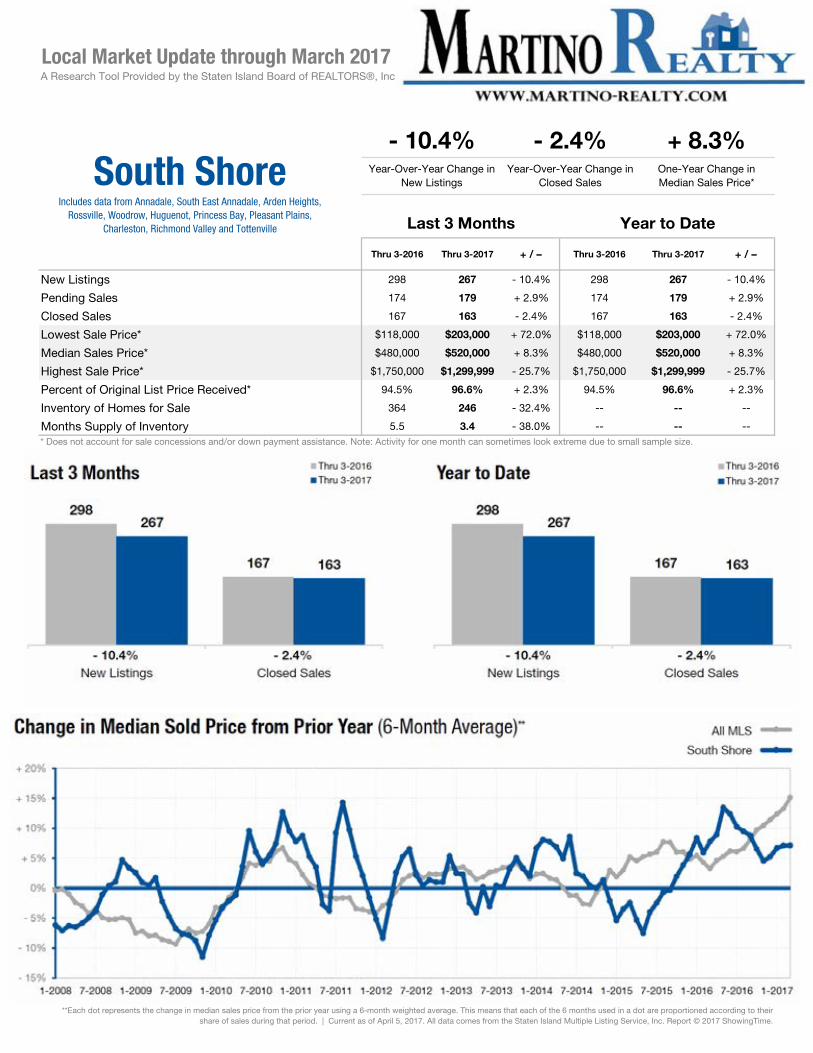
New Listings 298 267 - 10.4% 298 267 - 10.4%
Pending Sales 174 179 + 2.9% 174 179 + 2.9%
Closed Sales 167 163 - 2.4% 167 163 - 2.4%
Lowest Sale Price* $118,000 $203,000 + 72.0% $118,000 $203,000 + 72.0%
Median Sales Price* $480,000 $520,000 + 8.3% $480,000 $520,000 + 8.3%
Highest Sale Price* $1,750,000 $1,299,999 - 25.7% $1,750,000 $1,299,999 - 25.7%
Percent of Original List Price Received* 94.5% 96.6% + 2.3% 94.5% 96.6% + 2.3%
Inventory of Homes for Sale 364 246 - 32.4% -- -- --
Months Supply of Inventory 5.5 3.4 - 38.0% -- -- --
+ 8.3%Year-Over-Year Change in
New ListingsYear-Over-Year Change in
Closed SalesOne-Year Change in Median Sales Price*
Last 3 Months Year to Date
* Does not account for sale concessions and/or down payment assistance. Note: Activity for one month can sometimes look extreme due to small sample size.
**Each dot represents the change in median sales price from the prior year using a 6-month weighted average. This means that each of the 6 months used in a dot are proportioned according to their share of sales during that period. | Current as of April 5, 2017. All data comes from the Staten Island Multiple Listing Service, Inc. Report © 2017 ShowingTime.
Local Market Update through March 2017A Research Tool Provided by the Staten Island Board of REALTORS®, Inc.
- 10.4% - 2.4%
South ShoreIncludes data from Annadale, South East Annadale, Arden Heights,
Rossville, Woodrow, Huguenot, Princess Bay, Pleasant Plains, Charleston, Richmond Valley and Tottenville
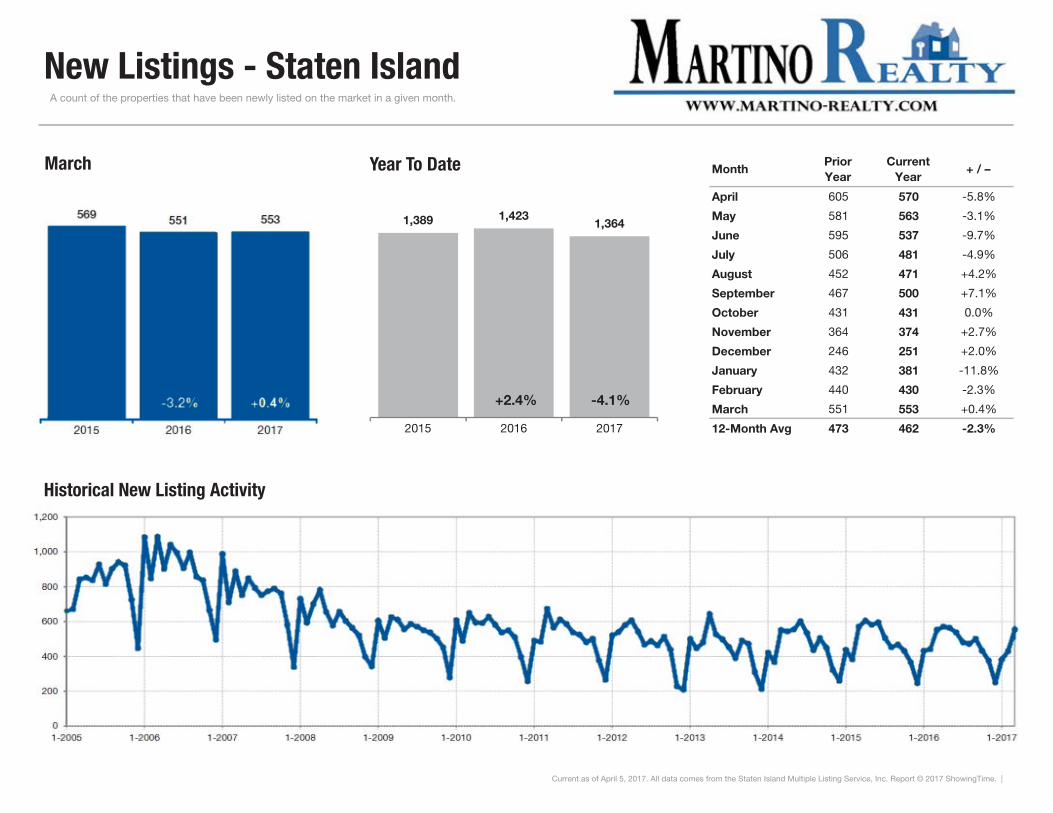
New Listings - Staten Island A count of the properties that have been newly listed on the market in a given month.
MonthPrior Year
Current Year
+ / –
April 605 570 -5.8%
May 581 563 -3.1%
June 595 537 -9.7%
July 506 481 -4.9%
August 452 471 +4.2%
September 467 500 +7.1%
October 431 431 0.0%
November 364 374 +2.7%
December 246 251 +2.0%
January 432 381 -11.8%
February 440 430 -2.3%
March 551 553 +0.4%
12-Month Avg 473 462 -2.3%
Current as of April 5, 2017. All data comes from the Staten Island Multiple Listing Service, Inc. Report © 2017 ShowingTime. |
March
Historical New Listing Activity
1,389 1,4231,364
2015 2016 2017
Year To Date
-4.1%+2.4%

Pending Sales - Staten Island A count of the properties on which offers have been accepted in a given month.
MonthPrior Year
Current Year
+ / –
April 345 392 +13.6%
May 330 464 +40.6%
June 398 454 +14.1%
July 370 364 -1.6%
August 340 424 +24.7%
September 372 376 +1.1%
October 381 405 +6.3%
November 333 337 +1.2%
December 317 336 +6.0%
January 263 275 +4.6%
February 274 278 +1.5%
March 357 394 +10.4%
12-Month Avg 340 375 +10.3%
Current as of April 5, 2017. All data comes from the Staten Island Multiple Listing Service, Inc. Report © 2017 ShowingTime. |
March
Historical Pending Sales Activity
805
894947
2015 2016 2017
Year To Date
+5.9%+11.1%
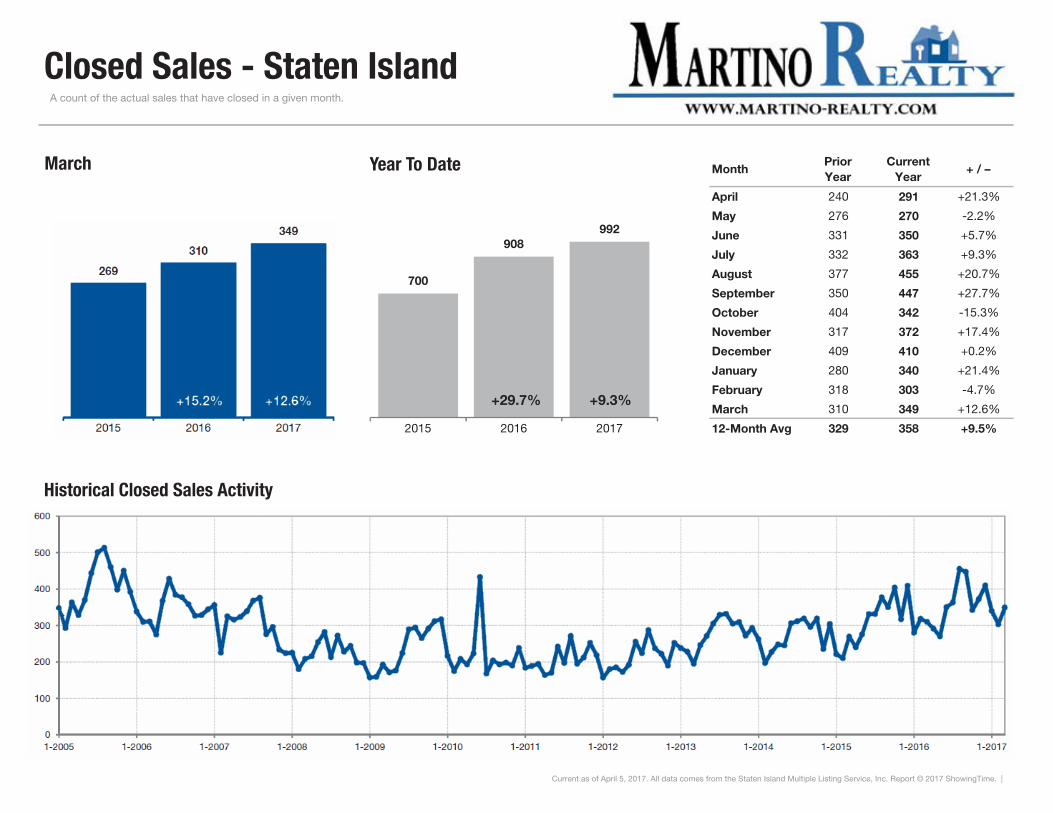
Closed Sales - Staten Island A count of the actual sales that have closed in a given month.
MonthPrior Year
Current Year
+ / –
April 240 291 +21.3%
May 276 270 -2.2%
June 331 350 +5.7%
July 332 363 +9.3%
August 377 455 +20.7%
September 350 447 +27.7%
October 404 342 -15.3%
November 317 372 +17.4%
December 409 410 +0.2%
January 280 340 +21.4%
February 318 303 -4.7%
March 310 349 +12.6%
12-Month Avg 329 358 +9.5%
Current as of April 5, 2017. All data comes from the Staten Island Multiple Listing Service, Inc. Report © 2017 ShowingTime. |
March
Historical Closed Sales Activity
700
908992
2015 2016 2017
Year To Date
+9.3%+29.7%
MonthPrior Year
Current Year
+ / –
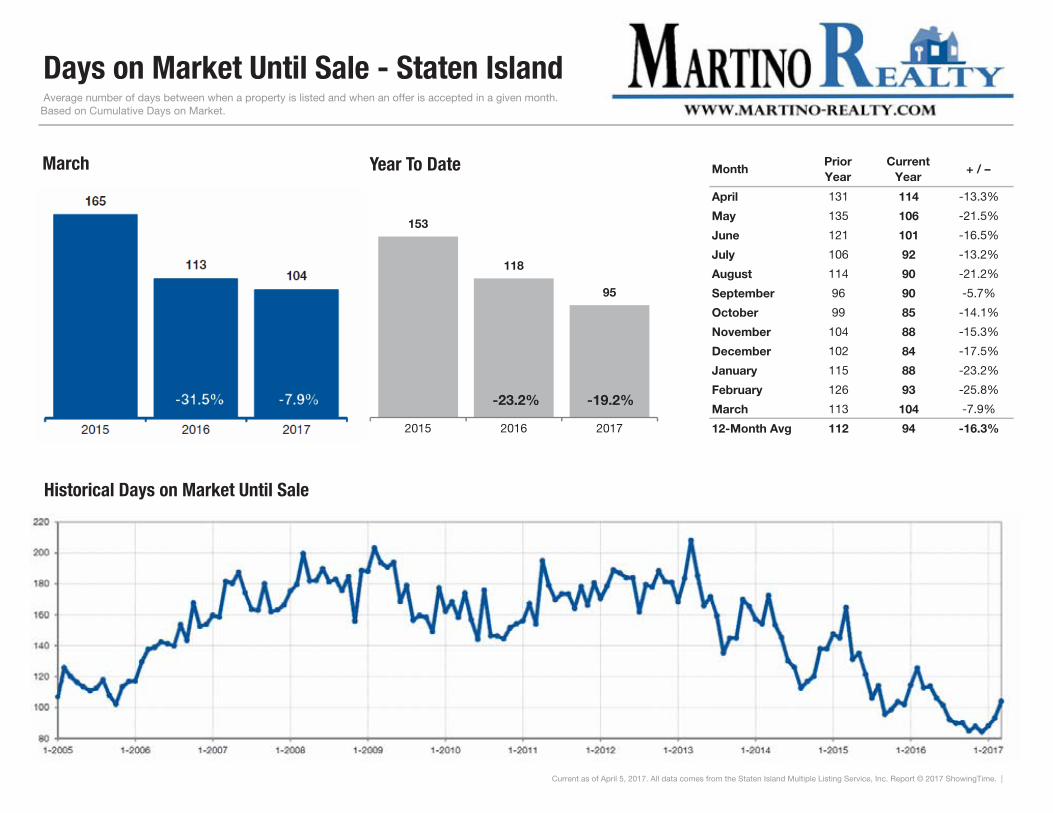
April 131 114 -13.3%
May 135 106 -21.5%
June 121 101 -16.5%
July 106 92 -13.2%
August 114 90 -21.2%
September 96 90 -5.7%
October 99 85 -14.1%
November 104 88 -15.3%
December 102 84 -17.5%
January 115 88 -23.2%
February 126 93 -25.8%
March 113 104 -7.9%
12-Month Avg 112 94 -16.3%
Current as of April 5, 2017. All data comes from the Staten Island Multiple Listing Service, Inc. Report © 2017 ShowingTime. |
Days on Market Until Sale - Staten Island Average number of days between when a property is listed and when an offer is accepted in a given month. Based on Cumulative Days on Market.
March
Historical Days on Market Until Sale
153
118
95
2015 2016 2017
Year To Date
-19.2%-23.2%
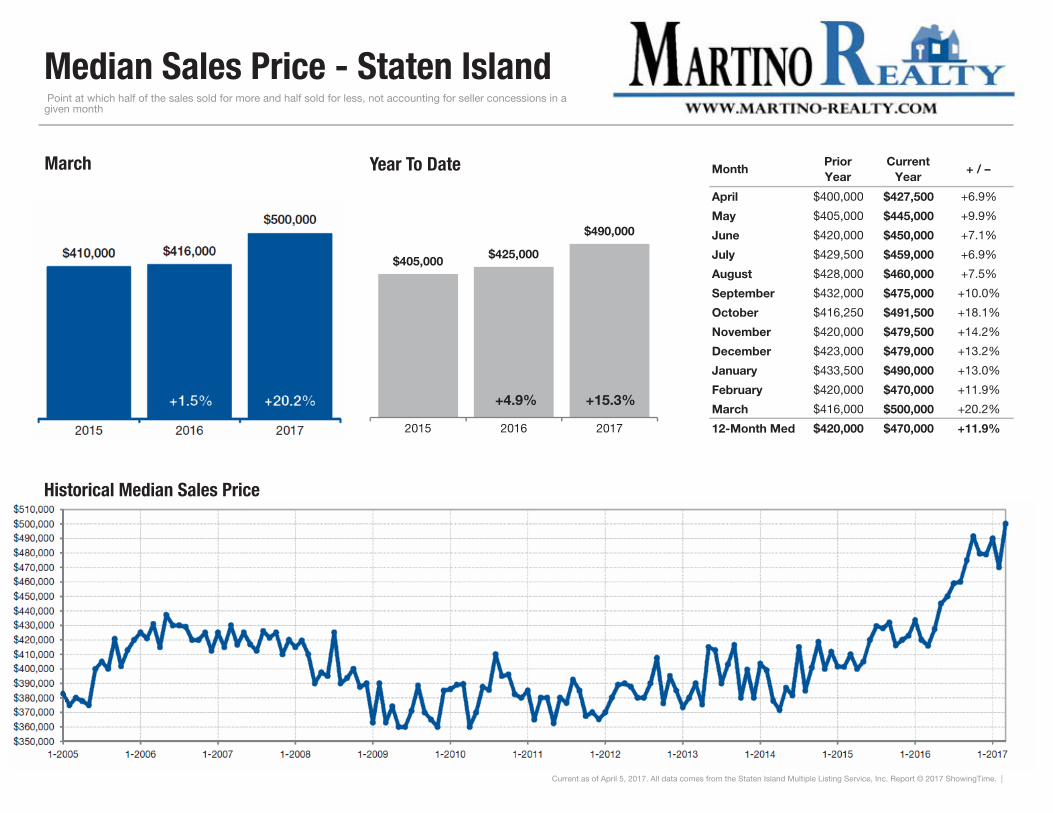
Median Sales Price - Staten Island Point at which half of the sales sold for more and half sold for less, not accounting for seller concessions in a given month
MonthPrior Year
Current Year
+ / –
April $400,000 $427,500 +6.9%
May $405,000 $445,000 +9.9%
June $420,000 $450,000 +7.1%
July $429,500 $459,000 +6.9%
August $428,000 $460,000 +7.5%
September $432,000 $475,000 +10.0%
October $416,250 $491,500 +18.1%
November $420,000 $479,500 +14.2%
December $423,000 $479,000 +13.2%
January $433,500 $490,000 +13.0%
February $420,000 $470,000 +11.9%
March $416,000 $500,000 +20.2%
12-Month Med $420,000 $470,000 +11.9%
Current as of April 5, 2017. All data comes from the Staten Island Multiple Listing Service, Inc. Report © 2017 ShowingTime. |
March
Historical Median Sales Price
$405,000$425,000
$490,000
2015 2016 2017
Year To Date
+15.3%+4.9%
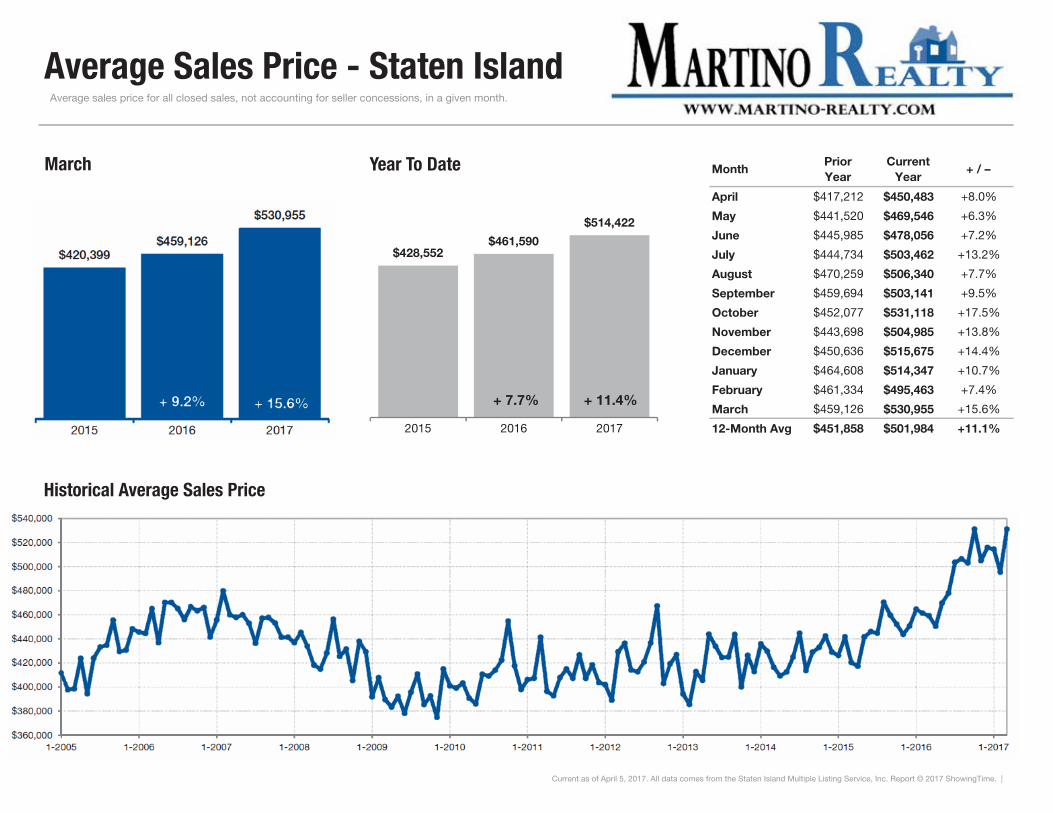
Average Sales Price - Staten Island Average sales price for all closed sales, not accounting for seller concessions, in a given month.
MonthPrior Year
Current Year
+ / –
April $417,212 $450,483 +8.0%
May $441,520 $469,546 +6.3%
June $445,985 $478,056 +7.2%
July $444,734 $503,462 +13.2%
August $470,259 $506,340 +7.7%
September $459,694 $503,141 +9.5%
October $452,077 $531,118 +17.5%
November $443,698 $504,985 +13.8%
December $450,636 $515,675 +14.4%
January $464,608 $514,347 +10.7%
February $461,334 $495,463 +7.4%
March $459,126 $530,955 +15.6%
12-Month Avg $451,858 $501,984 +11.1%
Current as of April 5, 2017. All data comes from the Staten Island Multiple Listing Service, Inc. Report © 2017 ShowingTime. |
March
Historical Average Sales Price
$428,552$461,590
$514,422
2015 2016 2017
Year To Date
+ 11.4%+ 7.7%
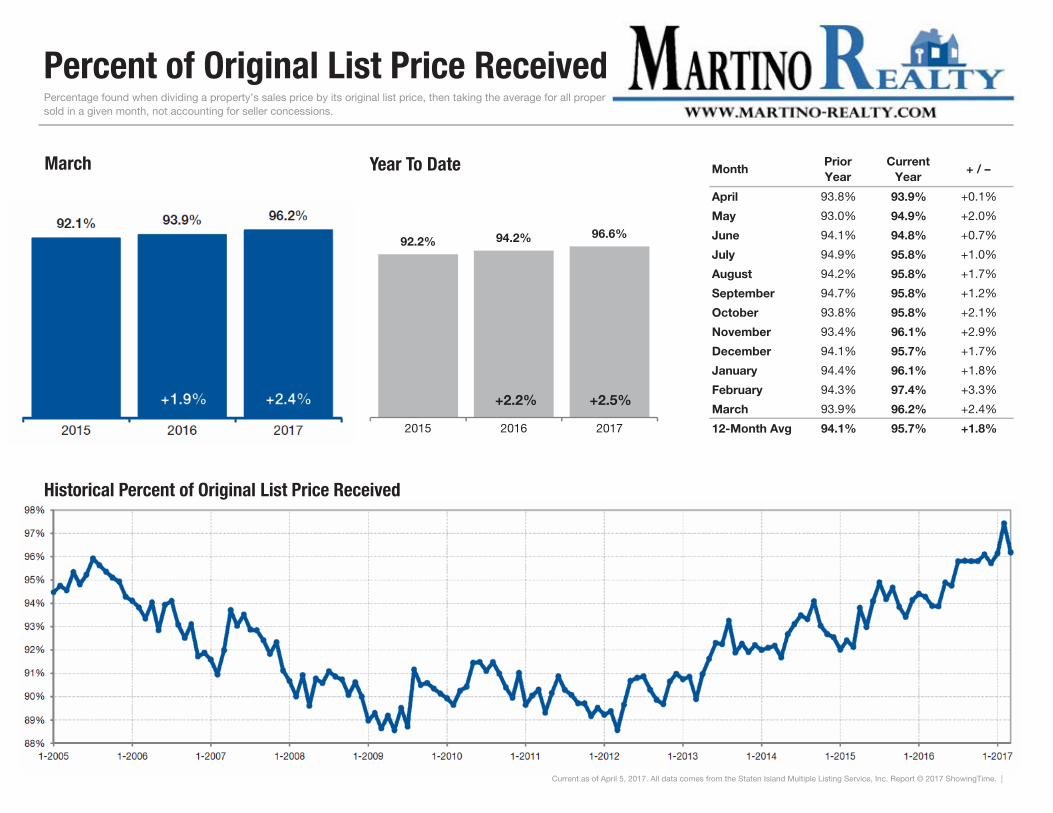
Percent of Original List Price Received
MonthPrior Year
Current Year
+ / –
April 93.8% 93.9% +0.1%
May 93.0% 94.9% +2.0%
June 94.1% 94.8% +0.7%
July 94.9% 95.8% +1.0%
August 94.2% 95.8% +1.7%
September 94.7% 95.8% +1.2%
October 93.8% 95.8% +2.1%
November 93.4% 96.1% +2.9%
December 94.1% 95.7% +1.7%
January 94.4% 96.1% +1.8%
February 94.3% 97.4% +3.3%
March 93.9% 96.2% +2.4%
12-Month Avg 94.1% 95.7% +1.8%
Current as of April 5, 2017. All data comes from the Staten Island Multiple Listing Service, Inc. Report © 2017 ShowingTime. |
Percentage found when dividing a property’s sales price by its original list price, then taking the average for all properties sold in a given month, not accounting for seller concessions.
March
Historical Percent of Original List Price Received
92.2% 94.2% 96.6%
2015 2016 2017
Year To Date
+2.5%+2.2%
MonthPrior Year
Current Year
+ / –
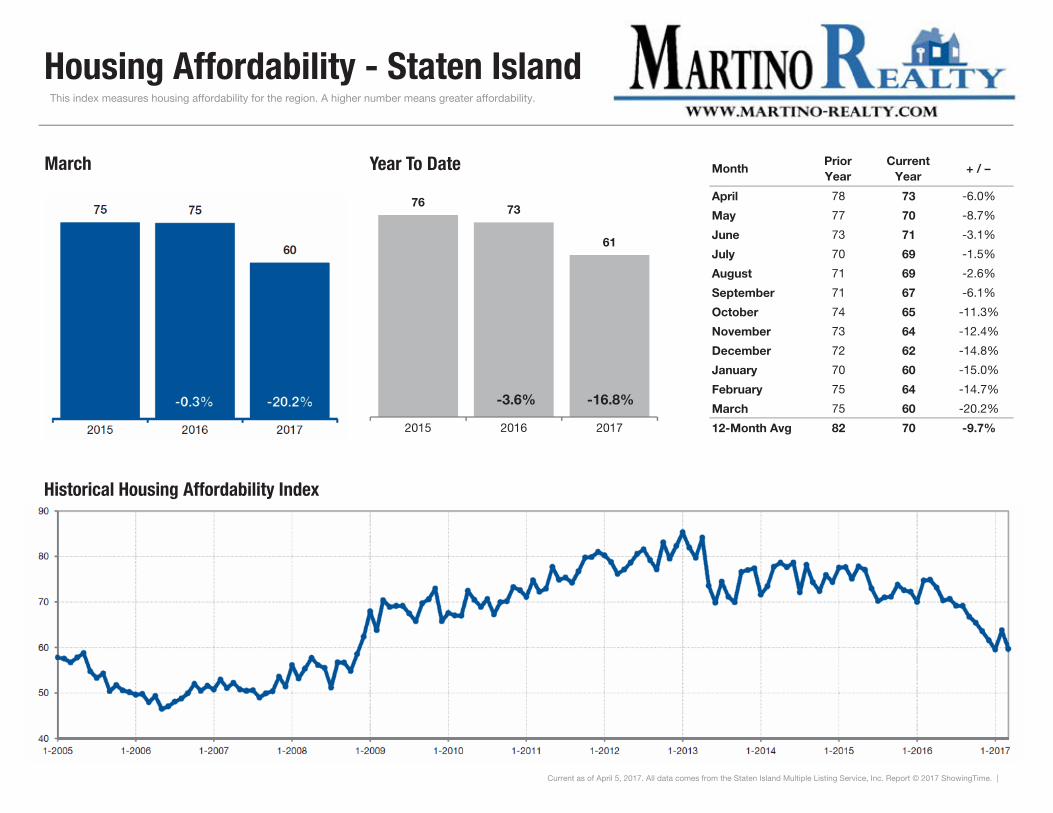
April 78 73 -6.0%
May 77 70 -8.7%
June 73 71 -3.1%
July 70 69 -1.5%
August 71 69 -2.6%
September 71 67 -6.1%
October 74 65 -11.3%
November 73 64 -12.4%
December 72 62 -14.8%
January 70 60 -15.0%
February 75 64 -14.7%
March 75 60 -20.2%
12-Month Avg 82 70 -9.7%
Current as of April 5, 2017. All data comes from the Staten Island Multiple Listing Service, Inc. Report © 2017 ShowingTime. |
Housing Affordability - Staten Island This index measures housing affordability for the region. A higher number means greater affordability.
March
Historical Housing Affordability Index
7673
61
2015 2016 2017
Year To Date
-16.8%-3.6%
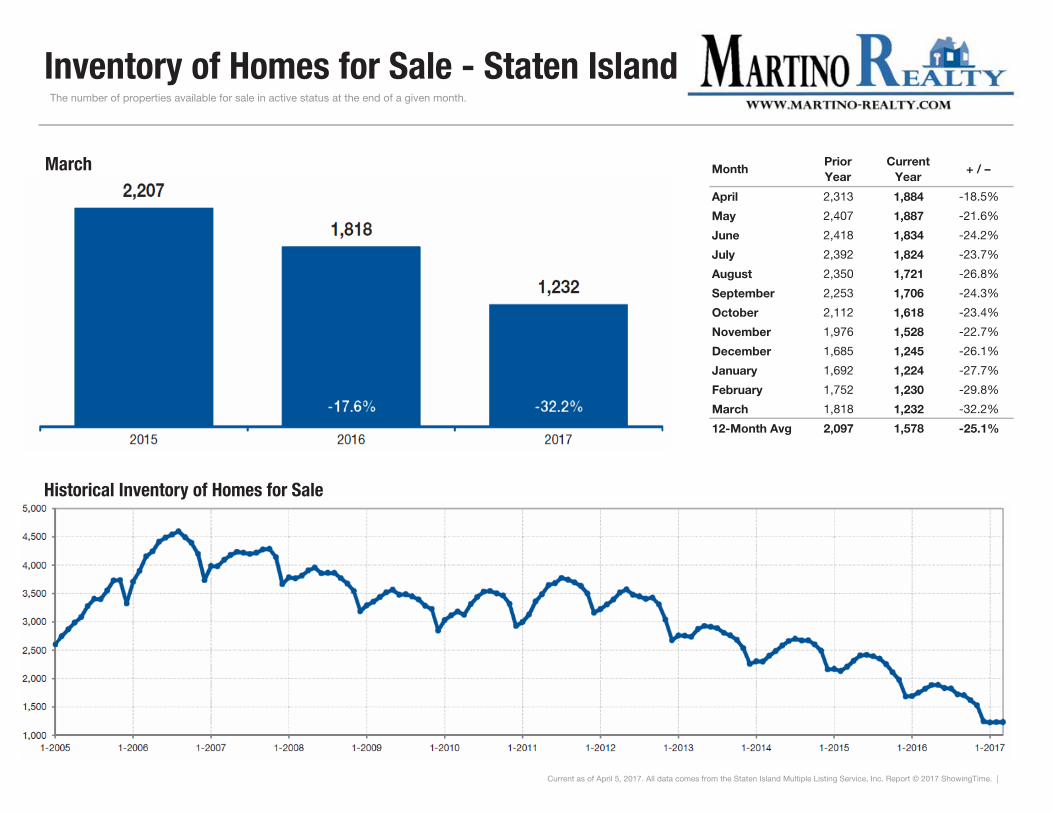
Inventory of Homes for Sale - Staten Island The number of properties available for sale in active status at the end of a given month.
MonthPrior Year
Current Year
+ / –
April 2,313 1,884 -18.5%
May 2,407 1,887 -21.6%
June 2,418 1,834 -24.2%
July 2,392 1,824 -23.7%
August 2,350 1,721 -26.8%
September 2,253 1,706 -24.3%
October 2,112 1,618 -23.4%
November 1,976 1,528 -22.7%
December 1,685 1,245 -26.1%
January 1,692 1,224 -27.7%
February 1,752 1,230 -29.8%
March 1,818 1,232 -32.2%
12-Month Avg 2,097 1,578 -25.1%
Current as of April 5, 2017. All data comes from the Staten Island Multiple Listing Service, Inc. Report © 2017 ShowingTime. |
March
Historical Inventory of Homes for Sale

Months Supply of Inventory - Staten Island The inventory of homes for sale at the end of a given month, divided by the average monthly pending sales from the last 12 months.
MonthPrior Year
Current Year
+ / –
April 8.1 5.5 -32.4%
May 8.4 5.3 -36.5%
June 8.2 5.1 -37.9%
July 8.0 5.1 -36.5%
August 7.8 4.7 -39.5%
September 7.3 4.7 -35.9%
October 6.6 4.4 -33.9%
November 6.1 4.1 -31.7%
December 5.1 3.4 -33.7%
January 5.0 3.3 -34.6%
February 5.2 3.3 -36.3%
March 5.3 3.3 -38.5%
12-Month Avg 6.8 4.3 -35.6%
Current as of April 5, 2017. All data comes from the Staten Island Multiple Listing Service, Inc. Report © 2017 ShowingTime. |
March
Historical Months Supply of Inventory