full report
DESCRIPTION
projectTRANSCRIPT

7/15/2019 Full Report
http://slidepdf.com/reader/full/full-report-563280c63b398 1/81
1.1 INTRODUCTION ABOUT THE STUDY
1.1.1 COMPETITOR ANALYSIS
Competitor analysis can be defined as a set of activities, which examines the comparative
position of competing enterprises within a given strategic sector. In formulating business
strategy, managers must consider the strategies of the firm's competitors. While in highly
fragmented commodity the industries moves of any single competitor which is less important. In
concentrated industries competitor analysis becomes a vital part of strategic planning.
Competitor analysis has two primary activities,
1) Obtaining information about important competitors.
2) Using that information to predict competitor behavior.
Competitive Analysis in general is a process of gathering and analyzing information
about our competitors, their practices, products, strengths and weaknesses and business trends in
order to assess our position in the market and improve our products and marketing strategies.
1.1.2 GOALS OF COMPETITOR ANALYSIS
While discussing the competitor analysis certain goals must be analyzed clearly and
understandable one. So the goals of competitor analysis are to understand following things;
• With which competitors to compete,
• Competitors' strategies and planned actions,
• How competitors might react to a firm's actions,
• How to influence competitor behavior to the firm's own advantage.
Casual knowledge about competitors usually is insufficient in competitor analysis. Rather,
competitors should be analyzed systematically, using organized competitor intelligence gathering
to compile a wide array of information so that well informed strategy decisions can be made.
1
7/15/2019 Full Report
http://slidepdf.com/reader/full/full-report-563280c63b398 2/81
1.1.3 COMPETITOR ANALYSIS SEEKS TO
• Provide an understanding of your competitive advantage/disadvantage relative
to your competitor’s positions.
• Help in generating insights into competitor’s strategies past, present and
potential.
• Give an informed basis for developing future strategies to sustain/establish
advantages over your competitors.
1.1.4 PURPOSE OF COMPETITOR ANALYSIS
In today's market, we must know what our competitors are doing and what to do to stay ahead of
the competition. Many businesses believe they are providing a good product to their customers,
but do not have reliable information showing how customers perceive their product.
A Competitive Analysis performed by an unbiased third party is an invaluable tool
because it can help me to identify ways to attract new customers, as well as keep the ones you
have satisfied with our products.
• STRENGTHS AND WEAKNESSES: How our product stacks up against the
competition and in what areas they have an edge over our product and in what areas
our product is superior.
• IDENTIFY OUR COMPETITORS: Verify who your primary and secondary
competitors are.
• IMPROVEMENTS: How and in what areas our product, processes, and practices
must be improved to meet market demands or to stay ahead of the competition.
• MARKETING: What improvements we need to make in our marketing approach
we may want to highlight why our product is ahead of the competition, or the unique
features that consumers desire.
2
7/15/2019 Full Report
http://slidepdf.com/reader/full/full-report-563280c63b398 3/81
1.1.5 DEVELOPMENT OF COMPETITOR ANALYSIS
The following questions should be kept it in the mind when undertaking competitor analysis
such as
• Who are our competitors?
• What threats do they possess?
• What is the profile of our competitors?
• What are the objectives of our competitors?
• What strategies are our competitors pursuing and how successful are these
strategies?
• What are the strengths and weaknesses of our competitors?
• How are our competitors likely to respond to any changes to the way we do
business?
1.1.6INFORMATION ABOUT THE COMPETITORS
A business should consider certain factors for the betterment of competitor
analysis. Those factors are as follows;
• Sales and profits by product
• Relative costs
• Customer satisfaction and service levels
3

7/15/2019 Full Report
http://slidepdf.com/reader/full/full-report-563280c63b398 4/81
• Customer retention levels
• Distribution costs
• Size and quality of customer databases
• Advertising effectiveness• Future investment strategy
1.1.7 ABOUT THE STUDY
This study focuses to do the competitive analysis of Fibro Flex Company and its major
competitors in Tirunelveli region.
The study was conducted to identify the competitive process of Fibro flex company and
customer satisfaction. Study was focuses on clients within Thirunelveli region. The company
provides many products and services to the customers.
Outcome of the analysis shows that though Fibro flex is on the top position as a market
share in Thirunelveli region, but Fibro flex is still behind in many more factors and they need to
improve those factors. Some recommendations are given to improve. (Project study has been
done with the help of primary and secondary data.)
4

7/15/2019 Full Report
http://slidepdf.com/reader/full/full-report-563280c63b398 5/81
INDUSTRY PROFILE
1.2.1 COIR INDUSTRY IN INDIA
Indian coir industry is an important cottage industry contributing significantly to the
economy of the major coconut growing States and Union Territories, i.e., Kerala, Tamil Nadu,
Andhra Pradesh, Karnataka, Maharashtra, Goa, Orissa, Assam, Andaman & Nicobar, etc.
About 5.5 lakhs persons get employment, mostly part time in this industry. The exports from
this industry are around Rs.70 cores. Coconut husk is the basic raw material for coir products.
Around 50% of the available coir husk is used to produce the products. Hence there is scope for
growth of coir industry.
The English Plan programmers for coir industry aimed at increased utilization of
coconut husk for production of coir fibre, growth of find our new uses of coir fibre especially in
the areas of geo-fibre, fire retardant, cement and gypsum polymer development, acquiring of new
technology like PVC-tufted coir products, encouragement to co-operativisation and providingsocial welfare, civic amenities and medical facilities to coir workers. Emphasis would be laid on
mechanization in a phased manner without affecting employment to make Indian coir products
competitive in the export maker. Brown coir fibre production would be encouraged by providing
seed capital assistance. Modernization of coir units has been envisaged by providing incentives
5
7/15/2019 Full Report
http://slidepdf.com/reader/full/full-report-563280c63b398 6/81
for installation of modern equipments to make coir industry more competitive in the export
market.
India accounts for more than two-thirds of the world production of coir and coir products. Kerala
is the home of Indian coir industry, particularly white fibre, accounting for 61% of coconut
production and over 85% of coir products. Although India has along coastline dotted with
coconut palms, growth of coir industry in other coastal states has been insignificant, not more
than 50% of the coconut husks is utilized in the coir industry, the remaining being used as fuel in
rural areas.
Production in the cooperative fold is not more than 20% to 25%. The development programmer so far undertaken aimed at revitalization. Efforts were also made for exploring
wider export markets for coir and coir products. Judged from the increase in production and
employment, the progress has been rather slow and exports in physical terms have remained
mere or lets static.
It focuses on the 30 most important mattress manufacturing countries, i.e. Australia,
Austria, Belgium, Brazil, Canada, China, Czech Republic, Denmark, Finland, France, Germany,
Greece, India, Ireland, Italy, Japan, Malaysia, Mexico, the Netherlands, Norway, Poland,
Portugal, Russia, South Korea, Spain, Sweden, Switzerland, Turkey, the UK and the US. It
should be noted that India and Russia have been added this year and appear for the first time in
this edition of the report. Data on international trade of mattresses cover (in addition to the 30
countries listed above), 30 other countries, for a total of 60 countries.
The mattress industry is based on a shared commitment to produce a quality product that
enhances the universal experience of sleep. Through the sharing of information, participation in
trade fairs and a variety of other activities, the bedding industry continues to grow, innovate,
educate and its customers, and play a significant role in people's lives. In 2007, U.S. mattress
producers shipped 40.3 million units of mattresses and foundations.
6

7/15/2019 Full Report
http://slidepdf.com/reader/full/full-report-563280c63b398 7/81
TABLE NO- 1. 1.
TABLE SHOWING COMPARATIVE ANALYSIS OF VARIOUS BRANDS
BrandsPrice
(in ‘000s)Softness Thickness
Tapestry
DesignWeight
Sales
Promotion
Schemes
Duroflex 7.4 7.8 8.2 8.1 8.2 8.3Bedsy 8.2 6.8 6.9 8.2 7.8 7.8Fibroflex 7.1 7.8 7.5 6.6 6.8 6.9
Restolex 7.6 7.9 7.9 6.6 6.8 9.0Starlite 6.6 7.9 6.7 7.8 7.7 8.4Aaram 6.4 8.2 7.8 8.3 7.6 8.1Coiron 7.3 5.9 8.1 5.9 6.4 6.9Rilaxon 6.8 6.8 5.4 5.4 6.3 7.2Sulfex 6.5 5.6 5.2 5.5 5.8 7.6Kurlon 6.7 7.7 7.5 7.9 6.9 6.9
Centuary 7.5 6.7 7.7 7.5 7.5 8.2
1.2.2 U.S MATTRESS INDUSTRY OVERVIEW
The mattress industry is represented by wholly-owned manufacturers, licensing
organizations, publicly traded companies, independent companies and factory directs (companies
that both manufacture and retail their product.
7
7/15/2019 Full Report
http://slidepdf.com/reader/full/full-report-563280c63b398 8/81
Data on international trade of mattresses cover (in addition to the 30 countries listed above),
30 other countries, for a total of 60 countries. The report consists of five parts. Part I deals with
production, consumption and international trade of mattresses and includes a section on world
mattress statistics, an annex on ecological mattresses and an appendix with methodology notes.
Part II consists of 30 country analysis sections, which include: Mattress production, apparent
consumption, exports, and imports for the years 2000-2009 and forecasts of yearly changes in
mattress consumption for 2010-2011.
1.2.3 TOP TEN MATTRESS COMPANIES IN WORLD-WISE
CAL Int’l (HK) Co Ltd
Comfi-Home Ltd
Ching Tai Ind’l Co
Plastmetic (Hong Kong) Manufactory Ltd
King Long Textile Ltd
SZDY Co Ltd
Sunray Int’l Trading Co Ltd
Powertronics (HK) Co., Ltd
Wellman Industrial Ltd
Shining Industries Ltd
1.2.4 TOP TEN MATTRESS COMPANIES IN INDIA
Sheela Foam Pvt Ltd
Harshit Export
Shivam Narrow Fabrics
Kontak Comports Pvt Ltd
8

7/15/2019 Full Report
http://slidepdf.com/reader/full/full-report-563280c63b398 9/81
Vats Medical Healthcare (p) ltd
Karamanaye
Furnishing Gallery /Rexine Enterprise
Oriental Techno Craft Pvt. Ltd.
Anand Spring Mattress Mfg Co
Raha Poly Products Ltd
COMPANY PROFILE
1.3.1 COMPANY DETAILS
‘Fibroflex’ stands for the ultimate in quality and comfort. Fibroflex Rubberized Coir
Mattresses, Pillows and Cushions are manufactured by the reputed house of ‘Bharat Motors’ for
the past four decades. The factory is based at Pettai, Tirunelveli. It was founded in the year
1945, as a partnership concern. Initially it began as a dealer in imported automobiles such as
Oldsmobile and Fiat cars, Bedford Trucks and automobile spare parts. Later, the trading in trucks
and vehicles and their servicing were stopped while the automobile spares division alonecontinued till about 1985.
In 1960, Bharat Motors diversified into manufacturing rubberized coir products for the
first time in the whole of South East Asia with the technology imported from the Austrian,
Dr. Fehrer, who helped set up the plant in Tirunelveli in southern-most India, with a vision that it
had a very huge market potential in India. The mattress pads produced from these machines are
made of essentially coconut coir fiber with latex rubber sprayed on them to bond the coir fibre
and impart stiffness to the mattress
1.3.2 QUALITY PRINCIPLES
9
7/15/2019 Full Report
http://slidepdf.com/reader/full/full-report-563280c63b398 10/81
The Fibro flex has the following purposes to be achieved in observing the quality
principles:
• To have continuous improvement in achieving highest quality standards.
• To use relevant technology, latest production methods and highest quality
equipments.
• To improve employee’s skills, talent and creativity and allow everyone to participate
and give their best in the way they work.
• To have in mind always that ‘Quality Improvement’ is the mantra and set right the
quality management methods every now and then.
1.3.3 CERTIFICATION
Fibro flex has applied for and receiving the following certification:
1.3.3.1ISI-‘Bureau of Indian Standard’
The product certification scheme for obtaining ISI is basically voluntary and aims at
providing high quality, safety and dependability to the ultimate customer. Presence of
certification mark known as Standard Mark to a product is an assurance of conformity is ensured
by regular surveillance of the performance by surprise inspection testing of samples, drawn both
from the factory and marker. The product certification scheme is largely based on ISO Guide 28,
which provides general rules for third party certification system of determining conformity with
product standards through initial testing and assessment of a factory quality management system
and its acceptance followed by surveillance that takes into account the factory quality
management system and testing the samples from factory and open market.
All BIS certification is carried out on Indian Standards, which have been found
amenable to product certification, a sizable number of Indian Standards have been harmonized
with ISO/IEC Standards and some are dual numbered. A large number of operational elements
10
7/15/2019 Full Report
http://slidepdf.com/reader/full/full-report-563280c63b398 11/81
of the BIS product certification scheme correspond with the requirements of ISO Guide 65. Fibro
flex has obtained the ISI mark IS: 8391 and CM/L no. is 6015346.
1.3.3.2 ISO 9001:2000:
ISO is a network of the national standards institutes of 151 countries on the basis of one
member per country, with Central Secretariat in Geneva, Switzerland. ISO is a non government
organization. Its members are not as the case in the UNO systems, delegations of national
governments. Nevertheless, ISO occupies a special position between the public and private
sectors. ISO is able to act as a bridging organization in which a consensus can be reached on
solutions that meet both the requirements of business and the broader needs of society, such as
the needs of stakeholder groups like consumers and users. The ISO 9000 and ISO 14000 familiesare among ISO’s most widely known standards ever. ISO 9000 has become an international
reference for quality requirements in Business to Business dealings. ISO 9000 is concerned with
“Quality Management”. ISO 9001:2000 has been organized in a user friendly format with terms
which is recognized by all business sectors the standard is used for certification /registration and
contractual purposes by organization seeking recognition of their quality management system.
Fibro flex (INDIA Pvt. Ltd. has received its ISO 9001:2000. Certification by international
Certifications Ltd. in March 2003.
We are pioneers in manufacturing Rubberized Coir, quality as per BIS standards and with
ISI Mark IS: 8391/1987, starting in 1960. Our factory is located in Pettai, Tirunelveli. The brand
‘Fibro flex’ stands for best quality in the rubberized coir industry. These mattresses are of
standard 80 Density and are endorsed by ‘Bureau of Indian Standards’ (BIS) as firm-grade
mattresses (ISI mark). Only the best materials are used in the manufacturing process to achieve
these high standards of quality. These mattresses provide the best support for the human back
and are cool in summer and warm in winter.
11
7/15/2019 Full Report
http://slidepdf.com/reader/full/full-report-563280c63b398 12/81
1.3.4 VISION AND MISSION
1.3.4.1 VISION
At Flex we believe that, to eventually emerge as a World leader in providing total
Flexible Packaging solutions, we need a customer focused approach. The way to being a world
class player is paved with state-of-the art facilities blended with world-class practices. And it
shall be our Endeavour to be placed amongst the top ten international players by the year
2005.
1.3.3.2 MISSION
We believe in using our creativity and aesthetic potential in providing flexible packaging
solutions which make packaging easier, faster, and more efficient and user friendly. In this way
we too have a share in contributing to the conservator of resource by enhancing the shelf life of
the perishable products.
1.3.3.3 FIVESTEPS TO ACHIEVE THE EXCELLENCE
Step 1 : Remove which are not necessary
12
7/15/2019 Full Report
http://slidepdf.com/reader/full/full-report-563280c63b398 13/81
Step 2 : Keep them in practices which are necessary
Step 3 : Cleanliness daily
Step 4 : Implement rules
Step 5 : Practice and appreciation
PRODUCT PROFILE
1.4.1 PRODUCT DETAILS
Mattress sizes run from the smallest (twin) to the largest (King). Mattresses also come in
various thicknesses, ranging from “standard,” at 9 inches thick, to “high contour,” which is 9” to
13” thick, to “custom,” which is more than 13 inches thick.
1.4.2 MATTRESSES
The brand ‘Fibroflex’ stands for best quality in the rubberized coir industry. These
mattresses are of standard 80 Density and are endorsed by ‘Bureau of Indian Standards’ (BIS) as
firm-grade mattresses (ISI mark). Only the best materials are used in the manufacturing process
to achieve these high standards of quality. These mattresses provide the best support for the
human back and are cool in summer and warm in winter.
Fibroflex Gold Mattresses are made of superior quality viscose cotton fabric and hi-density
rubberized coir that has total reinforcements on all sides for better durability and to maintain the
shape.
13

7/15/2019 Full Report
http://slidepdf.com/reader/full/full-report-563280c63b398 14/81
1.4.3 FIBRO FLEX BRANDS
• Fibro flex Gold
•
Fibro flex Quilt• Fibro flex Deluxe
• Koolflex Quilt
• Koolflex Deluxe
1.4.3.1 KOOLFLEX DELUXE
It is most Economical, yet uncompromised in quality which is extensively used in
hostels, lodges, etc.
1.4.3.2 FIBRO FLEX GOLD
14
7/15/2019 Full Report
http://slidepdf.com/reader/full/full-report-563280c63b398 15/81
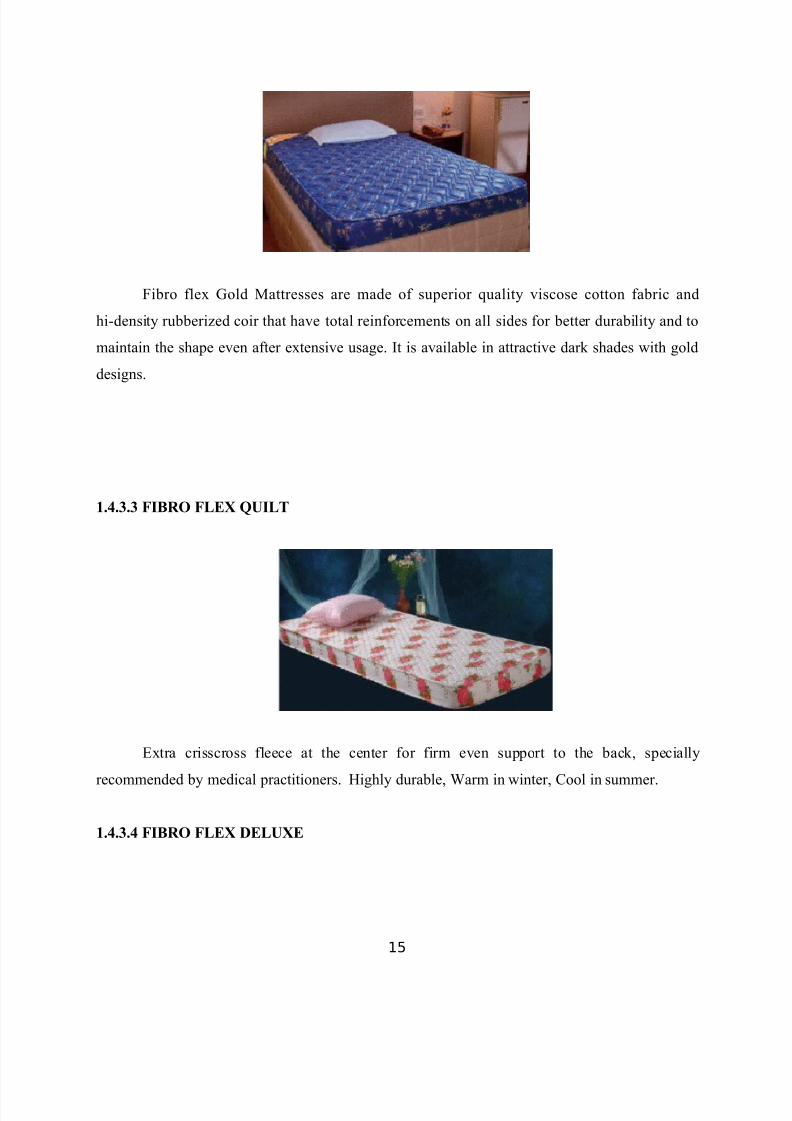
Fibro flex Gold Mattresses are made of superior quality viscose cotton fabric and
hi-density rubberized coir that have total reinforcements on all sides for better durability and to
maintain the shape even after extensive usage. It is available in attractive dark shades with gold
designs.
1.4.3.3 FIBRO FLEX QUILT
Extra crisscross fleece at the center for firm even support to the back, specially
recommended by medical practitioners. Highly durable, Warm in winter, Cool in summer.
1.4.3.4 FIBRO FLEX DELUXE
15
7/15/2019 Full Report
http://slidepdf.com/reader/full/full-report-563280c63b398 16/81
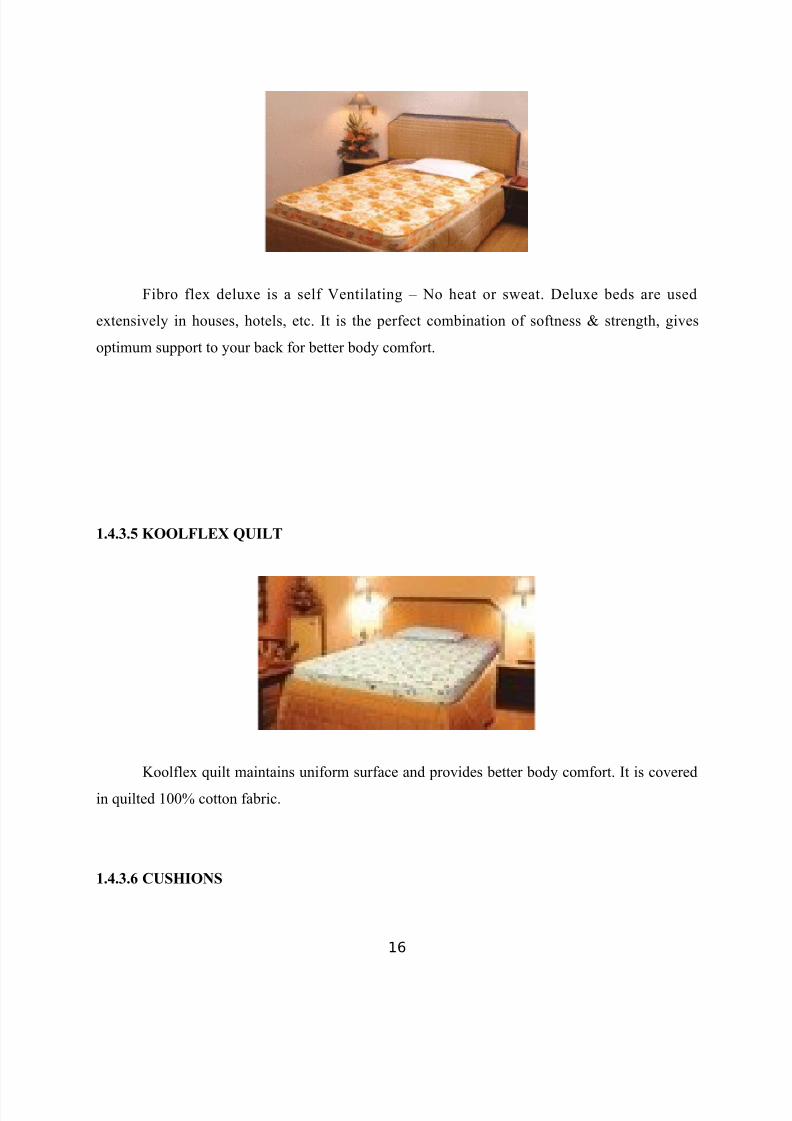
Fibro flex deluxe is a self Ventilating – No heat or sweat. Deluxe beds are used
extensively in houses, hotels, etc. It is the perfect combination of softness & strength, gives
optimum support to your back for better body comfort.
1.4.3.5 KOOLFLEX QUILT
Koolflex quilt maintains uniform surface and provides better body comfort. It is covered
in quilted 100% cotton fabric.
1.4.3.6 CUSHIONS
16
7/15/2019 Full Report
http://slidepdf.com/reader/full/full-report-563280c63b398 17/81
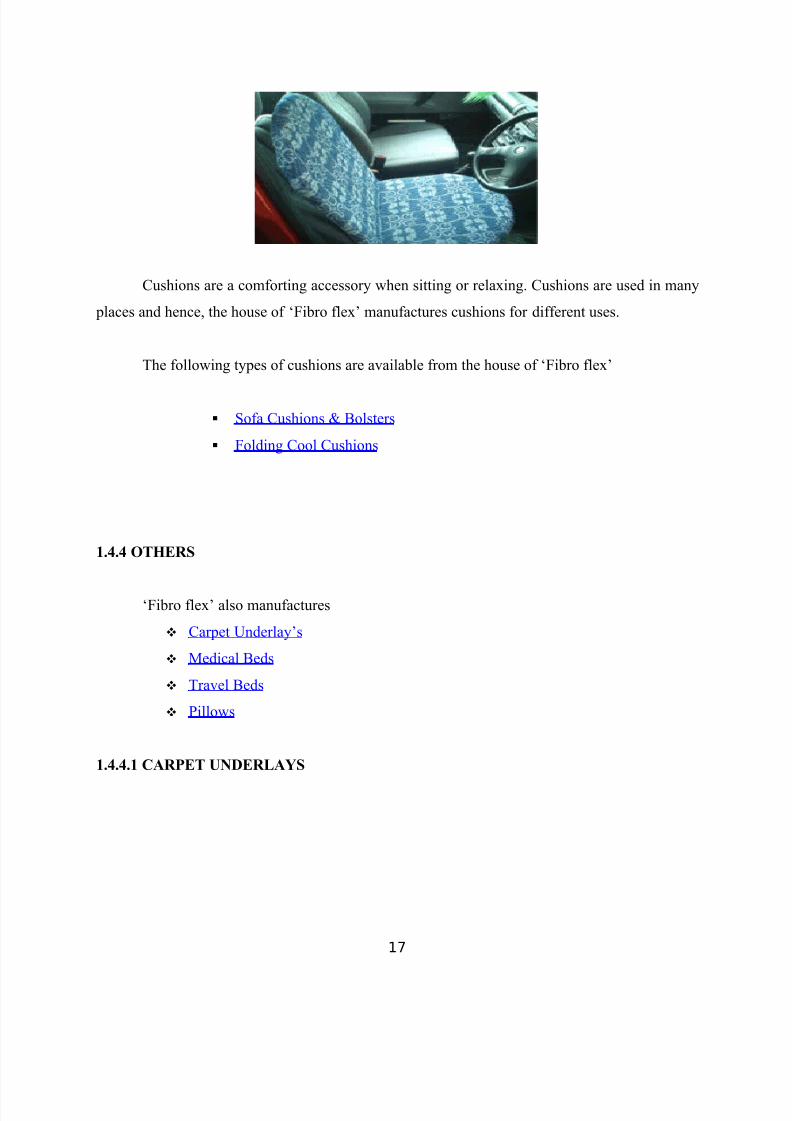
Cushions are a comforting accessory when sitting or relaxing. Cushions are used in many
places and hence, the house of ‘Fibro flex’ manufactures cushions for different uses.
The following types of cushions are available from the house of ‘Fibro flex’
Sofa Cushions & Bolsters
Folding Cool Cushions
1.4.4 OTHERS
‘Fibro flex’ also manufactures
Carpet Underlay’s
Medical Beds
Travel Beds
Pillows
1.4.4.1 CARPET UNDERLAYS
17

7/15/2019 Full Report
http://slidepdf.com/reader/full/full-report-563280c63b398 18/81
When carpets are laid, they generally adapt the texture of the floor on which they are laid.
If a downy feeling is desired, then the carpet has to be under laid. ‘Fibro flex’ provides the best
underlays, of a very high quality, in the industry. ‘Fibro flex’ underlays are the natural way to
protect and increase the life of your carpet.
1.4.4.2 BATH MATS
Bath mats are quick absorption of water, leaving you feet feeling completely dry evenafter a bath which is available in attractive shades.
1.4.4.3 MEDICAL BEDS
18
7/15/2019 Full Report
http://slidepdf.com/reader/full/full-report-563280c63b398 19/81
It is essential that patients should experience maximum comfort while recuperating, at the
same time ensuring minimal maintenance for the hospitals. ‘Fibro flex’ provides refine covered
medical beds specially made for hospitals and nursing homes. These beds are hygienic, healthy,
and comfortable and can be sterilized. Additionally, these beds are washable, moth proof and
prevent insects taking shelter. We supply all sizes as per requirement. Beds also specially made
for fowler cots.
1.4.4.4 TRAVEL BEDS
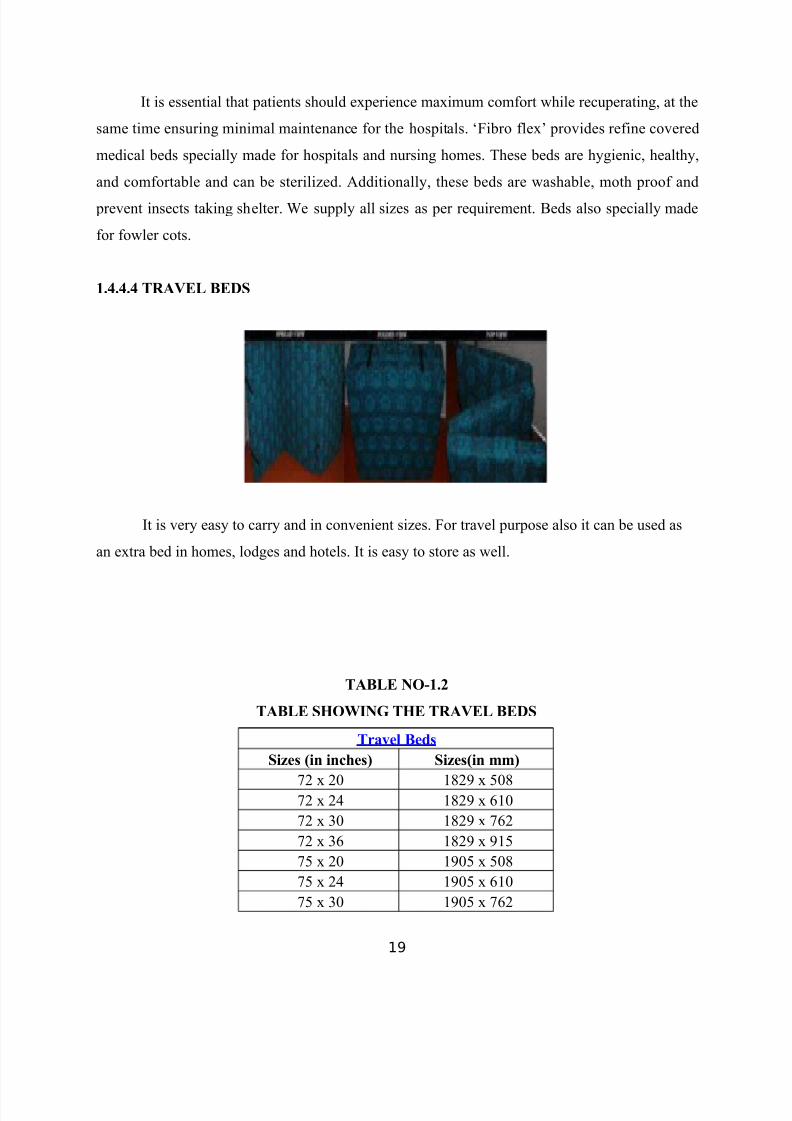
It is very easy to carry and in convenient sizes. For travel purpose also it can be used as
an extra bed in homes, lodges and hotels. It is easy to store as well.
TABLE NO-1.2
TABLE SHOWING THE TRAVEL BEDS
Travel Beds
Sizes (in inches) Sizes(in mm)
72 x 20 1829 x 50872 x 24 1829 x 61072 x 30 1829 x 76272 x 36 1829 x 91575 x 20 1905 x 50875 x 24 1905 x 61075 x 30 1905 x 762
19

7/15/2019 Full Report
http://slidepdf.com/reader/full/full-report-563280c63b398 20/81
75 x 36 1905 x 915
1.4.4.5 PILLOW
High quality Designer Pillows are made from very high quality raw material due to which
these carpets are widely demanded by all. These Designer Pillows are also customized accordingto our customers.
TABLE NO-1.3
Pillows
Sizes (in inches) Sizes (in mm)
25 x 15 635 x 38126 x 16 660 x 406
1.4.4.6 CANE CHAIR CUSHIONS
Cane Chair Cushions as its name suggests is to be used on a cane chair. They cushion youfrom the hard cane and support your back.
TABLE NO-1.4
TABLE SHOWING CANE CHAIR CUSHIONS FEATURES AND MARKET POSITION
20
7/15/2019 Full Report
http://slidepdf.com/reader/full/full-report-563280c63b398 21/81
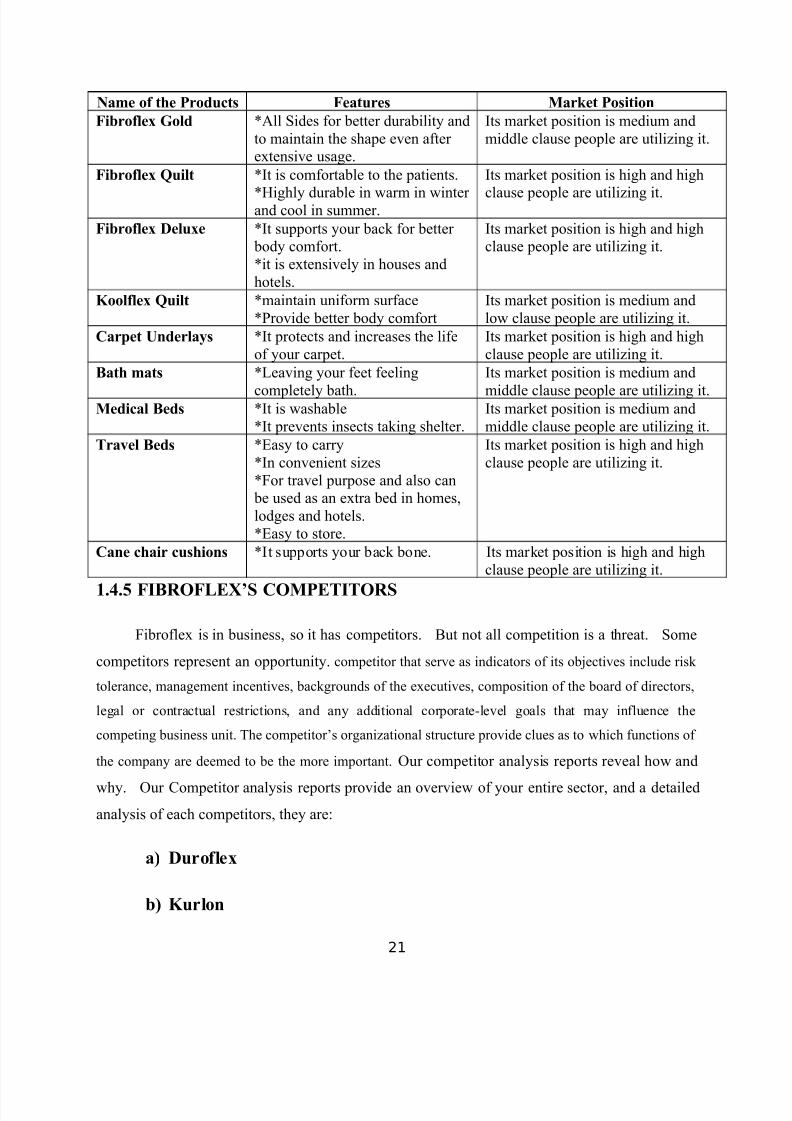
Name of the Products Features Market Position
Fibroflex Gold *All Sides for better durability andto maintain the shape even after extensive usage.
Its market position is medium andmiddle clause people are utilizing it.
Fibroflex Quilt *It is comfortable to the patients.
*Highly durable in warm in winter and cool in summer.
Its market position is high and high
clause people are utilizing it.
Fibroflex Deluxe *It supports your back for better body comfort.*it is extensively in houses andhotels.
Its market position is high and highclause people are utilizing it.
Koolflex Quilt *maintain uniform surface*Provide better body comfort
Its market position is medium andlow clause people are utilizing it.
Carpet Underlays *It protects and increases the lifeof your carpet.
Its market position is high and highclause people are utilizing it.
Bath mats *Leaving your feet feeling
completely bath.
Its market position is medium and
middle clause people are utilizing it.Medical Beds *It is washable*It prevents insects taking shelter.
Its market position is medium andmiddle clause people are utilizing it.
Travel Beds *Easy to carry*In convenient sizes*For travel purpose and also can be used as an extra bed in homes,lodges and hotels.*Easy to store.
Its market position is high and highclause people are utilizing it.
Cane chair cushions *It supports your back bone. Its market position is high and highclause people are utilizing it.
1.4.5 FIBROFLEX’S COMPETITORS
Fibroflex is in business, so it has competitors. But not all competition is a threat. Some
competitors represent an opportunity. competitor that serve as indicators of its objectives include risk
tolerance, management incentives, backgrounds of the executives, composition of the board of directors,
legal or contractual restrictions, and any additional corporate-level goals that may influence the
competing business unit. The competitor’s organizational structure provide clues as to which functions of
the company are deemed to be the more important. Our competitor analysis reports reveal how and
why. Our Competitor analysis reports provide an overview of your entire sector, and a detailedanalysis of each competitors, they are:
a) Duroflex
b) Kurlon
21
7/15/2019 Full Report
http://slidepdf.com/reader/full/full-report-563280c63b398 22/81
c) Coiron
1.4.5.1 PRODUCTS OF DUROFLEX MATTRESS COMPANY
The following products are the products of Duroflex company;
Duroflex Spring Mattresses
Duroflex Quit
Duroflex Seasons
Duroflex Bliss
Duroflex Crown
Duroflex Body Line
Duroflex Standard DM
Duroflex Premium SLD
1.4.5.2 PRODUCTS OF KURL-ON MATTRESS COMPANY
1.4.5.2.1 PILLOW
The followings are the various pillows;
22

7/15/2019 Full Report
http://slidepdf.com/reader/full/full-report-563280c63b398 23/81
• Grazel Premium Pillow
• Latex Pillow
• Chimera Pillow
• Sleepzzz Pillow
• Velve Touch Pillow
• Super soft Pillow
• Kalpana Pillow
• Lotus Pillow
• Slym Pillow
• Grazel Pillow
1.4.5.2.2 MATTRESS
The followings are the various mattresses;
Klassic Mattress
Klassicplus Mattress
Romantique Mattress
Super Deluxe Mattress
Apna Regular Mattress
Apna Popular Mattress
Spine Kare Mattress
Spine Kare Ultra Mattress
Twinz Mattress
23

7/15/2019 Full Report
http://slidepdf.com/reader/full/full-report-563280c63b398 24/81
2.1. RESEARCH METHODOLOGY
2.1.1 INTRODUCTION
Research is an art of scientific investigation through search of new facts in any branch of
knowledge. It is movement from unknown to known. The study of research methodology gives
the student the necessary training in gathering materials required, and also training in technique
for the collection of data appropriate to particular problem. It helps in the use of statistics,
questionnaire and controlled experimentation and in recording evidences, sorting it out and
interpreting it. Knowledge of research methodology is helpful in various fields. Research
methodology plays key role in project work. It consists of series of actions or steps necessary to
effectively carry out research and the desired sequencing of these steps. Basic features of a
research process are: Research always starts with a question or a problem. It s purpose is to find
answers to questions through the application of scientific method. It is a systematic and intensive
study directed towards a more complete knowledge of the subject studied.
2.1.2 METHODS OF DATA COLLECTION
Data collection is an elaborate process in which the researcher makes a planned search for all relevant data and is the foundation of all marketing research. It is the raw material with which
a marketer researcher functions. The task of data collection begins after a research problem has
been defined and research plan is chalked out. While deciding about the method of data
collection to be used for the study the researcher should keep in mind two types of data viz.,
primary data and secondary data.
24
7/15/2019 Full Report
http://slidepdf.com/reader/full/full-report-563280c63b398 25/81
2.1.3 SOURCES OF DATA
There are two types of data done or used in research methodology. They are as follows;
A. Primary data
B. Secondary data
2.1.3.1. a). PRIMARY DATA
The data that is being collected for the first time or to particularly fulfill the objectives of
the project is known as primary data. The data can be classifies as primary data, which is
gathered for the first time by the researcher and thus happen to be original in character.
Interpersonal interview method and telephonic interview method were used to collect the
primary data.
2.1.3.2. b).SECONDARY DATA
Secondary data is the data already collected by others for purposes other than solution of the
problem at hand. In case of Secondary data the nature of data collection work is merely that of
compilation. Secondary data has several supplementary uses.
2.1.3.3. a). INTERNAL SOURCCES
• Company records
• Service reports
• Yellow pages
2.1.3.4. b). EXTERNAL SOURCES
• Web pages of organizations and journals
• Magazines
• Newspapers
25
7/15/2019 Full Report
http://slidepdf.com/reader/full/full-report-563280c63b398 26/81
2.1.4 RESEARCH DESIGN
A research design is the arrangement of conditions for collection and analysis of data in a
manner that aims to combine relevance to the research purpose with economy in procedure. The
research design is the conceptual structure within which research is conducted. It constitutes the
blueprint for the collection measurement and analysis of data. Here in this study the researcher
chooses Descriptive Research. This study is concerned with describing the characteristics of a
particular individual or of a group.
2.1.5 SAMPLING DESIGN/TECHNIQUES
Sampling is the process of selecting a sufficient number of elements from the population,
so that a study of the sample and an understanding of its properties or characteristics would make
it possible for us to generalize such properties or characteristics to the population elements.
Sampling design is to clearly define set of objects, technically called the universe to be studied.
Sampling technique used is Convenience Sampling.
2.1.6 SAMPLING SIZE
Sample is small group taken under consideration from total customer population. This
small group represents the total population. In the project the researcher studied market in
Tirunelveli. As it was impossible to approach all respondents of city, a sample was selected as
100 respondents.
2.1.7. Competitors Analysis: A sample size of ten competitors was selected for the analysis.
The competitors selected for the study were chosen with the consent of the company, as the
management thought that these competitors could pose serious threat in the future.
26

7/15/2019 Full Report
http://slidepdf.com/reader/full/full-report-563280c63b398 27/81
2.1.7 TECHNICAL TOOLS USED FOR ANALYSIS
Analysis is the process of placing the data in the ordered form, combining them with theexisting information and extracting the meaning from them. The raw data becomes information
only when they are analyzed and when put in a meaningful form.
Chi-square test
Henry garret ranking method
Weighted average method
Analysis of Variance (ANOVA) Factor analysis
2.1.7.1 CHI-SQUARE ANALYSIS
The chi-square test is an important test among the several tests of significance developed
by statisticians. Chi-square, (symbolically written as χ2) is a statistical measure used in the
context of sampling analysis for comparing a variance to a theoretical variance. As a non-
parametric test, it can be used to determine if the categorized data shows dependency or the two
classifications are independent. It can also be used to make comparison between theoretical
population and actual data when categories are used. Thus, chi-square test is applicable in large
number of problems.
Chi-Square (χ 2) test was used, and the formula of Chi-Square test is furnished below:
(O-E) 2
Chi-Square (χ 2
) = ∑ E
Degree of Freedom = (R-1) (C-1)
Whereas, O = Observed Frequency
E = Expected Frequency
R = Number of Rows
27

7/15/2019 Full Report
http://slidepdf.com/reader/full/full-report-563280c63b398 28/81
C = Number of Columns
2.1.7.2 HENRY GARRET RANKING METHOD
This technique was used to evaluate the problems faced by the policy holders of health
insurance policy. In this method, the policy holders were asked to rank the given problem
according to the magnitude of the problem. The orders of merit given by the respondents were
converted into ranks by using following formula.
Percentage position= 100(R ij-0.5)
N j
Where,
R ij= Rank given for ith item jth individual
N j= Number of items ranked by jth individual
The percentage position of each rank thus obtained was converted into scores by referring
to the tables given by Henry Garrett. Then to each factor the scores of individual respondents
were added together and divided by the total number of respondents for whom the scores were
added. These means scores for all the factors was arranged in the order of their ranks and
inferences were drawn.
2.1.7.3 WEIGHTED AVERAGE
The weighted average technique was used to find out the weighted average score for each
category of respondents over several study factors to know their level of opinion towards the
statement agreed or disagreed. For this purpose the qualitative information was converted into
five points scaling techniques.
28

7/15/2019 Full Report
http://slidepdf.com/reader/full/full-report-563280c63b398 29/81
2.1.7.4 ANALYSIS OF VARIANCE (ANOVA)
Analysis of variance is an extremely useful technique concerning researches in the fieldof economics, biology, education, psychology, sociology, and business/industry and in
researches of several other disciplines. This technique is used when multiple sample cases are
involved. The ANOVA technique enables us to perform this simultaneous and as such is
considered to be an important tool of analysis in the hands of a researcher. Using this technique,
one can draw inferences about where the samples have been drawn from populations having the
same mean. ANOVA is essentially a procedure for testing the difference among different groups
of data for homogeneity. “The essence of ANOVA is that the total amount of variation in a set of
data is broken down into two types, the amount which can be attributed to chance and that
amount which can be attributed to specified cases”. ANOVA is the method of analyzing the
variance to which a response is subject into its various components corresponding to various
sources of variation.
2.1.7.5 FACTOR ANALYSIS
Factor analysis is a method used to transform a set of variables into a small number of
linear composites, which have maximum correlation with original variables. In this study, Factor
analysis is used to study the reasons behind knowing the marketing mix that affect the purchase
decision in order to identify the major characteristics or factors considered as important by the
respondents. The purpose of factor analysis is to determine the responses from the several
numbers of statements, which are significantly correlated. If the responses of the several
statements are significantly correlated, it is believed that the statement measures some factors
common to all of them.
Factor analysis can only be applied to continuous variables (or) intervals scaled variables.
A factor analysis is like regression analysis as it tries to “best fit” factors to a scatter diagram of
data in such a way that factors explain the variance associated with responses to each statement.
29

7/15/2019 Full Report
http://slidepdf.com/reader/full/full-report-563280c63b398 30/81
2.1.8 DATA EVALUATION
All the data collected was filtered & only relevant data is introduced in the report which
helped in achieving objective of the project. This relevant data is finally analyzed and evaluated
to make the final report and to deduce final conclusion.
30

7/15/2019 Full Report
http://slidepdf.com/reader/full/full-report-563280c63b398 31/81
2.2 REVIEW OF LITERATURE
Review of literature is an integral part of any research studies which includes other
researches points and findings. The main aim of including review of literature to any research
process is which give suitable support and guidance to accomplish the new research process.
Any review of literature includes objectives, research methodology and findings.
Review of literature chapter of any studies is the collection of various studies done by
various researcher in same topic or related topic in every studies each and every researchers are
followed different method for accomplish his objectives. Each studies are giving more and
suitable ideas for accomplish the new researchers objectives. Each studies are giving more and
suitable ideas for accomplish the new researchers objectives. In the study, the researcher using
ten different researchers and it support to make a good inclusion to this study.
31
7/15/2019 Full Report
http://slidepdf.com/reader/full/full-report-563280c63b398 32/81
1. Tim S. McLaren, Milena M. Head and Yufei Yuan, Yolande E. Chan (2011)1
To compete in a highly dynamic marketplace, firms must frequently adapt and align their
competitive strategies and information systems. The dominant literature on the strategic fit of a
firm’s information systems focuses primarily on high-level measures of the strategic fit of a
firm’s overall IS portfolio and the impact of fit on business performance. This paper addresses
the need for a more fine-grained approach for assessing the specific areas of misfit between a
firm’s competitive strategies and IS capabilities. We describe the design and evaluation of a
multilevel strategic fit (MSF) measurement model that enables researchers and practitioners to
measure the strategic fit of a firm’s information systems at both an overall and a detailed level.
The steps in the model include identifying the relevant IS capabilities according to the type of system; measuring the current level of support for each capability using a capabilities instrument;
identifying the ideal level of support for each capability using an adaptation of Conant et al.’s
(1990) instrument to assess strategic archetype; and comparing the ideal and realized level of
support for each capability. Evidence from a multiple case study analysis indicates that the fine-
grained assessment of strategic fit can strengthen the validity, utility, and ease of corroboration
of the strategic fit measurement outputs. The paper also demonstrates how an iterative design
science research approach, with its emphasis on evaluating the utility of prototype artifacts, is
well suited to developing field-tested and theoretically grounded measurement models and
instruments that are accessible to practitioners. This focus on practical utility in turn provides
researchers with results that can be more readily corroborated, thus improving the quality and
usefulness of the research findings.
10.1080/01446193.2010.52072
32
7/15/2019 Full Report
http://slidepdf.com/reader/full/full-report-563280c63b398 33/81
1.Tim S. Mclaren, Milena M. Head and Yufei Yuan, Yolande E. Chan, A Multilevel Model For Measuring Fit Between A Firm’s Competitive Strategies And
Information Systems Capabilities1, MIS Quarterly Vol. 35 No. 4 pp. 909-929/December 2011.
2. Reginald Sheppard, (2011)2
This paper provides a comparative analysis of market orientation in the New England States
Commercial Fish Processing Sector to that of Atlantic Canada. Part I is an exploratory analysis
of market orientation in the New England setting. Part II is concerned with the construction of a
parsimonious seasonal market orientation model for the North-Eastern Atlantic Commercial Fish
Processing Sector. Using structural equation modeling, the author provides an interpretable
solution of market orientation in this broad industry setting. The paper concludes with a
discussion of limitations on the research, and recommendations for future research initiatives.
3. Allen Z. Reich (2011)3
The concept of competing for the customer, like many concepts, appears deceptively
simple. A problem with some restaurants’ analyses of customers and competitors is that they are
often viewed as isolated events, decreasing the effectiveness with which information is
incorporated in the firm’s research, planning, and implementation efforts. The concept of relative
perceived product quality not only synthesizes the customer and competitor analyses, but it
provides management with a means of ingraining the new relevant information into the
marketing planning process. As important as this concept is, it has received virtually no coverage
in general business and hospitality research.
2. Reginald Sheppard,A Comparative Analysis of Market Orientation in the Commercial Fish Processing Industries of Atlantic Canada and The New England States
University of New Brunswick, Journal of Marketing Development and Competitiveness vol. 5(6) 2011 27.
33
7/15/2019 Full Report
http://slidepdf.com/reader/full/full-report-563280c63b398 34/81
3. Allen Z. Reich, Relative Perceived Product Quality: Increasing the Effectiveness of Restaurant Planning
Through a More Effective Integration of the Competitive Environment, Journal of Foodservice Business Research, 14:2–19, 2011
Copyright © Taylor & Francis Group, LLC ISSN: 1537-8020 print/1537-8039 online DOI: 10.1080/15378020.2011.548204
4. Kenneth Dao-Ping Ko, (2011)4
In this article, we use regression analysis to examine the relationships of stock prices of 10
sets of major competitors. Six of the 10 sets of competitors had strong regression relationships
between their stock prices with R2=0.8. Furthermore, through looking at the slopes from the
regression equations, we identified the relative sensitivity of a company’s stock price to that of
its competitor’s. Given R 2 and slope, we were able to determine how concerned a company
should be with its competitor’s stock price. Our analysis revealed that three sets of companies
have R 2=0.8 and slope>=1.
5. KumikoFukumura and Roger P. G. van Gompel, Martin J. Pickering, (2010)5
Most theories of reference assume that a referent’s saliency in the linguistic context
determines the choice of referring expression. However, it is less clear whether cognitive factors
relating to the nonlinguistic context also have an effect. We investigated whether visual context
influences the choice of a pronoun over a repeated noun phrase when speakers refer back to a
referent in a preceding sentence. In Experiment 1, linguistic mention as well as visual presence
of a competitor with the same gender as the referent resulted in fewer pronouns for the referent,
suggesting that both linguistic and visual context determined the choice of referring expression.
Experiment 2 showed that even when the competitor had a different gender from the referent, its
visual presence reduced pronoun use, indicating that visual context plays a role even if the use of
a pronoun is unambiguous. Thus, both linguistic and nonlinguistic information affect the choice
of referring expression.
34
7/15/2019 Full Report
http://slidepdf.com/reader/full/full-report-563280c63b398 35/81
4. Kenneth Dao-Ping Ko, The Relationships Between Stock Prices of Competitors, Journal of Transnational Management, 16:36–42, 2011 Copyright # Taylor &
Francis Group, LLC ISSN: 1547-5778 print=1547-5786 online DOI: 10.1080/15475778.2011.549809.
5. KumikoFukumura and Roger P. G. van Gompel, Martin J. Pickering, The use of visual context during the production of referring expressions, The Quarterly Journal
Of Experimental Psychology2010, 63 (9), 1700–1715.
6. Bee-lan oo, derek s. Drew, goran runeson (2010)6
Bidding strategies vary from contractor to contractor, each of which will have different
degrees of sensitivity towards the factors affecting their bidding decisions. A competitor analysis
using a linear mixed model is proposed for use by contractors as part of a more informed
approach in identifying key competitors, and as a basis for formulating bidding strategies. The
competitiveness between bids is examined according to: (i) project size, (ii) work sector; (iii)
work nature; and (iv) number of bidders. The model was tested empirically by application to a
bidding dataset obtained from a large Hong Kong contractor. Allowing for different degrees of
sensitivity towards the four bidding variables across competing contractors (i.e. with the model
parameters that varied across competing contractors), the results indicate that competitiveness in
bidding of this contractor is generally greater than the majority of its competitors.
7. Prasun Das1, Sandip Mukherjee2 (2008)7
Understanding of consumers’ perception about various product features helps companies to
identify their own strengths and weaknesses. This article aims at finding the relative brand
position of a company along with the nature of preference as perceived by the customers towards
its major competitors. Information obtained through a feedback survey was subjected to analysis
using multivariate statistical techniques. Feature-based preferences by the customers to
evaluating companies’ performances in the retail footwear market are reported here.
35
7/15/2019 Full Report
http://slidepdf.com/reader/full/full-report-563280c63b398 36/81
6. Bee-lan oo, derek s. Drew, goran runeson, Competitor analysis in construction bidding, Construction Management and Economics ( December 2010)28s, DOI:
10.1080/01446193.2010.520721
7. Prasun Das1, Sandip Mukherjee2, Modeling of Customer Preferences on Product Features and Comparingthe Competitors’ Performances, Quality Engineering,
20:53–62, 2008 Copyright # Taylor & Francis Group, LLCISSN: 0898-2112 print=1532-4222 online DOI: 10.1080/08982110701623797.
8. Johannes Ledolter , (2007)8
In this paper we consider the case of a drug manufacturer who has physician-level
information on the prescription volume for its own brand and its competitor, has complete
physician-level data on its own free-sampling plan, but has only sparse data on the competitor’s
promotion strategy. We investigate whether one is able to predict the competitor’s promotion
strategy from such limited data. We treat the competitor’s promotion as a latent (unobservable)
event, and propose a hidden Markov model (HMM) to describe its progression over time.
Analysis of actual and simulated data shows that the HMM improves our ability to infer the
missing promotion event if promotions are serially correlated. A simpler model assuming that the
probability of transition from one sampling state to the other is independent of the current state is
adequate if the serial correlation among promotions is weak. Copyright q 2007 John Wiley &
Sons, Ltd.
36
7/15/2019 Full Report
http://slidepdf.com/reader/full/full-report-563280c63b398 37/81
8 Johannes Ledolter ,Random-coefficients hidden-Markov Poisson regression models for inferring a competitor’s promotion strategy, Applied Stochastic Models In
Business And Industry Appl. Stochastic Models Bus. Ind. 2007; 23:293–305 Published online 8 March 2007 in Wiley InterScience (www.interscience.wiley.com).
DOI: 10.1002/asmb.672.
9. Mark Bergen and Margaret A. Peteraf,(2002)9
Managerial myopia in identifying competitive threats is a well-recognized phenomenon
(Levitt. 1960; Zodiac and Bazerman, 1991). Identifying such threats is particularly problematic.
since they may arise from substitutability on the supply side as well as on the demand side.
Managers who focus only on the product market arena in scanning their competitive
environment may fail to notice threats that are developing due to the resources and latent
capabilities of indirect or potential competitors. This paper brings together insights from the
fields of strategic management and marketing to develop a simple but powerful set of tools for
helping managers overcome this common problem. We present a two-stage framework for competitor identification and analysis that brings into consideration a broad range of
competitors, including potential competitors, substitutors and indirect competitors. Specifically
we draw from Peteraf and Bergen's (2001) framework for competitor identification to develop a
hierarchy of competitor awareness. That is used, in combination with resource equivalence, to
generate hypotheses on competitive analysis. This framework not only extends the ken of
managers, but also facilitates an assessment of the strategic opportunities and threats that various
competitors represent and allows managers to assess their significance in relative terms.
Copyright A: 2002 John Wiley &Sons, Ltd.
37
7/15/2019 Full Report
http://slidepdf.com/reader/full/full-report-563280c63b398 38/81
9.Mark Bergen and Margaret A. Peteraf, Competitor Identification and Competitor Analysis: A Broad-Based Managerial Approach, Managerial And Decision
Economics Mamge. Deds.Econ.23: 157-169 (2002) DOI: 10.1002/mde. 1059
10. MING-JER CHEN (1996)10
This article bridges two important subjects B in strategy: competitor analysis and interfirm
rivalry. Through a refined conceptualization of competitor analysis, the article introduces two
firm-specific, theory based constructs: market commonality, developed from the literature on
multiple-point competition, and resource similarity, derived from the resource-based theory of
the firm. The joint consideration of these two constructs shows the complementarities of these
two prominent but contrasting strategy theories. Each firm has a unique market profile and
strategic resource endowment, and a pair-wise comparison with a given competitor along these
two dimensions will help to illuminate the pre battle competitive tension between these two firms
and to predict how a focal firm may interact with each of its competitors. The idea of competitive
asymmetry is introduced, that is, the notion that a given pair of firms may not pose an equal
degree of threat to each other. To illustrate competitor mapping, measures of these two
constructs are proposed, and an example is offered. The article ends with a number of
implications for research and practice.
10. Ming-Jer Chen, Competitor Analysis And Interfirm Rivalry: Toward A Theoretical Integration, Academy of Management Review 1996, Vol. 21, No. 1. 100-134.
2.3 RESEARCH GAP
Research gap is a systematic approach to find out the uncovered area in the present study.
The Literature review is mainly focusing on the functions of competitors. The review aims at
identifying the activities of the competitors and finding out the strength and weakness of the
company of Fibroflex India (pvt) Ltd. The researcher observed the basic goal and functions of
the company to increase its competitive advantage.
The researcher has found some major points from review of literature which are called
covered areas and those are as follows- Competitor awareness, Product quality, Marketing
planning process, Brand position, Product identification, Promotion strategy, Market orientation,
38
7/15/2019 Full Report
http://slidepdf.com/reader/full/full-report-563280c63b398 39/81
and Price identification. The above mentioned points are major points identified by the
researcher from the review of literature.
The researcher has utilized some areas for his research which are not covered in the
review of literature. The uncovered areas are brand usage, initiators to select a specific brand,
experience, future plan, strategies to increase sales and market share, marketing mix factors, key
success factors (KSA) or Challenges, and marketing channel. Having these points in the mind of
researcher the researcher has done his research report titled “A study on competitor analysis with
special reference to fibroflex India (pvt) ltd”.
2.4. STATEMENT OF THE PROBLEM
As a part of this research, the researcher has conducted a study among the people of
Tirunelveli district on the behavior and attitude of the competitor in market. The sample
collection was related to the opinion of hundred people and the study focused, who are all
competitor of Fibroflex and how their activities are involved in the market. Here, in this study
based on gap found in earlier the researcher tries to focus on the uncovered area or unknown
segments of competitor analysis which may be considered as importance for company’s future
decision, budgeting and developments of other aspects of the business. The key areas are-
competitive advantage and disadvantage, strategy applied for present and future, forecasting for
the future in reference to competitor analysis.
39
7/15/2019 Full Report
http://slidepdf.com/reader/full/full-report-563280c63b398 40/81
2.5 OBJECTIVES OF THE STUDY
1. To study the conceptual frame work of competitor analysis.
2. To help management understand their competitive advantages/disadvantages relative to
competitors.
40

7/15/2019 Full Report
http://slidepdf.com/reader/full/full-report-563280c63b398 41/81
3. To generate the understanding of competitor’s past, present (most important) and future
strategies.
4. To provide an informed basis to develop strategies to achieve competitive advantage in
the future.
5. To help forecast the returns that may be made from the future investments (e.g. How will
competitors respond to a new product or pricing strategy)
2.6 SCOPE OF THE STUDY
41

7/15/2019 Full Report
http://slidepdf.com/reader/full/full-report-563280c63b398 42/81
1. This study clearly explains that how far it is easy and difficult to enter in the arena
for the new competitors and its strategies to adopt it.
2. It helps to identify Key Success Factors (KSFs) for the industry, rate by themselves
and others on each of them.
3. It indirectly helps the competitors to understand their competitive position and
others.
4. This also helps in adopting the new strategies and technologies to the competitors.
5. It clearly focuses on what marketing channel should be adopted by the competitor
for the future merits.
2.7 LIMITATIONS OF THE STUDY
42
7/15/2019 Full Report
http://slidepdf.com/reader/full/full-report-563280c63b398 43/81
• The project report was designed mainly on the belief that information provided by
the respondents is correct.
• Even though the respondents are available they are not willing to give their valuable
responses.
• The study may not be applicable to other districts.
• The time to conduct the survey was a major limitation as most of them were too
busy during working hours and had to conduct the survey only on the time allotted.
This reduces the number of respondents to 100.
43
7/15/2019 Full Report
http://slidepdf.com/reader/full/full-report-563280c63b398 44/81
3.1 PERCENTAGE ANALYSIS
TABLE NO – 3.1.1
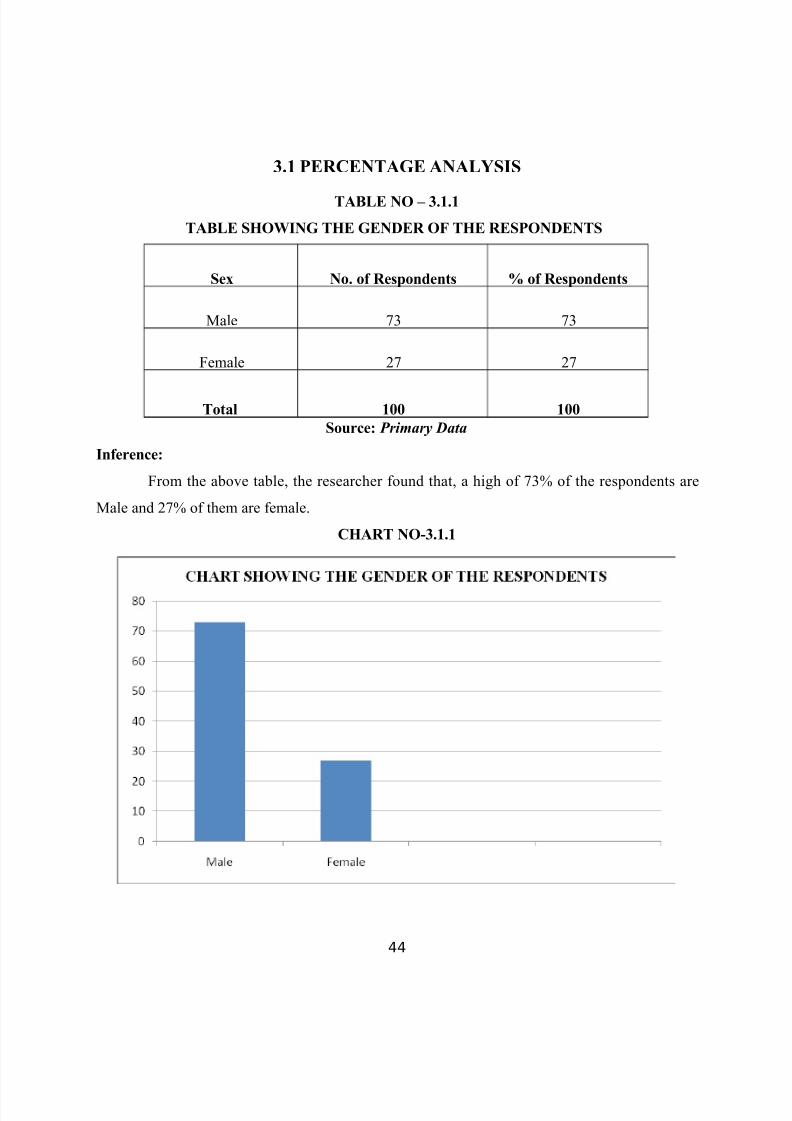
TABLE SHOWING THE GENDER OF THE RESPONDENTS
Sex No. of Respondents % of Respondents
Male 73 73
Female 27 27
Total 100 100
Source: Primary Data
Inference:
From the above table, the researcher found that, a high of 73% of the respondents are
Male and 27% of them are female.
CHART NO-3.1.1
44

7/15/2019 Full Report
http://slidepdf.com/reader/full/full-report-563280c63b398 45/81
TABLE NO – 3.1.2
TABLE SHOWING THE MARITAL STATUS OF THE RESPONDENTS
Marital status No. of Respondents % of Respondents
Married 66 66
Unmarried 34 34
Total 100 100
Source: Primary Data
Inference:
From the above table the researcher found that, a high of 66% of the respondents are
married and 34% of them are unmarried.
CHART NO-3.1.2
45

7/15/2019 Full Report
http://slidepdf.com/reader/full/full-report-563280c63b398 46/81
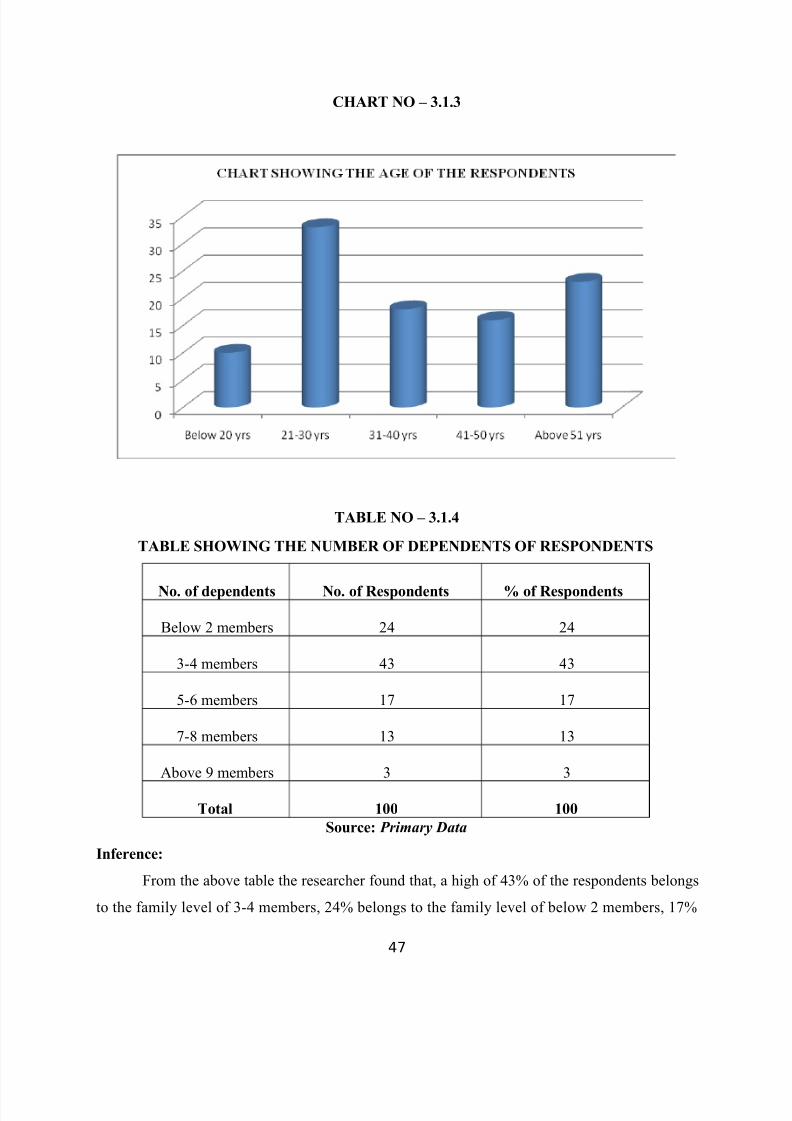
TABLE NO-3.1.3
TABLE SHOWING THE AGE OF THE RESPONDENTS
Age No. of Respondents % of Respondents
Below 20 Yrs 10 10
21-30 Yrs 33 33
31-40 Yrs 18 18
41-50 Yrs 16 16
Above 51 Yrs 23 23
Total 100 100
Source: Primary Data
Inference:
From the above table, the researcher found that, a high of 33% of the respondents belongs
to the age group of 21-30 years, 23% belongs to the age group of above 51 years, 18% belongs to
the age group of 31-40 years and the remaining are between 16% and 10% belongs to group of
41-50 years and below 20 years
46
7/15/2019 Full Report
http://slidepdf.com/reader/full/full-report-563280c63b398 47/81
CHART NO – 3.1.3
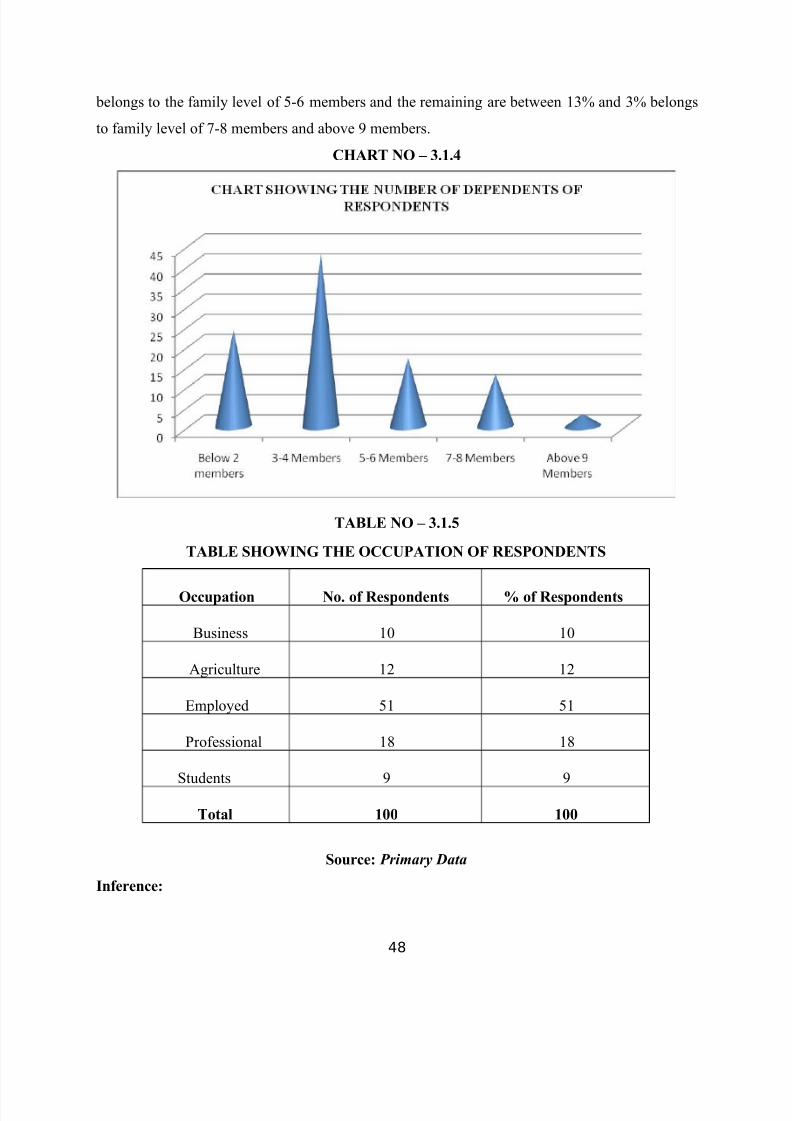
TABLE NO – 3.1.4
TABLE SHOWING THE NUMBER OF DEPENDENTS OF RESPONDENTS
No. of dependents No. of Respondents % of Respondents
Below 2 members 24 24
3-4 members 43 43
5-6 members 17 17
7-8 members 13 13
Above 9 members 3 3
Total 100 100
Source: Primary Data
Inference:
From the above table the researcher found that, a high of 43% of the respondents belongs
to the family level of 3-4 members, 24% belongs to the family level of below 2 members, 17%
47
7/15/2019 Full Report
http://slidepdf.com/reader/full/full-report-563280c63b398 48/81
belongs to the family level of 5-6 members and the remaining are between 13% and 3% belongs
to family level of 7-8 members and above 9 members.
CHART NO – 3.1.4
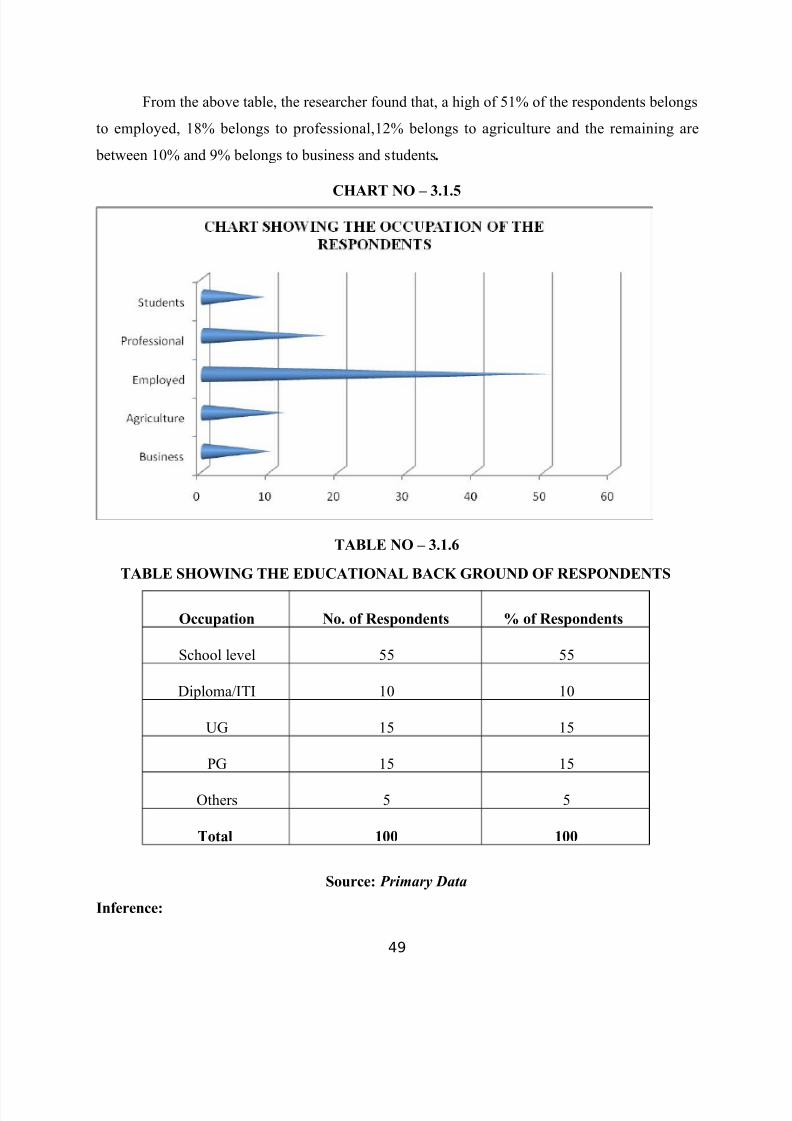
TABLE NO – 3.1.5
TABLE SHOWING THE OCCUPATION OF RESPONDENTS
Occupation No. of Respondents % of Respondents
Business 10 10
Agriculture 12 12
Employed 51 51
Professional 18 18
Students 9 9Total 100 100
Source: Primary Data
Inference:
48
7/15/2019 Full Report
http://slidepdf.com/reader/full/full-report-563280c63b398 49/81
From the above table, the researcher found that, a high of 51% of the respondents belongs
to employed, 18% belongs to professional,12% belongs to agriculture and the remaining are
between 10% and 9% belongs to business and students.
CHART NO – 3.1.5
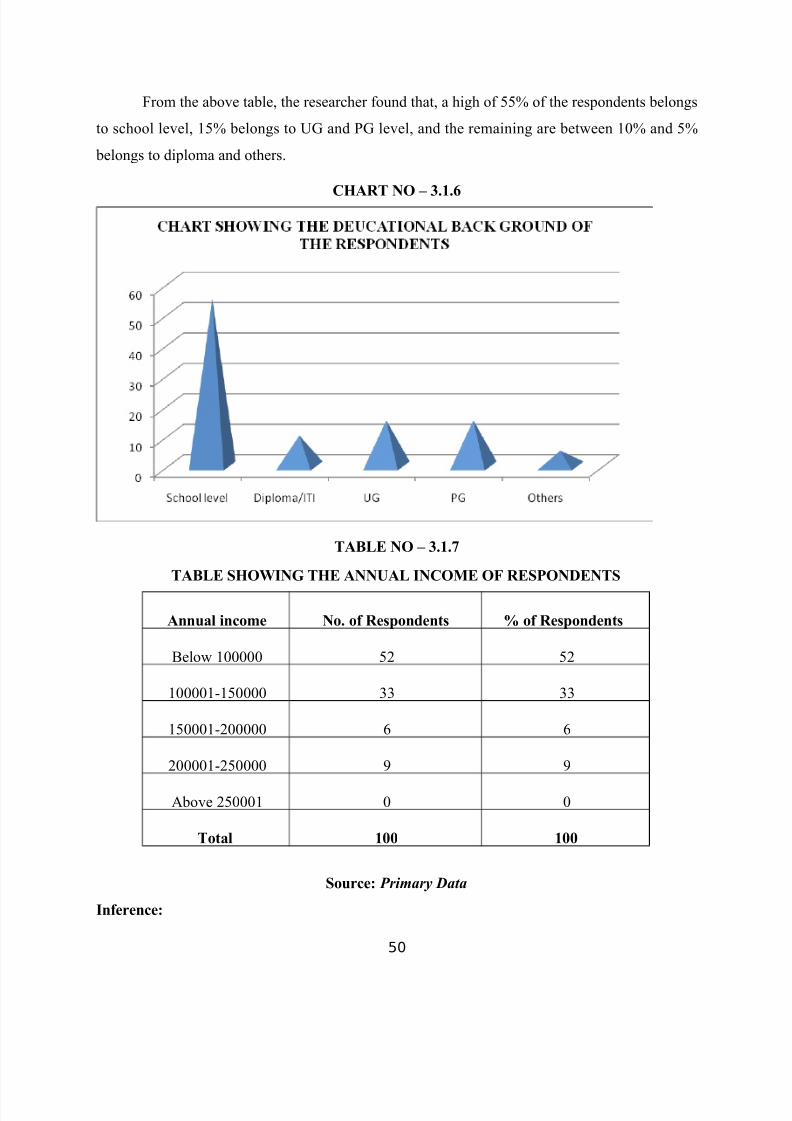
TABLE NO – 3.1.6
TABLE SHOWING THE EDUCATIONAL BACK GROUND OF RESPONDENTS
Occupation No. of Respondents % of Respondents
School level 55 55
Diploma/ITI 10 10
UG 15 15
PG 15 15
Others 5 5
Total 100 100
Source: Primary Data
Inference:
49
7/15/2019 Full Report
http://slidepdf.com/reader/full/full-report-563280c63b398 50/81
From the above table, the researcher found that, a high of 55% of the respondents belongs
to school level, 15% belongs to UG and PG level, and the remaining are between 10% and 5%
belongs to diploma and others.
CHART NO – 3.1.6
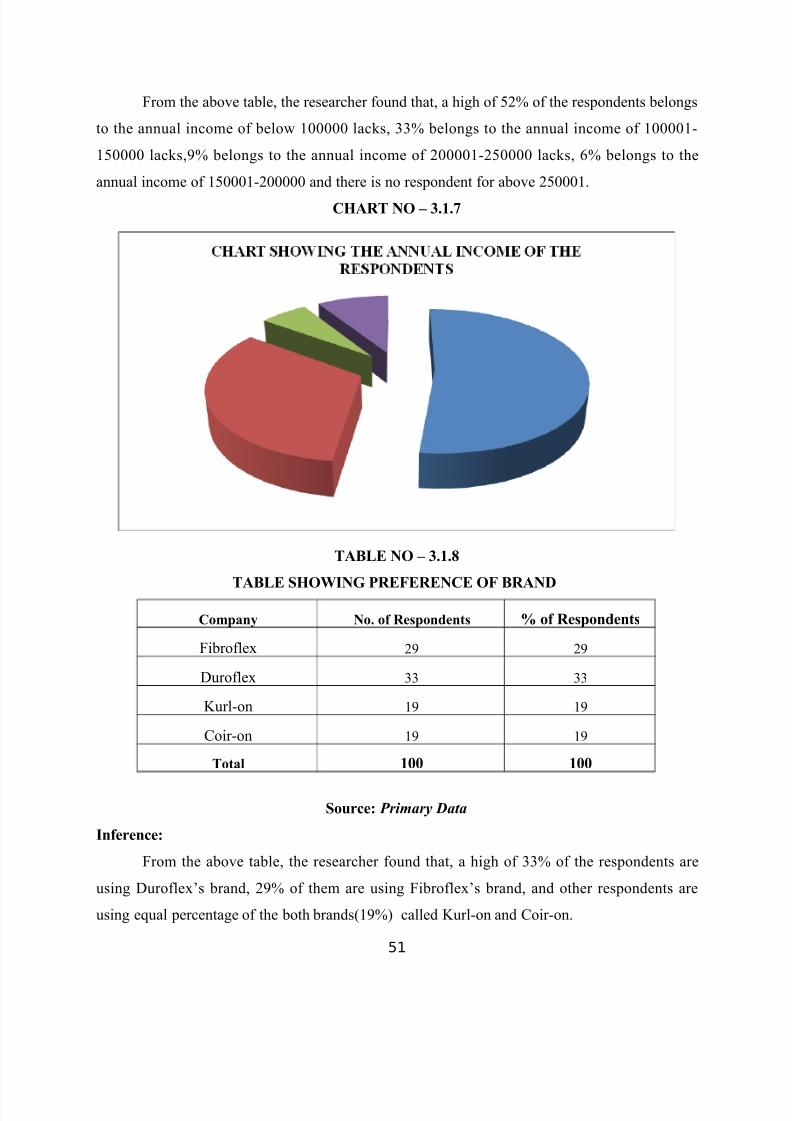
TABLE NO – 3.1.7
TABLE SHOWING THE ANNUAL INCOME OF RESPONDENTS
Annual income No. of Respondents % of Respondents
Below 100000 52 52
100001-150000 33 33
150001-200000 6 6
200001-250000 9 9
Above 250001 0 0
Total 100 100
Source: Primary Data
Inference:
50
7/15/2019 Full Report
http://slidepdf.com/reader/full/full-report-563280c63b398 51/81
From the above table, the researcher found that, a high of 52% of the respondents belongs
to the annual income of below 100000 lacks, 33% belongs to the annual income of 100001-
150000 lacks,9% belongs to the annual income of 200001-250000 lacks, 6% belongs to the
annual income of 150001-200000 and there is no respondent for above 250001.
CHART NO – 3.1.7
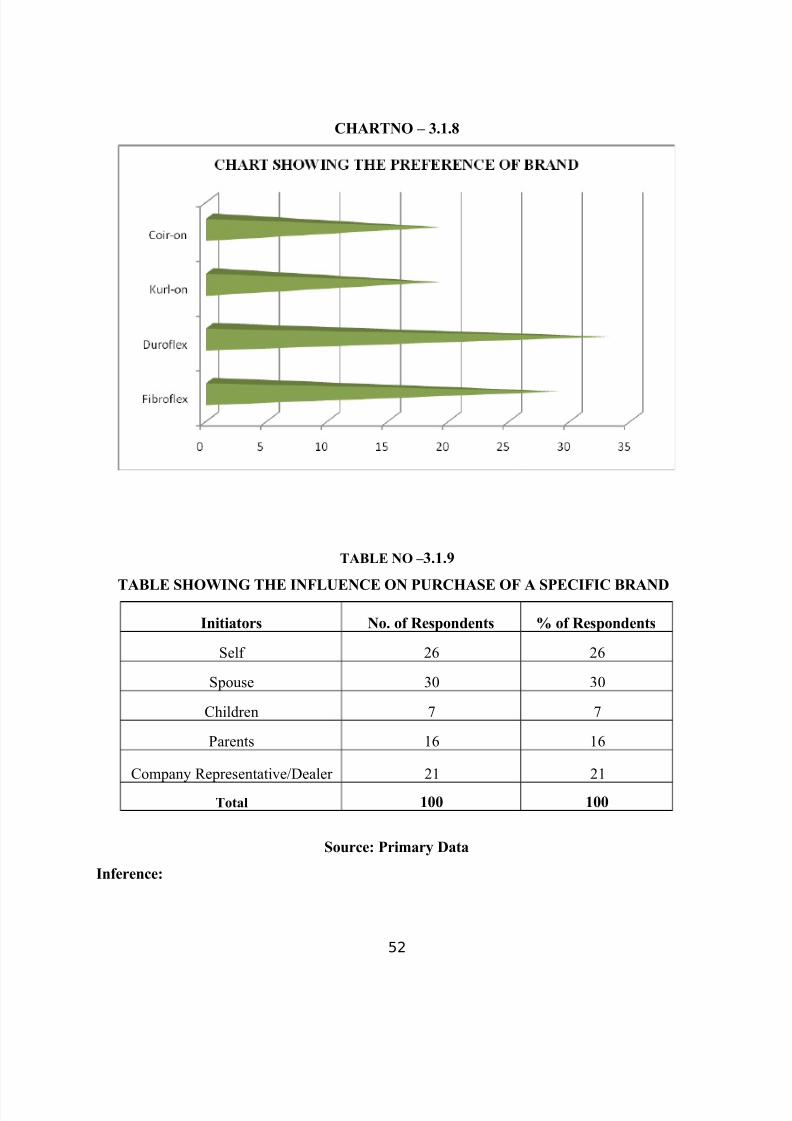
TABLE NO – 3.1.8
TABLE SHOWING PREFERENCE OF BRAND
Company No. of Respondents % of Respondents
Fibroflex 29 29
Duroflex 33 33
Kurl-on 19 19
Coir-on 19 19
Total 100 100
Source: Primary Data
Inference:
From the above table, the researcher found that, a high of 33% of the respondents are
using Duroflex’s brand, 29% of them are using Fibroflex’s brand, and other respondents are
using equal percentage of the both brands(19%) called Kurl-on and Coir-on.
51
7/15/2019 Full Report
http://slidepdf.com/reader/full/full-report-563280c63b398 52/81
CHARTNO – 3.1.8
TABLE NO – 3.1.9
TABLE SHOWING THE INFLUENCE ON PURCHASE OF A SPECIFIC BRAND
Initiators No. of Respondents % of Respondents
Self 26 26
Spouse 30 30
Children 7 7
Parents 16 16
Company Representative/Dealer 21 21
Total 100 100
Source: Primary Data
Inference:
52

7/15/2019 Full Report
http://slidepdf.com/reader/full/full-report-563280c63b398 53/81
From the above table the researcher found that, a high 30% of the respondents are
influenced by their spouse to purchase a specific brand, 26% of them are influenced by their own
(Self), 21% of them are influenced by company representative/dealer and 16% as well as 7% of
them are influenced by parents and children.
CHART NO – 3.9
TABLE NO – 3.1.10
TABLE SHOWING NUMBER OF YEARS USING THE FAVOURITE BRANDED FLEX
Experience No. of Respondents % of Respondents
Below 5 years 47 47
6-10 years 31 31
11-15 years 17 17
16-20 years 4 4Above 21 years 1 1
Total 100 100
Source: Primary Data
Inference:
53

7/15/2019 Full Report
http://slidepdf.com/reader/full/full-report-563280c63b398 54/81
From the above table the researcher found that, a high of 47% of the respondents are using the
branded flex for below 5 years, 31% of them are using the branded flex for 6-10 years,17% are
using it for 11-15 years and the remaining are between 4% and 1% are using the branded flex for
16-20 years and above 21 years.
CHART NO – 3.1.10
TABLE NO – 3.1.11TABLE SHOWING THE OPINION ABOUT THE FUTURE PLAN ABOUT THE
PRESENT USAGE BRAND
Future plan No. of Respondents % of Respondents
Continuing the usage 49 49
Exchange 26 26
Disposal 14 14
Resale 9 9
Others 2 2
Total 100 100
Source: Primary Data
Inference:
54

7/15/2019 Full Report
http://slidepdf.com/reader/full/full-report-563280c63b398 55/81
From the above table the researcher found that, a high of 49% of the respondents are interested to
continue the usage,26% of them are going for exchange,14% of them are going for disposal and
the remaining 9% and 2% are going for resale and others.
CHART NO – 3.1.11
3.2 TECHNICAL ANALYSIS
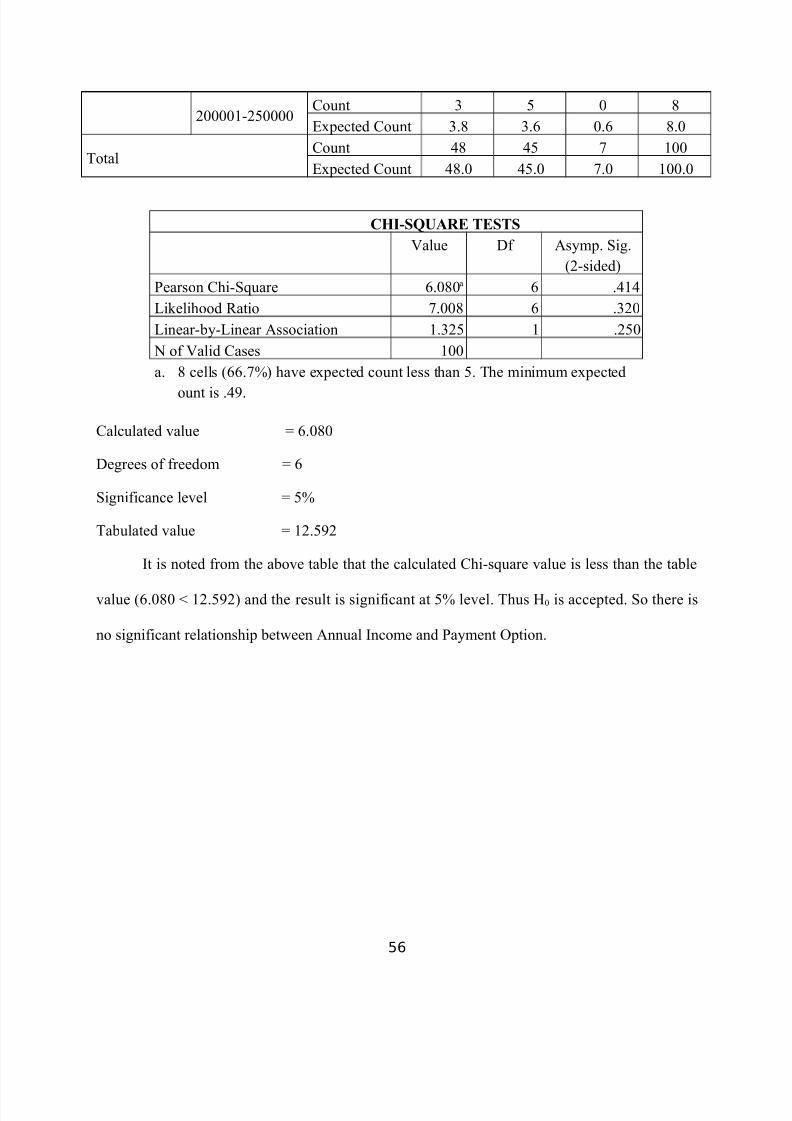
3.2.1 ANNUAL INCOME VS PAYMENT OPTION (CHI-SQUARE TESTS)
AIM
H0 = There is no significant relationship between Annual Income and Payment Option.
H1 = There is significant relationship between Annual Income and payment option.
ANNUAL INCOME * PAYMENT OPTION CROSSTABULATION
Payment option Total
High Medium LowAnnual incomeBelow 100000
Count 21 24 6 51Expected Count 24.5 23.0 3.6 51.0
100001-150000Count 20 13 1 34Expected Count 16.3 15.3 2.4 34.0
150001-200000 Count 4 3 0 7Expected Count 3.4 3.2 0.5 7.0
55
7/15/2019 Full Report
http://slidepdf.com/reader/full/full-report-563280c63b398 56/81
200001-250000Count 3 5 0 8Expected Count 3.8 3.6 0.6 8.0
TotalCount 48 45 7 100Expected Count 48.0 45.0 7.0 100.0
CHI-SQUARE TESTS
Value Df Asymp. Sig.(2-sided)
Pearson Chi-Square 6.080a 6 .414Likelihood Ratio 7.008 6 .320Linear-by-Linear Association 1.325 1 .250 N of Valid Cases 100a. 8 cells (66.7%) have expected count less than 5. The minimum expected
ount is .49.
Calculated value = 6.080
Degrees of freedom = 6
Significance level = 5%
Tabulated value = 12.592
It is noted from the above table that the calculated Chi-square value is less than the table
value (6.080 < 12.592) and the result is significant at 5% level. Thus H0 is accepted. So there is
no significant relationship between Annual Income and Payment Option.
56

7/15/2019 Full Report
http://slidepdf.com/reader/full/full-report-563280c63b398 57/81
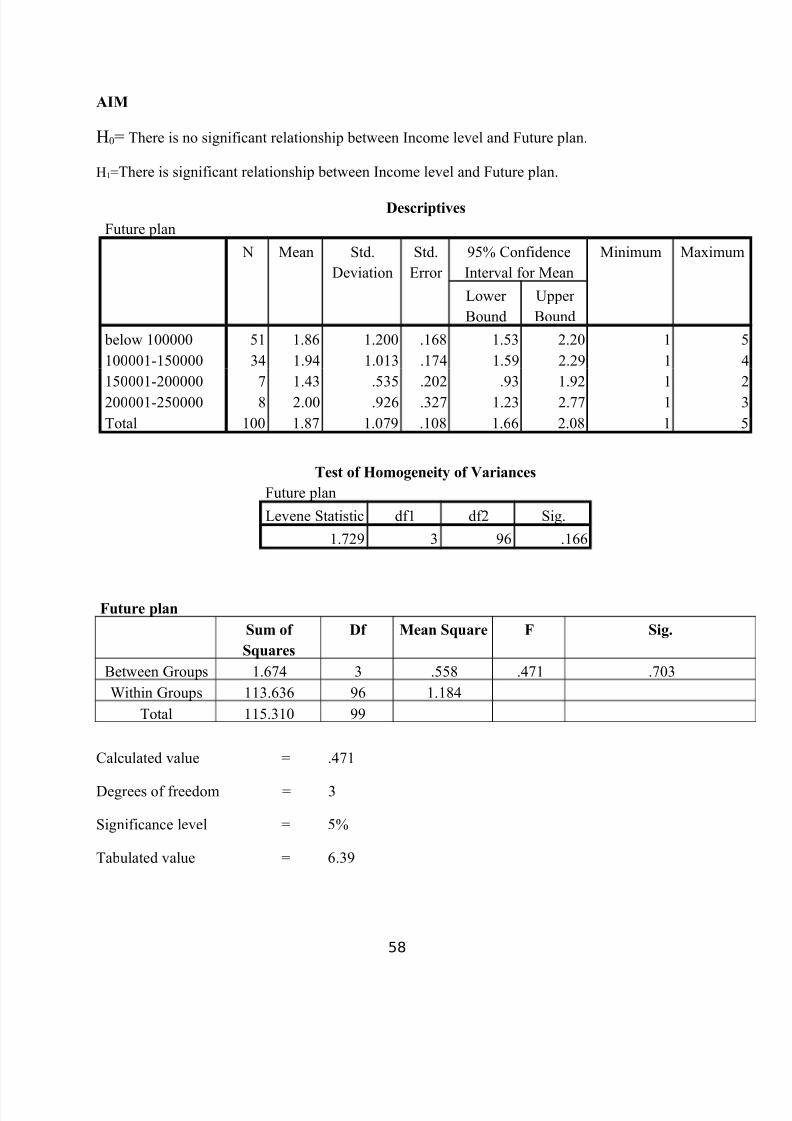
3.2.2 INCOME LEVEL VS FUTURE PLAN (ANOVA)
57
7/15/2019 Full Report
http://slidepdf.com/reader/full/full-report-563280c63b398 58/81
AIM
H0= There is no significant relationship between Income level and Future plan.
H1=There is significant relationship between Income level and Future plan.
Descriptives
Future plan
N Mean Std.Deviation
Std.Error
95% ConfidenceInterval for Mean
Minimum Maximum
Lower Bound
Upper Bound
below 100000 51 1.86 1.200 .168 1.53 2.20 1100001-150000 34 1.94 1.013 .174 1.59 2.29 1150001-200000 7 1.43 .535 .202 .93 1.92 1200001-250000 8 2.00 .926 .327 1.23 2.77 1Total 100 1.87 1.079 .108 1.66 2.08 1
Test of Homogeneity of Variances
Future plan
Levene Statistic df1 df2 Sig.
1.729 3 96 .166
Future plan
Sum of
Squares
Df Mean Square F Sig.
Between Groups 1.674 3 .558 .471 .703Within Groups 113.636 96 1.184
Total 115.310 99
Calculated value = .471
Degrees of freedom = 3
Significance level = 5%
Tabulated value = 6.39
58

7/15/2019 Full Report
http://slidepdf.com/reader/full/full-report-563280c63b398 59/81
From the table, the calculated ANOVAs value is less than the table value (.471 < 6.39)and the result is significant at 5% level. Thus H0 is accepted. So there is no significantrelationship between Income level and Future plan.
59
7/15/2019 Full Report
http://slidepdf.com/reader/full/full-report-563280c63b398 60/81
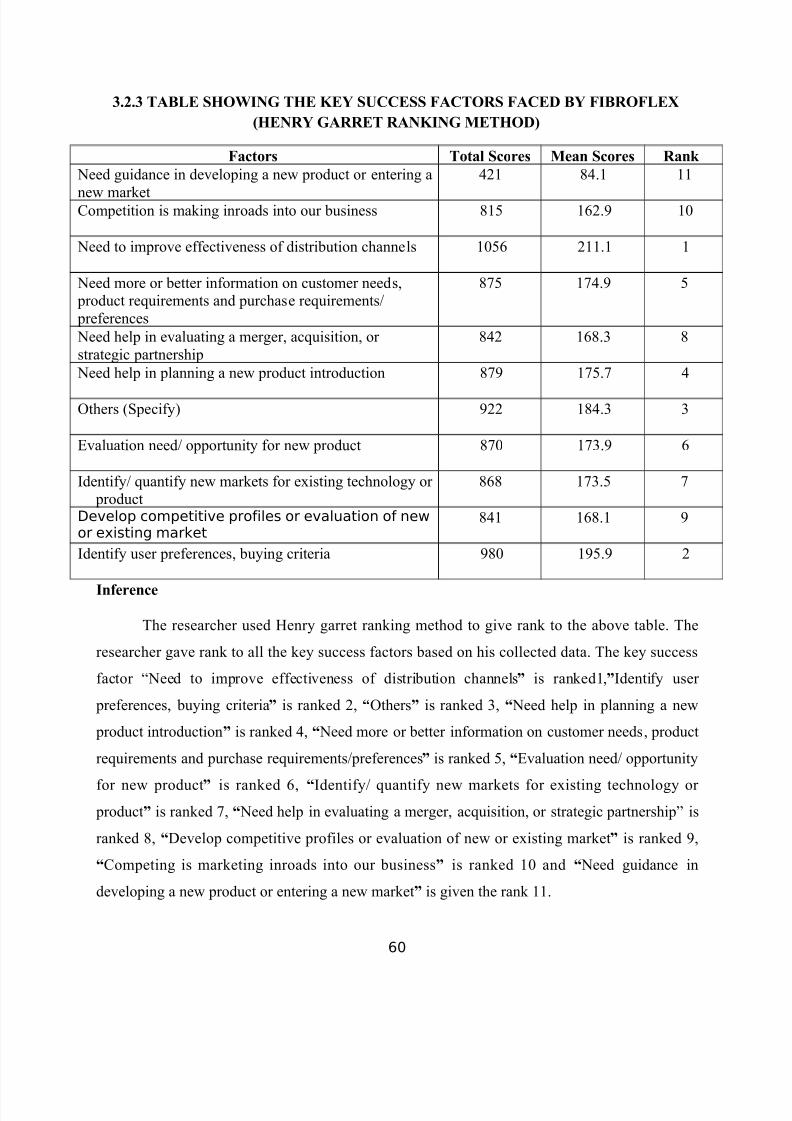
3.2.3 TABLE SHOWING THE KEY SUCCESS FACTORS FACED BY FIBROFLEX
(HENRY GARRET RANKING METHOD)
Factors Total Scores Mean Scores Rank
Need guidance in developing a new product or entering a
new market
421 84.1 11
Competition is making inroads into our business 815 162.9 10
Need to improve effectiveness of distribution channels 1056 211.1 1
Need more or better information on customer needs, product requirements and purchase requirements/ preferences
875 174.9 5
Need help in evaluating a merger, acquisition, or strategic partnership
842 168.3 8
Need help in planning a new product introduction 879 175.7 4
Others (Specify) 922 184.3 3
Evaluation need/ opportunity for new product 870 173.9 6
Identify/ quantify new markets for existing technology or product
868 173.5 7
Develop competitive profiles or evaluation of newor existing market
841 168.1 9
Identify user preferences, buying criteria 980 195.9 2
Inference
The researcher used Henry garret ranking method to give rank to the above table. The
researcher gave rank to all the key success factors based on his collected data. The key success
factor “Need to improve effectiveness of distribution channels” is ranked1,”Identify user
preferences, buying criteria” is ranked 2, “Others” is ranked 3, “ Need help in planning a new
product introduction” is ranked 4, “ Need more or better information on customer needs, product
requirements and purchase requirements/preferences” is ranked 5, “Evaluation need/ opportunity
for new product” is ranked 6, “Identify/ quantify new markets for existing technology or product” is ranked 7, “ Need help in evaluating a merger, acquisition, or strategic partnership” is
ranked 8, “Develop competitive profiles or evaluation of new or existing market” is ranked 9,
“Competing is marketing inroads into our business” is ranked 10 and “ Need guidance in
developing a new product or entering a new market” is given the rank 11.
60

7/15/2019 Full Report
http://slidepdf.com/reader/full/full-report-563280c63b398 61/81
TABLE NO-3.2.4
TABLE SHOWING THE DIFFERENT TYPE OF MARKETING CHANNELS TO
MARKET THE FIBROFLEX’S BRAND (WEIGHTED AVERAGE)
Throughdealer
Throughsub
dealer
E-Marketing
Retailing Mobile&Telemarketin
g
Throughsales
executives
Chainmarketing
Total No. of Respondents
100 100 100 100 100 100 100
Totalcompositeranks
368 1603 1235 1880 1432 1426 1759
Weights 7 3 6 1 4 5 2
Total score 2576 4809 7410 1880 5728 7130 3518
Rank 6 4 1 7 3 2 5
Inference:
The researcher used weighted average method to find out ranks to the above table. The
researcher gave rank to all marketing channels based on the data the researcher collected. The
marketing channel of E- marketing is ranked is ranked I, Through sales executives is ranked 2,
Mobile & Telemarketing is ranked 3, Through sub dealer is ranked 4, Chain marketing is ranked5, Through dealer is given the rank 6 and Retailing is ranked 7. Table No. 3.2.4 is a correlation
matrix constructed based on the ratings. The analytical process is based on the matrix of
correlation between the variables. Valuable insights can be gained from an examination of this
matrix. If the factor analysis should be proper the variables must be correlated. If the correlations
between all the variables are small, factor analysis may not be appropriate. In this inter
correlation matrix the correlation between all the variables are in good fit, hence the factor
analysis may be appropriate.
61
7/15/2019 Full Report
http://slidepdf.com/reader/full/full-report-563280c63b398 62/81
FACTOR ANALYSISTABLE NO-3.3.1 - CORRELATION MATRIX
Factor
P a y m e n t o p t i o n
V a l u e
f o r m o n e y
P r i c e c o r r e s p o n d i n g w i t h b r a n d
r e p
u t a t i o n
A d v e r t i s e m e n t
S a l e s p r o m
o t i o n a l a f f a i r s
I n f l u e n c e
o f t h e d e a l e r
C o n v e n i e n t l o c a t i o n o f d e a l e r
T i m i n g
o f d e l i v e r y
E a s y a v a i l a b i l i t
y o f e x p e c t e d b r a n d
C u s t o m i z e d s e r v i c e s
V a l u e - a d
d e d s e r v i c e s
D i s p l a y i n
t h e s h o w r o o m
P r o d u
c t q u a l i t y
B r a n d
r e p u t a t i o n
C
o l o r
C o
m f o r t
A p p e a r a n c e / A t t r a c t i v e n e s s / G o o d
l o o k A
p p e a l t o s a m
e t a r g e t g r o u p o f
Payment option1.000
Value for money-.098 1.000
Price corresponding with brand
reputation-.144 .157 1.000
Advertisement -.262 .181 -.130 1.000
Sales promotional affairs .075 .018 -.095 -.009 1.000
Influence of the dealer -.116 .088 .211 -.060 -.113 1.000
Convenient location of dealer .136 .209 .090 -.086 .059 .132 1.000
Timing of delivery -.146 -.191 -.213 -.124 -.098 -.084 -.090 1.000
Easy availability of expected brand -.124 .183 .168 .132 -.033 .118 -.079 -.237 1.000
Customized services -.087 .058 .090 -.038 -.026 .073 -.011 -.051 .170 1.000
Value-added services -.089 .321 .329 .155 -.013 .159 .007 -.178 .167 -.089 1.000
Display in the showroom -.053 .326 .429 .126 .047 .145 .212 -.346 .002 .052 .166 1.000
Product quality .017 .015 -.019 .303 -.037 .045 .063 .006 .139 -.013 -.090 .034 1.000
Brand reputation .147 -.048 -.267 -.065 .088 -.224 -.110 .066 -.139 -.036 -.186 -.288 -.073 1.000
Color .178 .143 .229 -.116 -.137 .040 .183 -.060 -.054 -.004 .027 .125 -.177 -.159 1.000
62

7/15/2019 Full Report
http://slidepdf.com/reader/full/full-report-563280c63b398 63/81
Comfort -.125 .054 .288 .086 -.059 .168 .056 -.015 -.062 -.130 .151 .143 -.041 -.315 .063 1.000
Appearance/Attractiveness/ Good
look -.043 .264 .214 .086 .174 .155 -.048 -.098 .209 .050 .235 .194 .130 -.163 -.041 -.046 1.000
Appeal to same target group of
customers-.128 .256 .152 .123 .012 .288 .044 -.042 .296 .115 .169 .153 .091 -.225 .109 -.035 -.014 1.0
63

7/15/2019 Full Report
http://slidepdf.com/reader/full/full-report-563280c63b398 64/81
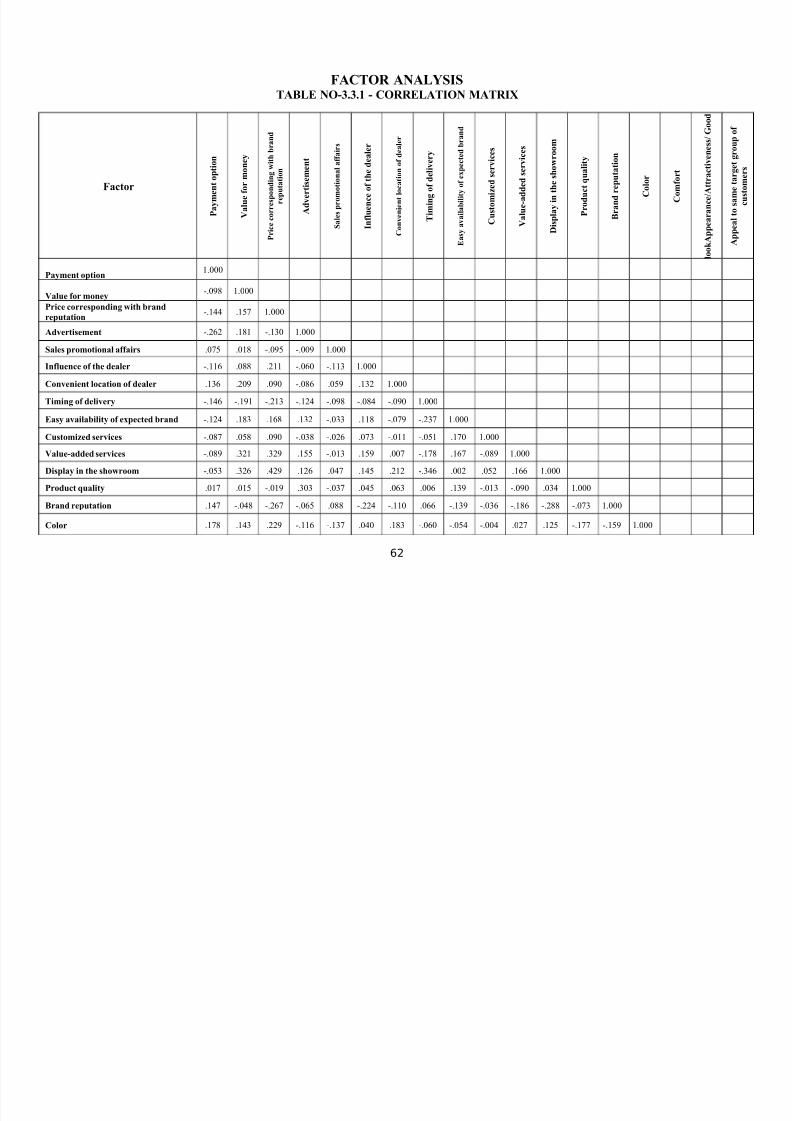
Table No. 3.3.1 is a correlation matrix constructed based on the ratings. The analytical
process is based on the matrix of correlation between the variables. Valuable insights can be
gained from an examination of this matrix. If the factor analysis should be proper the variables
must be correlated. If the correlations between all the variables are small, factor analysis may not
be appropriate. In this inter correlation matrix the correlation between all the variables are in
good fit, hence the factor analysis may be appropriate.
TABLE NO-3.3.2
K.M.O. AND BARTLETT’S TEST
Kaiser-Meyer-Olkin Measure of Sampling Adequacy. .529
Bartlett's
Test of Sphericity
Approx. Chi-Square 274.165
Df 153Sig. .000
64
7/15/2019 Full Report
http://slidepdf.com/reader/full/full-report-563280c63b398 65/81
TABLE NO-3.3.3
COMMUNALITIES
(KNOWN MARKETING MIX THAT AFFECT RESPONDENTS
PURCHASE DECISION)
Initial Extraction
Payment option 1.000 .215Value for money 1.000 .315Price corresponding with brand reputation 1.000 .503Advertisement 1.000 .397Sales promotional affairs 1.000 .014Influence of the dealer 1.000 .208
Convenient location of dealer 1.000 .214Timing of delivery 1.000 .174Easy availability of expected brand 1.000 .359Customized services 1.000 .036Value-added services 1.000 .299Display in the showroom 1.000 .429Product quality 1.000 .221Brand reputation 1.000 .305Color 1.000 .389Comfort 1.000 .173
Appearance/Attractiveness/Good look 1.000 .237Appeal to same target group of customers 1.000 .250
Extraction Method: Principal Component Analysis.
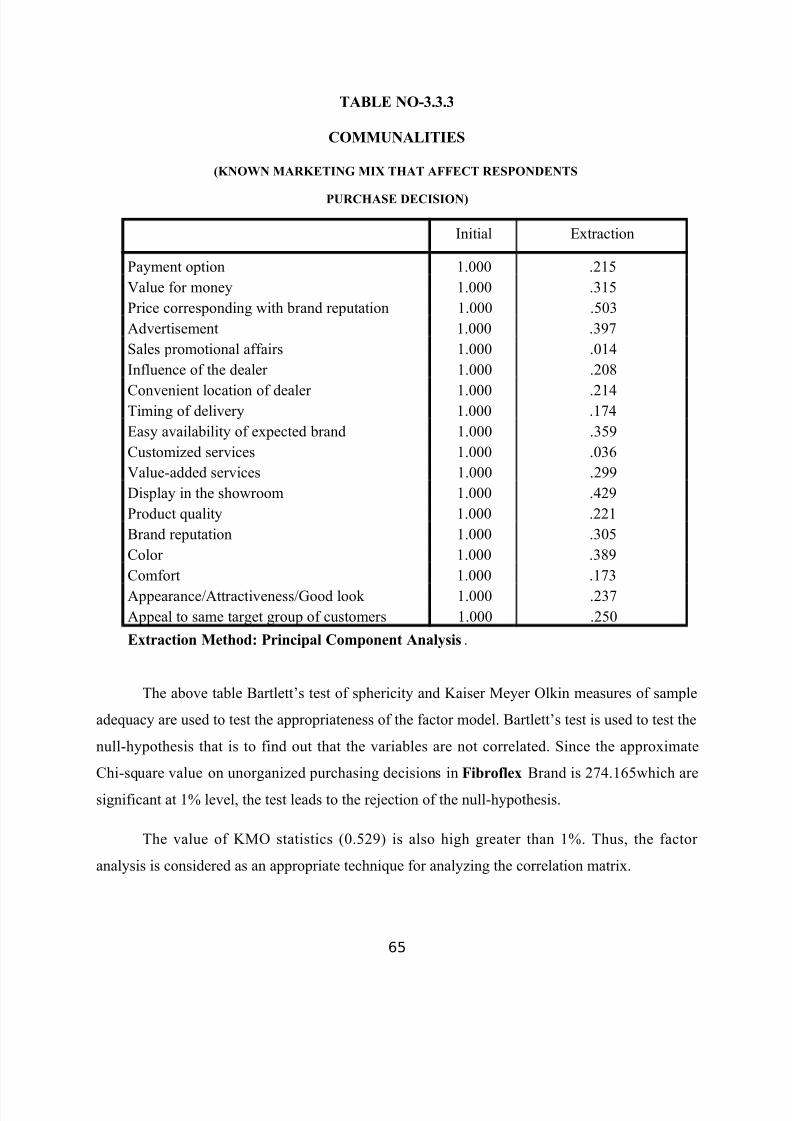
The above table Bartlett’s test of sphericity and Kaiser Meyer Olkin measures of sample
adequacy are used to test the appropriateness of the factor model. Bartlett’s test is used to test the
null-hypothesis that is to find out that the variables are not correlated. Since the approximate
Chi-square value on unorganized purchasing decisions in Fibroflex Brand is 274.165which are
significant at 1% level, the test leads to the rejection of the null-hypothesis.
The value of KMO statistics (0.529) is also high greater than 1%. Thus, the factor
analysis is considered as an appropriate technique for analyzing the correlation matrix.
65
7/15/2019 Full Report
http://slidepdf.com/reader/full/full-report-563280c63b398 66/81
TABLE NO-3.3.4
TOTAL VARIANCE EXPLAINED
Comp
onent
Initial Eigenvalues Extraction Sums of Squared
Loadings
Rotation Sums of
Squared
Loadingsa
Total % of
Variance
Cumulative
%
Total % of
Variance
Cumulative
%
Total
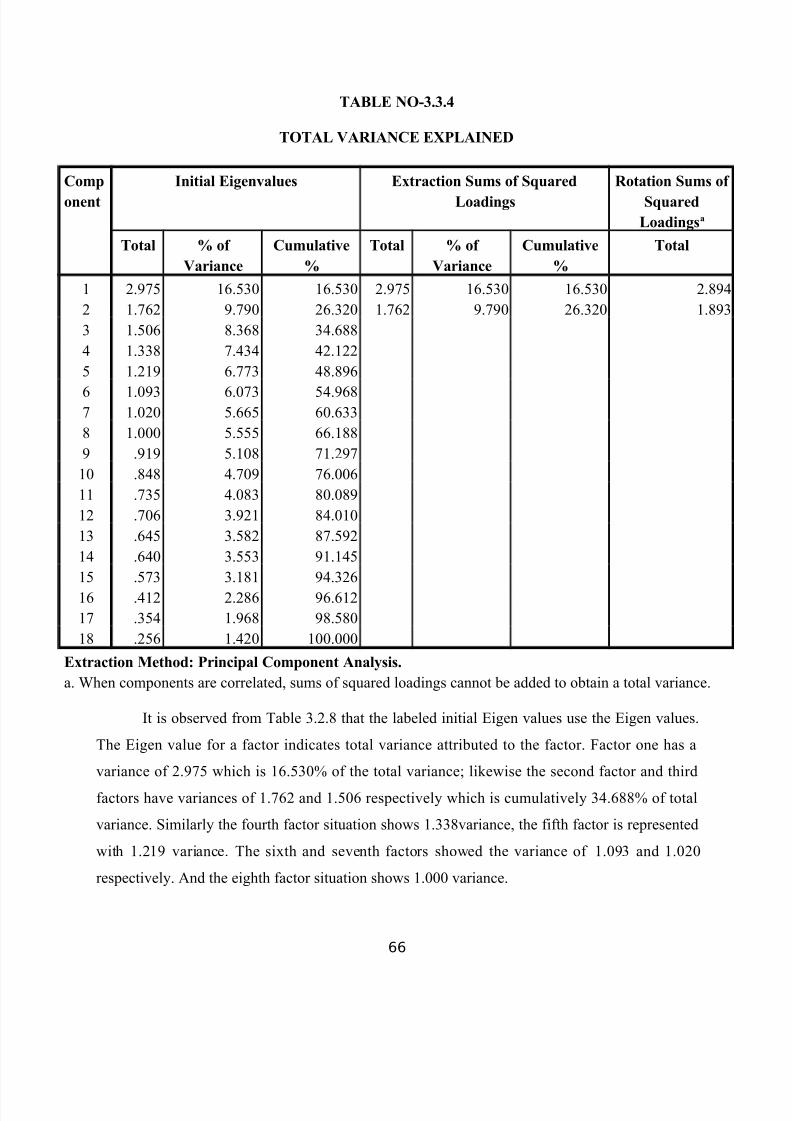
1 2.975 16.530 16.530 2.975 16.530 16.530 2.8942 1.762 9.790 26.320 1.762 9.790 26.320 1.8933 1.506 8.368 34.6884 1.338 7.434 42.1225 1.219 6.773 48.896
6 1.093 6.073 54.9687 1.020 5.665 60.6338 1.000 5.555 66.1889 .919 5.108 71.29710 .848 4.709 76.00611 .735 4.083 80.08912 .706 3.921 84.01013 .645 3.582 87.59214 .640 3.553 91.14515 .573 3.181 94.32616 .412 2.286 96.61217 .354 1.968 98.58018 .256 1.420 100.000
Extraction Method: Principal Component Analysis.
a. When components are correlated, sums of squared loadings cannot be added to obtain a total variance.
It is observed from Table 3.2.8 that the labeled initial Eigen values use the Eigen values.
The Eigen value for a factor indicates total variance attributed to the factor. Factor one has a
variance of 2.975 which is 16.530% of the total variance; likewise the second factor and third
factors have variances of 1.762 and 1.506 respectively which is cumulatively 34.688% of total
variance. Similarly the fourth factor situation shows 1.338variance, the fifth factor is represented
with 1.219 variance. The sixth and seventh factors showed the variance of 1.093 and 1.020
respectively. And the eighth factor situation shows 1.000 variance.
66
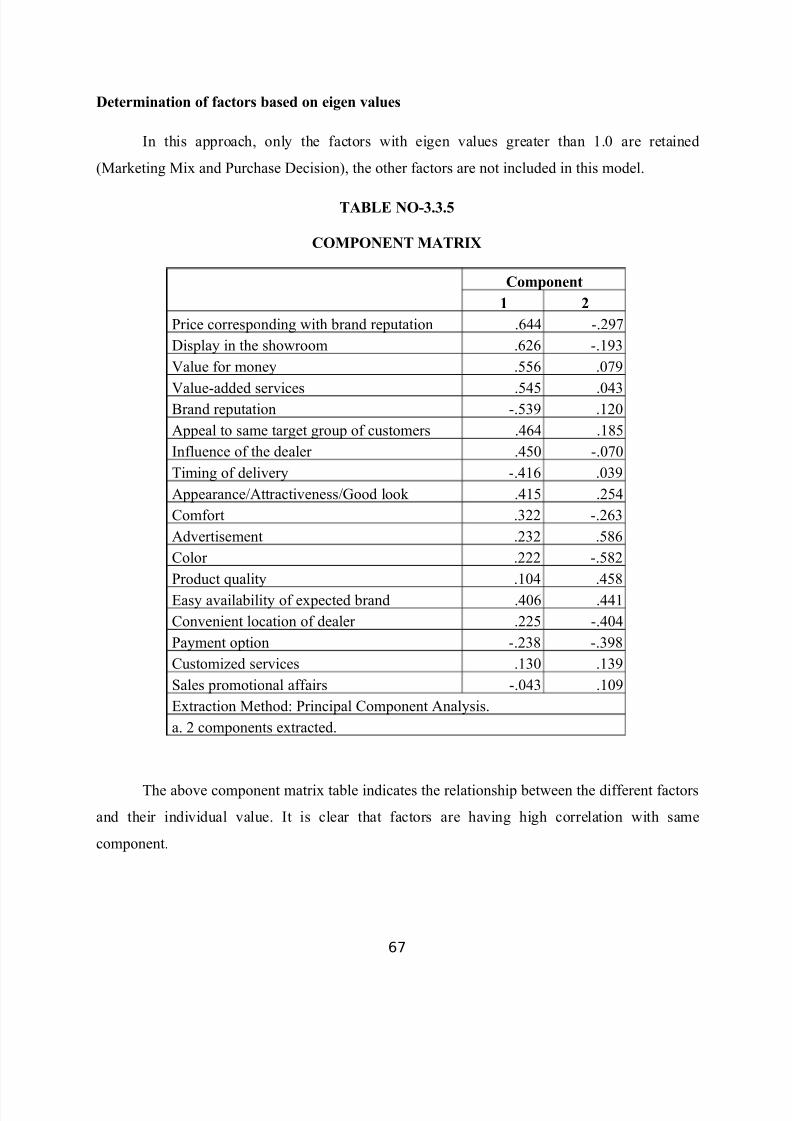
7/15/2019 Full Report
http://slidepdf.com/reader/full/full-report-563280c63b398 67/81
Determination of factors based on eigen values
In this approach, only the factors with eigen values greater than 1.0 are retained
(Marketing Mix and Purchase Decision), the other factors are not included in this model.
TABLE NO-3.3.5
COMPONENT MATRIX
Component
1 2
Price corresponding with brand reputation .644 -.297Display in the showroom .626 -.193Value for money .556 .079
Value-added services .545 .043Brand reputation -.539 .120Appeal to same target group of customers .464 .185Influence of the dealer .450 -.070Timing of delivery -.416 .039Appearance/Attractiveness/Good look .415 .254Comfort .322 -.263Advertisement .232 .586Color .222 -.582Product quality .104 .458Easy availability of expected brand .406 .441Convenient location of dealer .225 -.404Payment option -.238 -.398Customized services .130 .139Sales promotional affairs -.043 .109Extraction Method: Principal Component Analysis.a. 2 components extracted.
The above component matrix table indicates the relationship between the different factors
and their individual value. It is clear that factors are having high correlation with same
component.
67
7/15/2019 Full Report
http://slidepdf.com/reader/full/full-report-563280c63b398 68/81
Interpretation of Output
The output of Factor analysis is obtained by requesting principal component analysis and
specifying the rotation. As evident from the above table, it can be found that eight factors
extracted together account for 64.47% of the total variance (information contained in the original
18 variables). Hence, the selected variables have reduced the number of variables from 18 to 8
underlying factors. For Factor 2, the variables ‘Advertisement’ and ‘Colour’ have high loadings
of 0.586, and 0.582 respectively on factor 2. This indicates that Factor 2 is a combination of
these two variables. These variables can be clubbed into a single factor called “Selection” Factor.
Likewise we get eight factors. Those factors are - 1.Buying Decisions, 2. Selection, 3. Attraction,
4. Location, 5. Taking decisions, 6. Quality, 7. Convenience, 8. Need Fulfillment constitute the
reasons behind the buying preference towards Fibroflex mattress.
68

7/15/2019 Full Report
http://slidepdf.com/reader/full/full-report-563280c63b398 69/81
TABLE NO – 3.3.6
TABLE SHOWING THE MARKETING MIX FACTORS TO INFLUENCE THE
SELECTION OF FIBROFLEX’S BRAND(WEIGHTED AVERAGE)
Main marketing mix factors High Medium Low Total
compositeranks
Weights Total
score
Rank
Price
Payment option 150 86 7 243 2 486 14
Value for money 78 96 26 200 12 2400 4Price corresponding with brandreputation 87
78 32 197 14 2561 3
Promotion
Advertisement 99 120 7 226 6 1356 10
Sales promotional affairs 99 98 18 215 8 1720 8nfluencer of the dealer
93 74 32 199 13 2587 2Place
Convenient location of dealer 129 86 14 229 4 916 12
Timing of delivery 141 100 3 244 1 144 15
Easy availability of expected brand 81 86 30 197 14 2758 1Customized Services
78 96 26 200 12 2400 4Value-added services
105 72 29 206 10 2060 6Display in the showroom
105 72 29 206 10 2060 6Product
Product quality 117 100 11 228 5 1140 11
Brand reputation 141 84 11 236 3 708 13
Color Appeal to same target groupof customers 78 110 19 207 9 1863 7
Comfort 123 80 19 222 7 1554 9Appearance / Attractiveness /
Good look 108 60 34 202 11 2222 5Appeal to same target group of customers 84 82 31 197 14 2758 1
69
7/15/2019 Full Report
http://slidepdf.com/reader/full/full-report-563280c63b398 70/81
Inference:
The researcher used weighted average method to find out ranks to the above table. The
researcher gave rank to all marketing mix factors based on the data the researcher collected. The
marketing mix factor of Appeal to same target group of customers is ranked as I with the total
score of 2758, Influencer of the dealer is ranked as II with the total score of 2587, Price
corresponding with brand reputation is ranked as III with the total score of 2561, Value for
money and Customized Services is ranked as IV with the total score of 2400, Appearance /
Attractiveness / Good look is ranked as V with the total score of 2222, Value-added services and
Display in the showroom is ranked as VI with the total score of 2020, Color Appeal to same
target group of customers is ranked as VII with the total score of 1863, Sales promotional affairs
is ranked as VIII with the total score of 1720, Comfort is ranked as IX with the total score of 1554, Advertisement is ranked as X with the total score of 1356, Product quality is ranked as XI
with the total score of 1140, Convenient location of dealer is ranked as XII with the total score of
916, Brand reputation is ranked as XIII with the total score of 708, Payment option is ranked as
XIV with the total score of 486, Timing of delivery is ranked as XV with the total score of 144.
Table No. 3.3.6 is a correlation matrix constructed based on the ratings. The analytical process is
based on the matrix of correlation between the variables. Valuable insights can be gained from
an examination of this matrix. If the factor analysis should be proper the variables must be
correlated. If the correlations between all the variables are small, factor analysis may not be
appropriate. In this inter correlation matrix the correlation between all the variables are in good
fit, hence the factor analysis may be appropriate.
70
7/15/2019 Full Report
http://slidepdf.com/reader/full/full-report-563280c63b398 71/81
4.1 FINDINGS
4.1.1. Percentage Analysis
73% of the respondents are male and 27% of them are female.
66% of the respondents are married and 34% of them are unmarried.
33% of the respondents belong to the age group of 21-30 and 16% of them belong
to the age group of above 41-50 years.
43% of the respondents belong to the family level of 3-4 members and 3% of
them belong to the family level of above 9 members.
51% of the respondents belong to employed and 9% of them belong to students.
55% of the respondents completed school level and 5% of them completed other
level(no education).
52% of the respondents earn the annual income of below 100000 lacks and 0% of
them earn the annual income of Above 250001 lacks.
71
7/15/2019 Full Report
http://slidepdf.com/reader/full/full-report-563280c63b398 72/81
33% of the respondents are using Duroflex’s brand and 19% of them are using
Curl-on’s brand Coir-on’s brand.
30% of the respondents are influenced by their spouse to purchase a specific
brand and 7% of them are influenced by children.
47% of the respondents are using the branded flex for below 5 years and 1% of
them are using the branded flex for Above 21 years.
49% of the respondents are interested to continue the usage and 2% of them are
going for others.
4.1.2. Technical Analysis
4.1.2.1Findings of Chi-Square Analysis
There is no significant relationship between Annual Income and Payment Option.
4.1.2.2 Findings of Anova
There is no significant relationship between Income level and Future plan.
4.1.2.3 Findings of Henry Garret Ranking Method
The key success factor “Need to improve effectiveness of distribution channels” is
ranked1. Need guidance in developing a new product or entering a new market” is given the rank 11.
4.1.2.5 Findings of Weighted Average
The marketing channel of E- marketing is ranked is ranked I.
Retailing is ranked 7.
72

7/15/2019 Full Report
http://slidepdf.com/reader/full/full-report-563280c63b398 73/81
4.2 SUGGESTIONS
Company has to concentrate more on advertisement and sales promotionaltechniques to develop it faster than competitors.
Company can retain more customers by forming customer service center.
It should use raw materials properly to improve the quality.
The price should be taken into consideration now and then to promote the
company.
Advertisement should be made in an effective manner.
Company can improve prober distribution channel through which products
and name of the company will reach all over India.
Modern technology can be adopted for the betterment of the company.
More employees should be recruited to produce more number of units of
mattress and they must be offered proper training.
73

7/15/2019 Full Report
http://slidepdf.com/reader/full/full-report-563280c63b398 74/81
Ethics can be implemented to do justice to the employees and customers.
Company can give more reward to the employees to boost them.
It can improve the workings conditions to get overall performance.
Company has to adopt penetration pricing strategy. Prices of various servicesand products offered by the company should be comparatively cheaper thanmost of the competitors.
4.3 CONCLUSION
Competitor analysis refers to examine the comparative position of competing enterprises
within a given strategic sector. While formulating the business strategy, managers must consider
the strategies of the firm's competitors. Once we are able to identify the strategies adopted by our
competitors it becomes easy for us to make new strategies which can never be found available in
our competitors. A competitor must consider four factors in his competitor analysis process such
as- Strengths and Weaknesses, Identify our Competitors, Improvements, and Marketing.
This study is focused on the uncovered area or unknown segments of competitor analysis
which may be considered as importance for company’s future decision, budgeting and
developments of other aspects of the business. The key areas are competitive advantage and
disadvantage, strategy applied for present and future, forecasting for the future in reference to
competitor analysis.
While conducting the study of competitor analysis, it helps the management to generate
the understanding of competitor’s past, present (most important) and future strategies provided
helps to forecast the returns that may be made from the future investments (e.g. How will
competitors respond to a new product or pricing strategy). To establish a good market power, the
entire competitors should analyze their competitive position time to time systematically.
74
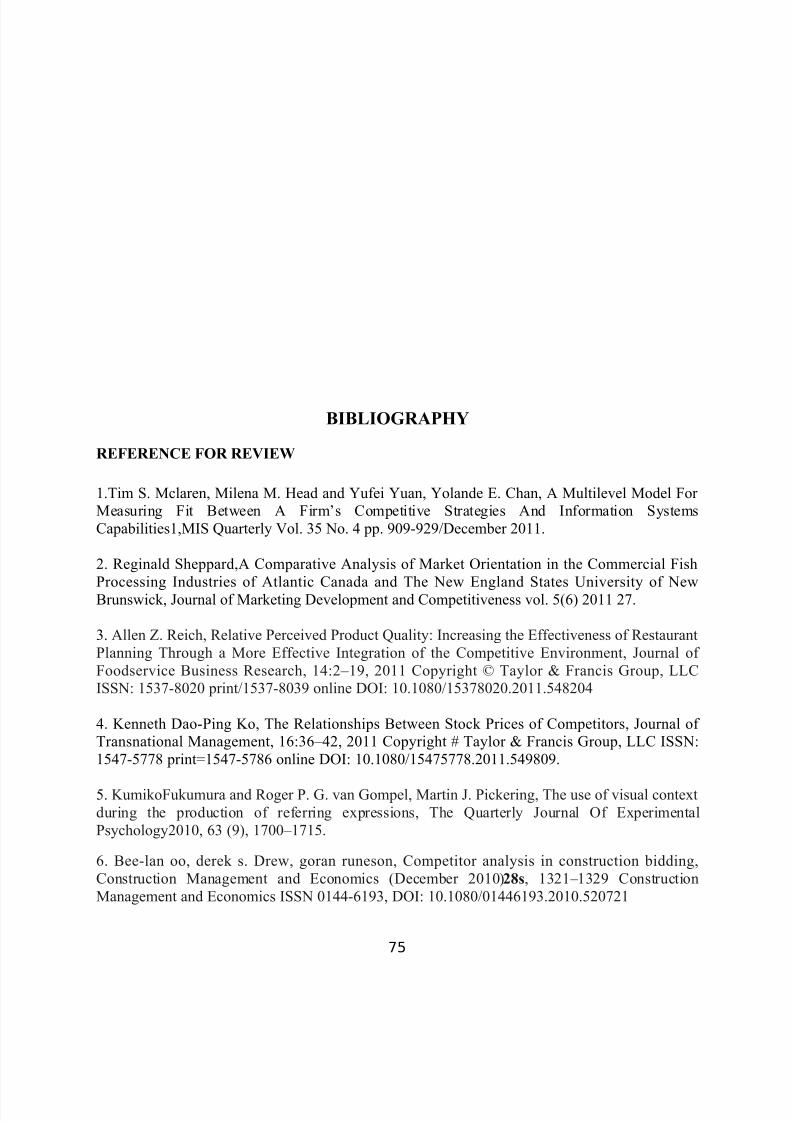
7/15/2019 Full Report
http://slidepdf.com/reader/full/full-report-563280c63b398 75/81
BIBLIOGRAPHY
REFERENCE FOR REVIEW
1.Tim S. Mclaren, Milena M. Head and Yufei Yuan, Yolande E. Chan, A Multilevel Model For Measuring Fit Between A Firm’s Competitive Strategies And Information SystemsCapabilities1,MIS Quarterly Vol. 35 No. 4 pp. 909-929/December 2011.
2. Reginald Sheppard,A Comparative Analysis of Market Orientation in the Commercial Fish
Processing Industries of Atlantic Canada and The New England States University of NewBrunswick, Journal of Marketing Development and Competitiveness vol. 5(6) 2011 27.
3. Allen Z. Reich, Relative Perceived Product Quality: Increasing the Effectiveness of RestaurantPlanning Through a More Effective Integration of the Competitive Environment, Journal of Foodservice Business Research, 14:2–19, 2011 Copyright © Taylor & Francis Group, LLCISSN: 1537-8020 print/1537-8039 online DOI: 10.1080/15378020.2011.548204
4. Kenneth Dao-Ping Ko, The Relationships Between Stock Prices of Competitors, Journal of Transnational Management, 16:36–42, 2011 Copyright # Taylor & Francis Group, LLC ISSN:1547-5778 print=1547-5786 online DOI: 10.1080/15475778.2011.549809.
5. KumikoFukumura and Roger P. G. van Gompel, Martin J. Pickering, The use of visual contextduring the production of referring expressions, The Quarterly Journal Of ExperimentalPsychology2010, 63 (9), 1700–1715.
6. Bee-lan oo, derek s. Drew, goran runeson, Competitor analysis in construction bidding,Construction Management and Economics (December 2010)28s, 1321–1329 ConstructionManagement and Economics ISSN 0144-6193, DOI: 10.1080/01446193.2010.520721
75
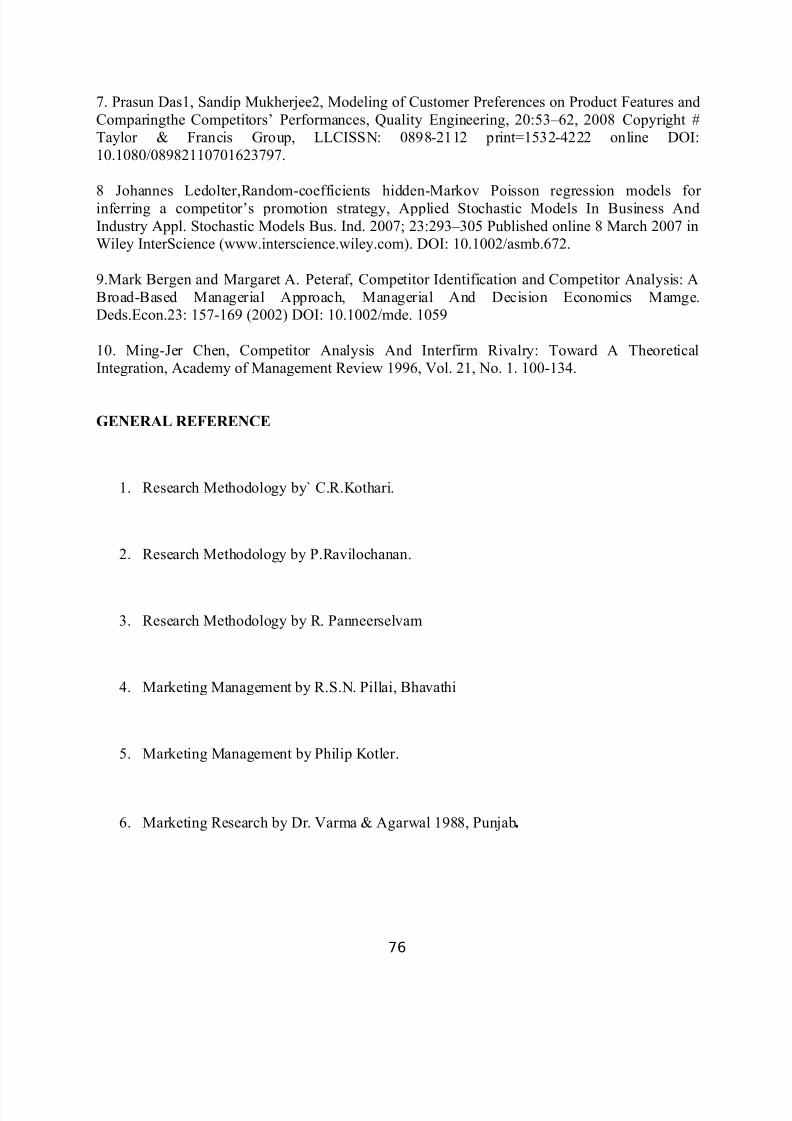
7/15/2019 Full Report
http://slidepdf.com/reader/full/full-report-563280c63b398 76/81
7. Prasun Das1, Sandip Mukherjee2, Modeling of Customer Preferences on Product Features andComparingthe Competitors’ Performances, Quality Engineering, 20:53–62, 2008 Copyright #Taylor & Francis Group, LLCISSN: 0898-2112 print=1532-4222 online DOI:10.1080/08982110701623797.
8 Johannes Ledolter,Random-coefficients hidden-Markov Poisson regression models for inferring a competitor’s promotion strategy, Applied Stochastic Models In Business AndIndustry Appl. Stochastic Models Bus. Ind. 2007; 23:293–305 Published online 8 March 2007 inWiley InterScience (www.interscience.wiley.com). DOI: 10.1002/asmb.672.
9.Mark Bergen and Margaret A. Peteraf, Competitor Identification and Competitor Analysis: ABroad-Based Managerial Approach, Managerial And Decision Economics Mamge.Deds.Econ.23: 157-169 (2002) DOI: 10.1002/mde. 1059
10. Ming-Jer Chen, Competitor Analysis And Interfirm Rivalry: Toward A TheoreticalIntegration, Academy of Management Review 1996, Vol. 21, No. 1. 100-134.
GENERAL REFERENCE
1. Research Methodology by` C.R.Kothari.
2. Research Methodology by P.Ravilochanan.
3. Research Methodology by R. Panneerselvam
4. Marketing Management by R.S.N. Pillai, Bhavathi
5. Marketing Management by Philip Kotler.
6. Marketing Research by Dr. Varma & Agarwal 1988, Punjab.
76

7/15/2019 Full Report
http://slidepdf.com/reader/full/full-report-563280c63b398 77/81
7. Strategic Marketing Management.
WEBSITE REFERENCE
www.projectsparadise.com
www.ebsco.com
www.antiessays.com
www.fibroflexpvtltd.com
A STUDY ON COMPETITOR ANALYSIS WITH SPECIAL REFERENCE TO FIBRO
FLEX (P) LTD, TIRUNELVELI DISTRICT
Questionnaire
I. Personal Data
1. Name of the respondent: ___________________________________
2. Gender : a. Male ( ) b. Female ( )
3. Marital status : a. Married ( ) b. Unmarried ( )
4. Age (in years) : a. below 20 years ( ) b.21-30years ( )C.31-40 years ( ) d. 41-50 years ( ) e. above 50years ( )
5. No. of Dependents : a. Below 2 members ( ) b.3-4members ( )c. 5-6 members ( ) d.7-8 members ( ) e. above 8 members ( )
6. Occupation: a. Business ( ) b. Agriculture ( )c. Employed ( ) d. Professional ( ) e. Students ( )
7. Educational Back ground: a. School Level ( ) b. Diploma/ ITI ( )c. UG ( ) d. PG ( ) e. Others ( )
8. Annual Income: a. below 100000 ( ) b. 100001 to 150000 ( )c. 150001 to 200000 ( ) d. 200001 to 250000 ( ) e. Above 250000 ( )
77
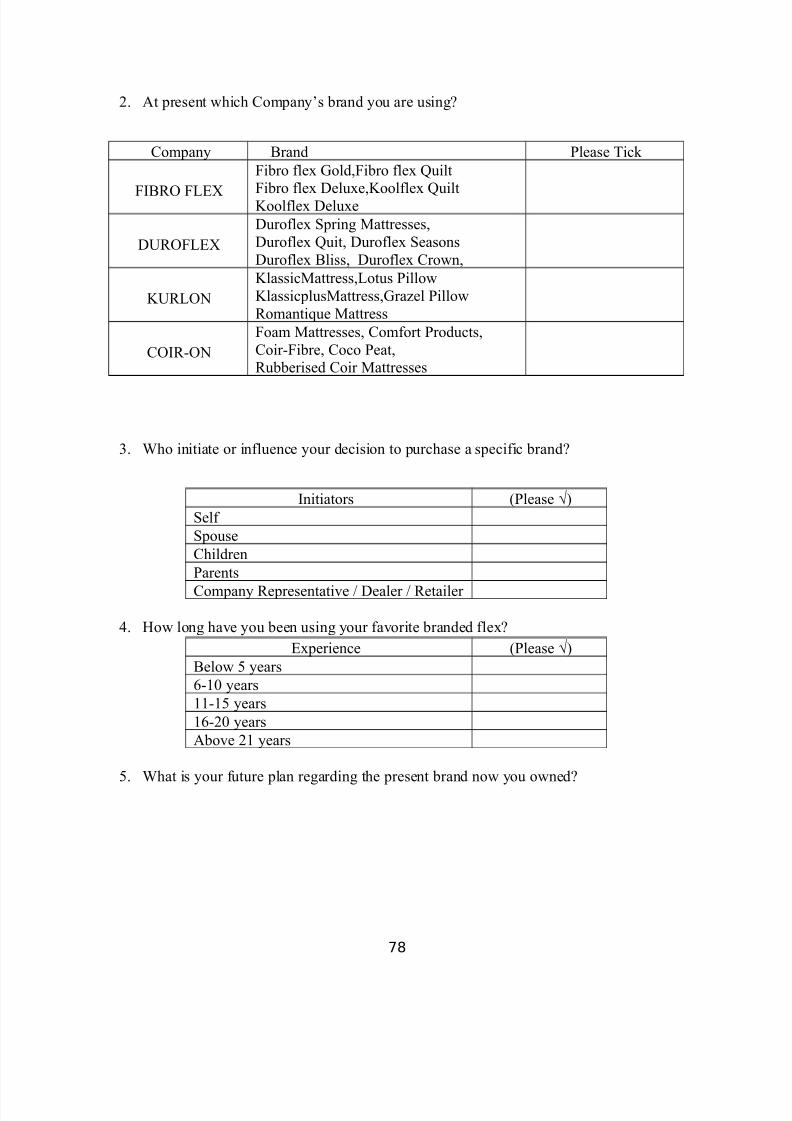
7/15/2019 Full Report
http://slidepdf.com/reader/full/full-report-563280c63b398 78/81
2. At present which Company’s brand you are using?
Company Brand Please Tick
FIBRO FLEX
Fibro flex Gold,Fibro flex QuiltFibro flex Deluxe,Koolflex QuiltKoolflex Deluxe
DUROFLEXDuroflex Spring Mattresses,Duroflex Quit, Duroflex SeasonsDuroflex Bliss, Duroflex Crown,
KURLONKlassicMattress,Lotus PillowKlassicplusMattress,Grazel PillowRomantique Mattress
COIR-ONFoam Mattresses, Comfort Products,Coir-Fibre, Coco Peat,Rubberised Coir Mattresses
3. Who initiate or influence your decision to purchase a specific brand?
Initiators (Please √)Self SpouseChildrenParents
Company Representative / Dealer / Retailer
4. How long have you been using your favorite branded flex?Experience (Please √)
Below 5 years6-10 years11-15 years16-20 yearsAbove 21 years
5. What is your future plan regarding the present brand now you owned?
78
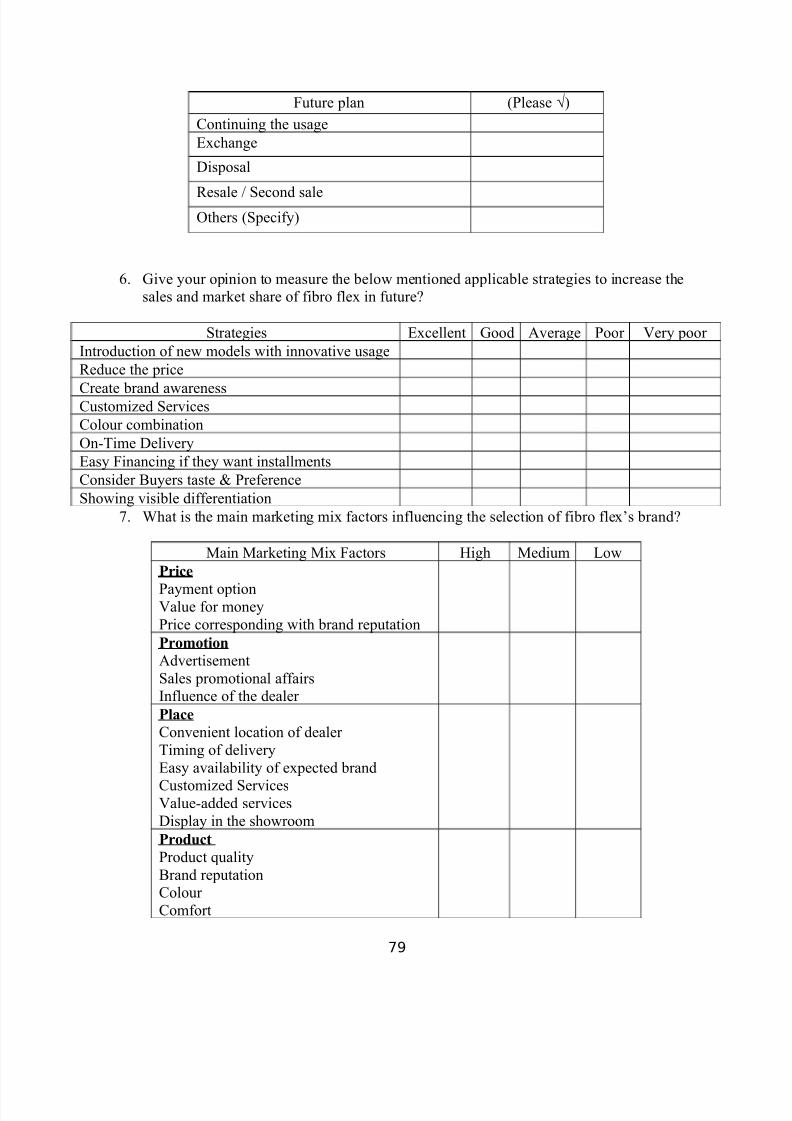
7/15/2019 Full Report
http://slidepdf.com/reader/full/full-report-563280c63b398 79/81
Future plan (Please √)Continuing the usageExchange
Disposal
Resale / Second saleOthers (Specify)
6. Give your opinion to measure the below mentioned applicable strategies to increase thesales and market share of fibro flex in future?
Strategies Excellent Good Average Poor Very poor Introduction of new models with innovative usageReduce the price
Create brand awarenessCustomized ServicesColour combinationOn-Time DeliveryEasy Financing if they want installmentsConsider Buyers taste & PreferenceShowing visible differentiation
7. What is the main marketing mix factors influencing the selection of fibro flex’s brand?
Main Marketing Mix Factors High Medium LowPrice
Payment optionValue for moneyPrice corresponding with brand reputationPromotion
AdvertisementSales promotional affairsInfluence of the dealer Place
Convenient location of dealer Timing of deliveryEasy availability of expected brand
Customized ServicesValue-added servicesDisplay in the showroomProduct
Product qualityBrand reputationColour Comfort
79

7/15/2019 Full Report
http://slidepdf.com/reader/full/full-report-563280c63b398 80/81
Appearance / Attractiveness / Good look Appeal to same target group of customers
8. What market challenges or key success factors (KSFs) are your company facing? (Check all that apply. Need to increase sales or market share of existing product(s) – Rank the
following
Key success factors (KSFs) Rank
Need guidance in developing a new product or entering a new marketCompetition is making inroads into our business Need to improve effectiveness of distribution channels Need more or better information on customer needs, product
requirements and purchase requirements/preferences Need help in evaluating a merger, acquisition, or strategic partnership Need help in planning a new product introductionOthers (Specify)
Evaluation need/opportunity for new productIdentify/quantify new markets for existing technology or productDevelop competitive profiles or evaluation of new or existing marketIdentify user preferences, buying criteria
9. At present which type of marketing channel will be suitable to market the Brands of fibroflex?
S.No. Marketing Channel Rank the Following1. Through dealer 2. Through sub dealer 3. E-Marketing4. Retailing5. Mobile & Telemarketing6. Through sales executives7. Chain marketing
10. Please give your general suggestion to improve the sales, market share and winningcompetitors of fibro flex.
80

7/15/2019 Full Report
http://slidepdf.com/reader/full/full-report-563280c63b398 81/81