full length research paper assessment of urban sprawl...
TRANSCRIPT

International Journal of Environmental Sciences Shalaby, A. Vol. 1 No.4 ISSN: 2277-1948
Online version available at: www.crdeep.com
International Journal of Environmental Sciences Vol. 1 No. 4. 2012. Pp. 253-262 ©Copyright by CRDEEP. All Rights Reserved. Full Length Research Paper
Assessment of Urban Sprawl Impact on the Agricultural Land in the Nile Delta of Egypt Using Remote Sensing and Digital Soil Map
Shalaby, A. Researcher, head of land use department, NARSS, National Authority for Remote Sensing and Space Sciences (NARSS), 23 Joseph Tito Street, El-Nozha El-Gedida, P.O. Box : 1564 Alf Maskan, Cairo, Egypt. ABSTRACT Urban sprawl is threatening the limited highly fertile land in the Nile Delta of Egypt. In this research, Landsat TM satellite images of 1984 and 1992, and ETM+ of 2006 have been used to study the impact of urban sprawl on agricultural land in the Nile Delta. Visual interpretation using on screen digitizing and change detection techniques were applied for monitoring the urban sprawl. Combining the soil and land capability maps, in one hand, and the urban thematic layers, in another hand, using GIS, made it possible to point out the risk of urban expansion on the expense of the highly capability class. The results show that a total expansion of urban area amounted to 2536.3 km2 during the study period from 1984 to 2006. The urban expansion during the 1984 – 2006 was on the expense of the most fertile soils where, the high capable soils (Class I) lost 797.9 km2 and the moderate capable soils lost 310.93 Km2, while the low capable soils lost only 672.3 km2 during the same period. The urban encroachment over the non capable soils was very limited during the 1984 and 1992 period, where 25.83 Km2 only was lost. The pattern of urban sprawl has been changed during the 1992 to 2006 period whereas much larger area (426.47Km2) of the non capable soils was converted to urban. It can be concluded that the urban sprawl is one of the dominant degradation process in the Nile Delta. Keywords: Urbanization, digital soil map, land capability, GIS, soil map INTRODUCTION The Nile Delta of Egypt, one of the oldest agricultural areas in the world, has been under continuous cultivation for at least 7000 years. The total cultivated area of the Nile Delta is 1,828,840 hectares, representing 56.49% of the cultivated area of Egypt. Urbanization is an inevitable process due economic development and rapid population growth. Encroachment of urban settlements on agricultural lands may pose dire consequences. The continuous increasing in population density causes increasing pressure on areas already inhabited and caused a decrease in area per capita from 0.12 ha in 1950 to 0.06 ha in 1990 (Suliman, 1991) and to 0.04 ha in 2009 (CAPMAS, 2009). Therefore, determining the trend and the rate of land cover conversion are necessary for the development planner in order to establish rational land use policy (Shalaby and Tateishi, 2007). Desert and uninhabited lands represent about 95% of the total area of Egypt. However, the majority of the population is concentrated around the River Nile. This unbalanced distribution causes rapid urbanization although of the existing of lows that forbids the building on agricultural land. Therefore, determining the trend and the rate of urbanization is necessary for the development planner in order to establish rational land use policy (Shalaby and Tateishi, 2007). For this purpose, the temporal dynamics of remote sensing data can play an important role in monitoring and analyzing land cover changes. Accurate and up-to-date land cover change information is necessary to understand both human causes and environmental consequences of such changes (Aboel Ghar et al., 2004). As a consequence, information about land use/land cover is essential for any kind of natural resource management and action planning. Accurate information about land use/land cover changes of an area is essential for understanding the
interactions between human and natural resources for better management of decision making (Lu et al., 2004). There is a continuing demand for accurate and up-to-date land use/land cover information for any kind of sustainable development program where land use/land cover serves as one of the major input criteria. As a result, the importance of properly mapping land use/land cover and its change as well as updating it through time has been acknowledged by various research workers for decision making activities; as for example, application of land cover change in urban environment by Deng et al., (2005). Urban sprawl causes lose of agricultural land, which results in substantial changes on agricultural ecosystems. Monitoring these changes and planning urban development can be achieved using multi-temporal remotely sensed data, spatial metrics, and modeling (Yikalo and Pedro, 2010). Change detection is the process of determining and/or describing changes in land-cover and land-use properties based on co-registered multi-temporal remote sensing data. The basic premise in using remote sensing data for change detection is that the process can identify change between two or more dates that is uncharacteristic of normal variation. Numerous researchers have addressed the problem of accurately monitoring land-cover and land-use change in a wide variety of environments (e.g. Almutairi and Warner, 2010; Shalaby and Tateishi, 2007; Muchoney and Haack, 1994; Singh, 1989). Many studies have discussed land cover and land use changes in arid, semi-arid regions (e. g. Mendoza and Etter, 2002; Rembold et al., 2000; Lambin and Ehrlich, 1997; Lenney et al., 1996; Ram and Kolarkar, 1993; Sadek, 1993), these studies showed that urban expansion usually occurs through the deduction of agriculture land. There are many techniques available to detect and record differences (e.g. image differencing, ratios or correlation) and theses might be attributable to changes in land cover (Deng et al., 2008; Li and Yeh, 2004; Maldonado et al., 2002; Yuan et al., 1999; Stow et al., 1996; Singh, 1989). However, the simple detection of change is rarely sufficient in itself: information is generally
253

International Journal of Environmental Sciences Shalaby, A. Vol. 1 No.4 ISSN: 2277-1948
Online version available at: www.crdeep.com
required about the initial and final land cover or types or land uses, the “from-to” analysis (Khorram et al., 1999). Post- classification comparisons of derived thematic maps go beyond simple change detection and attempt to quantify the different types of change. The degree of success depends upon the reliability of the maps made by image classification. Broadly speaking, large scale changes such as widespread logging or major urban development might be mapped easily. Whereas evolutionary changes such as, erosion, succession, colonization or degradation, the boundaries may be indistinct and class-labels uncertain (Foody and Boyd, 1999; Khorram et al., 1999; Shalaby and Tateishi, 2007). The objective of this study is to evaluate the hazard of urban sprawl and its impact on agriculture land in Nile Delta using remote sensing and digital soils database. STUDY AREA The Nile Delta is the delta formed in Northern Egypt where the Nile River spreads out and drains into the Mediterranean Sea. It is one of the world's largest river deltas. The Nile delta extends from Alexandria in the west to Port Said in the east and it covers some 240 km of Mediterranean coastline. From north to south the delta is approximately 160 km in length covering an area of 35,443 km2. The Nile Delta has a Mediterranean climate, characterized by little rainfall. Only 100 to 200 mm of rain falls on the delta area during an average year, and most of this falls in the winter months. The delta experiences its hottest temperatures in July and August, averaging 30 °C, with a maximum of around 48 °C. Winter temperatures are normally in the range of 10° to 19 °C. With cooler temperatures and some rain, the Nile Delta region becomes quite humid during the winter months. According to the aridity index classes (Hulme and Marche 1990), the Nile Delta is located under arid climatic conditions. Agriculture in the Nile Delta is characterized by small farm holdings with an average size of about 1.5 hectare. The main summer crops are cotton, maize and rice. The main winter crops are wheat and clover, which is used to feed cattle. Field irrigation is implemented by subdividing the field in very small checks and flooding them.
MATERIALS Soil maps: The soil maps of Egypt (ASRT, 1982) are the main materials collected and converted to digital format. The collected soil maps cover the alluvial arable land and their interference with Desert fringes. These maps include a number of 12 map sheets at scale of 1: 100,000 in analogue format, covering the whole of Nile Delta region. Topographic maps: Topographic maps at scale 1: 50,000 covering the Nile Delta, produced by the Egyptian General Survey Authority (EGSA) were converted to a digital format. Satellite data: A number of 21 Landsat satellite images were used in this study to cover the study area in three different dates (1984, 1992 and 2006) to study the urban sprawl in the Nile delta. METHODS Geometric correction Accurate per-pixel registration of multi-temporal satellite data is essential for change detection because registration errors could be inferred as land use/cover changes, leading to an overestimation of actual change (Stow, 1999). Change detection analysis is performed on a pixel-by-pixel basis; therefore any misregistration greater than one pixel will provide an anomalous result for that pixel. To overcome this problem, the root mean square error (RMSE) between any two dates should not exceed 0.5 pixel (Lunetta and Elvidge, 1998). In this study, geometric correction was carried out using ground control points from digital topographic maps (UTM,WGS84) to geocode the image of 1992, then this image was used to register all the other images; the RMSE between different images was less that 0.4 pixel, which is acceptable. Image enhancement and visual interpretation The goal of image enhancement is to improve the visual interpretability of an image by increasing the apparent distinction between the features. The process of visually interpreting digitally enhanced imagery attempts to optimize the complementary abilities of the human mind and the computer. The mind is excellent at interpreting spatial attributes on an image and is capable of identifying obscure or subtle features (Lillesand and Kiefer, 1994). Contrast stretching was applied on all images and the false colour composites (FCC) were produced. These FCC are visually interpreted using on-screen digitizing to delineate urban areas in the three different dates.
254

International Journal of Environmental Sciences Shalaby, A. Vol. 1 No.4 ISSN: 2277-1948
Online version available at: www.crdeep.com
Digital soil mapping The soil map of the study area was extracted from the available soil map of Egypt produced by the Academy of Scientific Research and Technology (ASRT 1982); the original nomenclature of soil order, suborders and great groups has been updated according to the latest American Soil Taxonomy of USDA (2010). The transformation of the soil map (produced in 1982) into a digital format was done. The study area is covered by 12 soil map sheets. These sheets were scanned and geometrically corrected using UTM coordinate system and WGS84 projection. On-screen digitizing was used to convert the 12 sheets into vector formats and then edge matching was performed using ArcGIS 9.2. A semi-detailed survey was done throughout the investigated area to gain an appreciation on the soil patterns, the land forms and landscape characteristics. The laboratory analysis of the study area reported by ASRT (1982) has been compiled in the database and incorporated into the attribute table of the soil map (Pavasovic 1993; Nguyen 2001). Land capability mapping The land capability classes were obtained using soil data following the methodology of FAO, 1985. Urban land cover class was overlaid on the soil capability map and then the areas lost from different land capability classes due to urban sprawl was calculated Urban sprawl detection Regardless of the technique used, the success of change detection from imagery will depend on both the nature of the change involved and the success of the image preprocessing and the classification procedures. If the nature of the change within a particular scene is either abrupt or at a scale appropriate to the imagery collected then change should be relatively easy to detect; problems occur only if spatial change is subtly distributed and hence not obvious within any image pixel (Milne 1988). In the case of the study area chosen, field observation and measurements have showed that the change in land cover between the three dates was both marked and abrupt. In this study post-classification change detection technique was applied. Post-classification is the most obvious method of change detection, which requires the comparison of
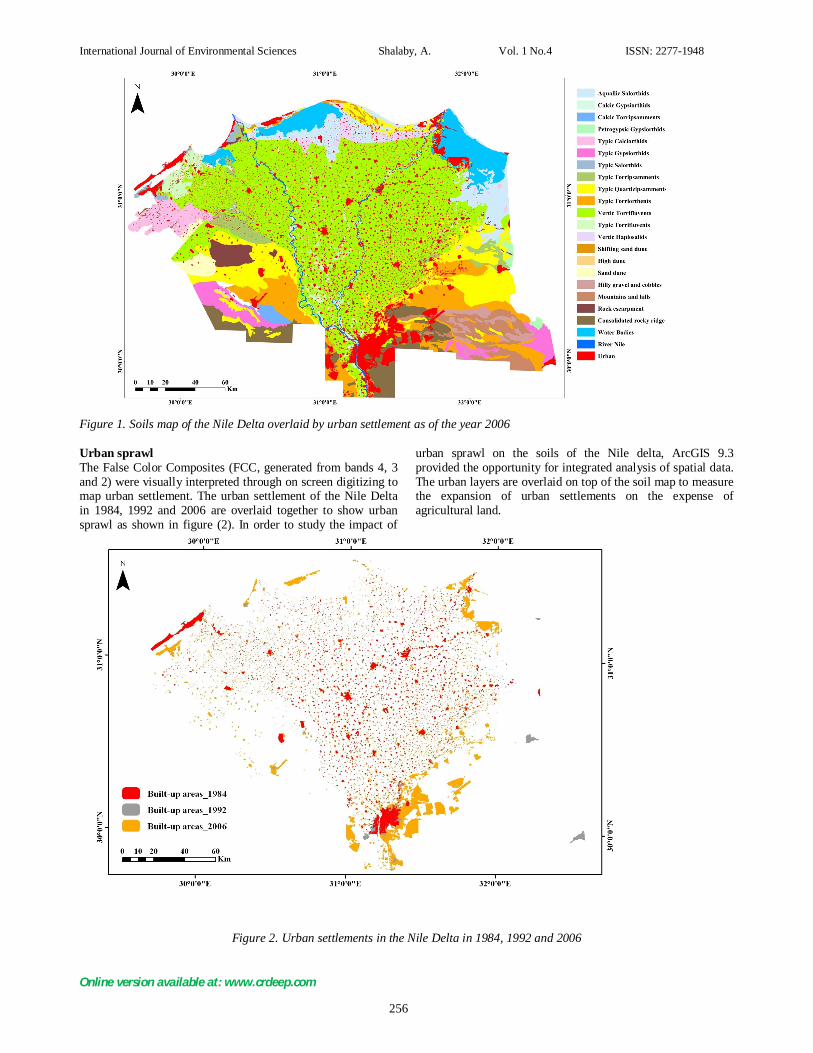
independently produced classified images. Post-classification comparison proved to be the most effective technique, because data from two dates are separately classified, thereby minimizing the problem of normalizing for atmospheric and sensor differences between different dates. Urban land cover class was extracted from the visual interpretation of the satellite images, and then cross-tabulation analysis was carried out to study the spatial distribution and areas of urban sprawl (of 1984, 1992 and 2006) on different soil types, ArcGIS 9.2 software was used for this function. RESULTS AND DISCUSSION Soils of the Nile Delta The soil map of the Nile Delta was extracted from the soil map of Egypt (ASRT, 1982), which was classified using the American Soil Taxonomy (USDA, 1975). The produced map (Figure 1) has been updated according to the latest edition (USDA, 2010). The obtained results indicate that the Vertic Torrifluvents is the major sub great group in the alluvial Nile Delta, covering 14,122.1 km2, representing 39.84% of the total area. Patches of sub-great groups Typic Torrifluvents are included in the alluvial soils. The sub-great group Typic Quartizpsamments dominates the eastern and western desert fringes, covering an area of 3,844.6 km2 (10.6% of total area). Typic Torriorthents sub-great groups exhibits an area of 2,951.5 km2, representing 8.3% of total area. The sub-great groups Typic Torrifluvents and Typic Torripsamments exhibit significant coverage in delta borders, as their areas are 1,368.0, and 806,2km2 representing 3.9%, and 2.3% of total area respectively. The sub-great groups Typic Aquisalids and Typic Haplosalids exist in the northern Delta region influenced by the northern Delta lakes. They cover areas of 1,921.5 and 166.7 km2, representing 5.4% and 0.5% of the total Nile Delta area respectively. Typic Calciorthids, Typic Gypsiorthids, Petrogypsic Gypsiorthids and Calcic Gypsiorthids are distributed in the eastern and western Delta regions covering areas of 802.7, 1,034.2, 145.9 and 4.1 km2 representing 2.3%, 2.9%, 0.4% and 0.01% respectively. The urban settlement covered an area of 1,134.7 representing 3.2 % of the study area in 1984.
255
International Journal of Environmental Sciences Shalaby, A. Vol. 1 No.4 ISSN: 2277-1948
Online version available at: www.crdeep.com
Figure 1. Soils map of the Nile Delta overlaid by urban settlement as of the year 2006
Urban sprawl The False Color Composites (FCC, generated from bands 4, 3 and 2) were visually interpreted through on screen digitizing to map urban settlement. The urban settlement of the Nile Delta in 1984, 1992 and 2006 are overlaid together to show urban sprawl as shown in figure (2). In order to study the impact of
urban sprawl on the soils of the Nile delta, ArcGIS 9.3 provided the opportunity for integrated analysis of spatial data. The urban layers are overlaid on top of the soil map to measure the expansion of urban settlements on the expense of agricultural land.
Figure 2. Urban settlements in the Nile Delta in 1984, 1992 and 2006
256
International Journal of Environmental Sciences Shalaby, A. Vol. 1 No.4 ISSN: 2277-1948
Online version available at: www.crdeep.com
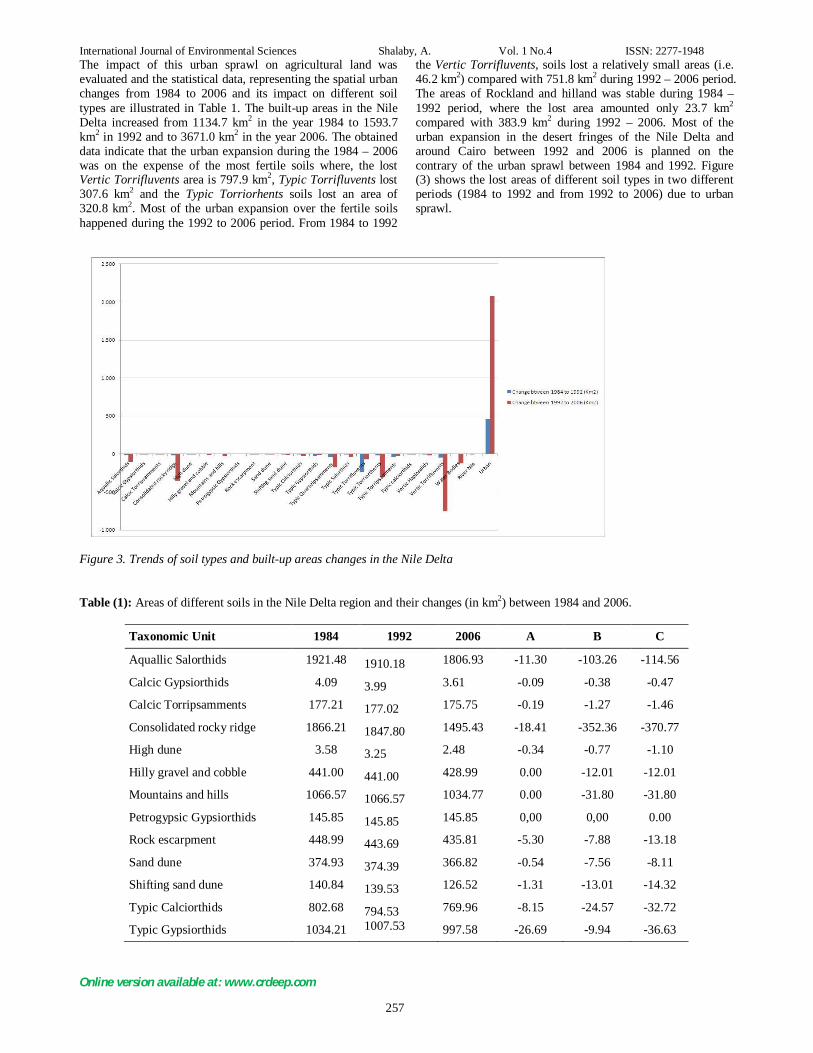
The impact of this urban sprawl on agricultural land was evaluated and the statistical data, representing the spatial urban changes from 1984 to 2006 and its impact on different soil types are illustrated in Table 1. The built-up areas in the Nile Delta increased from 1134.7 km2 in the year 1984 to 1593.7 km2 in 1992 and to 3671.0 km2 in the year 2006. The obtained data indicate that the urban expansion during the 1984 – 2006 was on the expense of the most fertile soils where, the lost Vertic Torrifluvents area is 797.9 km2, Typic Torrifluvents lost 307.6 km2 and the Typic Torriorhents soils lost an area of 320.8 km2. Most of the urban expansion over the fertile soils happened during the 1992 to 2006 period. From 1984 to 1992
the Vertic Torrifluvents, soils lost a relatively small areas (i.e. 46.2 km2) compared with 751.8 km2 during 1992 – 2006 period. The areas of Rockland and hilland was stable during 1984 – 1992 period, where the lost area amounted only 23.7 km2 compared with 383.9 km2 during 1992 – 2006. Most of the urban expansion in the desert fringes of the Nile Delta and around Cairo between 1992 and 2006 is planned on the contrary of the urban sprawl between 1984 and 1992. Figure (3) shows the lost areas of different soil types in two different periods (1984 to 1992 and from 1992 to 2006) due to urban sprawl.
Figure 3. Trends of soil types and built-up areas changes in the Nile Delta
Table (1): Areas of different soils in the Nile Delta region and their changes (in km2) between 1984 and 2006.
Taxonomic Unit 1984 1992 2006 A B C
Aquallic Salorthids 1921.48 1910.18 1806.93 -11.30 -103.26 -114.56
Calcic Gypsiorthids 4.09 3.99 3.61 -0.09 -0.38 -0.47
Calcic Torripsamments 177.21 177.02 175.75 -0.19 -1.27 -1.46
Consolidated rocky ridge 1866.21 1847.80 1495.43 -18.41 -352.36 -370.77
High dune 3.58 3.25 2.48 -0.34 -0.77 -1.10
Hilly gravel and cobble 441.00 441.00 428.99 0.00 -12.01 -12.01
Mountains and hills 1066.57 1066.57 1034.77 0.00 -31.80 -31.80
Petrogypsic Gypsiorthids 145.85 145.85 145.85 0,00 0,00 0.00
Rock escarpment 448.99 443.69 435.81 -5.30 -7.88 -13.18
Sand dune 374.93 374.39 366.82 -0.54 -7.56 -8.11
Shifting sand dune 140.84 139.53 126.52 -1.31 -13.01 -14.32
Typic Calciorthids 802.68 794.53 769.96 -8.15 -24.57 -32.72
Typic Gypsiorthids 1034.21 1007.53 997.58 -26.69 -9.94 -36.63
257

International Journal of Environmental Sciences Shalaby, A. Vol. 1 No.4 ISSN: 2277-1948
Online version available at: www.crdeep.com
Typic Quartizipsamments 3844.35 3803.34 3625.31 -41.01 -178.04 -219.04
Typic Salorthids 166.73 162.99 126.91 -3.74 -36.07 -39.82
Typic Torrifluvents 1368.04 1128.26 1060.69 -239.78 -67.56 -307.35
Typic Torriorthents 2951.55 2933.25 2630.79 -18.30 -302.47 -320.76
Typic Torripsamments 806.22 772.06 747.15 -34.16 -24.91 -59.07
Typic calciorthids 84.32 84.25 77.12 -0.08 -7.12 -7.20
Vertic Haplosalids 426.76 421.63 402.77 -5.14 -18.85 -23.99
Vertic Torrifluvents 14122.12 14075.94 13324.17 -46.17 -751.77 -797.94
Water Bodies 1853.54 1855.27 1729.54 1.73 -125.74 -124.00
River Nile 257.67 257.67 257.67 0.00 0.00 0.00
Urban 1134.71 1593.69 3671.04 458.97 2077.35 2536.32
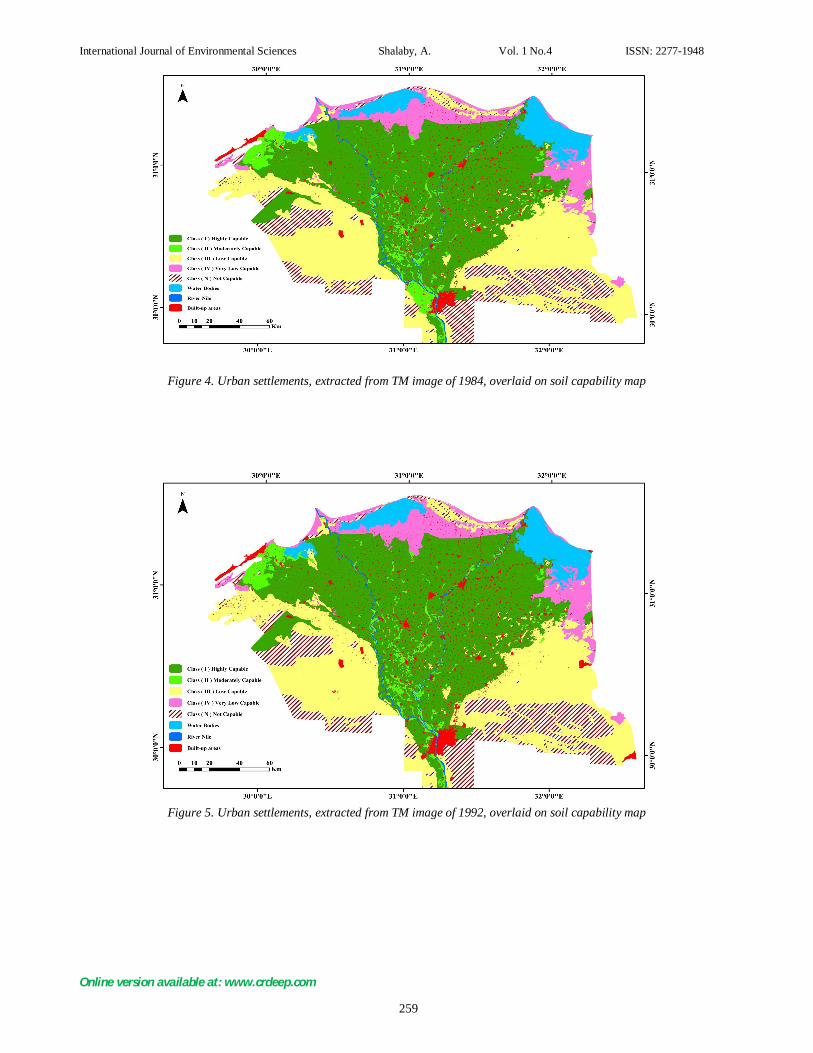
Total 35443.67 35443.67 35443.67 0.0 0.0 0.0 Note: A= the difference between 1984 and 1992, B= the difference between 1992 and 2006 and C= the difference between 1984 and 2006 Figure 3 shows that the major loss of agricultural land due to urban sprawl took place at the expense of Vertic Torrifluvents, Typic Torriorthents, Typic Torrifluvents, Typic Quartizipsamments and Aquallic Salorthids while all other soil types lost minor areas. Land capability and urban sprawl Land capability classification was performed and the urban settlement of 1984, 1992 and 2006 were overlaid on top of the soil capability map (figures 4, 5 and 6). The high capable soils (class I) lost a total area of 797.9 km2 between in 1984and 2006, only 46.2 km2 was lost due to urbanization in the period from 1984 to 1992 while most of the area (751.8 km2) was lost between 1992 and 2006. The moderate capable soils (class II) lost a total area of 310.9 km2 between 1984 and 2006, on the contrary to the high capable soil (class I) most of the area was lost between 1984 and 1992 (241.3 km2) while only 69.7 km2 was converted to urban between 1992 and 2006. The low capable and very low capable soils (class III and class IV) lost areas of 672.3 and 178.4 respectively between 1984 and 2006. Concerning the not capable soil (class N), only 25.8 km2 was lost between 1984 and 1992 while a much larger area ( 452.3 km2) was converted to urban between 1992 and 2006. A detailed quantification of the area of different land capability classes, their areas lost due to urbanization and urban settlements change between 1984 and 2006 are shown in table 2. The table shows that the highly productive agricultural land (Class I and Class II) together lost 1108.8 km2 between 1984 and 2006 and most of this loss took place between 1992 and
2006. The total agricultural land (from highly capable to very low capable) lost due to urban sprawl amounted to 1960 km2 or 77.3 % at a rate of 89.1 km2 per year of the total area lost due to urban sprawl while the not capable soil lost only 425.3 or 17.8 % at a rate of 20.6 km2 per year between 1984 and 2006. When comparing the two periods (1984 to 1992 and 1992 to 2006) it was found that the total loss of agricultural productive land was 434.9 km2, at a rate of 54.4 km2 per year between 1984 and 1992 while it lost 1525 km2, at a rate of 108.9 km2 between 1992 and 2006.
258
International Journal of Environmental Sciences Shalaby, A. Vol. 1 No.4 ISSN: 2277-1948
Online version available at: www.crdeep.com
Figure 4. Urban settlements, extracted from TM image of 1984, overlaid on soil capability map
Figure 5. Urban settlements, extracted from TM image of 1992, overlaid on soil capability map
259

International Journal of Environmental Sciences Shalaby, A. Vol. 1 No.4 ISSN: 2277-1948
Online version available at: www.crdeep.com
Figure 6. Urban settlements, extracted from ETM+ image of 2006, overlaid on soil capability map
Table (2): Areas of different land capability classes in the Nile Delta region and their changes (in km2) between 1984 and 2006
Land Capability Classes 1984 1992 2006 A B C Class ( I ) Highly Capable 14122.12 14075.94 13324.17 -46.17 -751.77 -797.94 Class ( II ) Moderately Capable 1383.67 1142.39 1072.73 -241.27 -69.66 -310.93
Class ( III ) Low Capable 9684.93 9557.77 9012.63 -127.16 -545.14 -672.30 Class ( IV ) Very Low Capable 2664.92 2644.65 2486.08 -20.27 -158.57 -178.84
Class ( N ) Not Capable 4342.12 4316.29 3889.82 -25.83 -426.47 -452.30 Water Bodies 1853.54 1855.27 1729.54 1.73 -125.74 -124.00 River Nile 257.67 257.67 257.67 0.00 0.00 0.00 Built-up areas 1134.71 1593.69 3671.04 458.97 2077.35 2536.32 Total 35443.67 35443.67 35443.67 0.0 0.0 0.0
Note: A= the difference between 1984 and 1992, B= the difference between 1992 and 2006 and C= the difference between 1984 and 2006
The recent legalization aiming to control construction on agricultural land did not prevent the unplanned urban invasion over the fertile land. This kind of unplanned urban expansion has severe environmental consequences causing many social and health problems. This is caused by inappropriate infrastructure including roads and sewage systems as well as clean water unavailability. Conclusion The objective of this study was to evaluate the hazard of urban sprawl and its impact on agriculture land in Nile Delta using remote sensing and digital soils database. It was found that visual interpretation was an effective way for extracting urban settlement accurately. The study area has undergone a very severe land cover change as a result of urbanization which
resulted from rapid population growth. A Considerable increase in urban settlements has taken place on the expense of the most fertile land in the Nile Delta. GIS provided valuable information on the nature of urban sprawl through integration of soil digital database and urban map that resulted from visual interpretation. The main causes of urbanization are the rapid population growth in addition to the internal migration. Urban sprawl is one of the dominant land degradation processes in the Nile Delta. This problem needs to be seriously studied, through multi-dimensional fields including socioeconomic, in order to preserve the precious and limited agricultural land and increase food production.
260

International Journal of Environmental Sciences Shalaby, A. Vol. 1 No.4 ISSN: 2277-1948
Online version available at: www.crdeep.com
REFERENCES 1. Aboel Ghar, M.;Shalaby, A., and Ryutaro T., 2004.
Agricultural land monitoring in the Egyptian Nile delta using Landsat data. International Journal of Environmental Studies, 1 (6) 651 – 657.
2. Almutairi, A., and Warner, A. T., 2010. Change Detection Accuracy and Image Properties: A Study Using Simulated Data. Remote Sens., 2, 1508-1529.
3. ASRT, 1982. Soil Map of Egypt. Final report, Academy of Scientific Research and Technology (ASRT) Cairo, Egypt.
4. CAPMAS, (2009). "Statistical Year Book" Central Agency for Public Mobilization and Statistics (CAPMAS), annual report July 2009, Cairo, Egypt.
5. Deng, J., Wang. K., Li, J., Feng, X. and Huang, J., 2005. Integration of SPOT-5 and ETM+ images to Detect Land Cover Change in Urban Environment, IEEE International Geoscience and Remote Sensing Symposium, Seoul, July 25-29, 2005.
6. Deng, J.S., Wang, K., Deng, Y.H., and Qi, G.J., 2008. PCA-based land-use change detection and analysis using multitemporal and multisensor satellite data. International Journal of Remote Sensing, 29(16), 4823-4838.
7. FAO, 1985. Land evaluation for irrigated agriculture. Soils bulletin 55, FAO, Rome.
8. Foody, G.M., and Boyd, D.S., 1999. Detection of partial land cover change associated with the migration of inner-class transitional zones. Int. J. Remote Sensing 20, 2723-2740.
9. Hulme, M. and March, R., 1990. Global Mean Monthly Humidity Surfaces for 1930-59, 1960-89 and Projected for 2020. UNEP/GEMS/GRID. Climatic Res. Unit, Univ. of East Anglia, Norwich, England
10. Khorram, S., Biging, G.S., Chrisman, N.R., Congalton, R.G., Dobson, J.E, Ferguson, R.L., Goodchild, M.F., Jensen, J.R., and Mace, T.H., 1999. Accuracy Assessment of Remote Sensing-Derived Change Detection. American Society of Photogrammetry and Remote Sensing, Bethesda: Maryland, 64P.
11. Lambin, E. F., and Ehrlich, D., 1997. Land - cover changes in Sub - Saharan Africa (1982- 1991): application of a change index based on remotely sensed surface temperature and vegetation indices at a continental scale. Remote Sens. Environ. 61 (2), 181-200.
12. Lenney, M.P., Woodcock, C.E., Collins J.B., and Hamdi, H., 1996. The status of agricultural lands in Egypt: The use of Multi temporal NDVI features derived from landsat TM”. Remote Sens. Environ., 56, 8-20.
13. Li, X. and Yeh, A., 2004. Analyzing spatial restructuring of land use patterns in a fast growing region using remote sensing and GIS. Landscape and Urban Planning 69(4): 335-354.
14. Lillesand, T.M., and Kiefer, R.W., 1994. Remote Sensing and Image Interpretation. 4th edition, New York, John Wiley and Sons.
15. Lu, D., Mausel, P., Brondizio, E., and Morean, E., 2004. Change detection techniques. International Journal of Remote Sensing 25(12): 2365-2407.
16. Lunetta R. S., and Elvidge, C. D., 1998. Remote Sensing Change Detection. Michigan: Ann Arbor Press, Chapter 7, p. 123-135
17. Maldonado, F.D., dos Santos, J.R. and de Carvalho, V.C., 2002, Landuse dynamics in the semi-arid region of Brazil (Quixaba, PE): characterization by principal component analysis (PCA). International Journal of Remote Sensing, 23(23), 5005-5013.
18. Mendoza, J.E., and Etter, R., 2002. Multitemporal analysis (1940-1996) of land cover changes in the southwestern Bogota highplain (Colombia). Landscape and urban planning, 59(3), 147- 158.
19. Milne, A. K., 1988. Change detection analysis using Landsat imagery a review of methodology. In: Proceedings of IGARSS, 88 Symposiums, Edinburgh, Scotland, 13-16 September 1988. pp. 541-544.
20. Muchoney, D.M., and Haack, B., 1994. Change detection for monitoring forest defoliation. Photogrammetric Engineering and Remote Sensing 60, 1243–1251.
21. Nguyen Q. D., 2001. Cave database development, spatial analysis and 3D visualization with GIS - Case study in Son La (Vietnam). VUBrussels, Master dissertation (unpubl.).
22. Pavasovic, k., 1993. Land suitability models. Workshop on Geographical Information Systems in Integrated Coastal Management, Alexandria, Egypt.
23. Ram, B., and Kolarkar, A.S., 1993. Remote sensing application in monitoring land-use changes in arid Rajasthan. Int .J. Remote Sens. 14(17). 3191-3220.
24. Rembold, F., Carnicelli, S., Nori M., and Ferrari, A., 2000. Use of aerial photographs, landsat TM imagery and multidisciplinary field survey for land -cover change analysis in the lakes region (Ethiopia). Int. J. appl. Earth Observation and Geoinformation, 2(3-4), 181- 189.
25. Sadek, S.H.A., 1993. Use of landsat imagery for monitoring agricultural expansion of East and West Nile Delta, Egypt. Egyptian J. Soil Sci., 33(1). 23-24.
26. Shalaby, A., and Tateishi, R. 2007. Remote sensing and GIS for mapping and monitoring land cover and land-use changes in the Northwestern coastal zone of Egypt. Applied Geography, 27 (2007) 28–41
27. Singh, A., 1989. Digital change detection techniques using remotely sensed data. International Journal of remote sensing, 10, 989-1003.
28. Stow, D. A., Chen. D.M., and Parrott, R., 1996. Enhancement, identification and quantification of land cover change. In: Morain, S.A., Lopez Barose, S.V. (Eds.), Raster Imagery in Geographical Information Systems. One Word, Santa Fe, pp. 307-312.
29. Stow, D.A., 1999. Reducing mis-registration effects for pixel-level analysis of land-cover change. International Journal of Remote Sensing 20, 2477–2483.
30. Suliman, M. K., 1991. Universities and Development of the Desert land in the ARE. The second annual university conference, Cairo, 2-5 November 1991.
31. USDA, 2010. Keys to Soil Taxonomy. United State Department of Agriculture, Natural Resources Conservation Service (NRCS) eleventh edition.
32. Yikalo, H. A., and Pedro C., 2010. Analysis and Modeling of Urban Land Cover Change in Setúbal and Sesimbra, Portugal. Remote Sens. 2010, 2, 1549-1563.
33. Yuan, D., Elvidge, C.D., and Lunetta, R.S., 1999. Survey of multi-spectral methods for land cover change analysis. In: Lunetta, R.S., Elvidge, C.D. (Eds.), Remote Sensing
261

International Journal of Environmental Sciences Shalaby, A. Vol. 1 No.4 ISSN: 2277-1948
Online version available at: www.crdeep.com
Change Detection: Environmental Monitoring Methods and Applications. Tylor & Francis, London, pp. 21-39.
262