full-day and half-day kindergarten in the united states. department of education institute of...
TRANSCRIPT

U.S. Department of EducationInstitute of Education SciencesNCES 2004–078
Full-day and Half-dayKindergarten in theUnited StatesFindings from the EarlyChildhood LongitudinalStudy, KindergartenClass of 1998–99

U.S. Department of EducationInstitute of Education SciencesNCES 2004–078
Full-day and Half-dayKindergarten in theUnited StatesFindings from the EarlyChildhood LongitudinalStudy, KindergartenClass of 1998–99
June 2004
Jill WalstonEducation StatisticsServices Institute
Jerry WestNational Center forEducation Statistics

U.S. Department of EducationRod PaigeSecretary
Institute of Education SciencesGrover J. WhitehurstDirector
National Center for Education StatisticsRobert LernerCommissioner
The National Center for Education Statistics (NCES) is the primary federal entity for collecting, analyzing, andreporting data related to education in the United States and other nations. It fulfills a congressional mandateto collect, collate, analyze, and report full and complete statistics on the condition of education in the UnitedStates; conduct and publish reports and specialized analyses of the meaning and significance of such statistics;assist state and local education agencies in improving their statistical systems; and review and report oneducation activities in foreign countries.
NCES activities are designed to address high priority education data needs; provide consistent, reliable, complete,and accurate indicators of education status and trends; and report timely, useful, and high quality data to theU.S. Department of Education, the Congress, the states, other education policymakers, practitioners, data users,and the general public.
We strive to make our products available in a variety of formats and in language that is appropriate to avariety of audiences. You, as our customer, are the best judge of our success in communicating informationeffectively. If you have any comments or suggestions about this or any other NCES product or report, we wouldlike to hear from you. Please direct your comments to:
National Center for Education StatisticsInstitute of Education SciencesU.S. Department of Education1990 K Street NWWashington, DC 20006–5651
June 2004
The NCES World Wide Web Home Page address is: http://nces.ed.govThe NCES World Wide Web Electronic Catalog is: http://nces.ed.gov/pubsearch
Suggested Citation
Walston, J.T., and West, J. (2004). Full-day and Half-day Kindergarten in the United States: Findings from theEarly Childhood Longitudinal Study, Kindergarten Class of 1998–99 (NCES 2004–078). U.S. Department ofEducation, National Center for Education Statistics. Washington, DC: U.S. Government Printing Office.
For ordering information on this report, write:
U.S. Department of EducationED PubsP.O. Box 1398Jessup, MD 20794–1398
Call toll free 1–877–4ED–Pubs; or order online at http://www.edpubs.org
Content Contact:Jerry West(202) 502–[email protected]

iii
The authors wish to recognize the 20,000 par-ents and children and the more than 3,000 kinder-garten teachers who participated during the firstyear of the study. We would like to thank the ad-ministrators of the more than 1,000 schools we vis-ited across the United States for allowing us to workwith their children, teachers and parents, and forproviding us with information about their schools.We are especially appreciative of the assistance wereceived from the Chief State School Officers, dis-trict superintendents and staff, and private schoolofficials.
We also thank Elvie Germino Hausken of theNational Center for Education Statistics (NCES);Jonaki Bose formerly with NCES, Amy Rathbun,Kristin Denton Flanagan, Sandy Eyster, EmilyRosenthal, Frank Avenilla, Nikkita Willis, andDeeAnn Brimhall of the Education Statistics Ser-vices Institute (ESSI), and Lizabeth Reaney formerlywith ESSI for their hard work and dedication insupporting all aspects of the ECLS-K program. Wealso appreciate the comments we received from BillHussar at NCES, Leslie Scott at ESSI, KarenO’Conor at the Institute of Education Sciences, andfrom two anonymous reviewers.
Westat, Incorporated—in affiliation with theInstitute for Social Research and the School of Edu-cation at the University of Michigan, and the Edu-cational Testing Service, under the direction of theNational Center for Education Statistics (NCES)—conducted the base-year study. We would like toexpress our appreciation for the efforts of the stafffrom each of these organizations, and especially tothe more than 400 field staff who conducted thechild assessments and parent interviews in fall 1998and spring 1999.
We wish to acknowledge the support that wehave received from the Head Start Bureau of theAdministration on Children, Youth and Families;the Economic Research Service of the U.S. Depart-ment of Agriculture; the National Institute for ChildHealth and Human Development; and the U.S.Department of Education’s Office of Special Edu-cation Programs, Office of English Language Ac-quisition, and Policy and Program Studies Service.
A special thank you to Kendra Chandler Webb,age 9 (1994), for designing the ECLS logo and toMariel Escudero at ESSI for the design of the re-port.
Acknowledgments


v
Table of ContentsAcknowledgments .................................................................... iii
Executive Summary .................................................................. xv
Chapter 1. Introduction ..............................................................1Full-day and half-day kindergarten ............................................................. 1Data source ............................................................................................ 3Organization of findings ........................................................................... 8
Chapter 2. Schools offering full-day and half-daykindergarten programs .............................................................. 11
Chapter 3. Children enrolled in full-day and half-daykindergarten programs …… ...................................................... 17
School characteristics ..............................................................................18Race/ethnicity .......................................................................................20Poverty status and home language ............................................................21
Chapter 4. Full-day and half-day public schoolkindergarten classes ................................................................. 25
4.1 Composition and structure of public kindergarten classes ......................25 Minority and LEP enrollment .............................................................25 Teacher characteristics .....................................................................27 Class size and classroom aides ..........................................................29
4.2 Instructional practices and curricular focus .........................................31 Classroom organization ....................................................................31 Grouping strategies .........................................................................34 Subject areas .................................................................................36 Reading/language arts activities and skills ..........................................39 Mathematics activities and skills .......................................................42
Chapter 5. Cognitive gains of public school children in full-dayand half-day kindergarten classes ............................................... 45
Key findings: Reading gains ......................................................................47Key findings: Mathematics gains ...............................................................49HLM analyses .........................................................................................50Variables in the analyses ..........................................................................51Sample ..................................................................................................54Findings: Reading score gains ...................................................................54Findings: Mathematics score gains .............................................................60
Chapter 6. Summary and discussion ........................................... 65
References .............................................................................. 69

Full-day and Half-day Kindergarten in the United Statesvi
Appendix A: Tables of estimates ................................................. 71
Appendix B: Supplemental figures: Reading and mathematicsactivities and skills .. ............................................................... 91
Appendix C: Standard error tables ............................................. 103
Appendix D: Methodology and technical notes............................ 123Survey methodology .............................................................................. 123Statistical procedures ............................................................................ 123Weights and standard errors ................................................................... 126Variable definitions ............................................................................... 126

vii
List of TablesTable 1. Sample sizes, population counts, and percentage distribution of
U.S. schools with kindergartens, by various characteristics: Spring 1999 ...... 4Table 2. Sample sizes, population counts, and percentage distribution of U.S.
kindergartners, by various school and child characteristics: Spring 1999 ...... 5Table 3. Sample sizes, population counts, and percentage distribution of U.S.
public kindergarten classrooms, by various characteristics: Spring 1999 ....... 7Table 4. Sample sizes and percentage distributions for selected characteristics
of all public kindergarten children and of all children used in the analyses:1998–99 ..........................................................................................55
Table 5. Multilevel regression model relating reading score gains of publicschool first-time kindergartners to child and class characteristics: Fall 1998to spring 1999 ..................................................................................57
Table 6. Variance components of the null model, the intermediate model with onlychild characteristics, and the final model with child and class character-istics; kindergarten reading score gains: Fall 1998 to spring 1999..............59
Table 7. Multilevel regression model relating mathematics score gains ofpublic school first-time kindergartners to child and class characteristics:Fall 1998 to spring 1999 .....................................................................61
Table 8. Variance components of null model, the model with only childcharacteristics and the final model, kindergarten mathematics scores gains:Fall 1998 to spring 1999 .....................................................................63
Appendix A TablesTable A1. Percent of U.S. schools that offer full-day and half-day kindergarten
programs, by school type: 1998–99 ....................................................71Table A2. Percent of U.S. schools that offer full-day and half-day kinder-
garten programs, by school type and school characteristics: 1998–99 .......71Table A3. Percent of U.S. kindergarten children enrolled in a full-day kinder-
garten program, by school type and school characteristics: 1998–99 ........72Table A4. Percent of U.S. kindergarten children enrolled in a full-day
program, by school type and child and family characteristics: 1998–99.....73Table A5. Percent of U.S. public kindergarten children enrolled in a full-day
program by poverty status and primary home language: 1998–99 ............74Table A6. Percentage distribution of U.S. public kindergarten classes with
various enrollment characteristics, by program type: 1998–99 .................74Table A7. Percentage distribution of various teacher characteristics in U.S.
public kindergarten classes, by program type: 1998–99 ..........................75Table A8. Percentage distribution of class sizes and percent of classes with
classroom aides in U.S. public kindergarten classes, by program type:1998–99 .........................................................................................75
Table A9. Average minutes per day and percent of total time that U.S.public kindergarten classes spend in various classroom organizations, byprogram type: Spring 1999 ................................................................76
Table A10. Percentage distribution of the frequency that U.S. publickindergarten classes use various grouping strategies for reading andmathematics instruction, by program type: Spring 1999 .........................77

Full-day and Half-day Kindergarten in the United Statesviii Table of Contents
Table A11. Percent of U.S. public kindergarten classes that spend timedaily, weekly or less than weekly in various subject areas, by program type:Spring 1999 .....................................................................................78
Table A12. Percentage distribution of the amount of time per day U.S. publickindergarten classes spend on reading/language arts and mathematicsactivities, by program type: Spring 1999 ..............................................79
Table A13. Percent of U.S. public kindergarten classes that work daily,weekly or less than weekly on various reading activities, by program type:Spring 1999 .....................................................................................80
Table A14. Percent of U.S. public kindergarten classes that work daily,weekly or less than weekly on various reading skills, by program type:Spring 1999 .....................................................................................81
Table A15. Percent of U.S. public kindergarten classes that work daily,weekly or less than weekly on various writing activities, by program type:Spring 1999 .....................................................................................82
Table A16. Percent of U.S. public kindergarten classes that work daily,weekly or less than weekly on various writing skills, by program type:Spring 1999 .....................................................................................83
Table A17. Percent of U.S. public kindergarten classes that work daily,weekly or less than weekly on various receptive and expressive languageactivities, by program type: Spring 1999 ..............................................84
Table A18. Percent of U.S. kindergarten classes that work daily, weekly orless than weekly on various receptive and expressive language skills, byprogram type: Spring 1999 ................................................................84
Table A19. Percent of U.S. public kindergarten classes that work daily,weekly or less than weekly on various mathematics activities, byprogram type: Spring 1999 ................................................................85
Table A20. Percent of U.S. public kindergarten classes that work daily, weeklyor less than weekly on various mathematics skills involving countingand quantities, by program type: Spring 1999.......................................86
Table A21. Percent of U.S. public kindergarten classes that work daily, weeklyor less than weekly on various mathematics skills involving numbersystems, by program type: Spring 1999 ...............................................87
Table A22. Percent of U.S. public kindergarten classes that work daily, weeklyor less than weekly on various mathematics skills involving operations,by program type: Spring 1999 ............................................................88
Table A23. Percent of U.S. public kindergarten classes that work daily,weekly or less than weekly on various mathematics skills involvingmeasurement, by program type: Spring 1999 ........................................88
Table A24. Percent of U.S. public kindergarten classes that work daily,weekly or less than weekly on various mathematics skills involving dataanalysis, by program type: Spring 1999 ................................................89
Table A25. Percent of U.S. public kindergarten classes that work daily, weeklyor less than weekly on various mathematics skills involving geometry, byprogram type: Spring 1999 ................................................................89
Table A26. Percent of U.S. public kindergarten classes that work daily, weekly

ix
or less than weekly on various mathematics skills involving patterns andsorting, by program type: Spring 1999 ................................................90
Table A27. Public school first-time kindergartners’ mean reading fall, spring andgain scores (unadjusted), by program type: Fall 1998 to spring 1999 .......90
Table A28. Public school first-time kindergartners’ mean mathematics fall,spring and gain scores (unadjusted), by program type: Fall 1998 to spring1999 ..............................................................................................90
Appendix C TablesTable C1. Standard errors for table A1, figures A and 2—Percent of U.S.
schools that offer full-day and half-day kindergarten programs, by schooltype: 1998–99 ............................................................................... 103
Table C2. Standard errors for table A2, figures 3, 4, 5, and 6—ofU.S. schools that offer full-day and half-day kindergarten programs, byschool characteristics: 1998–99 ........................................................ 103
Table C3. Standard errors for table A3, figures B, 7, and 8—Percent of U.S.kindergarten children enrolled in a full-day kindergarten program, byschool characteristics: 1998–99 ........................................................ 104
Table C4. Standard errors for table A4, figures 9, 10, 11, and 12—Percent ofU.S. kindergarten children enrolled in a full-day program, by school typeand child and family characteristics: 1998–99 ..................................... 105
Table C5. Standard errors for table A5 and figure 13—Percent of U.S. public kinder-garten children enrolled in a full-day program, by poverty status andprimary home language: 1998–99 ..................................................... 106
Table C6. Standard errors for table A6 and figure 14—Percentage distributionof U.S. public kindergarten classes with various enrollment characteristics,by program type: 1998–99............................................................... 106
Table C7. Standard errors for table A7, figures 15, 16, and 17—Percentagedistribution of various teacher characteristics in U.S. public kindergartenclasses, by program type: 1998–99 ................................................... 107
Table C8. Standard errors for table A8, figures 18 and 19—Percentagedistribution of class sizes and percent of classes with classroom aides inU.S. public kindergarten classes, by program type: 1998–99.................. 107
Table C9. Standard errors for table A9, figures 20 and 21—Average minutes perday and percent of total time that U.S. public kindergarten classes spendin various classroom organizations, by program type: Spring 1999 ......... 108
Table C10. Standard errors for table A10 and figure 22—Percentagedistribution of the frequency that U.S. public kindergarten classes usevarious grouping strategies for reading and mathematics instruction, byprogram type: Spring 1999 .............................................................. 109
Table C11. Standard errors for table A11, figures C, 23, and 24—Percent ofU.S. public kindergarten classes that spend time daily, weekly or less thanweekly in various subject areas, by program type: Spring 1999 .............. 110
Table C12. Standard errors for Table A12 and figures 25 and 26—Percentdistribution of the amount of time per day U.S. public kindergarten classesspend time on reading/language arts activities and mathematics activities,by program type: Spring 1999 .......................................................... 111
Full-day and Half-day Kindergarten in the United Statesx
Table C13. Standard errors for table A13, figures D, 27, and B1—Percent ofU.S. public kindergarten classes that work daily, weekly or less than weeklyon various reading activities, by program type: Spring 1999 .................. 112
Table C14. Standard errors for table A14, figures D, 27, and B2—Percent ofU.S. public kindergarten classes that work daily, weekly or less than weeklyon various reading skills, by program type: Spring 1999 ....................... 113
Table C15. Standard errors for table A15, figures D and B3—Percent of U.S.public kindergarten classes that work daily, weekly or less than weekly onvarious writing activities, by program type: Spring 1999 ....................... 114
Table C16. Standard errors for table A16, figures D and B4—Percent of U.S.public kindergarten classes that work daily, weekly or less than weekly onvarious writing skills, by program type: Spring 1999 ............................ 115
Table C17. Standard errors for table A17, figures D and B5—Percent of U.S.public kindergarten classes that work daily, weekly or less than weekly onvarious receptive and expressive language activities, by program type:Spring 1999 ................................................................................... 116
Table C18. Standard errors for table A18 and figure B6—Percent of U.S. kinder-garten classes that work daily, weekly or less than weekly on variousreceptive and expressive language skills, by program type: Spring 1999... 116
Table C19. Standard errors for table A19 and figure B7—Percent of U.S.public kindergarten classes that work daily, weekly or less than weekly onvarious mathematics activities, by program type: Spring 1999 ............... 117
Table C20. Standard errors for table A20, figures E and B8—Percent ofU.S. public kindergarten classes that work daily, weekly or less thanweekly on various mathematics skills involving counting and quantities,by program type: Spring 1999 .......................................................... 118
Table C21. Standard errors for table A21, figures E and B9—Percent ofU.S. public kindergarten classes that work daily, weekly or less thanweekly on various mathematics skills involving number systems, byprogram type: Spring 1999 .............................................................. 119
Table C22. Standard errors for table A22, figures E and B10—Percent of U.S.public kindergarten classes that work daily, weekly or less than weekly onvarious mathematics skills involving operations, by program type: Spring1999 ............................................................................................ 120
Table C23. Standard errors for table A23, figures E and B11—Percent of U.S.public kindergarten classes that work daily, weekly or less than weekly onvarious mathematics skills involving measurement, by program type:Spring 1999 ................................................................................... 120
Table C24. Standard errors for table A24 and figure B12—Percent of U.S.public kindergarten classes that work daily, weekly or less than weekly onvarious mathematics skills involving data analysis, by program type:Spring 1999 ................................................................................... 121
Table C25. Standard errors for table A25 and figure B13—Percent of U.S.public kindergarten classes that work daily, weekly or less than weekly onvarious mathematics skills involving geometry, by program type:Spring 1999 ................................................................................... 121

xi
Table C26. Standard errors for table A26 and figure B14—Percent of U.S.public kindergarten classes that work daily, weekly or less than weekly onvarious mathematics skills involving patterns and sorting, by programtype: Spring 1999 ……………………. ............................................ 122
Table C27. Standard errors for table A27, figures F and 29—Public schoolfirst-time kindergartners’ mean reading fall, spring and gain scores(unadjusted), by program type: Fall 1998 to spring 1999 ..................... 122
Table C28. Standard errors for table A28, figures G and 31—Public schoolfirst-time kindergartners’ mean mathematics fall, spring and gain scores(unadjusted), by program type: Fall 1998 to spring 1999 ..................... 122
Full-day and Half-day Kindergarten in the United Statesxii
List of FiguresFigure A. Percent of U.S. schools that offer full-day and half-day
kindergarten programs, by school type: 1998–99.................................. xviFigure B. Percent of U.S. kindergarten children enrolled in a full-day program,
by race/ethnicity and school type: 1998–99 ....................................... xviiFigure C. Percent of U.S. public kindergarten classes that spend time each
day on various academic subject areas, by program type: Spring 1999 ... xviiiFigure D. Percent of U.S. public kindergarten classes that work daily on
various reading/language arts activities and skills, by program type:Spring 1999 .................................................................................... xix
Figure E. Percent of U.S. public kindergarten classes that work daily on variousmathematics activities and skills, by program type: Spring 1999 .............. xx
Figure F. Public school first-time kindergartners’ mean reading gain scores,by program type: Fall 1998 to spring 1999 .......................................... xxi
Figure G. Public school first-time kindergartners’ mean mathematics gainscores, by program type: Fall 1998 to spring 1999 .............................. xxii
Figure 1. Percent of kindergarten children enrolled in a full-day program,1970 through 1998 ........................................................................... 2
Figure 2. Percent of U.S. schools that offer full-day and half-daykindergarten programs, by school type: 1998–99...................................13
Figure 3. Percent of U.S. public schools that offer full-day and half-daykindergarten programs, by region: 1998–99 ..........................................13
Figure 4. Percent of U.S. public schools that offer full-day andhalf-day kindergarten programs, by location: 1998–99 ...........................14
Figure 5. Percent of U.S. schools that offer full-day and half-daykindergarten programs, by percent minority enrollment and schooltype: 1998–99 .................................................................................14
Figure 6. Percent of U.S. public schools that offer full-day and half-daykindergarten programs, by low-income concentration: 1998–99 ...............15
Figure 7. Percent of U.S. kindergarten children enrolled in full-day andhalf-day programs, by school type; 1998–99 ........................................19
Figure 8. Percent of U.S. kindergarten children enrolled in a full-dayprogram, by region and school type; 1998–99 ......................................19
Figure 9. Percent of U.S. kindergarten children enrolled in a full-dayprogram, by race/ethnicity: 1998–99 ..................................................20
Figure 10. Percent of U.S. kindergarten children enrolled in a full-dayprogram, by race/ethnicity and school type: 1998–99 ............................21
Figure 11. Percent of U.S. kindergarten children enrolled in a full-dayprogram, by primary home language and school type: 1998–99 ...............22
Figure 12. Percent of U.S. kindergarten children enrolled in a full-dayprogram, by poverty status and school type: 1998–99 ...........................22
Figure 13. Percent of public school kindergarten children enrolled in a full-dayprogram, by poverty status and primary home language: 1998–99 ...........23
Figure 14. Percentage distribution of minority enrollment in U.S. publickindergarten classes, by program type: 1998–99 ...................................26

xiii
Figure 15. Percentage distribution of U.S. public kindergarten classes taughtby teachers of different race/ethnicities, by program type: 1998–99 ........28
Figure 16. Percentage distribution of U.S. public kindergarten classes taught byteachers with various levels of education, by program type: 1998–99 .......28
Figure 17. Percent of U.S. kindergarten classes taught by teachers withdifferent areas of certification, by program type: 1998–99 ......................29
Figure 18. Percentage distribution of class sizes (number of children) forU.S. public kindergarten classes, by program type: 1998–99....................30
Figure 19. Percent of U.S. public kindergarten classes with a classroom aide,by type of aide and program type: Spring 1999 .....................................31
Figure 20. Average minutes per day U.S. public kindergarten classes spendin various classroom organizations, by program type: Spring 1999 ...........32
Figure 21. Average percent of class time U.S. public kindergarten classes spendin various classroom organizations, by program type: Spring 1999 ...........33
Figure 22. Percentage distribution of the frequency that U.S. publickindergarten classes use various grouping strategies for reading andmathematics instruction, by program type: Spring 1999 .........................35
Figure 23. Percent of U.S. public kindergarten classes that spend timeeach day on various academic subject areas, by program type: Spring1999 ..............................................................................................37
Figure 24. Percent of U.S. public kindergarten classes that spend time eachday on various music and art subject areas, by program type:Spring 1999 .....................................................................................37
Figure 25. Percentage distribution of the amount of time per day U.S.public kindergarten classes spend on reading instruction, by programtype: Spring 1999.............................................................................38
Figure 26. Percentage distribution of the amount of time per day U.S.public kindergarten classes spend on mathematics instruction, byprogram type: Spring 1999 ................................................................38
Figure 27. Percent of U.S. public kindergarten classes that work daily onvarious reading/language arts activities and skills, by program type: Spring 1999....................................................................................41
Figure 28. Percent of U.S. public kindergarten classes that work daily onvarious mathematics activities and skills, by program type: Spring 1999 ...43
Figure 29. Public school first-time kindergartners’ mean reading gainscores, by program type: Fall 1998 to spring 1999 ................................48
Figure 30. Public school, first-time kindergartners’ mean reading score gains,by race/ethnicity, program type and the presence of an aide inthe class: Fall 1998 to spring 1999 .....................................................48
Figure 31. Public school first-time kindergartners’ mean mathematics gainscores, by program type: Fall 1998 to spring 1999 ................................50
Appendix BFigure B1. Percent of U.S. public kindergarten classes that work daily, weekly or
less than weekly on various reading activities, by program type:Spring 1999 .....................................................................................91

Full-day and Half-day Kindergarten in the United Statesxiv
Figure B2. Percent of U.S. public kindergarten classes that work daily,weekly or less than weekly on various reading skills, by program type:Spring 1999 .....................................................................................92
Figure B3. Percent of U.S. public kindergarten classes that work daily,weekly or less than weekly on various writing activities, by program type:Spring 1999 .....................................................................................93
Figure B4. Percent of U.S. public kindergarten classes that work daily,weekly or less than weekly on various writing skills, by program type:Spring 1999 .....................................................................................94
Figure B5. Percent of U.S. public kindergarten classes that work daily,weekly or less than weekly on various receptive and expressive languageactivities, by program type: Spring 1999 ..............................................95
Figure B6. Percent of U.S. kindergarten classes that work daily, weekly orless than weekly on various receptive and expressive language skills, byprogram type: Spring 1999 ................................................................95
Figure B7. Percent of U.S. public kindergarten classes that work daily,weekly or less than weekly on various mathematics activities, byprogram type: Spring 1999 ................................................................96
Figure B8. Percent of U.S. public kindergarten classes that work daily,weekly or less than weekly on various mathematics skills involvingcounting and quantities, by program type: Spring 1999 .........................97
Figure B9. Percent of U.S. public kindergarten classes that work daily,weekly or less than weekly on various mathematics skills involvingnumber systems, by program type: Spring 1999 ...................................98
Figure B10. Percent of U.S. public kindergarten classes that work daily,weekly or less than weekly on various mathematics skills involvingoperations, by program type: Spring 1999 ............................................99
Figure B11. Percent of U.S. public kindergarten classes that work daily,weekly or less than weekly on various mathematics skills involvingmeasurement, by program type: Spring 1999 ...................................... 100
Figure B12. Percent of U.S. public kindergarten classes that work daily,weekly or less than weekly on various mathematics skills involving dataanalysis, by program type: Spring 1999 .............................................. 100
Figure B13. Percent of U.S. public kindergarten classes that work daily,weekly or less than weekly on various mathematics skills involvinggeometry, by program type: Spring 1999............................................ 101
Figure B14. Percent of U.S. public kindergarten classes that work daily,weekly or less than weekly on various mathematics skills involvingpatterns and sorting, by program type: Spring 1999 ............................ 101

xv
A major trend in kindergarten programs thathas occurred in the past few decades is an increasein the prevalence of kindergarten classes that meetfor the entire school day rather than just a part ofthe day. The increase has been attributed to varioussocial, economic and educational factors. Increasesin the number of single parent households andhouseholds with both parents working are com-monly cited as important factors contributing tothe need for full-day programs (e.g., Gullo 1990;Morrow, Strickland, and Woo 1998). Arrangingchildcare during the workday is less costly and lesscomplicated for these families when the child is inschool for the whole day rather than half of the day.Another rationale in support of full-day kindergar-ten is that children who have spent some of theirpre-kindergarten years in nursery school classes orchild care arrangements (often full-day) are readyfor the cognitive, social and physical demands of afull-day kindergarten (Gullo 1990). Proponents offull-day kindergarten also emphasize the potentialeducational benefit—teachers have more time toget to know their children and individualize theirinstruction, and children have more time to acquirethe early academic skills taught in kindergarten(Morrow, Strickland and Woo 1998). In some cases,the move to full-day classes has been made to pro-vide sufficient time for children to complete kin-dergarten curriculum that has become increasinglyrigorous (Shepard and Smith 1988).
The differences between these two types of kin-dergarten programs have been the subject of a gooddeal of research as the move to full-day programshas been implemented at the state and local levels(e.g., Cryan et al. 1992; Elicker and Mathur 1997;Fusaro 1997; Gullo 2000; Morrow, Strickland andWoo 1998). Not until the Early Childhood Longi-tudinal Study, Kindergarten Class of 1998–99(ECLS-K) has the opportunity been available todescribe full-day and half-day kindergarten differ-ences at the national level. This report examinesdifferences between full-day and half-day kinder-garten across the United States using ECLS-K datafrom schools, teachers, parents and kindergartenchildren. This report describes the schools, bothpublic and private, that offer these programs and
the children who attend them. It also describesmany characteristics of public school full-day andhalf-day kindergarten classes, including specific cur-riculum differences between the program types. Thereport ends with an examination of the cognitivegains public school children make in full-day andhalf-day classes during the kindergarten year.
Schools that offer full-day andhalf-day kindergarten
In the 1998–99 school year, 61 percent of allU.S. schools that have a kindergarten program offerat least one full-day kindergarten class and 47 per-cent offer at least one half-day class (table A1).1
These percents, however, are not uniform acrossdifferent school types. Full-day programs are mostprevalent in Catholic schools (figure A).
Among public schools, there is a strong regionaldifference—84 percent of public schools in thesouthern region2 of the country provide a full-dayprogram. Full-day kindergarten is also more preva-lent in public schools located in cities (64 percent)and in small towns or rural areas (63 percent) com-pared with suburban or large town areas (46 per-cent). The percent of schools that offer full-day pro-grams is also related to schools’ enrollment of chil-dren that are at-risk for school failure.3 Both pri-vate and public schools that serve high concentra-tions of minority children are more likely to pro-vide full-day programs compared to those that servelow concentrations of minority children. Addition-ally, full-day programs are more likely to be offered
Executive Summary
1Estimates here and elsewhere in the executive summary arenot adjusted by other child, class or school variables unlessnoted.2The southern region of the country includes: DE, DC, FL,GA, MD, NC, SC, VA, WV, AL, KY, MS, TN, AR, LA,OK, and TX.3The term “at-risk” refers to children who belong to asocio-demographic group that, on average, performs loweron measures of academic achievement compared to othergroups. Black and Hispanic children, low-income children,and children from non-English speaking families are “at-risk” for school failure (e.g., U.S. Department of Education2001; West, Denton and Reaney 2001).
Executive Summary

Full-day and Half-day Kindergarten in the United Statesxvi
in public schools where at least half of the enroll-ment is comprised of low-income children (69 per-cent) than in schools with fewer low-income chil-dren (48 percent).
Children enrolled in full-day andhalf-day kindergarten
Overall, 56 percent of kindergarten childrenattend a full-day program; 54 percent of publicschool kindergarten children attend a full-day pro-gram and 67 percent of private school children do.In public schools, 79 percent of Black kindergartenchildren are attending full-day programs; this is ahigher rate than is found for White, Asian or His-panic public school kindergartners (figure B). Ad-ditionally, public school kindergartners whose fam-ily income is below the federal poverty thresholdattend full-day programs at a higher rate (62 per-cent) than those from more affluent families (51percent). The findings for Black children and eco-nomically disadvantaged children are consistentwith the common rationale for offering full-dayprograms: to ease the child care needs of families
who are least able to afford quality after-school pro-grams, and to provide “at-risk” children with moretime during the kindergarten year to acquire thebeginning reading and mathematics skills neces-sary to succeed in school (e.g., Gullo 1990; Mor-row, Strickland and Woo 1998). However, not all“at-risk” groups of children are attending full-dayprograms at relatively high rates. Compared to 79percent of Black public school kindergarten chil-dren and 62 percent of public school kindergart-ners living in poverty attending full-day kindergar-ten, 46 percent of public school Hispanic kinder-gartners and 45 percent of public school kinder-gartners from homes where English is not the pri-mary language attend full-day programs.
Among private schools, 77 percent of kinder-gartners in Catholic schools and 65 percent in otherprivate schools attend a full-day program. Blackchildren in Catholic and other private schools aremore likely to attend a full-day program comparedto White children (figure B) but poverty status andhome language are not related to full-day enroll-ment rates in these schools.
NOTE: The percent of schools offering full-day and half-day programs sums to more than 100 because some schools haveboth full-day and half-day classes. Estimates only pertain to schools with a kindergarten program.
SOURCE: U.S. Department of Education, National Center for Education Statistics, Early Childhood Longitudinal Study, Kindergarten Classof 1998–99; School Administrator Questionnaire and Kindergarten Teacher Questionnaires, Base-Year Public-Use Data Files.
Figure A. Percent of U.S. schools that offer full-day and half-day kindergarten programs, byschool type: 1998–99
0
20
40
60
80
100
Percent
School type
Public Catholic Other private
5752
78
29
63
40
Full-day
Half-day

xviiExecutive Summary
Class composition and structurein full-day and half-day publickindergartens
Differences in the composition of public full-day kindergarten classes compared to half-day classesmirror the patterns seen in some of the child-levelenrollment findings. The average percentage of mi-nority children in full-day classes (46 percent) ishigher than that for half-day classes (35 percent).Thirty percent of full-day classes have more than75 percent minority enrollment compared to 19percent of half-day classes. The same pattern in notevident for limited-English proficient students.
A smaller percent of full-day classes are taughtby White teachers, but the majority of both full-day and half-day classes are taught by White teach-ers (80 and 87 percent, respectively). A larger per-cent of full-day classes are taught by Black teachers(10 percent) compared to half-day classes (2 per-cent). Teachers in full-day classes are more likely thanteachers in half-day classes to have their teaching cer-tificate in the area of early childhood education.
The average number of children in full-dayclasses (20.3) is higher than is found in half-dayclasses (19.1). Thirty-nine percent of full-day classeshave between 21 and 25 children compared to 26percent of half-day classes, but very large classes(more than 25 children) are uncommon in bothfull-day (10 percent) and half-day programs (7 per-cent). Classroom instructional aides are more preva-lent in full-day classes. Sixty-one percent of full-day classes and 44 percent of half-day classes havean aide who works for at least an hour per day di-rectly with the children on instructional tasks.
Instructional activities in full-dayand half-day public kindergartenclasses
Teachers in full-day kindergarten classes orga-nize for instruction in much the same way as teach-ers in half-day classes. Full-day kindergarten classesspend, on average, more time each day than half-day classes on teacher-directed whole class, smallgroup, and individual activities and they spend
SOURCE: U.S. Department of Education, National Center for Education Statistics, Early Childhood Longitudinal Study,Kindergarten Class of 1998–99; School Administrator Questionnaire, Kindergarten Teacher Questionnaires, and ParentInterviews, Base-Year Public-Use Data Files.
Figure B. Percent of U.S. kindergarten children enrolled in a full-day program, by race/ethnicity and school type: 1998–99
0
20
40
60
80
100
Percent
Race/ethnicity by school type
Public Catholic Other private
49
79
4640
74
96
79
71
59
91
76 75
White, non-Hispanic
Black, non-Hispanic
Hispanic
Asian

Full-day and Half-day Kindergarten in the United Statesxviii
more time on child-selected activities. When thetotal amount of time available in these classes istaken into account, however, the percent of totalclass time spent in each type of activity is similarfor full-day and half-day classes. The strategies thatteachers use for grouping children for instructionare also examined. Mixed-level groups are the mostcommon grouping strategy in both types of classes.Full-day classes, however, are more likely than half-day classes to use achievement groups at least oncea week for reading instruction (62 percent vs. 50percent) and for mathematics instruction (42 per-cent vs. 32 percent).
A large majority of both full-day and half-dayclasses have reading and language arts activities ev-ery day (97 and 96 percent, respectively) (figureC). However, full-day classes are more likely tospend time each day on other subjects—math, so-cial studies, and science, compared with half-dayclasses. Among the four art and music subjects thatteachers were questioned about—art, music, dance/creative movement, and theater/creative dramatics—only art is done every day in a larger percent of full-day classes (30 percent) compared to half-day classes(21 percent). Music is taught daily in a smallerpercentage of full-day classes (30 percent) comparedto half-day classes (36 percent).
The relative order of the skills and activities thatchildren spend time on within the domains of read-ing/language arts and mathematics is very similarfor full-day and half-day classes; the most commonlyreported skills and activities in full-day classes aregenerally the most common in half-day classes. Al-most all specific skills and activities are more fre-quently covered daily in full-day classes comparedwith half-day classes with some of the exceptionsbeing those done daily by a majority of both typesof classes (e.g., calendar activities and counting outloud).
To illustrate some differences in the daily cur-riculum covered in public kindergarten full-day andhalf-day classes, figures D and E show the percent-age of these classes that work on common kinder-garten activities and skills every day. Figure D pre-sents a selection of the most commonly reportedreading/language arts activities and skills and com-pares the percent of full-day and half-day classesthat do these every day. Figure E compares the per-cent of full-day and half-day classes that spend timeeach day on common mathematics skills and ac-tivities.
While there are many skills and activities that alarger percent of full-day classes spend time on each
SOURCE: U.S. Department of Education, National Center for Education Statistics, Early Childhood Longitudinal Study,Kindergarten Class of 1998–99; Spring 1999 Kindergarten Teacher Questionnaire, Base-year Public-Use Data File.
Figure C. Percent of U.S. public kindergarten classes that spend time each day on variousacademic subject areas, by program type: Spring 1999
Reading and language arts Mathematics Social Studies Science
97 9690
73
30
1824
10
0
20
40
60
80
100
Percent
Subject area
Full-day
Half-day

xixExecutive Summary
day compared with half-day classes, these differ-ences may simply be attributed to the fact that full-day classes have the time to devote to a greater num-ber of separate skills and activities. The differencesin the percent of classes that spend time on specificskills and activities at least weekly (either daily orweekly) may be a more useful comparison for de-scribing differences in the curricular focus betweenfull-day and half-day kindergarten classes. Withinthe reading/language arts domain (reading, writ-ing, and expressive and receptive language), thepercent of full-day classes that engage in a skill oractivity at least weekly exceeds the percent of half-day classes for 19 out of the 36 skills and activitiesexamined. Some of the reading activities and skillsthat are more likely to be part of at least a weeklyroutine in full-day classes are typically consideredmore advanced than the traditional kindergartenreading curriculum (e.g., reading aloud fluently,
reading multi-syllable words, and alphabetizing).4
Nine out of the 11 writing skills and activities aredone weekly in more full-day classes compared tohalf-day classes (e.g., writing in journal, writingstories and reports, and conventional spelling).Among the 37 skills and activities examined in themathematics domain, there are 29 in which thepercentage of full-day classes engaging in the skillor activity at least weekly exceeds the percent ofhalf-day classes. Many of these are activities or skillsthat involve solving mathematics problems
4Comparisons of public school kindergarten and first-gradeactivities and skills show that a higher percent of first-graders compared to kindergartners engage in these at leastonce a week (reading aloud fluently, 98 vs. 44 percent;reading multi-syllable words, 84 vs. 36 percent; andalphabetizing, 66 vs. 18 percent) (unpublished tables,ECLS-K longitudinal kindergarten-first-grade Public-UseData File, NCES 2002–148).
SOURCE: U.S. Department of Education, National Center for Education Statistics, Early Childhood Longitudinal Study,Kindergarten Class of 1998–99; Spring 1999 Kindergarten Teacher Questionnaire, Base-year Public-Use Data File.
Figure D. Percent of U.S. public kindergarten classes that work daily on various reading/language arts activities and skills, by program type: Spring 1999
Percent
Full-day
Half-day
0 20 40 60 80 100
Writing the alphabet
Hearing stories while seeing the print
Writing their name
Work on phonics
Matching letters to sounds
Learning letter names
56
76
62
79
74
85
79
86
79
88
88
91

Full-day and Half-day Kindergarten in the United Statesxx
SOURCE: U.S. Department of Education, National Center for Education Statistics, Early Childhood Longitudinal Study,Kindergarten Class of 1998–99; Spring 1999 Kindergarten Teacher Questionnaire, Base-year Public-Use Data File.
(e.g., explain how a math problem is solved, solvereal-life math problem, and solve math problemson the chalkboard). Additionally, some of thesemathematics skills and activities are ones more typi-cally part of a first-grade curriculum (e.g., recog-nizing fractions, telling time, and writing numbersfrom 1–100).5
Children in full-day kindergarten classes arespending some of the time focused on learning manyof the same things and doing many of the sametypes of learning activities as those in half-day classes,
but some full-day kindergarten classes are spend-ing the “extra time” during the day exposed to moreadvanced reading, writing, and mathematics skills.
Full-day and half-day children’sgains in cognitive skills andknowledge
The ECLS-K children were assessed in read-ing/language arts and mathematics in the fall andin the spring of the kindergarten year. The achieve-ment gains made during the year are compared forEnglish-speaking, first-time kindergartners in full-day and half-day public kindergarten classes. Giventhe non-experimental, pretest-posttest design of thestudy, there is no way to determine if the sampleswere equivalent in all important ways at the begin-ning of the kindergarten year. This is a researchdesign limitation which makes it impossible to drawcausal conclusions from the data.
5Comparisons of public school kindergarten and first-gradeactivities and skills show that a higher percent of first-graders compared to kindergartners engage in theseactivities and skills at least once a week (recognizingfractions, 32 vs. 6 percent; telling time, 72 vs. 40 percent;and writing numbers from 1–100, 41 vs. 18 percent)(unpublished tables, ECLS-K longitudinal kindergarten-first-grade Public-Use Data File, NCES 2002–148).
Figure E. Percent of U.S. public kindergarten classes that work daily on various mathematicsactivities and skills, by program type: Spring 1999
Percent
Full-day
Half-day
0 20 40 60 80 100
36
22
38
20
46
45
49
39
82
81
94
93
Use counting manipulatives to learn operations
Write numbers
Read 2-digit numbers
Number/quantity correspondence
Count out loud
Calendar activities

xxiExecutive Summary
The children enrolled in a full-day programmake greater gains in reading language arts overthe course of the kindergarten year compared tothose in half-day classes (figure F). Additionally,full-day kindergartners make greater gains in math-ematics achievement during the year compared tohalf-day kindergartners (figure G).
The differences in achievement gains associatedwith program type are not only apparent whensimple comparisons of gains are made (figures Fand G), they persist when the comparisons takeinto account other important child and class char-acteristics. Findings from a multi-level regressionanalysis indicate that children in full-day classesmake greater gains in both reading and mathemat-ics compared to those in half-day classes after ad-justing for gain score differences associated withrace/ethnicity, poverty status, fall achievement level,sex, class size, amount of time for subject area in-struction, and the presence of an instructional aide.The positive effect associated with full-day programsafter accounting for these other variables representsa difference in the reading gain scores of about 32percent of a standard deviation. Findings from this
analyses indicate that children in very large classes(25+) make gains in reading that are slightly smallerthan those made by children in medium size classes(18–24). Furthermore, there is not a differentialeffect associated with class size by program type—a smaller class size does not mitigate the differencein gains found between children in half-day andfull-day programs. Additionally, the presence of aclassroom aide is not associated with differences inreading gain scores among White children in eitherhalf-day or full-day programs; however, Black chil-dren in full-day classes with an aide make greaterreading gains compared to Black children in full-day classes without an aide.
After accounting for the same class and childcharacteristics as for reading, children in full-dayprograms make gains in mathematics that repre-sent about 22 percent of a standard deviation morethan the gains made by children in half-day pro-grams. For mathematics achievement, no other childor class variables interact with program type, whichindicates that the greater gains associated with full-day programs are consistent for children with vari-ous socio-demographic backgrounds and acrossother classroom characteristics.
NOTE: Estimates are based on public school, first-time kindergarten children attending a regular kindergarten program (not a transitionalor multi-grade class) who are assessed in English in both the fall and the spring. Only children with the same teacher in both the fall andspring are included in the analysis. Detail may not sum to totals because of rounding. The scores are simple means and are unadjusted fora number of other factors that are related to performance.
SOURCE: U.S. Department of Education, National Center for Education Statistics, Early Childhood Longitudinal Study, Kindergarten Classof 1998–99; Teacher Questionnaire and Child Assessments, Base-Year Public-Use Data File.
Figure F. Public school first-time kindergartners’ mean reading gain scores, by program type:Fall 1998 to spring 1999
0
20
22
24
26
28
30
32
34
Reading scale score
W
21.6
32.1
21.9
31.3
Fall Spring
Full-day, gain 10.6
Half-day, gain 9.4

Full-day and Half-day Kindergarten in the United Statesxxii
The focus of this report is broad; it describesmany differences associated with full-day and half-day kindergarten in the United States. This reportprovides descriptive information about the publicand private schools that offer full-day and half-daykindergarten programs and the children that at-tend them. This report also provides informationabout the teachers in public full-day and half-daykindergarten classes, how they organize their classesfor instruction and the time they spend on manyinstructional activities and skills. The final chapterof findings presents results that support previous
research on full-day kindergarten and the greaterachievement gains in reading and mathematicsmade by children in full-day compared to half-dayprograms. It is the intention of this report to pro-vide a broad picture of full-day and half-day kin-dergarten in the United States and to spur otherresearchers to use the rich array of child, parent,classroom and school information available in theECLS-K data to further examine aspects of full-dayand half-day kindergarten and associated relation-ships.
NOTE: Estimates are based on public school, first-time kindergarten children attending a regular kindergarten program (not a transitionalor multi-grade class) who are assessed in mathematics in both the fall and the spring. Only children with the same teacher in both thefall and spring are included in the analysis. Detail may not sum to totals because of rounding. The scores are simple means and areunadjusted for a number of other factors that are related to performance.
SOURCE: U.S. Department of Education, National Center for Education Statistics, Early Childhood Longitudinal Study, Kindergarten Classof 1998–99; Teacher Questionnaire and Child Assessments, Base-Year Public-Use Data File.
Figure G. Public school first-time kindergartners’ mean mathematics gain scores, by programtype: Fall 1998 to spring 1999
0
18
20
22
24
26
28
30
32
Mathematics scale score
W
19.0
27.6
19.8
27.6
Fall Spring
Full-day, gain 8.6
Half-day, gain 7.8

1
Introduction
This report presents findings from the first yearof the Early Childhood Longitudinal Study, Kin-dergarten Class of 1998–99 (ECLS-K). Its focus ison descriptive comparisons of full-day and half-daykindergarten in the United States. It describes thepublic and private schools that offer full-day andhalf-day kindergarten and the children enrolled inthese programs. Taking a closer look at public schoolkindergarten, it details the curriculum and instruc-tional practices found in each type of program. Ad-ditionally, results of analyses examining the rela-tionships between program type and the gains thatpublic school children make in reading and math-ematics during the kindergarten year are presented.
The advantages and disadvantages of a longerschool day for kindergarten children have been dis-cussed widely and there has been a good deal ofresearch comparing full-day and half-day kinder-garten. This introduction begins with a brief over-view of the policy issues surrounding full-day kin-dergarten and highlights of findings from relatedresearch. A description of the ECLS-K data used inthis report is presented next, followed by a descrip-tion of the way in which the findings are organized.
Full-day and Half-dayKindergarten
Findings from the U.S. Census Bureau’s Cur-rent Population Survey show that in the early 1970sless than 20 percent of all kindergartners attendeda full-day program (figure 1). Full-day enrollmenthas been on a steady increase ever since. The ECLS-Kdata show that in the 1998–99 school year 56 per-cent of all kindergarten children attended a full-day program.
The increase in the prevalence of full-day kin-dergarten programs in the United States over thepast few decades has been attributed to various so-cial, economic and educational factors. Increases inthe number of single parent households and house-holds with both parents working are commonlycited as important factors contributing to the needfor full-day programs (e.g., Gullo 1990; Morrow,Strickland, and Woo 1998). Arranging child care
during the workday is less costly and less compli-cated for these families when the child is in schoolfor the whole day rather than half of the day. Addi-tionally, providing a full-day kindergarten programmay reduce the number of settings a child attendsduring the time his or her parents are at workthereby increasing the consistency of care for thechild. Another rationale in support of full-day kin-dergarten is that children who have spent some oftheir pre-kindergarten years in nursery school classesor child care arrangements (often full-day place-ments) are ready for the cognitive, social and physi-cal demands of a full-day of kindergarten (Gullo1990).
A main rationale for providing full-day kinder-garten is to increase the time available for learningkindergarten skills and for developing appropriatesocial skills necessary for school success, especiallyfor children “at risk” for school failure.6 Proponentsof full-day kindergarten emphasize the potentialeducational benefit—teachers have more time toget to know their children and individualize theirinstruction, and children have more time to acquirethe early academic skills taught in kindergarten(Morrow, Strickland, and Woo 1998). In somecases, the move to more full-day classes has beenmade to provide sufficient time for children to com-plete more rigorous kindergarten curricula (Shepardand Smith 1988).
School resources are considered when decisionsare being made about whether to provide full-dayor half-day kindergarten programs. While a singleteacher in one classroom can teach two half-day kin-dergarten classes of children, converting to full-dayclasses with similar class sizes requires two teachersand building space for two kindergarten classrooms.Limitations of these resources can influence a
6The term “at-risk” refers to children who belong to asocio-demographic group that, on average, performs loweron measures of academic achievement compared to othergroups. Black and Hispanic children, low-income children,and children from non-English speaking families are “at-risk” for school failure (e.g., U.S. Department of Education2001; West, Denton and Reaney 2001).
Chapter 1:

Full-day and Half-day Kindergarten in the United States2
district’s or school’s decision to provide full-day kin-dergarten. There is, however, a savings in transpor-tation costs by offering full-day programs since iteliminates the need for bussing in the middle ofthe day.
State legislation aimed to increase access to full-day kindergarten has been proposed and debatedin a number of statehouses over the past few years.In a review of state policies regarding full-day kin-dergarten, Galley (2002) found that 25 states andthe District of Columbia provide funds for full-daykindergarten programs in the districts that offer it.Eight states (Louisiana, Mississippi, Alabama, Geor-gia, North Carolina, South Carolina, West Virginia,and Hawaii) and the District of Columbia requiresome or all of their districts to provide full-day kin-dergarten (Galley 2002). Because of the higher costof full-day kindergarten programs, some local schooldistricts target resources for full-day programs inthose schools that serve neighborhoods with highconcentrations of low income or minority students.State and federal funding earmarked for “at-risk”students is often used to supplement local fundingfor full-day kindergarten teachers. A 1993 surveyof public school kindergarten teachers found thatthey were more likely to be teaching in a full-day
program than a half-day program if their class hada high concentration of minority children or if theirschool was located in a high-poverty area (Heavisideand Farris 1993).
As the prevalence of full-day kindergarten pro-grams has increased over the years there has beengrowing interest in the effect of full-day kindergar-ten on children’s academic achievement. The re-search generally, but not uniformly, suggests thatfull-day kindergarten programs compare favorablyto half-day programs in terms of children’s academicachievement (Fusaro 1997) and their developmentof social skills (Elicker and Mathur 1997). This hasbeen found to be true most notably for minoritychildren (Karweit 1989). The academic benefits ofa full-day program have also been shown to lastinto first grade (Cryan et al. 1992) and beyond(Gullo 2000).
The potential benefits of a longer kindergartenday can be attributed to the increased amount oftime children spend at school, but perhaps moreimportantly to the way in which the extra time isspent. Some researchers have suggested that longerschool days for kindergartners will not have apositive impact unless the time is spent in develop-mentally and individually appropriate learning
SOURCE: U.S. Department of Commerce, Bureau of the Census, October Current Population Surveys, 1970 to 1998.
Figure 1. Percent of kindergarten children enrolled in a full-day program, 1970 through1998
1970 1972 1974 1976 1978 1980 1982 1984 1986 1988 1990 1992 1994 1996 1998
0
20
40
60
80
100
Percent
Year
Half-day
Full-day

3Introduction
environments (e.g., Morrow, Strickland, and Woo1998). These authors recommended that full-daykindergarten programs take advantage of the longerday by providing child-centered, developmentallyappropriate activities and offering a balance of smallgroup, large group, and individual activities. Otherresearchers (e.g., Hirsch 1996) suggest a content-centered curriculum for this age group in order toprepare children academically. Class time shouldbe focused strategically on the specific academicskills appropriate to prepare children for the nexteducational step. A full-day program, from thisperspective, offers additional time to expose chil-dren to these skills and therefore has the potentialto maximize the benefits associated with this typeof instruction.
While there is evidence that full-day kinder-garten can have a positive influence on children’sschool success, there remains a need for studies thatfocus on how time is spent in full-day and half-dayclasses in order to better understand the potentialbenefit. There has not been an opportunity to com-pare differences in full-day and half-day kindergar-ten instructional practices and curriculum focus atthe national level until the ECLS-K. Chapter 4,section 2 of this report, is devoted to comparisonsof teacher reports of the frequency that a wide vari-ety of classroom activities and specific skills are cov-ered in public school full-day and half-day kinder-garten classes. Chapter 5 investigates associationsbetween the length of the kindergarten day in con-junction with other child and program characteris-tics and children’s cognitive outcomes.
Data SourceThis report contains findings from a national
study of kindergartners, their schools, classroom,teachers and families. In the fall of 1998, the EarlyChildhood Longitudinal Study, Kindergarten Classof 1998–99 (ECLS-K), sponsored by the U.S. De-partment of Education, National Center for Edu-cation Statistics (NCES), began following a nation-ally representative sample of about 22,000 kinder-
gartners. The ECLS-K includes nationally repre-sentative samples of schools offering kindergarten,kindergarten teachers, and kindergarten classrooms.
About 1,200 public and private schools offer-ing kindergarten programs were selected to partici-pate in the ECLS-K. The sample of schools includedschools offering kindergarten and some combina-tion of grades one to grade twelve. Early childhoodprograms that offer kindergartens in addition toprograms for preschoolers were also selected to par-ticipate. All the kindergarten teachers in thesampled schools were selected to participate. Dataabout the children, their families and their teach-ers were collected in the fall of 1998 and again inthe spring of 1999. Data about the schools werecollected from school administrators in the springof 1999. Details about the sample design and imple-mentation of the study can be found in theECLS-K Base-Year Public-Use Data File User’sManual (National Center for Education Statistics2001).
The tables on the following pages present thefinal sample sizes, population counts and nationalestimates of the percentage distributions of variousschool-level (table 1) and child-level (table 2) char-acteristics. These characteristics are reported for the1998–99 school year. About 72,000 U.S. schoolsoffer kindergarten. Sixty-five percent are publicschools, 9 percent are Catholic schools, and 25 per-cent are other types of private schools (table 1). Ofthe 3.9 million children enrolled, about 85 per-cent attend public school, 6 percent are in Catho-lic school, and 9 percent are in other private schools(table 2). Fifty-seven percent of these children areWhite, 17 percent are Black, 19 percent are His-panic and 3 percent are Asian (table 2). Table 3provides sample counts and population estimatesfor public school kindergarten classes. There areapproximately 178,000 public school kindergar-ten classes—24 percent of these classes have a mi-nority enrollment of more than 75 percent and 8percent enroll a majority of students who are lim-ited-English proficient (LEP).

Full-day and Half-day Kindergarten in the United States4
Table 1. Sample sizes, population counts, and percentage distribution of U.S. schools withkindergartens, by various characteristics: Spring 1999
National estimatesSamplePercentage
School characteristics Number Number distribution
All schools 866 72,000 100
School sectorPublic 630 47,000 65Catholic 105 7,000 10Other private 131 18,000 25
RegionNortheast 154 15,000 21Midwest 228 18,000 26South 286 22,000 30West 198 16,000 23
LocationLarge and mid-sized cities 385 27,000 37Suburbs/large town 286 27,000 37Small town and rural 195 19,000 26
School minority enrollmentLess than 10% 302 28,000 3910–24% 162 14,000 1925–49% 144 11,000 1650–75% 90 7,000 975% or more 152 11,000 16
Low-income concentration in public schools1
0–49% 348 26,000 5650% or more 280 21,000 44
1The school’s concentration of low-income children is based on a composite of free and reduced-priced lunch eligibility and participa-tion in a “school-wide” Title I program. This is calculated only for public schools.
NOTE: Sample detail may not sum to totals because of missing data. Population detail may not sum to totals because of rounding.Estimates only pertain to schools with a kindergarten program.
SOURCE: U.S. Department of Education, National Center for Education Statistics, Early Childhood Longitudinal Study, Kindergarten Class of1998–99; School Administrator Questionnaire, Base-Year Public-Use Data File.

5
Table 2. Sample sizes, population counts, and percentage distribution of U.S. kindergartners,by various school and child characteristics: Spring 1999
Introduction
PercentageChild characteristics Number Number distribution
All kindergartners 21,260 3,864,000 100
School sectorPublic 16,665 3,290,000 85Catholic 2,350 220,000 6Other private 2,245 353,000 9
RegionNortheast 3,915 695,000 18Midwest 5,263 893,000 23South 7,094 1,440,000 37West 4,988 835,000 22
LocationLarge and mid-sized cities 8,782 1,468,000 38Suburbs/large town 8,193 1,595,000 41Small town and rural 4,285 801,000 21
School minority enrollmentLess than 10% 6,374 1,121,000 2910–24% 3,604 696,000 1825–49% 3,374 645,000 1750–74% 2,293 491,000 1375% or more 5,062 889,000 23
Child’s sexMale 10,866 2,009,000 52Female 10,381 1,855,000 48
Mother’s educationLess than high school 2,825 618,000 16High school diploma or equivalent 5,993 1,198,000 31Some college, including vocational/technical 6,364 1,236,000 32
Bachelor’s degree or higher 4,628 811,000 21
Primary language spoken in homeNon-English 2,783 464,000 12English 17,224 3,400,000 88
Child’s race/ethnicityWhite, non-Hispanic 11,741 2,202,000 57Black, non-Hispanic 3,210 645,000 17Hispanic 3,762 734,000 19Asian 1,364 116,000 3Hawaiian Native/Pacific Islander 220 19,000 1American Indian/Alaska Native 379 66,000 2More than one race, non-Hispanic 514 81,000 2
Diagnosed disabilityYes 2,568 580,000 15No 15,500 3,284,000 85
First time kindergartnerYes 17,219 3,671,000 95No 850 193,000 5
See notes at the end of table.
National estimatesSample

Full-day and Half-day Kindergarten in the United States6
Table 2. Sample sizes, population counts, and percentage distribution of U.S. kindergartners,by various school and child characteristics: Spring 1999—Continued
PercentageChild characteristics Number Number distribution
Household incomeBelow poverty threshold 4,236 889,000 23At or above poverty threshold 15,905 2,975,000 77
Child’s age at kindergarten entry4 yrs, 8 mos — 4 yrs, 11 mos 1,969 336,000 95 yrs, 0 mos — 5 yrs, 3 mos 6,478 1,190,000 315 yrs, 4 mos — 5 yrs, 7 mos 6,488 1,194,000 315 yrs, 8 mos — 5 yrs, 11 mos 4,935 923,000 246 yrs, 0 mos — 6 yrs, 7 mos 1,215 220,000 6
NOTE: Sample detail may not sum to totals because of missing data. Population detail may not sum to totals because of rounding.
SOURCE: U.S. Department of Education, National Center for Education Statistics, Early Childhood Longitudinal Study, Kindergarten Class of1998–99; School Administrator Questionnaire and Parent Interviews, Base-Year Public-Use Data Files.
National estimatesSample

7Introduction
Table 3. Sample sizes, population counts, and percentage distribution of U.S. public kinder-garten classrooms, by various characteristics: Spring 1999
PercentageClassroom characteristics Number Number distribution
All public school kindergarten classes 3,352 178,000 100
Class sizeUp to 15 316 26,000 1516–20 1,294 78,000 4421–25 992 59,000 33More than 25 293 15,000 9
Class percent minority0–10% 675 52,000 2911–25% 461 32,000 1826–75% 811 52,000 2975% or more 829 43,000 24
Class percent limited English proficient0% 1,240 111,000 621–10% 386 27,000 1511-50% 455 29,000 1650% or more 279 14,000 8
Regular instructional aideYes 1,337 94,000 53No 1,200 84,000 47
Teacher’s educationBachelor’s 1,907 109,000 61Master’s 1,052 57,000 32Education specialist/doctoral degree 199 12,000 7
Teacher’s certificationEarly childhood education 1,773 96,000 54Elementary education 2,846 157,000 88
Certification typeFull certification 2,838 157,000 88Other certification 393 21,000 12
Average years teaching kindergartenLess than 3 879 46,000 263 to 9 1,173 64,000 3610–19 863 46,000 2620+ 380 21,000 12
NOTE: Sample detail may not sum to totals because of missing data. Population detail may not sum to totals because of rounding. Forteachers’ certification, detail sum to more than 100 because teachers can hold both types of certificates.
SOURCE: U.S. Department of Education, National Center for Education Statistics, Early Childhood Longitudinal Study, Kindergarten Class of1998–99; Kindergarten Teacher Questionnaires, Base-Year Public-Use Data File.
National estimatesSample
Full-day and Half-day Kindergarten in the United States8
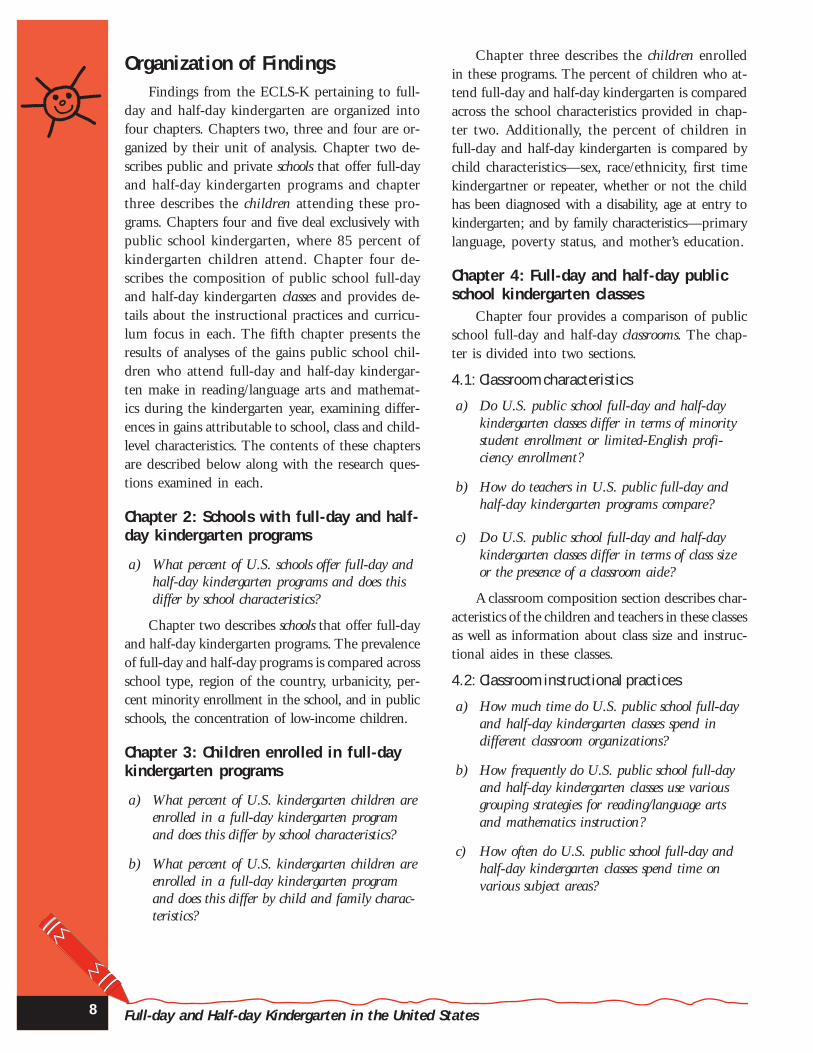
Organization of FindingsFindings from the ECLS-K pertaining to full-
day and half-day kindergarten are organized intofour chapters. Chapters two, three and four are or-ganized by their unit of analysis. Chapter two de-scribes public and private schools that offer full-dayand half-day kindergarten programs and chapterthree describes the children attending these pro-grams. Chapters four and five deal exclusively withpublic school kindergarten, where 85 percent ofkindergarten children attend. Chapter four de-scribes the composition of public school full-dayand half-day kindergarten classes and provides de-tails about the instructional practices and curricu-lum focus in each. The fifth chapter presents theresults of analyses of the gains public school chil-dren who attend full-day and half-day kindergar-ten make in reading/language arts and mathemat-ics during the kindergarten year, examining differ-ences in gains attributable to school, class and child-level characteristics. The contents of these chaptersare described below along with the research ques-tions examined in each.
Chapter 2: Schools with full-day and half-day kindergarten programs
a) What percent of U.S. schools offer full-day andhalf-day kindergarten programs and does thisdiffer by school characteristics?
Chapter two describes schools that offer full-dayand half-day kindergarten programs. The prevalenceof full-day and half-day programs is compared acrossschool type, region of the country, urbanicity, per-cent minority enrollment in the school, and in publicschools, the concentration of low-income children.
Chapter 3: Children enrolled in full-daykindergarten programs
a) What percent of U.S. kindergarten children areenrolled in a full-day kindergarten programand does this differ by school characteristics?
b) What percent of U.S. kindergarten children areenrolled in a full-day kindergarten programand does this differ by child and family charac-teristics?
Chapter three describes the children enrolledin these programs. The percent of children who at-tend full-day and half-day kindergarten is comparedacross the school characteristics provided in chap-ter two. Additionally, the percent of children infull-day and half-day kindergarten is compared bychild characteristics—sex, race/ethnicity, first timekindergartner or repeater, whether or not the childhas been diagnosed with a disability, age at entry tokindergarten; and by family characteristics—primarylanguage, poverty status, and mother’s education.
Chapter 4: Full-day and half-day publicschool kindergarten classes
Chapter four provides a comparison of publicschool full-day and half-day classrooms. The chap-ter is divided into two sections.
4.1: Classroom characteristics
a) Do U.S. public school full-day and half-daykindergarten classes differ in terms of minoritystudent enrollment or limited-English profi-ciency enrollment?
b) How do teachers in U.S. public full-day andhalf-day kindergarten programs compare?
c) Do U.S. public school full-day and half-daykindergarten classes differ in terms of class sizeor the presence of a classroom aide?
A classroom composition section describes char-acteristics of the children and teachers in these classesas well as information about class size and instruc-tional aides in these classes.
4.2: Classroom instructional practices
a) How much time do U.S. public school full-dayand half-day kindergarten classes spend indifferent classroom organizations?
b) How frequently do U.S. public school full-dayand half-day kindergarten classes use variousgrouping strategies for reading/language artsand mathematics instruction?
c) How often do U.S. public school full-day andhalf-day kindergarten classes spend time onvarious subject areas?

9
d) How often do U.S. public school full-day andhalf-day kindergarten classes spend time onspecific reading/language arts activities andskills?
e) How often do U.S. public school full-day andhalf-day kindergarten classes spend time onspecific mathematics activities and skills?
The second section in chapter four is about theinstructional practices used in full-day and half-day kindergarten classes. This section provides de-tails about how these classrooms are organized forinstruction and the grouping strategies employedby these teachers. This section also provides infor-mation about the amount of instructional time de-voted to various academic and arts subjects as wellas specific reading/language arts and mathematicsskills and activities.
Chapter 5: Cognitive gains of publicschool children in full-day and half-daykindergarten classes
a) Do public school children who attend full-daykindergarten make larger reading achievementgains than children who attend half-dayprograms?
b) Do public school children who attend full-daykindergarten make larger mathematics achieve-ment gains than children who attend half-day?
The fifth chapter presents the results of analy-ses of the gains public school children who attendfull-day and half-day kindergarten make in read-ing/language arts and in mathematics during thekindergarten year. Hierarchical analyses examine dif-ferences in gains between full-day and half-day kin-dergartners while accounting for other school, classand child-level characteristics that are examined inchapters 2–4.


11
Schools Offering Full-day andHalf-day Kindergarten Programs
7Estimates here and elsewhere in the report are not adjustedby other child, class, or school variables unless noted.8Standard errors for these estimates are 2.30, 2.38, and 1.03,respectively.
This chapter examines the characteristics of U.S.schools that offer full-day and half-day kindergartenprograms. Full-day and half-day status for each schoolis based on questionnaires completed by the kinder-garten teachers in the ECLS-K schools. Schools wereclassified into two non-mutually exclusive groups—those with at least one full-day class and those withat least one half-day class. Sixty-one percent of allU.S. schools with a kindergarten program offer atleast one full-day kindergarten class and 47 percentoffer at least one half-day class (table A1).7 Fifty-threepercent offer only full-day classes, 39 percent offeronly half-day classes and 7 percent offer at least onehalf-day and one full-day kindergarten class (not intables).8 The distribution of schools offering full-dayand half-day kindergarten programs is not uniformacross all school characteristics. The remainder of this
chapter examines whether schools offer full-day orhalf-day programs by school type (public, Catholicor other private), region (Northeast, Midwest, South,or West), location (large/mid-sized cities, large town/suburban, or small town/rural), and percent minor-ity enrollment.9 Additionally, for public schools, theprevalence of full-day and half-day programs is com-pared for schools with high and low concentrationsof students from low-income households. Figuresdisplaying these data are included in this chapter.Tables showing the percent of schools that offer full-day and half-day kindergarten programs by each ofthese school characteristics are found in appendix A(tables A1 and A2).10 A summary of these findings ispresented below. Differences noted in the text arestatistically significantly different (alpha =.05) andthe difference is at least 5 percentage points.
9Variables used in the analyses are defined in Appendix D.10The school weight, S2SAQW0 on the ECLS-K base-yearPublic-Use Data File, is used to calculate estimates in thischapter.
Chapter 2:

Full-day and Half-day Kindergarten in the United States12
What percent of U.S. schools offer full-day and half-day kindergartenprograms and does this differ by school characteristics?
! Sixty-seven percent of private schools offer a full-day kindergarten program compared to57 percent of public schools (table A2). A larger percent of Catholic schools offer full-daykindergarten (78 percent) compared to other private schools (63 percent) or to public schools(57 percent). Public schools are more likely to offer a half-day program (52 percent) comparedto Catholic schools (29 percent) or other private schools (40 percent) (figure 2).
! A larger percent of public schools in the South offer full-day kindergarten (84 percent)compared to public schools in other regions of the country (57 percent in the Midwest,38 percent in the West, and 37 percent in the Northeast) and a larger percent of publicschools in the Midwest offer full-day kindergarten compared to those in the Northeast(figure 3). Similar differences are not detected among private schools (table A2).
! Full-day kindergarten is more prevalent in public schools in cities (64 percent) and in smalltowns/rural areas (63 percent) compared with suburban/large town areas (46 percent) (figure4). Additionally, a larger percent of public schools in suburban/large town areas (62 percent)offer a half-day program compared to small town/rural areas public schools (43 percent).Apparent differences by location type are not significant for private schools (table A2).
! Full-day programs are more likely to be offered in schools with higher concentrations ofminority children (figure 5).
❖ More public schools with at least 75 percent minority enrollment offer full-day kindergar-ten (76 percent) compared to schools with less than 25 percent minority enrollment (48to 44 percent).
❖ Among private schools, those with the highest concentration of minority children (at least75 percent minority enrollment) are more likely to offer full-day kindergarten (93 percent)than schools with a minority enrollment of less than 10 percent (54 percent).
! Full-day programs are more likely to be offered in public schools where at least half of theenrollment is comprised of low-income children.11 Sixty-nine percent of public schools witha high concentration of low-income children offer full-day kindergarten compared to48 percent of schools with fewer low-income children (figure 6).
11A school’s concentration of low-income children is a composite variable that is created to account for the high level of missinginformation about free and reduced-priced lunch eligibility from the ECLS-K schools. This composite is not created for privateschools because the variables making up this composite are about programs primarily used by public schools. See the Methodol-ogy and Technical Notes (Appendix C) in this report for more details.

13Schools Offering Full-day and Half-day Kindergarten Programs
NOTE: The percent of schools offering full-day and half-day programs sums to more than 100 because some schools have both full-dayand half-day classes. Estimates only pertain to schools with a kindergarten program.
SOURCE: U.S. Department of Education, National Center for Education Statistics, Early Childhood Longitudinal Study, Kindergarten Class of1998–99; School Administrator Questionnaire and Kindergarten Teacher Questionnaires, Base-Year Public-Use Data Files.
Figure 2. Percent of U.S. schools that offer full-day and half-day kindergarten programs, byschool type: 1998–99
0
20
40
60
80
100
Percent
School type
Full-day
Half-day
5752
78
29
63
40
Public Catholic Other private
NOTE: The percent of schools offering full-day and half-day programs sums to more than 100 because some schools have both full-dayand half-day classes. Estimates only pertain to schools with a kindergarten program.
SOURCE: U.S. Department of Education, National Center for Education Statistics, Early Childhood Longitudinal Study, Kindergarten Class of1998–99; School Administrator Questionnaire and Kindergarten Teacher Questionnaires, Base-Year Public-Use Data Files.
Figure 3. Percent of U.S. public schools that offer full-day and half-day kindergartenprograms, by region: 1998–99
Full-day
Half-day
South Midwest West Northeast
84
22
57 56
38
69
37
73
0
20
40
60
80
100
Percent
Region

Full-day and Half-day Kindergarten in the United States14
NOTE: The percent of schools offering full-day and half-day programs sums to more than 100 because some schools have both full-dayand half-day classes. Estimates only pertain to schools with a kindergarten program.
SOURCE: U.S. Department of Education, National Center for Education Statistics, Early Childhood Longitudinal Study, Kindergarten Class of1998–99; School Administrator Questionnaire and Kindergarten Teacher Questionnaires, Base-Year Public-Use Data Files.
Figure 4. Percent of U.S. public schools that offer full-day and half-day kindergartenprograms, by location: 1998–99
64
49
63
4346
62
0
20
40
60
80
100
Percent
Location
Full-day
Half-day
Cities Small town/rural Suburbs/large towns
1The categories 25–49 percent and 50–74 percent were collapsed for private schools. Reporting standards were not met for separateestimates.
NOTE: The percent of schools offering full-day and half-day programs sums to more than 100 because some schools have both full-dayand half-day classes. Estimates only pertain to schools with a kindergarten program. All children who are not identified as White, non-Hispanic are classified as minority children.
SOURCE: U.S. Department of Education, National Center for Education Statistics, Early Childhood Longitudinal Study, Kindergarten Class of1998–99; School Administrator Questionnaire and Kindergarten Teacher Questionnaires, Base-Year Public-Use Data Files.
Figure 5. Percent of U.S. schools that offer full-day and half-day kindergarten programs, bypercent minority enrollment and school type: 1998–99
<10 10–24 25–49 50–74 75+ <10 10–24 25–74 75+
48
58
44
6763
48
69
42
76
32
5449
74
30
75
27
93
13
0
20
40
60
80
100
Percent
Public Private
Full-day
Half-day
Percent minority enrollment by school type
1

15Schools Offering Full-day and Half-day Kindergarten Programs
NOTE: The percent of schools offering full-day and half-day programs sums to more than 100 because some schools have both full-dayand half-day classes. Estimates only pertain to schools with a kindergarten program. A school’s concentration of low-income children isbased on the percent of its students who are eligible for free or reduced-priced lunch, and in the case of missing data, the school’sparticipation in a “school-wide” Title I program.
SOURCE: U.S. Department of Education, National Center for Education Statistics, Early Childhood Longitudinal Study, Kindergarten Class of1998–99; School Administrator Questionnaire and Kindergarten Teacher Questionnaires, Base-Year Public-Use Data Files.
Figure 6. Percent of U.S. public schools that offer full-day and half-day kindergartenprograms, by low-income concentration: 1998–99
0
20
40
60
80
100
Percent
Concentration of low-income students
Full-day
Half-day
0–49% 50% or more
48
61
69
41


17
Children Enrolled in Full-day and Half-day Kindergarten Programs
While the previous chapter examined the per-cent of schools that offer full-day and half-day kin-dergarten programs, this chapter examines enroll-ment in full-day and half-day kindergarten at thechild level. This chapter describes the characteristicsof kindergarten children enrolled in full-day and half-day programs. Because each kindergartner is enrolledin either a full-day or a half-day program, estimatesare presented for children in full-day programs. Es-timates for half-day enrollment can be derived bysubtracting the full-day estimates from 100.Children’s full-day or half-day status is determinedfrom questionnaires completed by their teachers.Characteristics of the children and their families arecollected during interviews with their parents/guard-ians.
Overall, 56 percent of kindergarten children at-tend a full-day program and 44 percent attend a half-day program (table A3). This chapter includes two
sets of estimates. The first set of estimates comparesthe percent of children in a full-day program by thesame school characteristics found in the previouschapter, although the estimates are at the child level12
rather than at the school level (table A3). The sec-ond set of estimates compares the percent of chil-dren in a full-day program by child and family char-acteristics (table A4). Thus, the percent of childrenin full-day programs is compared by sex, race/ethnicity, whether or not the child is attending kin-dergarten for the first time or repeating kindergar-ten, whether or not the child has been diagnosedwith a disability, and age of entry to kindergarten.Comparisons are also made by mother’s education,primary home language, and household poverty sta-tus.13 A summary of these findings is presented be-low. Differences noted in the text are statistically sig-nificantly different (alpha =.05), and the differenceis at least 5 percentage points.
12The child weight, C2CW0 on the ECLS-K Base-YearPublic-Use Data File, is used to calculate the estimates inthis chapter.13Variables used in the analyses are defined in Appendix D.
Chapter 3:

Full-day and Half-day Kindergarten in the United States18
What percent of U.S. kindergarten children are enrolled in a full-daykindergarten program and does this differ by school characteristics?
School characteristics
! Fifty-four percent of public school kindergartners attend a full-day program (table A3) and 70percent of all private school kindergartners attend a full-day program (not in tables).14 A largerpercent of kindergartners in Catholic schools attend a full-day program (77 percent) comparedto those in public schools (54 percent) (figure 7).
! A larger percent of kindergarten children in the South attend a full-day program (82 percent)compared with children in other regions of the country (48 in the Northeast, 47 percent inthe Midwest, and 31 percent in the West) (table A3).
❖ Similar regional differences exist for public school kindergartners. Eighty-three percent ofthese children in the South attend a full-day program compared to 41 percent in theNortheast, 45 percent in the Midwest and 23 percent in the West (figure 8).
❖ While full-day enrollment is more prevalent in Catholic schools overall, a larger percent ofCatholic school kindergartners in the South attend a full-day program (93 percent)compared to 52 percent in the West (figure 8).
❖ A different regional pattern is found for other types of private schools. Kindergartenchildren in the West and South are more likely to attend a full-day program (79 and 70percent, respectively) compared to the Midwest (38 percent) (figure 8). Among kindergar-ten children in the West, the highest percent of full-day enrollment is for children fromthese other private schools (79 percent).
! Public school kindergarten children in suburban and large town schools are less likely toattend a full-day program (45 percent) compared with children who attend schools in largeand mid-sized cities (59 percent) or small towns and rural areas (65 percent) (table A3).
14The standard error for this estimate is 3.09.

19Children Enrolled in Full-day and Half-day Kindergarten Programs
Figure 7. Percent of U.S. kindergarten children enrolled in full-day and half-day programs, byschool type: 1998–99
SOURCE: U.S. Department of Education, National Center for Education Statistics, Early Childhood Longitudinal Study, Kindergarten Class of1998–99; School Administrator Questionnaire and Kindergarten Teacher Questionnaires, Base-Year Public-Use Data Files.
0
20
40
60
80
100
Percent
School type
Public Catholic Other private
Full-day
Half-day
54
77
46
2335
6577
54
Figure 8. Percent of U.S. kindergarten children enrolled in a full-day program, by region andschool type: 1998–99
SOURCE: U.S. Department of Education, National Center for Education Statistics, Early Childhood Longitudinal Study, Kindergarten Class of1998–99; School Administrator Questionnaire and Kindergarten Teacher Questionnaires, Base-Year Public-Use Data Files.
Northeast
Midwest
South
West
4145
83
23
81
71
93
52
71
38
70
79
0
20
40
60
80
100
Percent
School type
Public Catholic Other private

Full-day and Half-day Kindergarten in the United States20
What percent of U.S. kindergarten children are enrolled in a full-daykindergarten program and does this differ by child and familycharacteristics?
Race/ethnicity
! The percent of kindergartners enrolled in full-day kindergarten differs by race/ethnicity.Overall, 80 percent of Black children attend a full-day program—a larger percent than White(52 percent), Hispanic (49 percent), Asian (46 percent), or multiracial children (46 percent).Additionally, American Indian and Alaska Native kindergarten children are more often in afull-day program (77 percent) compared to Hispanic, Asian and multiracial children (49, 46,and 46 percent, respectively) (figure 9) (table A4).
! Figure 10 contains the full-day enrollment for the four largest racial/ethnicity groups sepa-rately for public and private schools. A larger percent of Black students enrolled in publicschools attend a full-day program (79 percent) compared to public school White (49 percent),Hispanic (46 percent), or Asian (40 percent) kindergartners. The percent of Black kindergar-ten children enrolled in a full-day program is larger than it is for White children for bothCatholic school kindergartners (96 vs. 74 percent) and other private schools kindergartners(91 vs. 59 percent).
SOURCE: U.S. Department of Education, National Center for Education Statistics, Early Childhood Longitudinal Study, Kindergarten Class of1998–99; School Administrator Questionnaire, Kindergarten Teacher Questionnaires, and Parent Interviews, Base-Year Public-Use DataFiles.
Figure 9. Percent of U.S. kindergarten children enrolled in a full-day program, by race/ethnicity: 1998–99
0
20
40
60
80
100
Percent
Race/ethnicity
White, non Hispanic
52
Black, non-Hispanic
80
Hispanic
49
Asian
46
Hawaiian Native/ Pacific Islander
73
American Indian/ Alaska Native
77
More than one race,
non-Hispanic
46

21
Poverty status and home language
! Overall, a larger percent of kindergartners from English speaking homes attend a full-dayprogram (57 percent) compared with those from non-English speaking homes (48 percent)(table A4). This relationship is significant for public school kindergartners (55 vs. 45 percent)(figure 11). Apparent differences for Catholic and other private school children are not statisti-cally significant possibly due to the small sample sizes and relatively large standard errorsassociated with estimates for non-English speaking private school children.
! Overall, 63 percent of kindergarten children living below the poverty threshold are enrolled ina full-day program compared with 55 percent that come from households at or above thepoverty line (table A4). Again, this relationship exists for children in public schools (62 per-cent vs. 51 percent) (figure 12). In Catholic schools the observed difference is less that the5 percentage point criterion for significance, and the apparent difference in other privateschools is not statistically significant possibly due to the small sample sizes and relatively largestandard errors associated with estimates for private school children living below the povertythreshold.
! While public school kindergarten full-day enrollment is more prevalent among children livingbelow as compared to those living at or above the poverty threshold, this relationship holds forpublic school kindergarten children from English speaking homes, but not for children fromhomes where English is not the primary language. Among children from English speakinghomes, 68 percent of the children in poverty are in a full-day class compared to 52 percent forthose not in poverty. Among children from homes where English is not the primary language,the observed difference is less than the 5 percentage point criterion for significance (figure 13).
Children Enrolled in Full-day and Half-day Kindergarten Programs
Figure 10. Percent of U.S. kindergarten children enrolled in a full-day program, by race/ethnicity and school type: 1998–99
SOURCE: U.S. Department of Education, National Center for Education Statistics, Early Childhood Longitudinal Study, Kindergarten Class of1998–99; School Administrator Questionnaire, Kindergarten Teacher Questionnaires, and Parent Interviews, Base-Year Public-Use Data Files.
0
20
40
60
80
100
Percent
School type
Public Catholic Other private
49
79
4640
74
96
79
71
59
91
76 75
White, non-Hispanic
Black, non-Hispanic
Hispanic
Asian

Full-day and Half-day Kindergarten in the United States22
Figure 11. Percent of U.S. kindergarten children enrolled in a full-day program, by primaryhome language and school type: 1998–99
SOURCE: U.S. Department of Education, National Center for Education Statistics, Early Childhood Longitudinal Study, Kindergarten Class of1998–99; School Administrator Questionnaire, Kindergarten Teacher Questionnaires, and Parent Interviews, Base-Year Public-Use Data Files.
0
20
40
60
80
100
Percent
School type
Public Catholic Other private
Non-English
English
45
55
8276 78
64
Figure 12. Percent of U.S. kindergarten children enrolled in a full-day program, by povertystatus and school type: 1998–99
NOTE: Poverty status is determined by comparing the child’s household income to the national poverty threshold.
SOURCE: U.S. Department of Education, National Center for Education Statistics, Early Childhood Longitudinal Study, Kindergarten Class of1998–99; School Administrator Questionnaire, Kindergarten Teacher Questionnaires, and Parent Interviews, Base-Year Public-Use Data Files.
0
20
40
60
80
100
Percent
School type
Public Catholic Other private
Below poverty threshold
At or above poverty threshold
62
51
8076 78
65

23Children Enrolled in Full-day and Half-day Kindergarten Programs
Figure 13. Percent of public school kindergarten children enrolled in a full-day program, bypoverty status and primary home language: 1998–99
NOTE: Poverty status is determined by comparing the child’s household income to the national poverty threshold.
SOURCE: U.S. Department of Education, National Center for Education Statistics, Early Childhood Longitudinal Study, Kindergarten Class of1998–99; School Administrator Questionnaire, Kindergarten Teacher Questionnaires, and Parent Interviews, Base-Year Public-Use DataFiles.
0
20
40
60
80
100
Percent
Home language
Non-English English
Below poverty threshold
At or above poverty threshold
4346
68
52


25
Full-day and Half-day Public SchoolKindergarten Classes
Eighty-five percent of kindergartners in theUnited States attend public school. In order to de-scribe the characteristics of the classrooms that thesechildren attend, this chapter looks specifically at kin-dergarten classes in U.S. public schools. It describesand compares various classroom characteristics andinstructional practices for full-day and half-day publicschool kindergarten classes. The unit of analysis isthe kindergarten class; morning and afternoon kin-dergarten classes that are taught by the same teacherare represented separately.15 While 60 percent ofpublic school kindergarten teachers in 1998–99 teacha full-day class (Germino-Hausken, Walston, andRathbun, 2003), 51 percent of public school kin-dergarten classes meet for a full day and 49 percentmeet for a half-day.16
This chapter is divided into two sections. Sec-tion 4.1 describes the composition and structure offull-day and half-day public school kindergartenclasses. The compositions of full-day and half-dayclasses are compared in terms of minority enrollmentand percent of the class that is limited-English pro-ficient (LEP). This section also presents a descrip-tion of the characteristics and qualifications of theteachers of full-day and half-day classes. Addition-ally, full-day and half-day kindergarten classes arecompared in terms of class size and whether or notthe teacher has an instructional aide. Tables showingthe percent of full-day and half-day public kinder-garten classes by each of these characteristics arefound in appendix A (tables A6, A7 and A8).
Section 4.2 looks at how children in public schoolfull-day and half-day kindergarten classrooms spend
time during their school day. It describes a wide rangeof classroom instructional practices, including: howchildren are organized for instruction, the groupingstrategies teachers use for reading/language arts andmathematics instruction, the frequency that varioussubject areas are taught and the frequency withwhich children in these classes are engaged in spe-cific activities and work on specific skills in the areasof reading/language arts and mathematics. Teachersresponding to a self-administered questionnaire pro-vided information on the class characteristics de-scribed in this chapter. The complete set of tablesfor section 4.2 is found in Appendix A (tables A10through A25). Differences between half-day and full-day kindergartens noted in the text are statisticallysignificantly different (alpha =.05), and the differ-ence is at least 5 percentage points.
4.1 Composition and Structure ofPublic Kindergarten Classes
Minority and LEP enrollmentAs described in chapter two of this report, pub-
lic schools with high concentrations of minority chil-dren are more likely to offer full-day programs com-pared with other schools. Here, class-level minorityenrollment information is compared for full-day andhalf-day classes. Additionally, the percent of childrenin these classes who are limited-English proficientare compared for full-day and half-day classes.
15The teacher weight, B2TWO on the ECLS-K Base-YearPublic-Use Data File, is used to calculate estimates presentedin this chapter.16Sixty percent of kindergarten teachers have a full-day class,24 percent have one half-day class, and 16 percent havetwo half-day classes (morning and afternoon). The percentof kindergarten classes that are full-day is equal to(60÷(60+24+16+16))/100 or 51 percent.
Chapter 4:

Full-day and Half-day Kindergarten in the United States26
Do U.S. public school full-day and half-day kindergarten classes differin terms of minority student enrollment or limited-English proficiencyenrollment?
! The average percent minority enrollment is higher in public school full-day kindergartenclasses (46 percent) than in half-day classes (35 percent) (not in tables).17
! Full-day classes are more likely to have a high minority enrollment. Thirty percent of full-dayclasses have more than 75 percent minority enrollment compared with 19 percent of half-dayclasses (figure 14).
! The same pattern in not evident for limited-English proficient students. On average, 9percent of children in full-day classes and 13 percent of children in half-day classes are LEP(not in tables).18 The difference between the percent of full-day compared to half-day classeswith more than 50 percent of students limited-English proficient is less than the 5 percentcriterion for significance (6 vs. 10 percent, respectively) (table A6).
17Standard errors for these estimates are 2.94 and 2.04, respectively.18This is not a statistically significant difference; standard errors for these estimates are 2.16 and 1.71, respectively.
Figure 14. Percentage distribution of minority enrollment in U.S. public kindergarten classes,by program type: 1998–99
NOTE: Detail may not sum to 100 because of rounding. All children who are not identified as White, non-Hispanic are classified asminority children.
SOURCE: U.S. Department of Education, National Center for Education Statistics, Early Childhood Longitudinal Study, Kindergarten Class of1998–99; Kindergarten Teacher Questionnaires, Base-Year Public-Use Data File.
Full-day
Half-day
24
34
1720
30 28 30
19
0
20
40
60
80
100
Percent
Percent minority enrollment
0–10% 11–25% 26–75% More than 75%

27
How do teachers in U.S. public full-day and half-day kindergartenprograms compare?! The majority of full-day and half-day classes are taught by White teachers, but a smaller
percent of full-day classes are taught by White teachers (80 percent) compared with half-dayclasses (87 percent). A larger percent of full-day classes are taught by Black teachers (10percent) compared with half-day classes (2 percent). Seven percent of both full-day and half-day classes are taught by Hispanic teachers and 3 percent of both types of classes are taught byteachers of other racial backgrounds (figure 15).
! A majority of both full-day and half-day kindergarten classes are taught by teachers whosehighest level of education is a Bachelor’s degree (62 and 60 percent, respectively). At each levelof education the observed difference between the percent of full-day compared to half-dayclasses is less than the 5 percentage point difference established for substantive significance(figure 16). Thirty-one percent of full-day classes and 33 percent of half-day classes are taughtby teachers whose highest degree is a Master’s and 7 percent of both full-day and half-dayclasses are taught by teachers with a doctorate or educational specialist degree.20
! A larger percent of full-day kindergarten classes are taught by teachers with an early childhoodeducation certificate (61 percent) compared with half-day classes (47 percent). A majority ofboth full-day and half-day classes are taught by teachers with an elementary education certifi-cate (85 and 90 percent, respectively) (figure 17).
! Both full-day and half-day kindergarten classes have teachers with an average of 9 yearsexperience teaching kindergarten (not in tables).21 About 26 percent of both full-day and half-day classes have teachers with less than 3 years kindergarten teaching experience and about 12percent of both types of classes have teachers with 20 or more years kindergarten teachingexperience. There is a significant difference in the percent of full-day classes (23 percent) andhalf-day classes (29 percent) that have a teacher with between 10 and 19 years of kindergartenteaching experience.
! Approximately 9 out of 10 classes of both half-day and full-day classes are taught by teacherswith full certification (table A7).
19The ECLS-K does not include teachers with probationary certificates in its estimate of teachers with full certification becauseprobationary certificates were grouped along with temporary and emergency certification on the ECLS-K questionnaire.Published reports based on the 1999–2000 Schools and Staffing Survey (e.g., Seastrom et al. 2002) have treated teachers withprobationary certificates as certified. Data from the 1999–2000 SASS indicate that 3 percent of public school kindergartenteachers in 1999–2000 who were certified had a probationary certificate.20The size of the standard errors of the estimates for BA and MA yield an inconclusive test for both differences and similarities.21Standard errors for these estimates are 0.25 and 0.29, respectively.
Teacher characteristicsThis section looks at the characteristics of teach-
ers in full-day and half-day public school kindergar-ten classes. The race/ethnicity distribution of half-day and full-day kindergarten classroom teachers ispresented as well as the percent of these teachers whohave various levels of education, areas of certification(an early childhood education and/or an elementaryeducation certificate), and years of experience teach-ing kindergarten.
Full-day and Half-day Public School Kindergarten Classes
The certification of the teachers is also com-pared for full-day and half-day classes. Certifica-tion by the state in which one teaches typically in-cludes requirements for a bachelor’s degree, specialcourses, clinical experiences, and often some typeof formal testing. Over 80 percent of public schoolsin the United States require teaching certificates ofteacher applicants (Gruber et al. 2002). Teacherswho report having a temporary, probational, provi-sional, or emergency certificate, or those who re-port having an alternative certification program aregrouped into the category “other” for this analysis.19

Full-day and Half-day Kindergarten in the United States28
Figure 15. Percentage distribution of U.S. public kindergarten classes taught by teachers ofdifferent race/ethnicities, by program type: 1998–99
NOTE: Detail may not sum to totals because of rounding.
SOURCE: U.S. Department of Education, National Center for Education Statistics, Early Childhood Longitudinal Study, Kindergarten Class of1998–99; Kindergarten Teacher Questionnaires, Base-Year Public-Use Data File.
Full-day
Half-day
White, non-Hispanic Black, non-Hispanic Hispanic Other/multiracial
80
87
10
27 7
3 30
20
40
60
80
100
Percent
Teacher’s race/ethnicity
NOTE: Less than 0.5 percent of public school kindergarten teachers have less than a bachelor’s degree as their highest level of education.
SOURCE: U.S. Department of Education, National Center for Education Statistics, Early Childhood Longitudinal Study, Kindergarten Class of1998–99; Kindergarten Teacher Questionnaires, Base-Year Public-Use Data File.
Figure 16. Percentage distribution of U.S. public kindergarten classes taught by teachers withvarious levels of education, by program type: 1998–99
0
20
40
60
80
100
Percent
Teacher’s education level
Full-day
Half-day
Bachelor's Master's Doctorate/Specialist
62 60
31 33
7 7

29
Class size and classroom aidesThis section compares the class sizes and the per-
cent of classes with instructional aides for full-dayand half-day public school kindergarten programs.Efforts to provide kindergarten programs that givechildren an optimal environment for academic growthinclude decreasing class size and providing classroominstructional aides. These strategies can have substan-tial costs for schools but are aimed at decreasing theadult-student ratio in the class and thereby increas-ing the time and personal attention available for eachchild in the kindergarten classroom.
Not all authors conclude that the current classsize studies necessarily show a positive effect for chil-dren in smaller classes (Hanushek 1999; Finn andAchilles 1999). In general, however, the literatureprovides evidence that children in smaller classes of-ten make greater academic gains compared to thosein larger classes (Grissmer 1999; Nyhan and Alkadry1999; Achilles, Harmon, and Egelson 1995). Thereis additional evidence that smaller class sizes in earlygrades lead to achievement gains that can last for years(Finn, Gerber, Achilles, and Boyd-Zaharias 2001;Molnar et al. 1999; Nye, Hedges, andKonstantopoulos, 1999).
Instructional aides are used in some classroomsto assist teachers with a variety of instructional ac-
tivities and lower the student-adult ratio in the class-room. Teacher aides can offer support to teachers inthe classroom by working directly with children insmall groups or individually. However, the pres-ence of classroom aides has been shown to have onlya very small effect on reading achievement in theprimary grades (Gerber et al. 2001). Gerber et al.argue that having an aide in the classroom is notnearly as effective at improving achievement as re-ducing class size.
In the ECLS-K, kindergarten teachers are askedto report the number of children in each of theirclasses and to provide information about three typesof paid classroom aides—regular, special educationand English as a second language (ESL) aides. In-formation about the aides in the class was collectedin the spring of 1999. For this report, a class isidentified as having one of these three types of aidesif the aide is paid (as opposed to a volunteer), worksdirectly with children on instructional tasks andspends at least an hour per day in the classroom.22
Full-day and Half-day Public School Kindergarten Classes
Figure 17. Percent of U.S. kindergarten classes taught by teachers with different areas ofcertification, by program type: 1998–99
Note: Detail sum to more than 100 because teachers can hold both types of certificates.
SOURCE: U.S. Department of Education, National Center for Education Statistics, Early Childhood Longitudinal Study, Kindergarten Class of1998–99; Kindergarten Teacher Questionnaires, Base-Year Public-Use Data File.
0
20
40
60
80
100
Percent
Teacher's area of certification
Early Childhood Education Elementary Education
Full-day
Half-day
61
47
8590
22While the focus here is on classes where a paid aide worksdirectly with the children on instructional tasks, the ECLS-Kdatabase also includes information about the time paid aidesspend on non-instructional work. The ECLS-K data also includeinformation about paid aide’s primary language, Englishproficiency, highest level of education and their certification.
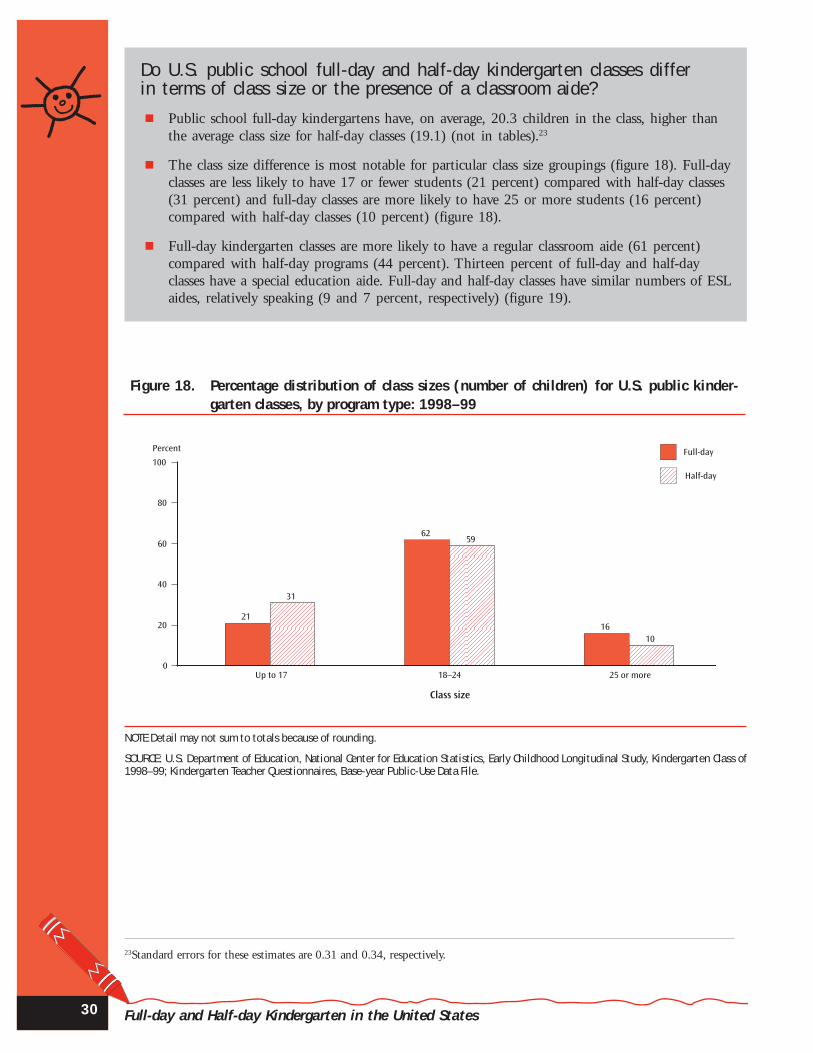
Full-day and Half-day Kindergarten in the United States30
Do U.S. public school full-day and half-day kindergarten classes differin terms of class size or the presence of a classroom aide?
! Public school full-day kindergartens have, on average, 20.3 children in the class, higher thanthe average class size for half-day classes (19.1) (not in tables).23
! The class size difference is most notable for particular class size groupings (figure 18). Full-dayclasses are less likely to have 17 or fewer students (21 percent) compared with half-day classes(31 percent) and full-day classes are more likely to have 25 or more students (16 percent)compared with half-day classes (10 percent) (figure 18).
! Full-day kindergarten classes are more likely to have a regular classroom aide (61 percent)compared with half-day programs (44 percent). Thirteen percent of full-day and half-dayclasses have a special education aide. Full-day and half-day classes have similar numbers of ESLaides, relatively speaking (9 and 7 percent, respectively) (figure 19).
23Standard errors for these estimates are 0.31 and 0.34, respectively.
Figure 18. Percentage distribution of class sizes (number of children) for U.S. public kinder-garten classes, by program type: 1998–99
NOTE Detail may not sum to totals because of rounding.
SOURCE: U.S. Department of Education, National Center for Education Statistics, Early Childhood Longitudinal Study, Kindergarten Class of1998–99; Kindergarten Teacher Questionnaires, Base-year Public-Use Data File.
0
20
40
60
80
100
Percent Full-day
Half-day
Up to 17 18–24 25 or more
21
31
6259
1610
Class size

31Full-day and Half-day Public School Kindergarten Classes
4.2 Instructional Practices andCurricular Focus
This section describes how children in full-dayand half-day kindergarten classes spend time dur-ing their school day. Children in full-day kinder-garten have more time at school each day than thosein half-day classes so an obvious and importantquestion is, “What are full-day kindergarten chil-dren doing during this ‘extra’ time?” The potentialbenefits of a longer kindergarten day can be attrib-uted to the overall increase in the amount of timechildren spend at school, but more importantly tothe way in which the additional time is used. Howteachers organize their classes for instruction andthe grouping strategies they use are compared toinvestigate whether full-day and half-day classesdiffer in terms of how the children in these classesare taught. The frequency with which these classesspend time working on specific instructional ac-tivities and skills helps describe the difference be-tween full-day and half-day classes in terms of cur-riculum and instructional goals. The instructionalpractices and curricular focus items are based onteachers’ report. As a result, there may be possibleresponse bias due to social desirability.
Classroom organizationIn the spring of the kindergarten year, teachers
reported the amount of time per day their studentsspend in different types of teacher-directed activi-ties—whole class, small group and individual—andthe amount of time per day students spend in child-selected activities. Whole class teacher-directed ac-tivities may involve active movement, discussion orlistening activities; what distinguishes this type ofclassroom organization from the others is that theteacher initiates and leads the activity and the en-tire class is involved simultaneously. Small groupand individual teacher-directed activities are alsostructured and led by the teacher and in some casesmay occur concurrently with child-selected activi-ties. Child-selected activities in kindergarten includelearning centers that the children freely choose orother sorts of “free” time activities. The time spentin these different arrangements is compared bothin terms of actual number of minutes and in termsof the percent of the available class time that is de-voted to these activities.
Figure 19. Percent of U.S. public kindergarten classes with a classroom aide, by type of aideand program type: Spring 1999
NOTE: A class is classified as having an aide if the aide spends at least 1 hour per day in the class working directly with students.
SOURCE: U.S. Department of Education, National Center for Education Statistics, Early Childhood Longitudinal Study, Kindergarten Class of1998–99; Spring 1999 Kindergarten Teacher Questionnaire, Base-year Public-Use Data File.
0
20
40
60
80
100
Percent Full-day
Half-day
Regular instructional aide Special ed. instructional aide English as a second language (ESL) instructional aide
61
44
13 139 7
Type of aide

Full-day and Half-day Kindergarten in the United States32
How much time do U.S. public school full-day and half-day kindergartenclasses spend in different classroom organizations?
! On average, full-day kindergarten classes spend almost 4 hours per day in some type ofteacher-directed activity—1 hour and 51 minutes in whole class, 1 hour and 20 minutes insmall group, and 43 minutes in teacher-directed individual activities. Full-day classes spendalmost another hour (57 minutes) on child-selected activities (figure 20).
! Half-day kindergarten classes typically spend about 2 1/2 hours per day in some type ofteacher directed activity—1 hour and 13 minutes in whole class, 50 minutes in small group,and 25 minutes in teacher-directed individual activities. They spend, on average, another 32minutes on child-selected activities (figure 20).
! While full-day classes spend more time than half-day classes organized in each of the teacher-directed or the child-selected activities, the percent of their total time in each type of activity issimilar between full-day and half-day classes (figure 21).
Figure 20. Average minutes per day U.S. public kindergarten classes spend in various class-room organizations, by program type: Spring 1999
SOURCE: U.S. Department of Education, National Center for Education Statistics, Early Childhood Longitudinal Study, Kindergarten Class of1998–99; Spring 1999 Kindergarten Teacher Questionnaire, Base-year Public-Use Data File.
Average minutes per day
Classroom organization
Full-day
Half-day
Whole class Small group Individual Child-selected0
20
40
60
80
100
120111
7380
5043
25
57
32

33Full-day and Half-day Public School Kindergarten Classes
Figure 21. Average percent of class time U.S. public kindergarten classes spend in variousclassroom organizations, by program type: Spring 1999
SOURCE: U.S. Department of Education, National Center for Education Statistics, Early Childhood Longitudinal Study, Kindergarten Class of1998–99; Spring 1999 Kindergarten Teacher Questionnaire, Base-year Public-Use Data File.
Full-day
Half-day
Whole class Small group Individual Child-selected
38 40
27 28
15 1420 18
0
20
40
60
80
100
Percent
Classroom organization

Full-day and Half-day Kindergarten in the United States34
How frequently do U.S. public school full-day and half-day kindergartenclasses use various grouping strategies for reading/language arts andmathematics instruction?
! Mixed-level grouping is used daily for reading instruction in a higher percent of full-dayclasses (48 percent) compared to half-day classes (42 percent). Mixed-level grouping is usedmore often (i.e., on a daily basis) than achievement groups or peer tutoring for readinginstruction in both full-day (48 vs. 26 and 23 percent, respectively) and half-day classes(42 vs. 14 and 15 percent, respectively) (figure 22).
! Mixed-level grouping is also the most common daily grouping method for mathematicsinstruction in full-day and in half-day classes, but is used every day more often in full-dayclasses (35 vs. 29 percent).
! While achievement grouping and peer tutoring are less commonly used in reading andmathematics, a larger percent of full-day classes than half-day classes use these strategies eitheron a daily basis or on at least a weekly basis compared to half-day classes. Teachers in full-dayclasses are more likely than half-day classes to use achievement groups at least once a week forreading instruction (62 percent vs. 50 percent) and for mathematics instruction (42 percentvs. 32 percent).
Grouping strategiesDuring the time of day when children are
grouped together for instructional activities, thereare various strategies teachers use for creating thesegroupings. “Mixed-level groups” consist of childrenof various ability levels working together and“achievement groups” are formed so that childrenof similar ability levels in a particular subject areawork together on skills best suited to their currentskill level. “Peer tutoring” is a strategy of groupingchildren with the specific goal of having higher-level students assist lower-level students with alearning activity. The frequency that teachers usethese various grouping strategies for activities inreading/language arts and mathematics instruction
are compared for full-day and half-day classes. Here,and throughout the rest of this chapter, the fre-quencies reported by teachers are collapsed into threecategories: 1) daily, 2) weekly (“two or three times aweek” and “once a week”), and 3) less than weekly(“once a month,” “two or three times a month” and“never”). At times, percents for “daily” and “weekly”are added together to report a percent for “at leastweekly”.24
24These percents are obtained by adding the non-roundedpercents so they may differ slightly from what would beobtained by adding the rounded numbers found in thefigures and tables.

35Full-day and Half-day Public School Kindergarten Classes
Figure 22. Percentage distribution of the frequency that U.S. public kindergarten classes usevarious grouping strategies for reading and mathematics instruction, by programtype: Spring 1999
NOTE: Detail may not sum to totals because of rounding.
SOURCE: U.S. Department of Education, National Center for Education Statistics, Early Childhood Longitudinal Study, Kindergarten Class of1998–99; Spring 1999 Kindergarten Teacher Questionnaire, Base-year Public-Use Data File.
23 38 39
15 27 58
35 39 26
29 41 30
14 28 58
25 68
18 36 46
25 65
7
9
48 30 22
42 33 25
26 35 38
14 36 50
Reading
Half-day
Full-day
Peer tutoring
Half-day
Full-day
Achievement groups
Half-day
Full-day
Work in mixed level groups
Mathematics
Half-day
Full-day
Peer tutoring
Half-day
Full-day
Achievement groups
Half-day
Full-day
Work in mixed level groups
Percent
0 20 40 60 80 100
Daily
Weekly
Less than weekly
Full-day and Half-day Kindergarten in the United States36
How often do U.S. public school full-day and half-day kindergarten classesspend time on various subject areas?
! A large majority of both full-day and half-day classes spend time each day on reading andlanguage arts activities (97 and 96 percent, respectively) (figure 23).
! Other academic subjects, however, are more likely to be taught every day in full-day classes.Compared with half-day classes, a larger percent of full-day classes spend time each day onmathematics (90 vs. 73 percent), social studies (30 vs. 18 percent), and science (24 vs. 10percent).
! A larger percent of full-day classes have art as part of their daily activities (30 percent) com-pared with half-day classes (21 percent) (figure 24).
! Music is part of the daily routine for a smaller percent of full-day classes (30 percent) com-pared to half-day classes (36 percent). This is a notable departure from many of the resultsreported in this chapter in which full-day classes are more likely than half-day classes toinclude an activity on a daily basis.
! As shown in figure 25, the amount of time per day spent on reading and language arts activi-ties (on days when reading is taught) differs for full-day and half-day classes. Thirty-onepercent of full-day classes spend more than an hour and a half on reading per day compared to10 percent of half-day classes. Sixty-four percent of half-day classes spend an hour or less onreading compared to 32 percent of full-day classes.
! Not only do more full-day classes have mathematics daily compared to half-day classes, theamount of minutes per day spent on mathematics (on days when mathematics is taught)differs as well (figure 26). Twenty-one percent of full-day classes spend more than an hourdoing mathematics activities compared to 9 percent of half-day classes. Forty-nine percent ofhalf-day classes spend less than half an hour per day compared to 19 percent of full-dayclasses.
Subject areasTeachers provide information about the fre-
quency they teach various broad subject areas andhow many minutes per day they spend in subjectareas (on those days the subject area is taught). Fig-ure 23 shows the percent of full-day and half-dayclasses that spend time each day on the academic
subjects, reading/language arts, mathematics, sci-ence, and social studies and figure 24 shows thesepercents for various music and arts subjects. Thenumber of minutes per day full-day and half-dayclasses spend on reading instruction (figure 25) andmathematics instruction (figures 26) is also com-pared.

37Full-day and Half-day Public School Kindergarten Classes
Figure 23. Percent of U.S. public kindergarten classes that spend time each day on variousacademic subject areas, by program type: Spring 1999
SOURCE: U.S. Department of Education, National Center for Education Statistics, Early Childhood Longitudinal Study, Kindergarten Class of1998–99; Spring 1999 Kindergarten Teacher Questionnaire, Base-year Public-Use Data File.
Full-day
Half-day
Reading and language arts Mathematics Social studies Science
97 9690
73
30
1824
10
0
20
40
60
80
100
Percent
Subject area
Figure 24. Percent of U.S. public kindergarten classes that spend time each day on variousmusic and art subject areas, by program type: Spring 1999
SOURCE: U.S. Department of Education, National Center for Education Statistics, Early Childhood Longitudinal Study, Kindergarten Class of1998–99; Spring 1999 Kindergarten Teacher Questionnaire, Base-year Public-Use Data File.
Full-day
Half-day
3036
30
21
139
63
0
20
40
60
80
100
Percent
Subject area
Music Art Dance/creative movement Theater/creative dramatics

Full-day and Half-day Kindergarten in the United States38
Figure 25. Percentage distribution of the amount of time per day U.S. public kindergartenclasses spend on reading instruction, by program type: Spring 1999
NOTE: ‘Minutes per day’ refers to the time spent per day on those days when reading is taught. Detail may not sum to totals because ofrounding.
SOURCE: U.S. Department of Education, National Center for Education Statistics, Early Childhood Longitudinal Study, Kindergarten Class of1998–99; Spring 1999 Kindergarten Teacher Questionnaire, Base-year Public-Use Data File.
Full-day
Half-day
1–30 31–60 61–90 91+
6
15
26
49
37
2731
10
0
20
40
60
80
100
Percent
Minutes per day spent on reading
Figure 26. Percentage distribution of the amount of time per day U.S. public kindergartenclasses spend on mathematics instruction, by program type: Spring 1999
NOTE: ‘Minutes per day’ refers to the time spent per day on those days when mathematics is taught. Detail may not sum to totals becauseof rounding.
SOURCE: U.S. Department of Education, National Center for Education Statistics, Early Childhood Longitudinal Study, Kindergarten Class of1998–99; Spring 1999 Kindergarten Teacher Questionnaire, Base-year Public-Use Data File.
Full-day
Half-day
1–30 31–60 61–90 91+
19
49
60
43
17
74 2
0
20
40
60
80
100
Percent
Minutes per day spent on mathematics

39
Reading/language arts activities andskills
Teachers participating in the ECLS-K wereasked how frequently they use various reading andlanguage arts activities and teach various readingand language arts skills. Curriculum specialists andteachers helped develop these questionnaire itemsto be used for the kindergarten and first grade yearsof the ECLS-K. The activities and skills cover a widedifficulty range. While many of the activities re-flect a typical kindergarten curriculum, others thatappear in this section may be considered advancedfor kindergarten. The skills are those that childrenin kindergarten through the early primary gradesare typically learning and some of the skills may beconsidered advanced for kindergarten.
These items were presented to the teachers sepa-rately under the headings “reading/language artsskills” and “reading/language arts activities.” Thepercent of full-day and half-day classes that engagein each of these activities and skills daily, weekly, or
25The reader may note that in a few cases a skill and theactivity used to teach that skill have a similar meaning(e.g., the reading skill, letter recognition, is very similar tothe reading activity, learning letter names). The skill andthe activity are reported separately even though theirmeaning and the frequency estimates associated with eachare very closely related. The complete wording of theactivities and skills items can be found athttp://nces.ed.gov/ecls/kindergarten/questionnaires.asp.
less than weekly is presented in Appendix B. Theitems are grouped into six categories; reading ac-tivities (figure B1), reading skills (figure B2), writ-ing activities (figure B3), writing skills (figure B4),receptive/expressive language activities (figure B5),and receptive/expressive language skills (figure B6).25
To illustrate some differences in the daily curricu-lum covered in public kindergarten full-day andhalf-day classes, figure 27 presents a selection ofthe most commonly reported reading/language artsactivities and skills and compares the percent of full-day and half-day classes that do these every day.
Full-day and Half-day Public School Kindergarten Classes

Full-day and Half-day Kindergarten in the United States40
How often do U.S. public school full-day and half-day kindergarten classesspend time on specific reading/language arts activities and skills?
! The relative order of the skills and activities that children spend time on within the domainsof reading/language arts is very similar for full-day and half-day classes; the most commonlyreported skills and activities in full-day classes are generally the most common in half-dayclasses (figures B1 to B6).
! Learning letter names and matching letters to sounds are frequently taught in kindergartenwhether the class meets for a full-day or a half-day. Recognizing the names of letters in thealphabet is taught daily in 91 percent of full-day classes and 88 percent of half-day classes.Matching letters to sounds is taught daily more often in full-day classes (88 percent) com-pared to half-day classes (79 percent) (figure 27).
! Compared to half-day classes, a larger percent of children in full-day classes spend time eachday writing their name (86 vs. 74 percent) and writing the alphabet (76 vs. 56 percent)(figure 27).
! Teachers in both full-day and half-day classes often read aloud to their children while showingthem the printed words. A larger percent of full-day classes, however, do this every day (79percent) compared to half-day classes (62 percent) (figure 27).
! Almost all specific reading/language arts skills and activities are more frequently covered dailyin full-day classes compared with half-day classes with some of the exceptions being thosedone daily by a majority of both types of classes (e.g., learning letter names) (figures B1 toB6).
! The percent of full-day classes that engage in a skill or activity at least weekly (daily or weekly)exceeds the percent of half-day classes for 19 out of the 36 reading/language arts skills andactivities examined (figures B1 to B6). Some of the reading activities and skills that are morelikely to be part of at least a weekly routine in full-day classes are typically considered moreadvanced than the traditional kindergarten reading curriculum (e.g., reading aloud fluently,reading multi-syllable words, and alphabetizing).26
! Nine out of the 11 writing skills and activities are done weekly in more full-day classescompared to half-day classes (e.g., writing in journal, writing stories and reports, and conven-tional spelling) (figures B3 and B4).
26Comparisons of public school kindergarten and first-grade activities and skills show that a higher percent of first-grade childrencompared to kindergartners engage in these at least once a week (reading aloud fluently, 98 vs. 44 percent; reading multi-syllablewords, 84 vs. 36 percent; and alphabetizing, 66 vs. 18 percent) (unpublished tables, ECLS-K kindergarten and first-gradelongitudinal file).

41Full-day and Half-day Public School Kindergarten Classes
Figure 27. Percent of U.S. public kindergarten classes that work daily on various reading/language arts activities and skills, by program type: Spring 1999
SOURCE: U.S. Department of Education, National Center for Education Statistics, Early Childhood Longitudinal Study, Kindergarten Class of1998–99; Spring 1999 Kindergarten Teacher Questionnaire, Base-year Public-Use Data File.
Percent
Full-day
Half-day
0 20 40 60 80 100
Writing the alphabet
Hearing stories while seeing the print
Writing their name
Work on phonics
Matching letters to sounds
Learning letter names
56
76
62
79
74
85
79
86
79
88
88
91
Full-day and Half-day Kindergarten in the United States42
How often do U.S. public school full-day and half-day kindergarten classesspend time on specific mathematics activities and skills?
! Teachers use calendar activities to teach mathematics skills every day in nearly all full-day(94 percent) and half-day kindergarten classes (93 percent) (figure 28).
! Counting out loud is a commonly taught skill for both full-day and half-day classes. In 82percent of full-day classes and 81 percent of half-day classes children spend time each daycounting out loud (figure 28).
! Children work daily on number/quantity correspondence in a larger percent of full-day classes(49 percent) compared with half-day classes (39 percent) (figure 28). This skill is covered atleast weekly in most full-day (95 percent) and half-day classes (94 percent) (figure B8).
! Writing numbers from 1 to 10 is taught on a daily basis in a larger percent of full-day classes(38 percent) compared to half-day classes (20 percent) (figure 28). This skill is also taughtmore often on at least a weekly basis in a larger percent of full-day classes (89 percent) thanhalf-day classes (78 percent) (figure B9).
! Kindergarten is a time where many children are introduced to addition and subtraction bylearning how to model these mathematical operations with manipulatives (e.g., blocks). Full-day kindergarten classes are more likely to use manipulatives for this purpose on a daily basis(36 percent) compared with half-day classes (22 percent) (figure 28).
! Among the 37 skills and activities examined in the mathematics domain, there are 29 inwhich the percent of full-day classes engaged in the skill or activity at least weekly exceeds thepercent of half-day classes (figures B7 to B14). Many of these are activities or skills thatinvolve solving mathematics problems (e.g., explain how a math problem is solved, solve areal-life math problem, and solve math problems on the chalkboard). Additionally, some ofthese mathematics skills and activities are ones more typically part of a first-grade curriculum(e.g., recognizing fractions, telling time, and writing numbers from 1–100). 27
27Comparisons of public school kindergarten and first-grade activities and skills show that a higher percent of first-grade childrencompared to kindergartners engage in these at least once a week (recognizing fractions, 32 vs. 6 percent; telling time, 72 vs. 40percent; and writing numbers from 1–100, 41 vs. 18 percent) (unpublished tables, ECLS-K kindergarten and first-gradelongitudinal file.)
Mathematics activities and skillsItems in the teacher questionnaire about spe-
cific mathematics skills were developed to corre-spond to items in the mathematics domain of theECLS-K battery. The assessment items as well asthese teacher questions covers a wide range of math-ematics content areas and ability levels. The kin-dergarten teachers indicated how often their classspent time doing a variety of mathematics activitiesand covering a variety of mathematics skills.
Mathematics activities that are not related tospecific skills (e.g., play math games and do mathworksheets) are presented together simply as math-ematics activities (figure B7). Some of the math-
ematics activities can be directly related to specificskills (e.g., count out loud) so for the purpose ofpresenting these results, the skill-specific activitiesare grouped with the related skills. The mathemat-ics skills are grouped into six categories: countingand quantity (figure B8), number systems (figureB9), operations (figure B10), measurement (figureB11), data analysis (figure B12), geometry (figureB13), and patterns and sorting (figure B14). Toillustrate some differences in the daily mathemat-ics curriculum covered in public kindergarten full-day and half-day classes, figure 28 presents a selec-tion of the most commonly reported mathematicactivities and skills and compares the percent of full-day and half-day classes that do these every day.

43Full-day and Half-day Public School Kindergarten Classes
Figure 28. Percent of U.S. public kindergarten classes that work daily on variousmathematics activities and skills, by program type: Spring 1999
SOURCE: U.S. Department of Education, National Center for Education Statistics, Early Childhood Longitudinal Study, Kindergarten Class of1998–99; Spring 1999 Kindergarten Teacher Questionnaire, Base-year Public-Use Data File.
Percent
Full-day
Half-day
0 20 40 60 80 100
36
22
38
20
46
45
49
39
82
81
94
93
Use counting manipulatives to learn operations
Write numbers
Read 2-digit numbers
Number/quantity correspondence
Count out loud
Calendar activities


45
Cognitive Gains of Public SchoolChildren in Full-day and Half-dayKindergarten Classes
This chapter focuses on the relationship be-tween kindergarten program type and academicgains. Children in full-day classes spend more timein school than those in half-day classes and thisdifference, as described in the previous chapter, in-creases the frequency with which children are ex-posed to a wide variety of specific instructional ac-tivities. As described in the introduction to thisreport, prior research suggests that full-day kinder-garten programs compare favorably to half-day pro-grams in terms of children’s academic growth(Fusaro 1997; Cryan et al. 1992; and Gullo 2000).
This chapter compares public school full-dayand half-day children’s gains made during the kin-dergarten year in reading/language arts and in math-ematics and then these gains are compared whiletaking into account child, family and other class-room characteristics that may be related to studentachievement differences.
While the following analyses look at overall scoregains from fall to spring, a previous report, The Kin-dergarten Year (West, Denton and Reaney 2001),provides descriptive details about the kinds of skillsand abilities that children are learning in reading/language arts and mathematics throughout the kin-dergarten year. As noted in The Kindergarten Year,first-time kindergartner’s reading and mathemat-ics knowledge and skills differ by certain child andfamily characteristics both at the beginning and atthe end of the kindergarten year. All groups makegains during the year, and White and Asian chil-dren, on average, score higher than Black and His-panic children both in the fall and spring of kin-dergarten. Additionally, children from economicallydisadvantaged households make gains during theirkindergarten year but tend to both start and endthe year behind children from more economicallyadvantaged households.
The findings presented in this chapter do notfocus on fall score differences or spring score differ-ences among groups of children or by class charac-
teristics, but instead they highlight differences in theaverage progress made during the year—the scoregains from fall to spring. The findings are limited tochildren who attended public kindergarten programsfor the first time in 1998–99, did not change teach-ers during the school year, and who were assessed inEnglish in both the fall and spring.
The findings begin with a comparison of the av-erage gains made in reading/language arts and math-ematics for public kindergarten children in full-dayand half-day classes. However, simple comparisonsof children in the two program types may be con-founded with other differences associated with full-day and half-day programs such as children’s race/ethnicity and poverty status (as described in chapter3). Additionally, there are differences in some char-acteristics of full-day and half-day classes such as thepresence of an instructional aide and class size (asdescribed in chapter 4), and these may be related toachievement gains. For these reasons, the additionalanalyses reported on in this chapter control for childcharacteristics (i.e., race/ethnicity, sex, poverty sta-tus, and initial achievement level) and other class-room features that may be considered beneficial foracademic gains (e.g., Finn et al. 2001). These class-room features are class size, the presence of a class-room instructional aide, the total time devoted tosubject area instruction, and the use of achievementgroups. These classroom features are included in theseanalyses because they, like program type, are relatedto the time and individual attention available for in-struction for each child in the kindergarten class-room. Additionally, these analyses investigate whethergains made in full-day programs are differentiallyassociated with other child and class characteristics.For example, the analyses answer questions such as;“Are the differences in gains made by children infull-day and half-day classes the same for children indifferent race/ethnicity groups?” and, “Does havingan instructional aide in the class mitigate differencesthat may be associated with full-day and half-day
Cognitive Gains of Public School Children in Full-day and Half-day Kindergarten Classes
Chapter 5:

Full-day and Half-day Kindergarten in the United States46
classes?” When differences between group meansare found to be statistically significant, the differ-ence is described in standard deviation terms. Astandard deviation is a measure of the variability ofa distribution of scores (i.e., reading gain scores ormathematics gain scores). In general, approximatelytwo-thirds of the scores in a distribution fall be-tween one standard deviation above and one stan-dard deviation below the mean.
It is important to note that these analyses donot offer a formal evaluation of the impact of full-day kindergarten. Causal relationships are best de-termined with a design that randomly assigns chil-dren to classes with the characteristics under study.The strengths of this study, however, are that ituses a nationally representative sample of English-speaking, first-time kindergartners, incorporates apre- and post-test design (fall and spring scores),and controls for variables that may be related toachievement outcomes (i.e., sex, race/ethnicity, pov-erty status, and class size). It is possible that otherpotentially important variables (e.g., teacher quali-
fications, specific instructional practices, and schoolresources) may be related to the classroom charac-teristics and achievement but are not representedin the analyses. Given the non-experimental, pre-test-posttest design of the study, there is no way todetermine if the samples were equivalent in all im-portant ways at the beginning of the kindergartenyear. This is a research design limitation which makesit impossible to draw causal conclusions from thedata. The analyses in this report are intended toprovide a description of the differences associatedwith program type and to stimulate others to fur-ther explore the differences found here.
The analyses used to investigate the differencesassociated with these variables take into account thestructure of the ECLS-K data—children are clus-tered within classes and these classes are clusteredwithin schools. Detailed descriptions of the vari-ables, the sample, the multi-level regression method,and the complete set of findings follow the key find-ings presented below.

47
Do public school children who attend full-day kindergarten make largerreading achievement gains than children who attend half-day?
Key findings: Reading gains
! Children in full-day programs, on average, make greater gains in their reading achievementscores from fall to spring (10.6) compared to those in half-day classes (9.4) (figure 29).
! When the gain scores are analyzed while taking into account differences due to child, familyand other classroom characteristics, the positive effect associated with full-day programspersists (table 5). This represents a difference in gain scores of about 32 percent of a standarddeviation.
! Some child characteristics are related to reading gain differences (table 5).
❖ Girls make slightly greater gains than boys.
❖ Children living in poverty make slightly smaller gains than those not in poverty.
❖ Children beginning the year in the top third of the reading score distribution makeslightly smaller gains compared to others.
❖ Whites are compared to others by race/ethnicity and are found to make smaller overallgains than Asian children.
❖ Reading score gains are positively related to the childrens’ ages.
! Children in classes with 25 or more children make slightly smaller gains compared to those inclasses with 18 to 24 children. There is not a differential effect associated with class size byprogram type—a smaller class size does not mitigate the difference in gains found betweenchildren in half-day and full-day classes. Program type differences are also examined in con-junction with other child and class characteristics and the positive effect associated with full-day kindergarten is found to be consistent with the following exception.
! For Black students, there is a significant relationship between presence of an aide in the classand program type on reading score gains from fall to spring. While the presence of an aide inthe class is not associated with differences in gain scores among White, Asian, or Hispanicchildren in either half-day or full-day programs, Black children in full-day classes with an aidemake greater gains compared to Black children in full-day classes without an aide (figure 30).The benefit associated with the presence of a classroom aide for Black children in full-dayclasses is not found for Black children in half-day classes.
Cognitive Gains of Public School Children in Full-day and Half-day Kindergarten Classes

Full-day and Half-day Kindergarten in the United States48
Figure 29. Public school first-time kindergartners’ mean reading gain scores, by programtype: Fall 1998 to spring 1999
NOTE: Estimates are based on public school, first-time kindergarten children attending a regular kindergarten program (not a transitionalor multi-grade class) who are assessed in English in both the fall and the spring. Only children with the same teacher in both the fall andspring are included in the analysis. Detail may not sum to totals because of rounding. The scores are simple means and are unadjusted fora number of other factors that are related to performance.
SOURCE: U.S. Department of Education, National Center for Education Statistics, Early Childhood Longitudinal Study, Kindergarten Class of1998–99; Teacher Questionnaire and Child Assessments, Base-Year Public-Use data.
0
20
22
24
26
28
30
32
34
Reading scale score
W
21.6
32.1
21.9
31.3
Fall Spring
Full-day, gain 10.6
Half-day, gain 9.4
Figure 30. Public school, first-time kindergartners’ mean reading score gains, by race/ethnicity, program type and the presence of an aide in the class: Fall 1998 tospring 1999
NOTE: Estimates are based on public school, first-time kindergarten children attending a regular kindergarten program (not a transitionalor multi-grade class) who are assessed in English in both the fall and the spring. Only children with the same teacher in both the fall andspring are included in the analysis. The scores are simple means and are unadjusted for a number of other factors that are related toperformance.
SOURCE: U.S. Department of Education, National Center for Education Statistics, Early Childhood Longitudinal Study, Kindergarten Class of1998–99; Teacher Questionnaire and Child Assessments, Base-Year Public-Use data.
No aide
Aide
WhiteFull-day Half-day
Black White Black0
5
6
7
8
9
10
11
1211.4
10.9
7.9
9.7 9.5 9.59.0
8.0
Reading gain score
Program type
W
49
Do public school children who attend full-day kindergarten make largermathematics achievement gains than children who attend half-day?
Key findings: Mathematics gains
! Children in full-day programs, on average, make greater gains in their mathematics achieve-ment scores from fall to spring (8.6) compared to those in half-day classes (7.8) (figure 31).
! After accounting for differences due to child, family and classroom characteristics, children infull-day kindergarten classes make gains in their mathematics scores from fall to spring that arelarger than those in half-day classes (table 7). This represents a difference in gains scores ofabout 22 percent of a standard deviation.
! Differences in mathematics gain scores are related to some child characteristics (table 7).
❖ Children from homes living below the poverty threshold make smaller gains than those notin poverty.
❖ Black children make smaller gains compared to White children.
❖ Compared to children with fall mathematics scores in the bottom third of the distribution,children in the top third make smaller gains during the year.
! Full-day and half-day mathematics gain score differences are compared across other character-istics. The positive effect associated with full-day programs is not different across levels ofother child or family characteristics included in the analysis (e.g., sex, race/ethnicity, povertystatus, or fall mathematics ability level) or with classroom characteristics (e.g., class size orclassroom aide).
Cognitive Gains of Public School Children in Full-day and Half-day Kindergarten Classes

Full-day and Half-day Kindergarten in the United States50
HLM AnalysesMulti-level regression analyses are used to model
the effects associated with kindergarten programtype and other child and classroom variables. TheECLS-K design includes nested data with three lev-els: child, class and schools. The models used forthese analyses are formulated as three-level regres-sion models, with the first level being the child(within classes), the second class (within schools)and the third school. The three-level models arefitted using HLM software (Bryk and Raudenbush2002). The use of this modeling approach assuresthat the significance tests for effects are conductedusing appropriate degrees of freedom. Reading scoregains and math score gains are analyzed separately.When a characteristic is a significant “main effect”it indicates that gain scores are related to this char-acteristic after accounting for differences due toother factors in the model. Main effects can be atthe child level (e.g., children living in poverty makelower reading gains, on average, compared to otherchildren) or at the class level (e.g., the average read-ing gain score for children in full-day classes is higher
than it is for half-day classes). A regression coeffi-cient (B) for a significant effect can be interpretedas the difference in the number of test items a stu-dent would answer correctly (if all items had beentaken) in the spring compared to the fall for differ-ent groups after adjusting for other characteristics.For example, if B=1.00 for an effect associated withgroups x and y (with group x as the reference group),this can be interpreted to mean that after account-ing for other characteristics in the model, childrenin group y answered on average one additional read-ing test item correctly over the course of the kin-dergarten year compared to group x. This can beinterpreted in light of the overall average gain score(e.g., 10 points for reading gains). Significant dif-ferences for average adjusted gain scores can also beexpressed as a percentage of the standard deviationof the gain scores. For example, if the standard de-viation of gain scores is 5.0 score points, a regres-sion coefficient of 1.0 represents an effect size of.20 (or 20 percent of a standard deviation).
Whether or not an effect associated with pro-gram type is consistent across levels of the otherchild and class characteristics is examined with tests
Figure 31. Public school first-time kindergartners’ mean mathematics gain scores, by pro-gram type: Fall 1998 to spring 1999
NOTE: Estimates are based on public school, first-time kindergarten children attending a regular kindergarten program (not a transitionalor multi-grade class) who are assessed in mathematics in both the fall and the spring. Only children with the same teacher in both the falland spring are included in the analysis. The scores are simple means and are unadjusted for a number of other factors that are related toperformance.
SOURCE: U.S. Department of Education, National Center for Education Statistics, Early Childhood Longitudinal Study, Kindergarten Class of1998–99; Teacher Questionnaire and Child Assessments, Base-Year Public-Use data.
0
18
20
22
24
26
28
30
32
Mathematics scale score
W
19.0
27.6
19.8
27.6
Fall Spring
Full-day, gain 8.6
Half-day, gain 7.8

51
for interaction effects. A significant interaction ef-fect is found when differences attributed to onecharacteristic (e.g., program type) are not the samefor levels of one or more other characteristics (e.g.,race/ethnicity and classroom aide).
The data for the analyses presented in this chap-ter are weighted at the child level to account forunequal selection probabilities and nonresponse.28
The multi-level nature of these analyses eliminatesthe need to take into account the complex designof the sample of schools and children when esti-mating variances since class- and school-level varia-tion are accounted for in the models.29 Robust stan-dard errors and p-values for all coefficients are thoseproduced using the HLM software.
Variables in the Analyses
Dependent Variables: Assessment ScoreGains
The ECLS-K direct child cognitive assessmentis administered one-on-one with each child using acomputer-assisted personal interview (CAPI). Theassessment included two cognitive domains (read-ing and mathematics).30 The ECLS-K battery useda two-stage assessment approach in which the firststage in each domain contained a routing test thatdetermined the child’s approximate skills. Accord-ing to the child’s performance on the routing test,the child is administered one of the three skill levelassessments in that domain (the second stage). Thisadaptive approach is used in both the fall and springadministrations of the assessments. The readingdomain consisted of basic reading skills (e.g., letterrecognition, understanding of the letter-sound re-lationship, word reading), vocabulary, and readingcomprehension (e.g., initial understanding, devel-oping interpretation, recognizing implausibleevents). The mathematics domain covered earlyskills including number sense, number properties,
operations, measurement, data analysis, probabil-ity, shapes and patterns, and problem solving.
Item response theory (IRT) is used to calculatescores that could be compared regardless of whichsecond stage form is completed. The routing testitems plus a core set of common items across sec-ond stage forms are used to establish a commonscale. The items’ level of difficulty, discriminatingability and “guessability” are used in IRT to placeeach child on a continuous ability scale. The IRTscale scores themselves represent estimates of thenumber of items students would have answeredcorrectly if they had taken all of the 72 questions inthe reading test, and all of the 64 questions in themathematics test.
The reliability (IRT-based theta) is .9 for thefall and spring reading and mathematics estimatesof ability.31 The dependent variables in these analy-ses are gain scores that represent the differencesbetween the IRT fall and spring scale scores for thereading and mathematics assessments. The resultsof these analyses are presented in terms of theamount of learning children demonstrate duringthe kindergarten year, as opposed to children’s sta-tus at the end of the year adjusted by their fall sta-tus, as would be the case with an alternative ap-proach (i.e., a covariance model).32
Level 1: Child characteristics
Poverty status: Children from households be-low the federal poverty threshold are compared tothe reference group of children living at or abovethe poverty threshold. In 1998, the poverty thresh-old for a family of four was $16,655.
Race/Ethnicity: Children’s race/ethnicity iscoded as four dummy variables: Black, Hispanic,Asian and Other, with White as the reference cat-egory.
Age: Children’s age in months at the beginningof the kindergarten year is included.
Sex: Boys’ score gains are compared to girls’score gains, with girls as the reference category.
28The longitudinal child weight, BYCOMW0 from theECLS-K Public-Use Data File, is used for analyses in thischapter and this weight is normalized so that the sum ofthe weights equals the sample size.29This approach does not take into account clusteringassociated with primary sampling units.30A third cognitive domain, general knowledge, is a part ofthe ECLS-K assessment battery, but is not included here.
31For more information about the assessment scores, referto the ECLS-K Psychometric Report (Rock and Pollack2002).32For further discussion about the appropriateness of gainscores as a dependent variable, see page 124 in thetechnical appendix.
Cognitive Gains of Public School Children in Full-day and Half-day Kindergarten Classes

Full-day and Half-day Kindergarten in the United States52
Initial reading ability: The distribution of allchildren’s fall reading scale scores are examined andthree equal-sized groups are formed to representlow, middle and high initial reading ability groups.These groups are dummy coded in the analyses ofreading score gains. Two comparisons are made,children in the lowest third and middle third areeach compared to children in the top third of thefall reading score distribution. This variable is in-cluded in the model to investigate whether the ef-fect associated with full-day kindergarten is equallyapparent for children that begin the year at differ-ent ability levels.
Initial mathematics ability: Like reading, thedistribution of all children’s fall mathematics scalescores are examined and three equal-sized groupsare formed to represent low, middle and high ini-tial math ability groups. These groups are dummycoded and in the analyses of the math score gainstwo comparisons are made, the lowest third andmiddle third are each compared to those childrenin the top third of the fall math score distribution.Again, the inclusion of this variable allows for theexamination of the consistency of a full-day pro-gram effect for children possessing varying math-ematics skills at the start of the kindergarten year.
Time lapse between assessments: Over 90 per-cent of the fall assessments took place in Octoberand November of 1998 and over 90 percent of thespring assessments took place in April and May of1999. The average time that lapsed between assess-ments is a little more than six months but there issome variation in the time between assessments.The amount of time between assessments is corre-lated to the score gains, as would be expected witha sensitive assessment that is measuring the sameskills and abilities that are being taught through-out the year. The positive correlation between scoregains and the time between assessments is .20 forreading and .15 for math. There is no indicationthat this “lapse” variable is related to any indepen-dent variables of interest, therefore there is no con-cern that results are confounded by the correlationsto gain scores (for example, children in full-day pro-grams do not have a longer average time betweenassessments which would confound an effect asso-ciated with program type). This lapse variable isincluded in the model, however, as a safeguard
against this concern. The number of days betweenthe fall and spring assessment dates is calculatedand transformed so that 1 equals 180 days (approxi-mately the mean time lapse) and other values rep-resent a proportion of 180 days (e.g., 150 days=.83). This variable has values ranging from .64 to1.46. Since this variable is scaled so that a 1 roughlyequals the mean time lapse, the unstandardized re-gression coefficient (B) associated with this variable(presented in table 5 for reading and table 7 formathematics) is very close to the overall mean gainscore. The coefficient itself has little value for inter-pretation, but it is recommended that analyses ofECLS-K gain scores incorporate this, or a similarvariable, to eliminate possible confounding of timelapse with other variables.
Level 2: Class characteristicsProgram type: As defined throughout this re-
port, classes are categorized as either full-day or half-day based on information provided by teachers inthe fall and spring teacher questionnaires. In theanalyses in this chapter, children in full-day kin-dergarten classes are compared to those in half-dayclasses.
Class size: While not all authors conclude thatthe recent class size studies necessarily find higherachievement children in smaller classes (Hanushek1999; Finn and Achilles 1999), in general the lit-erature provides evidence that children in smallerclasses often make greater academic gains comparedto those in larger classes (Grissmer 1999; Nyhanand Alkadry 1999; Achilles, Harmon, and Egelson1995). There is additional evidence that smallerclass sizes in early grades lead to achievement gainsthat can last for years (Finn et al. 2001; Molnar etal. 1999; Nye, Hedges, and Konstantopoulos1999).
Tennessee’s Project STAR (Student-Teacher-Achievement-Ratio) study, an important large-scaleclass size experiment, compared two class sizegroups: “small” (13–17 children), and “large”(22–26 children) (Grissmer 1999). Class size groupsare constructed for this chapter to have a compa-rable “small” class group of 17 or fewer children.About 19 percent of the children in this study arein a “small” class and an approximately equal num-ber are in a class with 25 or more children—this is

53
used to define the “large” class size group.33 The“medium” group consists of those in classes withbetween 18–24 children. Preliminary analysis withthe ECLS-K data indicated that differences in read-ing and mathematics gains are not apparent amongchildren in the small and medium-sized classes butsuggested that those in the largest classes madesmaller gains. For this reason class size is dummycoded so that children in small classes (up to17 children) and children in medium sized classes(18–24) are compared to those in large classes (25+).
Instructional aides: Instructional aides are usedin some classrooms to assist teachers with a varietyof instructional activities and lower the student-adult ratio in the classroom. Teacher aides can offersupport to teachers in the classroom by workingdirectly with children in small groups or individu-ally. However, Gerber et al. (2001) showed the pres-ence of classroom aides has only a very small posi-tive association with reading achievement in theprimary grades. These authors argue that having anaide in the classroom is not nearly as effective atimproving achievement as reducing class size.
ECLS-K teachers provided information aboutpaid aides in the classroom in the spring teacherquestionnaire. For the purpose of these analyses,classes are defined as having an instructional aideonly if the aide worked directly with children oninstructional tasks and if the aide is in the class forat least one hour per day. Special education aidesand English as a second language or bilingual edu-cation aides are not included as instructional aidesfor these analyses. Classes with an aide are com-pared to the classes without an aide.
Relative time for reading instruction: This is adichotomous classroom variable indicating whetheror not the class spends a relatively large amount oftime on reading/language arts instruction. This vari-able is based on teachers’ responses to questionsabout the number of minutes per day and numberof times per week they have reading instruction intheir class. Since full-day and half-day classes donot have the same amount of total time during theday for instruction, the relative time for readinginstruction variable is created separately for full-
day and half-day programs. For full-day classes, themodal response for reading instruction is the cat-egory 61–90 minutes per day and for half-dayclasses the modal response category is 31–60 min-utes per day. For the purpose of these analyses afull-day class is categorized as having “more timefor reading instruction” if reading is taught at least3–4 times a week and more than 90 minutes perday. Half-day classes are categorized as having“more” time for reading instruction if reading istaught at least 3–4 times a week and more than 60minutes per day. For models examining readingscore gains, classes with “more” time for readinginstruction (33 percent of all classes) are comparedwith the reference group, which spends less timeon reading. Thirty-one percent of full-day classesand 37 percent of half-day classes are classified asspending “more” time for reading instruction.
Relative time for mathematics instruction: Thedistribution of responses for amount of time spenton mathematics instruction is examined to create a“time for math instruction” variable. The modalresponse for full-day classes is 31–60 minutes perday, so classes are coded as having “more” time formath instruction when math is taught more than60 minutes per day (and at least 3–4 times perweek). In half-day classes, the mode response is1–30 minutes per day so these classes are classifiedas having “more” time for mathematics instructionif they have math for more than 30 minutes perday (and at least 3–4 times per week). For modelsexamining mathematics score gains, classes with“more” time for math instruction (31 percent ofthe classes) are compared with the reference group,which spends less time on math. Forty-seven per-cent of half-day classes and 20 percent of full-dayclasses are classified as spending more time on math-ematics instruction.
Achievement grouping for reading instruction:In some classes, teachers form achievement groupsso children of similar ability can work on the skillsthat are best suited to their skill level. The purposeof achievement grouping is to target instruction timein a way that reduces the amount of time childrenspend on skills that they either have already mas-tered or are not yet ready to master. The ECLS-Kteacher questionnaires asked the teachers to indi-cate whether they use achievement groups for read-ing instruction and for how many minutes per day.
33In order to keep the sample sizes of the “small” and“large” categories approximately equal, the large class sizecategory is not defined in the same way as the STARstudies.
Cognitive Gains of Public School Children in Full-day and Half-day Kindergarten Classes
Full-day and Half-day Kindergarten in the United States54
For the analyses of reading score gains, classes thatuse achievement groups as a substantial feature oftheir reading instruction program are comparedagainst classes that do not. Classes that use readingachievement groups at least weekly and for morethan 15 minutes on the days they use the groupsare, for these analyses, coded as using achievementgroups (43 percent of classes).
Achievement grouping for mathematics instruc-tion: For the analyses of mathematics score gains,classes that use achievement groups (at least weeklyand for more than 15 minutes per day) for math-ematics instruction (34 percent of classes) are com-pared to those that do not.
Level 3: School characteristicsRegion of the country, location (large and mid-
sized cities, suburban and large towns, and ruraland small town areas) and concentration of low-income students are dummy coded and entered inthe models but none of these factors are signifi-cantly associated with either reading or mathemat-ics gains. The school level, however, is maintainedas a separate level in the models in order to measureaccurate dependent score variance components as-sociated with variation among schools.
SampleThis chapter looks at changes in reading and
mathematics achievement over the kindergarten yearfor public school children enrolled for the first timein a regular kindergarten program in the 1998–99school year. Children repeating kindergarten andthose who attend a transitional or 2-year kinder-garten and those in a multi-graded or ungradedclass are excluded from the analyses. Children whochanged teachers between spring and fall year areexcluded to ensure that the class characteristics as-sociated with each child (e.g., program type, classsize and time for instruction) are those to whichthe child had been exposed throughout the full year.An English language proficiency screener, called theOral Language Development Scale (OLDS), is ad-ministered if school records indicated that the child’shome language is not English. The child had todemonstrate a certain level of English proficiency
to be administered the cognitive assessment inEnglish. Children who are not assessed in Englishin both the fall and spring are also excluded forthese analyses. Children are also excluded due tothe requirement of the HLM software that no caseswith missing data at level-two (the class level) beincluded in the analyses. There are 8,062 children,1,907 classes and 611 schools represented in theanalysis of reading gain scores. More teachers leftquestions blank when referring to their mathemat-ics instruction (i.e., time for instruction and use ofachievement groups) than when they answered read-ing instruction questions. For this reason, the analy-sis of mathematics gain scores is based on a smallersample compared to the reading gain score analy-ses—6,768 children, 1,630 classes and 583 schools.
Table 4 describes selected characteristics of thepopulation of all public kindergarten children andof the children represented by the sample used forthese analyses. As would be expected given the re-quirement that the children are able to be assessedin English, this analyses represents a population ofkindergartners that has smaller percent of Hispanicchildren, children from homes where the primarylanguage is not English and children whose familyincome is below the poverty threshold comparedto all public kindergartners.
Findings: Reading score gainsThe average reading score gain from fall to spring
for public school, first-time kindergartners in thisanalysis is 10.04 score points and the standard de-viation of these gain scores is 6.01. Sixty-eight per-cent of these scores fall within one standard devia-tion of the average (between 4.03 and 16.05).Ninety percent of the reading gain scores fall be-tween 1.27 and 20.50. To determine which child,class and school factors relate to reading gain scores,all of the school, class and child variables mentionedabove are examined in the analysis. In order to de-termine if program type is differentially related toreading score gains for different groups of children(i.e., race/ethnicity, sex, initial reading ability,poverty status) or for classrooms with other char-acteristics (e.g., class size, presence of a classroomaide, use of achievement groups), many interac-
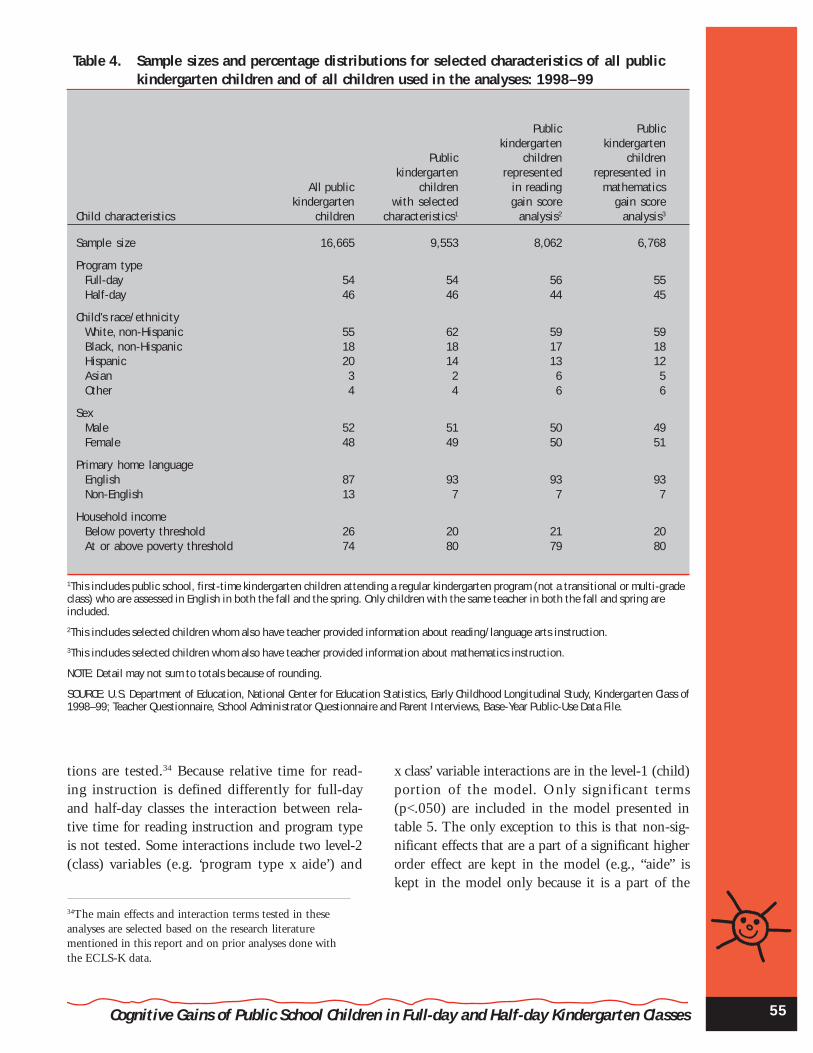
55
Table 4. Sample sizes and percentage distributions for selected characteristics of all publickindergarten children and of all children used in the analyses: 1998–99
x class’ variable interactions are in the level-1 (child)portion of the model. Only significant terms(p<.050) are included in the model presented intable 5. The only exception to this is that non-sig-nificant effects that are a part of a significant higherorder effect are kept in the model (e.g., “aide” iskept in the model only because it is a part of the
34The main effects and interaction terms tested in theseanalyses are selected based on the research literaturementioned in this report and on prior analyses done withthe ECLS-K data.
Cognitive Gains of Public School Children in Full-day and Half-day Kindergarten Classes
Public Publickindergarten kindergarten
Public children childrenkindergarten represented represented in
All public children in reading mathematicskindergarten with selected gain score gain score
Child characteristics children characteristics1 analysis2 analysis3
Sample size 16,665 9,553 8,062 6,768
Program typeFull-day 54 54 56 55Half-day 46 46 44 45
Child’s race/ethnicityWhite, non-Hispanic 55 62 59 59Black, non-Hispanic 18 18 17 18Hispanic 20 14 13 12Asian 3 2 6 5Other 4 4 6 6
SexMale 52 51 50 49Female 48 49 50 51
Primary home languageEnglish 87 93 93 93Non-English 13 7 7 7
Household incomeBelow poverty threshold 26 20 21 20At or above poverty threshold 74 80 79 80
1This includes public school, first-time kindergarten children attending a regular kindergarten program (not a transitional or multi-gradeclass) who are assessed in English in both the fall and the spring. Only children with the same teacher in both the fall and spring areincluded.
2This includes selected children whom also have teacher provided information about reading/language arts instruction.
3This includes selected children whom also have teacher provided information about mathematics instruction.
NOTE: Detail may not sum to totals because of rounding.
SOURCE: U.S. Department of Education, National Center for Education Statistics, Early Childhood Longitudinal Study, Kindergarten Class of1998–99; Teacher Questionnaire, School Administrator Questionnaire and Parent Interviews, Base-Year Public-Use Data File.
tions are tested.34 Because relative time for read-ing instruction is defined differently for full-dayand half-day classes the interaction between rela-tive time for reading instruction and program typeis not tested. Some interactions include two level-2(class) variables (e.g. ‘program type x aide’) and

Full-day and Half-day Kindergarten in the United States56
significant “aide x program type x race/ethnicity”interaction).35
The results of the regression analysis suggestthat there are differences in reading score gains thatare associated with class and child characteristics.Table 5 shows the unstandardized regression coef-ficient (B), standard error, and p-value for each mainand interaction term in this model.
Class characteristics and reading scoregains
The level-2 (between class) portion of the mul-tilevel model investigates the differences in eachclass’ mean reading score gain as a function of classcharacteristics while adjusting for other variables inthe model. The use of achievement groups for read-ing instruction is not found to have a significanteffect on reading score gains.36 Other class charac-teristics that are related to children’s gains in read-ing are described below.
Program type: The overall average gain betweenfall and spring is about 10 score points. After con-trolling for the other child- and class-level variablesin the model, children in full-day classes make gainsin their reading scale score from fall to spring thatare, on average, 1.91 score points larger than thosein half-day classes (B =1.91). The standard devia-tion of reading score gains from fall to spring is6.01 score points for the children in this sample, sothis difference of 1.91 score points represents anincrease that is 32 percent of a standard deviationfor kindergarten program type (i.e., effectsize =0.32).
Classroom instructional aide: The presence ofan aide in the class did not have a significant maineffect on reading score gains. However, the maineffect associated with kindergarten program typeshould be considered in light of a significant three-way interaction between program type, race/ethnicity (Black vs. White) and whether there is an
35See the technical appendix for further details about theanalyses.36If ‘achievement grouping for reading, yes’ were added tothe model shown in table 5, it would have anunstandardized regression coefficient of 0.36 and a standarderror of 0.36 with a p-value of 318.
instructional aide in the classroom who worked di-rectly with the children (B =1.76). Figure 30 illus-trates the direction of this relationship using unad-justed mean gain scores. The presence of an aide inthe class is not associated with a reading gain dif-ference for White children in either half-day or full-day kindergarten programs. However, an aide inthe class is associated with greater reading gains forBlack children in full-day kindergartens. The gainfor these children is 29 percent of a standard devia-tion.
Class size: Class size is a very small but signifi-cant main effect indicating that children in the larg-est classes make slightly smaller gains in readingcompared to those that are in medium sized classes.After accounting for other child and class charac-teristics in the model, children in classes with be-tween 18 and 24 students make gains that are, onaverage, .54 score points larger than those in classeswith 25 or more children (B =.54, effect size =.09).In addition, although not significant, the gain scoredifference between small and large classes is similarin magnitude and direction. No difference is foundbetween small and medium classes.37
Relative time for reading instruction: Childrenin classes that devote more than the typical amountof time for reading instruction (compared to otherfull-day or other half-day classes)38 make gains inreading scores that are slightly larger (.35 scorepoints) than those that spend less time with read-ing instruction (B =.35, effect size =.06.)
Child characteristics and reading scoregains
The level-1 (within-class) portion of the modelinvestigates the differences in reading score gainsfor children in each class as a function of a select setof child characteristics (poverty status, race/ethnicity, sex, age, and initial reading ability). Theregression coefficients represent the differences in
37If the analysis is set up so that small class size is thereference group, the difference in gains for small vs. mediumsized classes is not statistically significant, (B =.04).38See page 53 for a definition of this variable.

57
Table 5. Multilevel regression model relating reading score gains of public school first-timekindergartners to child and class characteristics: Fall 1998 to spring 1999
Fixed effect (reference group) Unstandardized coefficient (B) Standard error
Intercept –4.12* 1.51
Level-2 Class characteristicsLength of kindergarten day (Half-day)
Full-day 1.91* 0.34
Class size (Large 25+)Small <18 0.58 0.30Medium 18–24 0.54* 0.25
Instructional aide (No)Yes 0.29 0.33
Relative time for reading instruction (Less)More 0.35* 0.18
Level-2 InteractionsProgram type*Aide –0.57 0.47
Level-1 Child CharacteristicsPoverty status (At or above)
Below poverty threshold –1.04* 0.18
Race/ethnicity (White, non-Hispanic)Black, non-Hispanic –0.42 0.48Hispanic 0.16 0.40Asian 1.55* 0.78Other –0.67 0.64
Sex (Female)Male –0.73* 0.13
Age 3.10* 0.99
Fall reading score (High 1/3)Low 1/3 1.00* 0.20Middle 1/3 0.79* 0.18
Lapse1 9.02* 0.78
Level-1 Interactions, 2-wayAide*Race/ethnicity:Black, non-Hispanic –0.58 0.74Aide*Race/ethnicity: Hispanic –0.31 0.64Aide*Race/ethnicity: Asian 0.34 1.02Aide*Race/ethnicity: Other 0.79 0.98Program type*Race/ethnicity: Black, non-Hisp. –1.92* 0.62Program type*Race/ethnicity: Hispanic –0.52 0.73Program type*Race/ethnicity: Asian 0.15 1.11Program type*Race/ethnicity: Other –1.27 0.86
Level-1 Interactions, 3-wayRace/ethnicity: Black, nH*Program type*Aide 1.76* 0.89Race/ethnicity: Hisp.*Program type*Aide 1.47 0.95Race/ethnicity: Asian*Program type*Aide –0.94 1.43Race/ethnicity: Other*Program type*Aide 1.06 1.25
* p<.05
1Lapse refers to the length of time between assessments. See page 52 for details.
NOTE: “More” time for reading instruction is defined for full-day classes as spending at least 90 minutes a day, at least 3 times a week onreading instruction. For half-day, this is defined as spending at least 60 minutes a day, at least 3 times a week on reading instruction.Estimates are based on public school, first-time kindergarten children attending a regular kindergarten program (no transitional or multi-grade classes). Only children who stayed with the same teacher in both the fall and spring and who are assessed in English in both falland spring are included in the analysis.
SOURCE: U.S. Department of Education, National Center for Education Statistics, Early Childhood Longitudinal Study, Kindergarten Class of1998–99; Teacher Questionnaires, Parent Interview, and Child Assessment, Base-Year Public-Use data.
Cognitive Gains of Public School Children in Full-day and Half-day Kindergarten Classes

Full-day and Half-day Kindergarten in the United States58
reading score gains occurring within each class acrossthe measured child characteristics. Children fromhouseholds with incomes below the poverty thresh-old make slightly smaller gains compared to thosewith incomes at or above this threshold (B=–1.04,effect size =.17). Boys make slightly smaller gainscompared with girls (B=–.73, effect size =.12). Olderfirst time kindergartners make greater gains com-pared to those that are younger. Children in thebottom 1/3 and middle 1/3 of the fall score distri-bution make slightly greater gains compared to thosein the top 1/3 of the distribution (B=1.00, effectsize =.17, and B=.79, effect size =.13, respectively).This finding might be interpreted to suggest a ceil-ing effect in the assessment, but given that the as-sessment is adaptive and is designed to cover kin-dergarten and first-grade skills and the scores areIRT-scaled, this interpretation is unlikely. There isno evidence of a ceiling effect for the ECLS-K as-sessments from a psychometric perspective (Rockand Pollack 2002). It may be that this finding re-flects a real difference in the gains made by chil-dren at various ability levels. Perhaps the childrenwho begin the kindergarten year already possessingmany kindergarten-level skills and abilities makerelatively smaller gains during the year because in-structional time is devoted to teaching these kin-dergarten skills to the general class and to bringingup the achievement level of those that are laggingbehind.
No tested interaction effects were significantwith the exception of the one discussed with class-room aides above (program type x aide x race/ethnicity, Black) and a two-way interaction embed-ded within it (program type x race/ethnicity,Black).39 The positive effect associated with full-day kindergarten is consistent when examined by
poverty status, age, initial fall reading score, sex,class size and use of reading groups.40
Variance components of reading scoregains
Children in the same class tend to be more alikethan those not in the same class, and classes in thesame school are more alike than classes from differ-ent schools. Another way to examine the relation-ship of the child and class characteristics to the read-ing gain scores is to first look at how much variancein the gain scores occurs at each level (childrenwithin classes, classes within schools, and betweenschools) and then look at how much of the varianceat each level can be attributed to these sets of childand class characteristics. The variance of the read-ing gain scores is initially partitioned into compo-nents associated with each level of the nested dataincorporating information identifying children thatare in the same class and classes that are in the sameschool but not incorporating child and class char-acteristic information. This is the unconditional(null) three-level model. The variance componentsassociated with the null model show the amount ofvariance attributed to the nested structure of thedata and these components can be expressed as a
40If ‘program type x poverty status, below’ were added tothe model shown in table 5, it would have anunstandardized coefficient of 0.33 and a standard error of0.41 with a p-value of .430. If ‘program type x age’ wereadded to the model shown in table 5, it would have anunstandardized coefficient of –2.30 and a standard error of2.57 with a p-value of .372. If program type x fall readingscore variables were added to the model shown in table 5,‘program type x fall reading score, low 1/3’ would have anunstandardized coefficient of 0.01 and a standard error of0.50 with a p-value of .989 and ‘program type x fall readingscore, mid 1/3’ would have an unstandardized coefficient of–0.14 and a standard error of 0.48 with a p-value of .766. Ifprogram type x class size variables were added to the modelshown in table 5, ‘program type x class size, small’ wouldhave an unstandardized coefficient of 0.05 and a standarderror of 0.75 with a p-value of .942 and ‘program type xclass size, medium’ would have an unstandardizedcoefficient of 0.33 and a standard error of 0.41 with ap-value of .430. If ‘program type x instructional groups forreading, yes’ were added to the model shown in table 5, itwould have an unstandardized coefficient of –0.10 and astandard error of 0.50 with a p-value of .839.
39The interpretation of this significant two-way interactionsuggests that the positive difference in gain scores associ-ated with full-day programs is not found for Black childrento the same degree as is found for White children. Theinterpretation of the three-way interaction (illustrated infigure 30), however, incorporates and supersedes theinterpretation of the lower-order interaction.

59
Table 6. Variance components of the null model, the intermediate model with only childcharacteristics, and the final model with child and class characteristics; kindergartenreading score gains: Fall 1998 to spring 1999
percent of the total. After the null model is exam-ined, the variance components for a model withjust the child characteristics is examined and thenone for the final model with both the child andclass characteristics is examined. Comparing thesecomponents allows the effects of the characteristicsto be evaluated in terms of the portion of variancethat is explained at each level. Table 6 presents thevariance components for each level in the simplest“null” model analysis with no characteristics, themodel including only child characteristics, and thefinal model with both child and class characteris-tics.
Examining the variance components for the nullmodel in comparison to the total amount of vari-ance in the null model (35.65), we see that 78 per-cent ((27.95/35.65)*100) of the total variance inreading gain scores is due to variation between chil-dren within classes, 8 percent ((3.02/35.65)*100)is due to class variation within schools and 13 per-cent ((4.68/35.65)*100) is due to variation betweenschools. Comparing the variance components be-tween the null model and the model with only childvariables provides an indication of the amount ofvariance at each level that is accounted for by thesechild variables. Only a small portion of the between
child (1 percent) or between class variance (3 per-cent) is explained by the child variables in the model,but 28 percent of the school level variance (((4.68–3.39)/4.68)*100) is accounted for by introduc-ing the child-level characteristics. The reduction ofschool-level variance due to child-level variables islikely a result of the homogeneity within schools(and within the classes in each school) of these in-fluential child variables. Children within a schooloften share many of the same characteristics, so arelationship between these child variables and read-ing score gains is likely to explain some of the varia-tion between schools.
Comparing the variance components betweenthe model that includes the child variables and thefinal model examines the proportion of variation inreading score gains that is explained by class char-acteristics after accounting for the variance at alllevels due to the child level characteristics. Classcharacteristics explain no variation in reading gainsscores between classes within a school but accountfor about 18 percent (((3.39–2.77)/3.39)*100) ofthe variation of reading score gains between schools(after having already accounted for the effect of thechild characteristics). This reduction in the school-level variance due to these class-level characteristics
Final model withModel with child child and class
Level Null model characteristics only characteristics
1) Between children within classes 27.95 27.54 27.292) Between classes within schools 3.02 2.93 2.983) Between schools 4.68 3.39 2.77
Total 35.65
NOTE: Estimates are based on public school, first-time kindergarten children attending a regular kindergarten program (no transitional ormulti-grade classes). Only children who stayed with the same teacher in both the fall and spring and who are assessed in English in boththe fall and the spring are included in the analysis.
SOURCE: U.S. Department of Education, National Center for Education Statistics, Early Childhood Longitudinal Study, Kindergarten Class of1998–99; Teacher Questionnaires, Parent Interview, and Child Assessment, Base-Year Public-Use data.
Cognitive Gains of Public School Children in Full-day and Half-day Kindergarten Classes

Full-day and Half-day Kindergarten in the United States60
is due to the fact that these class characteristics aregenerally the same for classes within the same school.Only 7 percent of the schools have both a full-dayand half-day class. Thus, program type, while mea-sured at the class level, is acting much like a school-level variable so its effect on reading gains shows upas explaining between school variance. Similarly,schools that provide paid aides or that have largeclass sizes tend to have these characteristics in mostor all classes and the effects associated with theseclassroom features will have an impact on school-level variance. This analysis shows that the averagereading gain score differences among public schoolscan partly be explained by whether that school of-fers full-day or half-day classes, as well as the kin-dergartens’ class sizes, and time allotted for reading
instruction.
Findings: Mathematics score gainsThe average mathematics score gain from fall
to spring for public school, first-time kindergart-ners in this analysis is 8.19 score points and thestandard deviation of these scores is 5.00. Fifty-ninepercent of the children in this analysis have math-ematics gain scores within one standard deviationaway from the average (between 3.19 and 13.19).Ninety percent of the mathematics gains scores fallbetween 0.91 and 17.05. In order to determine ifprogram type is differentially related to mathemat-ics score gains for different groups of children (i.e.,race/ethnicity, sex, initial reading ability, povertystatus) or for classrooms with other characteristics(e.g., class size, presence of a classroom aide, use ofachievement groups), many interactions are tested.41
The model for mathematics has fewer significanteffects and is a simpler model than the one for read-ing. Table 7 shows the regression coefficients, stan-dard errors and p-values for the class and child char-acteristics that are associated with differences inmathematics score gains.42
Class characteristics and mathematicsscore gains
The level-2 (between class) portion of the mul-tilevel model investigated the differences in eachclass’ mean mathematics score gain as a function ofclass characteristics while adjusting for other vari-ables in the model. Neither time for math instruc-tion, achievement groups, class size nor instructionalaides are significantly related to mathematics gainscores.43 Program type is the only class characteris-tic included in the model.
Program type: After accounting for other childand class variables in the model, mathematics scoregains are related to program type. Public schoolfirst-time kindergartners in full-day classes makegains in their mathematics scores from fall to springthat are, on average, about one point larger thanthe gains made by children in half-day classes(B=1.11, s.e.=.17). Given that the standard devia-tion of these scores is 5.00, this difference repre-sents 22 percent of a standard deviation (effectsize=0.22). Program type does not interact withchild characteristics indicating that the effect ongains in mathematics achievement is uniform forchildren from different race/ethnicity groups, chil-dren above and below the poverty threshold, andfor children that begin the year with different
43If ‘relative time for mathematics’ were added to the modelshown in table 7, it would have an unstandardizedregression coefficient of –0.18 and a standard error of 0.21with a p-value of .397. If ‘achievement grouping formathematics, yes’ were added to the model shown in table 7,it would have an unstandardized regression coefficient of –0.04 and a standard error of 0.20 with a p-value of .823. Ifclass size variables were added to the model shown in table 7,‘class size, small’ would have an unstandardized regressioncoefficient of 0.47 and a standard error of 0.29 with a p-value of .107 and ‘class size, medium’ would have anunstandardized regression coefficient of 0.47 and a standarderror of 0.25 with a p-value of .056. If ‘instructional aide,yes’ were added to the model shown in table 7, it wouldhave an unstandardized regression coefficient of –0.05 anda standard error of 0.19 with a p-value of .793.
41The main effects and interaction terms tested in theseanalyses are selected based on the research literaturementioned in this report and on prior analyses done withthe ECLS-K data.42See the technical appendix for further details about theHLM analyses.

61Cognitive Gains of Public School Children in Full-day and Half-day Kindergarten Classes
Table 7. Multilevel regression model relating mathematics score gains of public school first-time kindergartners to child and class characteristics: Fall 1998 to spring 1999
UnstandardizedFixed effect (Reference group) regression coefficient (B) Standard errors
Intercept 1.07 0.66
Level-2 Class characteristicsLength of kindergarten day (Half-day)
Full-day 1.11* 0.17
Level-1 Child characteristicsPoverty Status (At or above)
Below poverty threshold –0.58* 0.16
Race/ethnicity (White, non-Hispanic)Black, non-Hispanic –1.53* 0.19Hispanic –0.37 0.22Asian 0.44 0.35Other –0.74* 0.30
Fall mathematics score (High 1/3)Low 1/3 –0.21 0.17Middle 1/3 0.43* 0.18
Lapse1 6.69* 0.64
* p<.05.
1Lapse refers to the length of time between assessments. See page 52 for details.
NOTE: “More” time for mathematics instruction is defined for full-day classes as spending at least 60 minutes a day, at least 3 times a weekon mathematics instruction. For half-day, this is defined as spending at least 30 minutes a day, at least 3 times a week on mathematicsinstruction. Estimates are based on public school, first-time kindergarten children attending a regular kindergarten program (not atransitional or multi-grade class). Only children who stayed with the same teacher in both the fall and spring and who are assessed inEnglish in both fall and spring are included in the analysis.
SOURCE: U.S. Department of Education, National Center for Education Statistics, Early Childhood Longitudinal Study, Kindergarten Class of1998–99; Teacher Questionnaires, Parent Interview, and Child Assessment, Base-Year Public-Use data.

Full-day and Half-day Kindergarten in the United States62
ability levels in math.44 Additionally, program typedoes not interact with other class-level variableswhich indicates that the smaller average gains madeby those in half-day classes is not mitigated by be-ing in a smaller class or in a class with an instruc-tional aide or in a class that uses mathematics in-structional grouping.45
Child characteristics and mathematicsscore gains
The level-1 (within-class) portion of the modelinvestigates the differences in mathematics scoregains for children in each class as a function of a setof child characteristics. The regression coefficientsrepresent the differences in mathematics score gainsoccurring within each class across the measuredchild characteristics. As found with the model ofreading score gains, children from households with
incomes below the Federal poverty threshold makeslightly smaller gains in mathematics scores com-pared to those living at or above this threshold(B=–0.58, effect size =.12). Black children makesmaller gains in mathematics during the year com-pared to White children (B=–1.53, effect size =.31)and children from “other” race/ethnicity groups(this group includes Native Hawaiians and otherPacific Islanders, American Indians, Alaska Nativesand multi-racial children) make slightly smallergains compared to White children (B=–0.74,effect size =.15). Children in the middle 1/3 of thefall score distribution make greater gains comparedto those in the top 1/3 of the distribution (B=.43,effect size =.09). There are no significant differencesin score gains between boys and girls.46
Variance components of mathematicsscore gains
Table 8 presents the variance components foreach level in the simplest “null” model analysis withno characteristics, in the model with just the childcharacteristics, and in the final model with the childand class variables.
Examining each of the variance components forthe null model in comparison to the total variancein the null model (25.02) we see that 83 percent((20.80/25.02)*100) of the variance in mathemat-ics score gains is due to variation between childrenwithin classes, 7 percent ((1.79/25.02)*100) is dueto class variation within schools and 10 percent((2.43/25.02)*100) is due to variation betweenschools. When comparing variance componentsbetween the null model and the model with onlychild variables, about 8 percent of class level vari-ance is explained by the child variables in themodel (((1.79–1.64)/1.79)*100), and 26 percent(((2.43–1.80)/2.43)*100) of the school level vari-ance is accounted for by introducing these child-level characteristics.
Comparing the variance components betweenthe model with only child variables and the finalmodel shows the proportion of variation in math-ematics score gains that is explained by class char-acteristics after accounting for the variance at all
46If ‘sex, male’ were added to the model shown in table 7, itwould have an unstandardized regression coefficient of 0.19and a standard error of 0.15 with a p-value of .193.
44If program type x race/ethnicity variables were added tothe model shown in table 7 ‘program type x race/ethnicity,Black’ would have an unstandardized regression coefficientof –0.56 and a standard error of 0.52 with a p-value of.286; ‘program type x race/ethnicity, Hispanic’ would havean unstandardized regression coefficient of –0.03 and astandard error of 0.54 with a p-value of .955; ‘program typex race/ethnicity, Asian’ would have an unstandardizedregression coefficient of 0.77 and a standard error of 0.78with a p-value of .321; ‘program type x race/ethnicity,other’ would have an unstandardized regression coefficientof 0.31 and a standard error of 0.73 with a p-value of .667.If ‘program type x poverty status’ were added to the modelshown in table 7, it would have an unstandardized regressioncoefficient of –0.61 and a standard error of 0.37 with a p-valueof .102. If program type x fall mathematics score variables wereadded to the model shown in table 7 ‘program type x fallmathematics score, low 1/3’ would have an unstandardizedregression coefficient of 0.43 and a standard error of 0.42 witha p-value of .313; ‘program type x fall mathematics score, mid1/3’ would have an unstandardized regression coefficient of0.70 and a standard error of 0.43 with a p-value of .102.45If program type x class size variables were added to themodel shown in table 7 ‘program type x class size, small’would have an unstandardized regression coefficient of–0.29 and a standard error of 0.64 with a p-value of .651and ‘program type x class size, medium’ would have anunstandardized regression coefficient of 0.22 and a standarderror of 0.54 with a p-value of .672. If ‘program type xinstructional aide, yes’ were added to the model shown intable 7, it would have an unstandardized regressioncoefficient of 0.64 and a standard error of 0.42 with ap-value of .128. If ‘program type x instructional groups formathematics, yes’ were added to the model shown in table7, it would have an unstandardized regression coefficient of–0.43 and a standard error of 0.43 with a p-value of .318.
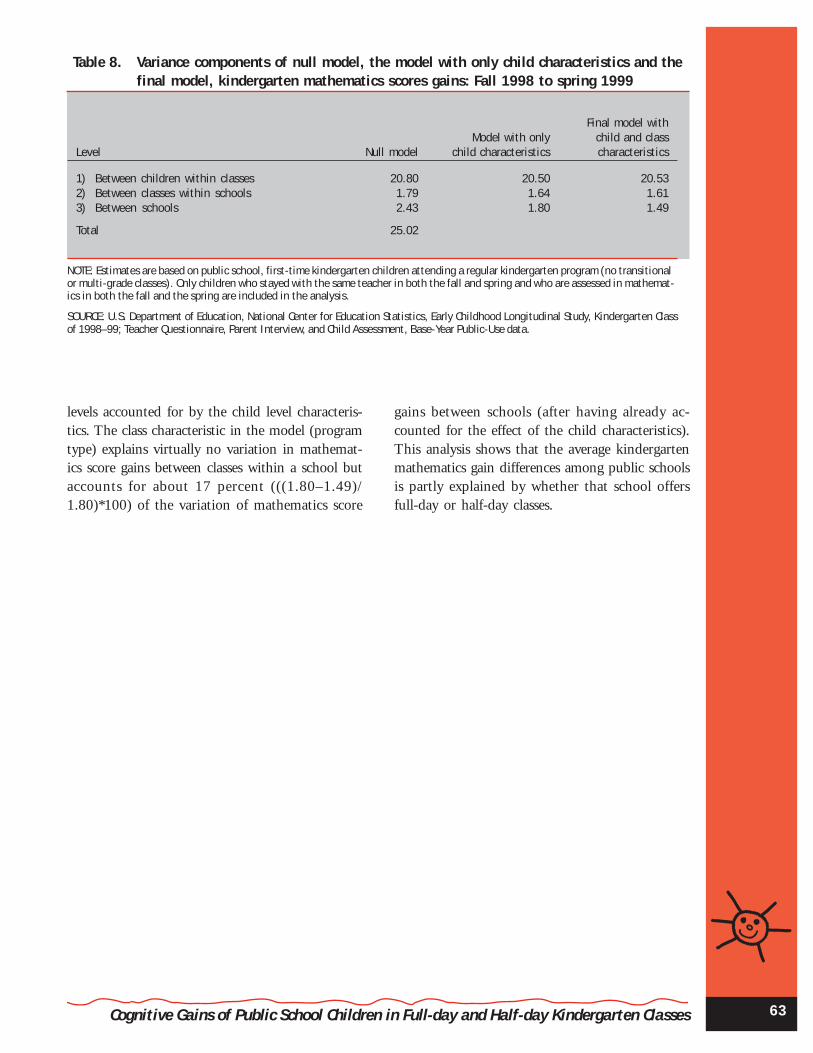
63Cognitive Gains of Public School Children in Full-day and Half-day Kindergarten Classes
Table 8. Variance components of null model, the model with only child characteristics and thefinal model, kindergarten mathematics scores gains: Fall 1998 to spring 1999
Final model withModel with only child and class
Level Null model child characteristics characteristics
1) Between children within classes 20.80 20.50 20.532) Between classes within schools 1.79 1.64 1.613) Between schools 2.43 1.80 1.49
Total 25.02
NOTE: Estimates are based on public school, first-time kindergarten children attending a regular kindergarten program (no transitionalor multi-grade classes). Only children who stayed with the same teacher in both the fall and spring and who are assessed in mathemat-ics in both the fall and the spring are included in the analysis.
SOURCE: U.S. Department of Education, National Center for Education Statistics, Early Childhood Longitudinal Study, Kindergarten Classof 1998–99; Teacher Questionnaire, Parent Interview, and Child Assessment, Base-Year Public-Use data.
levels accounted for by the child level characteris-tics. The class characteristic in the model (programtype) explains virtually no variation in mathemat-ics score gains between classes within a school butaccounts for about 17 percent (((1.80–1.49)/1.80)*100) of the variation of mathematics score
gains between schools (after having already ac-counted for the effect of the child characteristics).This analysis shows that the average kindergartenmathematics gain differences among public schoolsis partly explained by whether that school offersfull-day or half-day classes.


65
Summary and Discussion
Schools that offer full-day andhalf-day kindergarten
In the 1998–99 school year, 61 percent of allU.S. schools that have a kindergarten program offerat least one full–day kindergarten class. This per-cent, however, is not uniform across different schooltypes, and across different regions of the UnitedStates. Full-day programs are most prevalent inCatholic schools (78 percent). There is also a largeregional difference—84 percent of public schools inthe southern region of the country provide a full-dayprogram. The percent of schools that offer full-dayprograms is also related to schools’ enrollment of “at-risk” children. Both private and public schools thatserve high concentrations of minority children aremore likely to provide full-day programs comparedwith those with a smaller minority enrollment.Among public schools, schools where more than halfof the student enrollment qualifies for free or reduced-priced lunch are more likely to offer a full-day pro-gram compared to those with a smaller percent oflow-income children.
Children enrolled in full-day andhalf-day kindergarten
Overall, 56 percent of kindergarten children at-tend a full-day program. Fifty-four percent of publicschool kindergarten children attend a full-day pro-gram. In public schools, Black children are attend-ing full-day programs at a higher rate than White,Asian or Hispanic kindergartners. Additionally, pub-lic school kindergartners whose family income is be-low the federal poverty threshold are attending full-day programs at a higher rate (62 percent) than thosefrom more affluent families (51 percent). The find-ings for Black children and economically disadvan-taged children are consistent with what is expectedgiven the fact that some state and local districts offerfull-day programs as a way to ease the child care needsof families who are least able to afford quality after-school programs and as a way to provide “at-risk”children with more time during the kindergarten yearto acquire the beginning reading and mathematicsskills necessary to succeed in school. However, not
all “at-risk” groups of children are attending full-dayprograms at relatively high rates. Compared to 79percent of Black public school kindergarten childrenand 62 percent of public school kindergartners liv-ing in poverty attending full-day kindergarten, 46percent of public school Hispanic kindergartners and45 percent of public school kindergartners fromhomes where English is not the primary languageattend full-day programs.
Among private schools, 77 percent of kindergart-ners in Catholic schools and 65 percent in other pri-vate schools attend a full-day program. Black chil-dren in these schools are more likely to attend a full-day program compared to White children but pov-erty status and home language are not related to full-day enrollment rates.
Class composition and structurein full-day and half-day publickindergartens
The difference in the composition of public full-day kindergarten classes compared to half-day classesmirrors the pattern seen in the child-level enrollmentfindings. Full-day classes’ average percent minority(46 percent) is higher than it is in half-day classes(35 percent). Thirty percent of full-day classes havemore than 75 percent minority enrollment comparedto 19 percent of half-day classes. The same patternin not evident for limited-English proficient students.The majority of both full-day and half-day classesare being taught by White teachers (80 and 87 per-cent, respectively), but a higher percent of full-dayclasses are taught by Black teachers (10 percent) com-pared to half-day classes (2 percent). The teachers infull-day and half-day classes have similar educationlevels and are equally likely to be fully certified. Full-day teachers, however, are more likely to have theircertification in the area of early childhood educa-tion.
The average number of children in full-day classes(20.3) is higher than in half-day classes (19.1) butlarge classes (more than 25 children) are uncommonin both full-day (10 percent) and half-day classes (7percent). Classroom instructional aides are more
Chapter 6:

Full-day and Half-day Kindergarten in the United States66
prevalent in full-day classes. Sixty-one percent offull-day classes and 44 percent of half-day classeshave an aide who works directly with the childrenon instructional tasks.
Instructional activities in full-dayand half-day public kindergarten
Teachers in full-day kindergarten classes orga-nize instruction in much the same way as teachersin half-day classes. Full-day kindergarten classesspend, on average, more time each day on teacher-directed whole class, small group, and individualactivities and they spend more time on child-se-lected activities. However, the percent of their totaltime spent in each type of activity is similar be-tween full-day and half-day classes. Strategies forgrouping children are also similar in full-day andhalf-day classes with teachers using mixed-levelgroups as the most common strategy in both typesof classes. Full-day classes, however, are more likelyto have achievement groups for reading and math-ematics instruction compared with half-day classes.
A large majority of both full-day and half-dayclasses have reading and language arts activities ev-ery day (97 and 96 percent, respectively). How-ever, full-day classes are more likely to spend timeeach day on other subjects—math, social studies,and science, compared with half-day classes. Amongthe four art and music subjects that teachers werequestioned about—art, music, dance/creative move-ment, and theater/creative dramatics—only art isdone everyday in a larger percent of full-day classes(30 percent) compared to half-day classes (21 per-cent). Music is taught daily in a smaller percent offull-day classes (30 percent) compared to half-dayclasses (36 percent).
The relative order of the skills and activitieschildren spend time on within the domains of read-ing/language arts and mathematics is very similarfor full-day and part day classes; the most commonskills and activities in full-day classes are generallythe most common in half-day classes. Almost allspecific skills and activities are more often covereddaily in full-day classes compared with half-dayclasses with some of the exceptions being those donedaily by a large majority of both types of classes(e.g., calendar activities and counting out loud).
It is interesting to note that while teachers of73 percent of half-day classes reported having math-
ematics every day, 93 percent report having calen-dar activities every day and 81 percent have thechildren count aloud (which may often be a part ofthe calendar activity) every day. It seems that whilehalf-day classes are less likely to have formal dailymath instruction compared with full-day classes (73vs. 90 percent), math concepts are being presentedeach day in many of these half-day classes in theform of common kindergarten opening or daily“circle time” routines.
While there are many skills and activities that alarger percent of full-day classes spend time on eachday compared with half-day classes, these differ-ences may simply be attributed to the fact that full-day classes have the time to devote to a greater num-ber of separate skills and activities. The differencesin the percent of classes that spend time on specificskills and activities at least weekly (either daily orweekly) may be a more useful comparison for de-scribing differences in the curricular focus betweenfull-day and half-day kindergarten classes. Withinthe reading/language arts domain (reading, writ-ing, and expressive and receptive language), thepercent of full-day classes that engage in a skill oractivity at least weekly exceeds the percent of half-day classes for 19 out of the 36 skills and activitiesexamined. Some of the reading activities and skillsthat are more likely to be part of at least a weeklyroutine in full-day classes are typically consideredmore advanced than the traditional kindergarten read-ing curriculum (e.g., reading aloud fluently, readingmulti-syllable words, and alphabetizing).47 Nine outof the 11 writing skills and activities are done weeklyin more full-day classes compared to half-day classes(e.g., writing in journal, writing stories and reports,and conventional spelling). Among the 37 skills andactivities examined in the mathematics domain,there are 29 in which the percent of full-day classesengaged in the skill or activity at least weekly ex-ceeds the percent of half-day classes. Many of theseare activities or skills that involve solving mathemat-ics problems (e.g., explain how a math problem is
47Comparisons of public school kindergarten and first-gradeactivities and skills show that a higher percent of first-gradechildren compared to kindergartners engage in these atleast once a week (reading aloud fluently, 98 vs. 44 percent;reading multi-syllable words, 84 vs. 36 percent; andalphabetizing, 66 vs. 18 percent) (unpublished tables,ECLS-K kindergarten and first-grade longitudinal file).
67
solved, solve a real-life math problem, and solve mathproblems on the chalkboard). Additionally, someof these mathematics skills and activities are onesmore typically part of a first-grade curriculum (e.g.,recognizing fractions, telling time, and writing num-bers from 1–100).48
Children in full-day kindergarten classes arespending some of the time focused on learning manyof the same things and doing many of the sametypes of learning activities as those in half-day classes,but some full-day kindergarten classes are spend-ing the “extra time” during the day exposed to moreadvanced reading, writing, and mathematics skills.
Full-day and half-day children’sgains in cognitive skills andknowledge
The ECLS-K children were assessed in the falland in the spring of the kindergarten year in bothreading/language arts and in mathematics. Theachievement gains made during the year are com-pared for English-speaking, first-time kindergart-ners in full-day and half-day public kindergartenclasses. Given the non-experimental, pretest-posttestdesign of the study, there is no way to determine ifthe samples were equivalent in all important waysat the beginning of the kindergarten year. This is aresearch design limitation which makes it impos-sible to draw causal conclusions from this data. Thechildren enrolled in a full-day program make greatergains in reading language arts over the course of thekindergarten year compared to those in half-dayclasses. The differences in achievement gains asso-ciated with program type are not only apparentwhen simple comparisons of gains are made, theypersist when the comparisons of gains take into ac-count other influential child and class characteris-tics. The findings from multi-level regression analy-ses indicate that children in full-day kindergartenclasses make greater gains in both reading andmathematics compared to those in half-day classes,
while accounting for gain score differences associ-ated with race/ethnicity, poverty status, initial abil-ity, sex, class size, amount of time for subject areainstruction, and the presence of an instructionalaide. These findings support prior research that at-tributes full-day kindergarten to greater academicprogress.
The results presented in chapter five indicatethat public school, first-time kindergarten childrenin full-day classes are making greater gains in read-ing/language arts and in mathematics achievement.As found in other studies, children in a full-daykindergarten program generally make greater gainsin both reading and math compared to childrenin half-day kindergarten.
Controlling for the characteristics included inthis study, Black children make substantially largerreading gains in full-day classes with an aide com-pared to those in full-day classes without an aide.While the study is not designed to support causalstatements, this finding certainly suggests the needfor further study about the use of instructional aidesto support achievement in different types of kin-dergarten programs. Further inquiry into how aidesare incorporated into daily instruction and whichchildren are being served by the classroom aidesmay help to understand the potential benefit thisclassroom resource might have.
Other class characteristics that were found tobe related to achievement gains in reading/languagearts in this study are class size and relative time forreading instruction. Children in kindergartenclasses with 25 or more children make smaller gainsin reading compared to children in classes with 18to 24 children. Children in classes that spend arelatively large part of the day on reading instruc-tion (more than 90 minutes in full-day classes ormore than 60 minutes per day in half-day classes)make greater gains in reading compared to chil-dren in those classes that spend less time on read-ing instruction. Time for math instruction, as de-fined for these analyses, is not similarly related tomath gains. The use of achievement groups for read-ing or mathematics instruction is not related to thegains made in these two subject areas.
By examining the variance component struc-ture in these hierarchical models, the influence ofthe child and class characteristics in these models isbetter understood. After accounting for school-level
48 Comparisons of public school kindergarten and first-grade activities and skills show that a higher percent offirst-grade children compared to kindergartners engage inthese at least once a week (recognizing fractions, 32 vs. 6percent; telling time, 72 vs. 40 percent; and writing numbersfrom1–100, 41 vs. 18 percent) (unpublished tables, ECLS-Kkindergarten and first-grade longitudinal file).
Summary and Discussion

Full-day and Half-day Kindergarten in the United States68
variance that is explained by characteristics of thechildren in each school, a substantial percent of thevariation between average gains made from schoolto school is explained by the characteristics of thekindergarten classes in these school. Eighteen per-cent of variation in the average reading gains be-tween schools is explained by program type, classsize and frequency of reading instruction. Seven-teen percent of the variation in the average math-ematics gains between schools is explained by pro-gram type.
This report describes achievement gains madeduring the year by classroom differences and sup-ports past findings that children in full-day kin-dergarten make greater achievement gains thanthose in half-day kindergarten. There are, however,important features of kindergarten programs beyondthose examined in this study. Future research onthe relationship between gains and kindergartenclassroom characteristics could look at many of thespecific instructional practices described in chapterfour. It may be that some of the curriculum differ-ences found between half-day and full-day classescan be explained by demographic differences asso-ciated with program type rather than program typealone. Moreover, the finding reported in chapterfive that children in the top third of the fall kinder-
garten reading scores make smaller overall readinggains during the year compared to other childrencould be further investigated by examining the fre-quency that these children are being taught themore advanced reading and language arts skills.
All children, regardless of child, family and class-room characteristics, are learning new skills andabilities in reading and math during the kindergar-ten year. This study suggests that public school full-day kindergarten is associated with larger readingand math gains but does not specify which knowl-edge and skills are being learned in kindergarten.In addition to the scale scores provided in the ECLS-K data, there are also 5 proficiency scores in read-ing (e.g., letter recognition, beginning and endingsounds) and 5 proficiency scores in math (e.g., num-ber and shape, relative size, and ordinality/sequence)that are used to provide a more descriptive pictureof the gains being made. These ECLS-K scores havebeen used to describe detailed differences in skillattainment by child, family and class characteris-tics (West, Denton, and Reaney 2001). Future re-search about full-day kindergarten should explorethe relationships between the specific skills differ-ent groups of children learn during the kindergar-ten year and program type.

69
References
Achilles, C. M., Harmon, P., and Egelson, P. (1995). Using Research Results on Class Size to Improve PupilAchievement Outcomes. Research in the Schools, 2(2): 23–30.
Cryan, J., Sheehan, R., Wiechel, J., and Bandy-Hedden, I. G. (1992). Success Outcomes of Full-dayKindergarten: More Positive Behavior and Increased Achievement in the Years After. Early ChildhoodResearch Quarterly, 7(2): 187–203.
Donahue, P. L., Finnegan, R. J., Lutkus, A. D., Allen, N. L., and Campbell, J. R. (2001). The Nation’sReport Card: Fourth-Grade Reading 2000, (NCES 2001–499). U.S. Department of Education. Office ofEducational Research and Improvement. National Center for Education Statistics. Washington, DC:U.S. Government Printing Office.
Elicker, J., and Mathur, S. (1997). What Do They Do All Day? Comprehensive Evaluation of A Full-DayKindergarten. Early Childhood Research Quarterly, 12: 459–480.
Finn, J. D., Gerber, S. B., Achilles, C. M., and Boyd-Zaharias, J. (2001). The Enduring Effects of SmallClasses. Teachers College Record, 103(2): 145–183.
Finn, J. D., and Achilles, C. M. (1999). Tennessee Class Size Study: Findings and Misconceptions.Educational Evaluation and Policy Analysis, 21(2): 97–109.
Fusaro, J. A. (1997). The Effect of Full-Day Kindergarten on Student Achievement: A Meta-Analysis. ChildStudy Journal, 27(4): 269–277.
Galley, M. (2002). State Policies on Kindergarten are All Over the Map. Education Week, 21(17): 45.
Gerber, S., Finn, J., Achilles, C., and Boyd-Zaharias, J. (2001). Teacher Aides and Students’ AcademicAchievement. Educational Evaluation and Policy Analysis, 23(2): 123–143.
Germino-Hausken, E., Walston, J., and Rathbun, A. (2003). Kindergarten Teachers. (NCES 2004–060).Washington, DC: National Center for Education Statistics.
Gottman, J. M., and Rushe, R. H. (1993). The Analysis of Change: Issues, Fallacies and New Ideas. Journalof Counseling and Clinical Psychology, 61,(6): 907–910.
Grissmer, D. (1999). Class Size Effects: Assessing the Evidence, Its Policy Implications, and Future Re-search Agenda. Educational Evaluation and Policy Analysis, 21(2): 231–248.
Gruber, K. J., Wiley, S. D., Broughman, S. P., Strizek, G. A., and Burian-Fitzgerald, M. (2002). Schools andStaffing Survey, 1999–2000: Overview of the Data for Public, Private, Public Charter, and Bureau of IndianAffairs Elementary and Secondary Schools, (NCES 2002–313). U.S. Department of Education, NationalCenter for Education Statistics. Washington, DC: U.S. Government Printing Office.
Gullo, D. F. (1990). The Changing Family Context: Implications for the Development of All-Day Kinder-garten. Young Children, 45(4): 35–39.
Gullo, D. F. (2000). The Long-Term Educational Effects of Half-Day vs. Full-Day Kindergarten. EarlyChildhood Development and Care, 160: 17–24.
Hair, J. F., Anderson, R. E., Tatham, R. L., and Black, W. C. (1998). Multivariate Data Analysis. UpperSaddle River, NJ: Prentice Hall.
Hanushek, E. A. (1999). Some Findings From an Independent Investigation of the Tennessee STAR Experi-ment and From Other Investigations of Class Size Effects. Education Evaluation and Policy Analysis, 21(2):143–163.

Full-day and Half-day Kindergarten in the United States70
Heaviside, S., and Farris, E. (1993). Public School Kindergarten Teachers’ Views on Children’s Readiness forSchool. (NCES 93–410). U.S. Department of Education, National Center for Education Statistics. Wash-ington, DC: U.S. Government Printing Office.
Hirsch, E. D. (1996). The Schools We Need: And Why We Don’t Have Them. New York, NY: Doubleday.
Karweit, N. (1989). Effective Kindergarten Programs and Practices for Students at Risk. In R. E. Slavin, N.L. Karweit, & N. A. Madden (Eds.), Effective Programs for Students at Risk (pp. 103–142). Boston, MA:Allyn & Bacon.
Maris, E. (1998). Covariance adjustment versus gain scores—Revisited. Psychological Methods, 3(3): 309–327.
Molnar, A., Smith, P., Zahorik, J., Palmer, A., Halbach, A., and Ehrle, K. (1999). Evaluating the SAGEProgram: A Pilot Program in Targeted Pupil-Teacher Reduction in Wisconsin. Educational Evaluationand Policy Analysis, 21(2): 165–177.
Morrow, L. M., Strickland, D. S., and Woo, D. G. (1998). Literacy Instruction in Half-day and Whole-dayKindergarten. Newark, DE: International Reading Association Inc. and the National Reading Confer-ence.
National Center for Education Statistics. (2001). Early Childhood Longitudinal Study, Kindergarten Class of1998–99: Base-Year Public-Use Data Files User’s Manual. (NCES 2001–029). Washington, DC: U.S.Government Printing Office.
Nye, B., Hedges L. V., and Konstantopoulos, S. (1999). The Long-Term Effects of Small Classes: A FiveYear Follow-Up of the Tennessee Class Size Experiment. Educational Evaluation and Policy Analysis, 21(2):127–142.
Nyhan, R. C., and Alkadry, M. G. (1999). The Impact of School Resources on Student Achievement TestScores. Journal of Education Finance, 26(2): 211–228.
Raudenbush, S. W., and Bryk, A. S. (2002). Hierarchical Linear Models: Applications and Data AnalysisMethods. Thousand Oaks: Sage Publications.
Rock, D. A., and Pollack, J. M. (2002). Early Childhood Longitudinal Study - Kindergarten Class of 1998–99(ECLS-K), Psychometric Report for Kindergarten Through First Grade. (NCES 2002–005). Washington,DC: U.S. Government Printing Office.
Rogosa, D. R., and Willett, J. B. (1983). Demonstrating the reliability of the difference score in themeasurement of change. Journal of Educational Measurement, 20(4): 335–343.
Rogers, J. L., Howard, K. I., and Vessey, J. T. (1993). Using Significance Tests to Evaluate EquivalenceBetween Two Experimental Groups. Psychological Bulletin, 113(3): 553–565.
Seastrom, M. M., Gruber, K. J., Henke, R., McGrath, D. J., and Cohen, B. A. (2002). Qualifications of thePublic School Teacher Workforce: Prevalence of Out-of-Field Teaching 1987–88 to 1999–2000. (NCES 2002–603). Washington, DC: National Center for Education Statistics.
Shepard, L. A., and Smith, M. L. (1988). Escalating Academic Demand in Kindergarten: Some Nonsolutions.Elementary School Journal, 89(2): 135–146.
West, J., Denton, K., and Reaney, L. (2001). The Kindergarten Year. (NCES 2001–023). Washington, DC:National Center for Education Statistics.
Williams, R. H., and Zimmerman, D. W. (1996). Are simple gain scores obsolete? Applied PsychologicalMeasurement, 20(1): 59–69.

71
Tables of Estimates
Table A2. Percent of U.S. schools that offer full-day and half-day kindergarten programs, byschool type and school characteristics: 1998–99
All schools Public PrivateFull- Half- Full- Half- Full- Half-
School characteristics day day day day day day
All schools 61 47 57 52 67 37
Region Northeast 50 57 37 73 70 30 Midwest 57 55 57 56 58 54 South 80 25 84 22 71 31 West 49 56 38 69 69 32
Location Large/mid-sized cities 68 41 64 49 73 31 Suburbs/large town 53 54 46 62 64 40 Small town/rural 61 44 63 43 56 48
School minority enrollment1
Less than 10% 51 55 48 58 54 49 10–24% 55 54 44 67 74 30 25–49% 65 44 63 48 ‡ ‡ 50–75% 71 38 69 42 ‡ ‡ 75% + 81 26 76 32 93 13
Concentration of low-income children in public schools2
0–49% — — 48 61 — — 50% + — — 69 41 — —
‡ Reporting standards not met.
— Not available.1All children who are not identified as White, non-Hispanic are classified as minority children.2A school’s concentration of poverty is based on a composite of free and reduced-priced lunch and participation in a “school-wide” TitleI program. This is calculated only for public schools with a kindergarten program.
NOTE: Percent offering full-day and half-day programs totals more than 100 because some schools have both full-day and half-day programs.
SOURCE: U.S. Department of Education, National Center for Education Statistics, Early Childhood Longitudinal Study, Kindergarten Class of1998–99; School Administrator Questionnaire and Kindergarten Teacher Questionnaires, Base-Year Public-Use Data Files.
Appendix A:
Table A1. Percent of U.S. schools that offer full-day and half-day kindergarten programs, byschool type: 1998–99
Full- Half- Full- Half- Full- Half- Full- Half-School characteristics day day day day day day day day
All schools 61 47 57 52 78 29 63 40
NOTE: Percent offering full-day and half-day programs totals more than 100 because some schools have both full-day and half-dayprograms.
SOURCE: U.S. Department of Education, National Center for Education Statistics, Early Childhood Longitudinal Study, Kindergarten Class of1998–99; School Administrator Questionnaire and Kindergarten Teacher Questionnaires, Base-Year Public-Use Data Files.
All schools Public Catholic
Otherprivate
Private

Full-day and Half-day Kindergarten in the United States72
Table A3. Percent of U.S. kindergarten children enrolled in a full-day kindergarten program,by school type and school characteristics: 1998–99
All OtherSchool characteristics kindergartners Public Catholic private
All kindergartners 56 54 77 65
RegionNortheast 48 41 81 71Midwest 47 45 71 38South 82 83 93 70West 31 23 52 79
LocationLarge and mid-sized cities 61 59 79 67Suburbs/large town 48 45 70 65Small town/rural 65 65 84 59
School minority enrollment1
Less than 10% 50 47 71 4710–24% 46 41 78 6925–49% 58 56 76 7550–74% 63 62 64 8475% or more 68 66 93 87
Concentration of low-income children inpublic schools2
0–49% — 43 — —50% or more — 65 — —
— Not available.
1All children who are not identified as White, non-Hispanic are classified as minority children.
2A school’s concentration of poverty is based on a composite of free and reduced-priced lunch and participation in a “school-wide”Title I program. This is calculated only for public schools with a kindergarten program.
SOURCE: U.S. Department of Education, National Center for Education Statistics, Early Childhood Longitudinal Study, Kindergarten Class of1998–99; School Administrator Questionnaire and Kindergarten Teacher Questionnaires, Base-Year Public-Use Data Files.

73Appendix A: Tables of Estimates
Table A4. Percent of U.S. kindergarten children enrolled in a full-day program, by school typeand child and family characteristics: 1998–99
All OtherChild and family characteristics kindergartners Public Catholic private
All kindergartners 56 54 77 65
Child’s sexMale 56 54 77 64Female 57 54 76 66
Mother’s educationLess than high school 58 58 79 77High school diploma or equivalent 59 58 81 60Some college, including vocational/technical 55 51 78 63Bachelor’s degree or higher 54 48 71 67
Primary language spoken in homeNon-English 48 45 82 78English 57 55 76 64
Child’s race/ethnicityWhite, non-Hispanic 52 49 74 59Black, non-Hispanic 80 79 96 91Hispanic 49 46 79 76Asian 46 40 71 75Hawaiian Native/Pacific Islander 73 72 55 91American Indian/Alaska Native 77 75 88 94More than one race, non-Hispanic 46 42 66 71
Diagnosed disabilityYes 57 56 78 59No 56 54 72 63
First time-kindergartnerYes 55 53 73 61No 69 68 72 75
Poverty status1
Below poverty threshold 63 62 80 78At or above poverty threshold 55 51 76 65
Child’s age at entry4 yrs, 8 mos — 4 yrs, 11 mos 48 42 79 705 yrs, 0 mos — 5 yrs, 3 mos 55 52 75 645 yrs, 4 mos — 5 yrs, 7 mos 56 54 77 685 yrs, 8 mos — 5 yrs, 11 mos 60 59 77 636 yrs, 0 mos — 6 yrs, 7 mos 61 59 76 61
1Poverty status is determined by comparing the child’s household income to the national poverty threshold.
SOURCE: U.S. Department of Education, National Center for Education Statistics, Early Childhood Longitudinal Study, Kindergarten Class of1998–99; School Administrator Questionnaire, Teacher Questionnaires and Parent Interviews, Base-Year Public-Use Data Files.

Full-day and Half-day Kindergarten in the United States74
Table A6. Percentage distribution of U.S. public kindergarten classes with various enrollmentcharacteristics, by program type: 1998–99
Class composition Full-day Half-day
All public school kindergarten classes 51 49
Percent minority1
0–10% 24 3411–25% 17 2026–75% 30 28More than 75% 30 19
Percent limited English proficient (LEP)0% 65 591–10% 14 1511–50% 15 16More than 50% 6 10
1All children who are not identified as White, non-Hispanic are classified as minority children.
NOTE: Detail may not sum to totals because of rounding.
SOURCE: U.S. Department of Education, National Center for Education Statistics, Early Childhood Longitudinal Study, Kindergarten Class of1998–99; Teacher Questionnaires and Parent Interviews, Base-Year Public-Use Data Files.
Table A5. Percent of U.S. public kindergarten children enrolled in a full-day program,by poverty status and primary home language: 1998–99
Child characteristics Below poverty At or abovethreshold poverty threshold
Primary home languageEnglish 68 52Non-English 43 46
SOURCE: U.S. Department of Education, National Center for Education Statistics, Early Childhood Longitudinal Study, Kindergarten Class of1998–99; Teacher Questionnaires and Parent Interviews, Base-Year files.

75
Table A7. Percentage distribution of various teacher characteristics in U.S. public kindergar-ten classes, by program type: 1998–99
Teacher characteristic Full-day Half-day
Teacher’s raceWhite, non-Hispanic 80 87Black, non-Hispanic 10 2Hispanic 7 7Other, non-Hispanic or multiracial 3 3
Teacher’s highest degreeBachelor’s 62 60Master’s 31 33Doctorate/Specialist 7 7
Teacher’s certificationEarly Childhood 61 47Elementary 85 90
Teacher’s certification typeOther than fully certified 10 12Fully certified 90 88
Years teaching kindergartenLess than 3 26 263–9 39 3410–19 23 2920+ 12 12
NOTE: Detail may not sum to totals because of rounding.
SOURCE: U.S. Department of Education, National Center for Education Statistics. Early Childhood Longitudinal Study, Kindergarten Class of1998–99, Kindergarten Teacher Questionnaires, Base-Year Public-Use Data File.
Appendix A: Tables of Estimates
Table A8. Percentage distribution of class sizes and percent of classes with classroom aides inU.S. public kindergarten classes, by program type: 1998–99
Class characteristic Full-day Half-day
All public school kindergarten classes 51 49
Class size levelsUp to 17 21 3118–24 62 5925+ 16 10
Classroom aidesRegular instructional aide 61 44Special ed. instructional aide 13 13English as a second language (ESL) instructional aide 9 7
NOTE: Detail may not sum to totals because of rounding. A class is classified as having an aide if the aide spends at least one hour per dayin the class working directly with the children in the class.
SOURCE: U.S. Department of Education, National Center for Education Statistics. Early Childhood Longitudinal Study, Kindergarten Class of1998–99; Kindergarten Teacher Questionnaires, Base-Year Public-Use Data File.
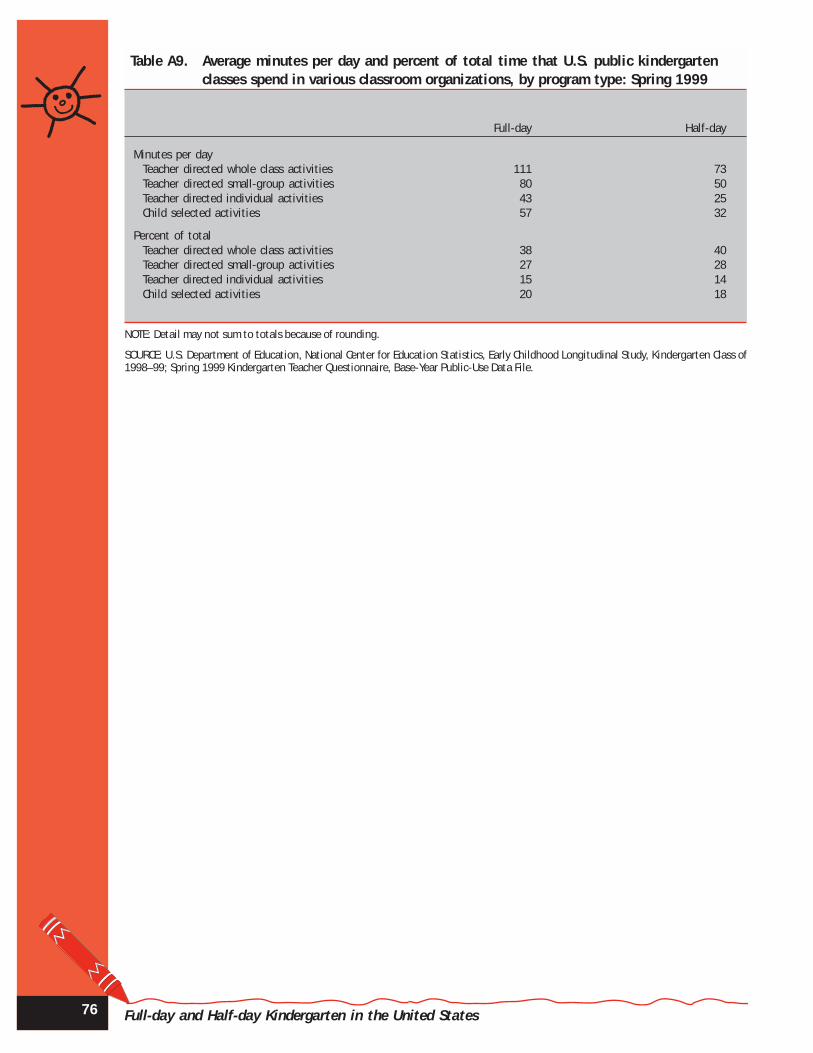
Full-day and Half-day Kindergarten in the United States76
Table A9. Average minutes per day and percent of total time that U.S. public kindergartenclasses spend in various classroom organizations, by program type: Spring 1999
Full-day Half-day
Minutes per dayTeacher directed whole class activities 111 73Teacher directed small-group activities 80 50Teacher directed individual activities 43 25Child selected activities 57 32
Percent of totalTeacher directed whole class activities 38 40Teacher directed small-group activities 27 28Teacher directed individual activities 15 14Child selected activities 20 18
NOTE: Detail may not sum to totals because of rounding.
SOURCE: U.S. Department of Education, National Center for Education Statistics, Early Childhood Longitudinal Study, Kindergarten Class of1998–99; Spring 1999 Kindergarten Teacher Questionnaire, Base-Year Public-Use Data File.
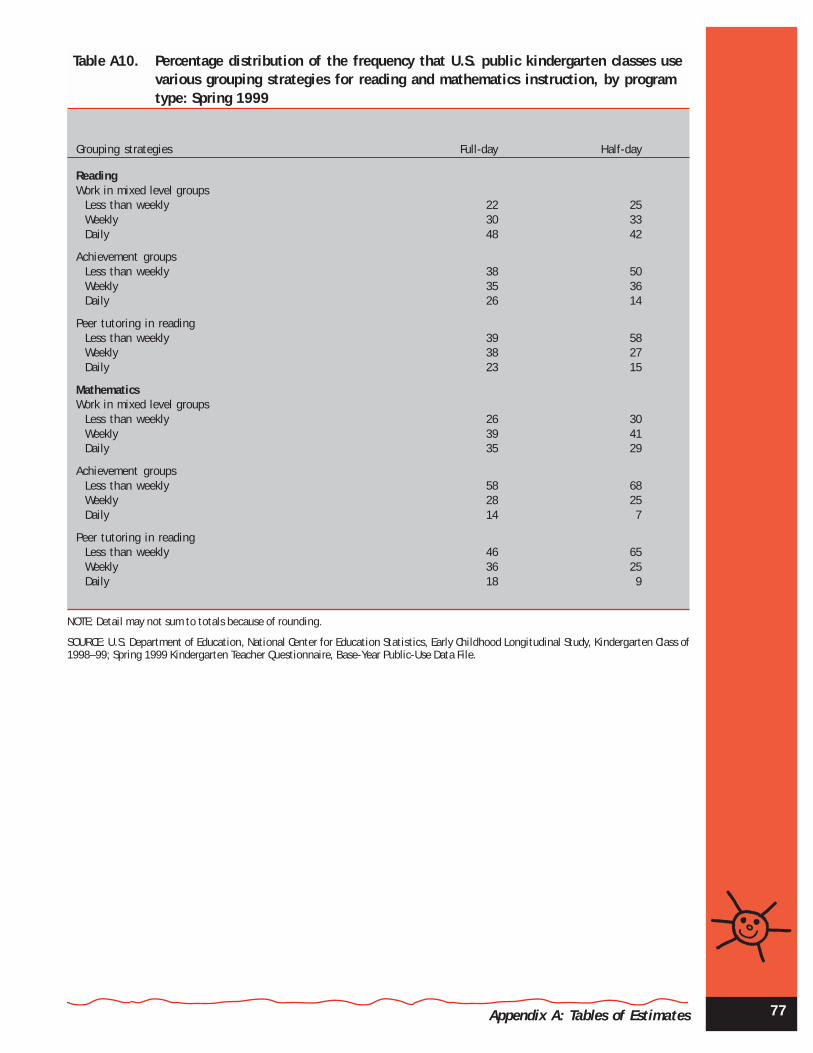
77Appendix A: Tables of Estimates
Table A10. Percentage distribution of the frequency that U.S. public kindergarten classes usevarious grouping strategies for reading and mathematics instruction, by programtype: Spring 1999
Grouping strategies Full-day Half-day
ReadingWork in mixed level groups
Less than weekly 22 25Weekly 30 33Daily 48 42
Achievement groupsLess than weekly 38 50Weekly 35 36Daily 26 14
Peer tutoring in readingLess than weekly 39 58Weekly 38 27Daily 23 15
MathematicsWork in mixed level groups
Less than weekly 26 30Weekly 39 41Daily 35 29
Achievement groupsLess than weekly 58 68Weekly 28 25Daily 14 7
Peer tutoring in readingLess than weekly 46 65Weekly 36 25Daily 18 9
NOTE: Detail may not sum to totals because of rounding.
SOURCE: U.S. Department of Education, National Center for Education Statistics, Early Childhood Longitudinal Study, Kindergarten Class of1998–99; Spring 1999 Kindergarten Teacher Questionnaire, Base-Year Public-Use Data File.

Full-day and Half-day Kindergarten in the United States78
Table A11. Percent of U.S. public kindergarten classes that spend time daily, weekly or lessthan weekly in various subject areas, by program type: Spring 1999
Full-day Half-day
Reading and language artsNever/less than weekly 1 1Weekly 2 4Daily 97 96
MathematicsNever/less than weekly 0 0Weekly 10 26Daily 90 73
Social studiesNever/less than weekly 3 9Weekly 66 73Daily 30 18
ScienceNever/less than weekly 4 11Weekly 72 79Daily 24 10
MusicNever/less than weekly 6 7Weekly 65 57Daily 30 36
ArtNever/less than weekly 4 6Weekly 66 73Daily 30 21
Dance/creative movementNever/less than weekly 41 47Weekly 46 44Daily 13 9
Theater/creative dramaticsNever/less than weekly 59 69Weekly 36 28Daily 6 3
NOTE: Detail may not sum to totals because of rounding.
SOURCE: U.S. Department of Education, National Center for Education Statistics, Early Childhood Longitudinal Study, Kindergarten Class of1998–99; Spring 1999 Kindergarten Teacher Questionnaire, Base-Year Public-Use Data File.

79
Table A12. Percent distribution of the amount of time per day U.S. public kindergartenclasses spend on reading/language arts and mathematics activities, byprogram type: Spring 1999
Full-day Half-day
Reading and language arts1–30 6 1531–60 26 4961–90 37 2791+ 31 10
Mathematics1–30 19 4931–60 60 4361–90 17 791+ 4 2
NOTE: ‘Minutes per day’ refers to the time spent per day on those days when the subject is taught. Detail may not sum to totals because ofrounding.
SOURCE: U.S. Department of Education, National Center for Education Statistics, Early Childhood Longitudinal Study, Kindergarten Class of1998–99; Spring 1999 Kindergarten Teacher Questionnaire, Base-Year Public-Use Data File.
Appendix A: Tables of Estimates

Full-day and Half-day Kindergarten in the United States80
Table A13. Percent of U.S. public kindergarten classes that work daily, weekly or less thanweekly on various reading activities, by program type: Spring 1999
Reading activity Full-day Half-day
Learning letter namesLess than weekly 1 1Weekly 8 12Daily 91 88
Work on phonicsLess than weekly 0 2Weekly 13 19Daily 86 79
Discuss new vocabularyLess than weekly 1 3Weekly 35 42Daily 64 55
Choose to read booksLess than weekly 6 10Weekly 32 43Daily 62 48
Read aloudLess than weekly 10 19Weekly 41 48Daily 49 33
Read silentlyLess than weekly 28 36Weekly 29 35Daily 43 29
Work in reading workbook/worksheetLess than weekly 26 34Weekly 40 46Daily 33 21
Use basal reading textsLess than weekly 68 80Weekly 20 15Daily 13 5
NOTE: Detail may not sum to totals because of rounding.
SOURCE: U.S. Department of Education, National Center for Education Statistics, Early Childhood Longitudinal Study, Kindergarten Class of1998–99; Spring 1999 Kindergarten Teacher Questionnaire, Base-Year Public-Use Data File.

81
Table A14. Percent of U.S. public kindergarten classes that work daily, weekly or less thanweekly on various reading skills, by program type: Spring 1999
Appendix A: Tables of Estimates
Reading skill Full-day Half-day
Letter recognitionLess than weekly 1 1Weekly 8 13Daily 91 87
Letter/sound matchLess than weekly # 1Weekly 12 20Daily 88 79
Conventions of printLess than weekly 4 6Weekly 19 24Daily 78 70
VocabularyLess than weekly 22 33Weekly 27 29Daily 52 38
Make predictions based on textLess than weekly 8 10Weekly 49 54Daily 43 36
Using context cues for comprehensionLess than weekly 18 23Weekly 43 49Daily 39 28
Rhyming words and word familiesLess than weekly 11 15Weekly 61 66Daily 28 18
Reading aloud fluentlyLess than weekly 47 66Weekly 29 22Daily 24 13
Reading multi-syllable wordsLess than weekly 58 69Weekly 29 23Daily 13 7
AlphabetizingLess than weekly 75 87Weekly 17 9Daily 8 4
# Rounds to zero
NOTE: Detail may not sum to totals because of rounding.
SOURCE: U.S. Department of Education, National Center for Education Statistics, Early Childhood Longitudinal Study, Kindergarten Class of1998–99; Spring 1999 Kindergarten Teacher Questionnaire, Base-Year Public-Use Data File.

Full-day and Half-day Kindergarten in the United States82
Table A15. Percent of U.S. public kindergarten classes that work daily, weekly or less thanweekly on various writing activities, by program type: Spring 1999
Writing activities Full-day Half-day
Writing alphabetLess than weekly 1 4Weekly 22 41Daily 76 56
Invented spellingLess than weekly 13 19Weekly 34 49Daily 53 32
Write in journalLess than weekly 28 39Weekly 38 44Daily 34 17
Write stories/reportsLess than weekly 41 60Weekly 40 32Daily 19 8
Write from dictationLess than weekly 51 67Weekly 36 29Daily 13 5
Publish own writingLess than weekly 72 84Weekly 22 14Daily 6 2
NOTE: Detail may not sum to totals because of rounding.
SOURCE: U.S. Department of Education, National Center for Education Statistics, Early Childhood Longitudinal Study, Kindergarten Class of1998–99; Spring 1999 Kindergarten Teacher Questionnaire, Base-Year Public-Use Data File.

83
Table A16. Percent of U.S. public kindergarten classes that work daily, weekly or less thanweekly on various writing skills, by program type: Spring 1999
Appendix A: Tables of Estimates
Writing skills Full-day Half-day
Writing nameLess than weekly 3 8Weekly 12 17Daily 85 74
Use capitalization and punctuationLess than weekly 26 36Weekly 32 38Daily 42 27
Compose sentencesLess than weekly 34 48Weekly 34 36Daily 32 16
Conventional spellingLess than weekly 51 66Weekly 28 22Daily 21 12
Compose and write stories with a beginning, middle and endLess than weekly 69 86Weekly 22 11Daily 9 3
NOTE: Detail may not sum to totals because of rounding.
SOURCE: U.S. Department of Education, National Center for Education Statistics, Early Childhood Longitudinal Study, Kindergarten Class of1998–99; Spring 1999 Kindergarten Teacher Questionnaire, Base-Year Public-Use Data File.

Full-day and Half-day Kindergarten in the United States84
Table A17. Percent of U.S. public kindergarten classes that work daily, weekly or less thanweekly on various receptive and expressive language activities, by program type:Spring 1999
Table A18. Percent of U.S. kindergarten classes that work daily, weekly or less than weeklyon various receptive and expressive language skills, by program type: Spring 1999
Receptive and expressive language skills Full-day Half-day
Identify main idea and parts of storyLess than weekly 22 35Weekly 47 44Daily 31 21
Remember and follow directions that include a series of actionsLess than weekly 6 7Weekly 32 32Daily 63 61
Communicate complete ideas orallyLess than weekly 5 5Weekly 28 33Daily 68 62
NOTE: Detail may not sum to totals because of rounding.
SOURCE: U.S. Department of Education, National Center for Education Statistics, Early Childhood Longitudinal Study, Kindergarten Class of1998–99; Spring 1999 Kindergarten Teacher Questionnaire, Base-Year Public-Use Data File.
Receptive and expressive language activities Full-day Half-day
Hear story/See printLess than weekly 3 4Weekly 18 34Daily 79 62
Hear story/Don’t see printLess than weekly 35 36Weekly 24 22Daily 41 42
Retell storiesLess than weekly 16 32Weekly 63 57Daily 21 11
Dictate storiesLess than weekly 25 40Weekly 54 51Daily 21 9
NOTE: Detail may not sum to totals because of rounding.
SOURCE: U.S. Department of Education, National Center for Education Statistics, Early Childhood Longitudinal Study, Kindergarten Class of1998–99; Spring 1999 Kindergarten Teacher Questionnaire, Base-Year Public-Use Data File.

85
Table A19. Percent of U.S. public kindergarten classes that work daily, weekly or less thanweekly on various mathematics activities, by program type: Spring 1999
Appendix A: Tables of Estimates
Mathematics activities Full-day Half-day
Play math gamesLess than weekly 11 20Weekly 61 65Daily 28 16
Do math worksheetsLess than weekly 23 35Weekly 52 53Daily 26 12
Explain how math problem is solvedLess than weekly 30 46Weekly 46 40Daily 24 13
Solve real-life math problemsLess than weekly 28 44Weekly 53 42Daily 19 13
Solve math problem in small group or partnerLess than weekly 37 58Weekly 50 36Daily 13 6
Do math problems in textbookLess than weekly 72 87Weekly 17 10Daily 11 4
Complete math problems on chalkboardLess than weekly 55 72Weekly 35 22Daily 10 6
Use music to learn mathLess than weekly 64 69Weekly 29 25Daily 7 6
Use creative movement or drama to understand math conceptsLess than weekly 70 74Weekly 26 22Daily 4 3
NOTE: Detail may not sum to totals because of rounding.
SOURCE: U.S. Department of Education, National Center for Education Statistics, Early Childhood Longitudinal Study, Kindergarten Class of1998–99; Spring 1999 Kindergarten Teacher Questionnaire, Base-Year Public-Use Data File.
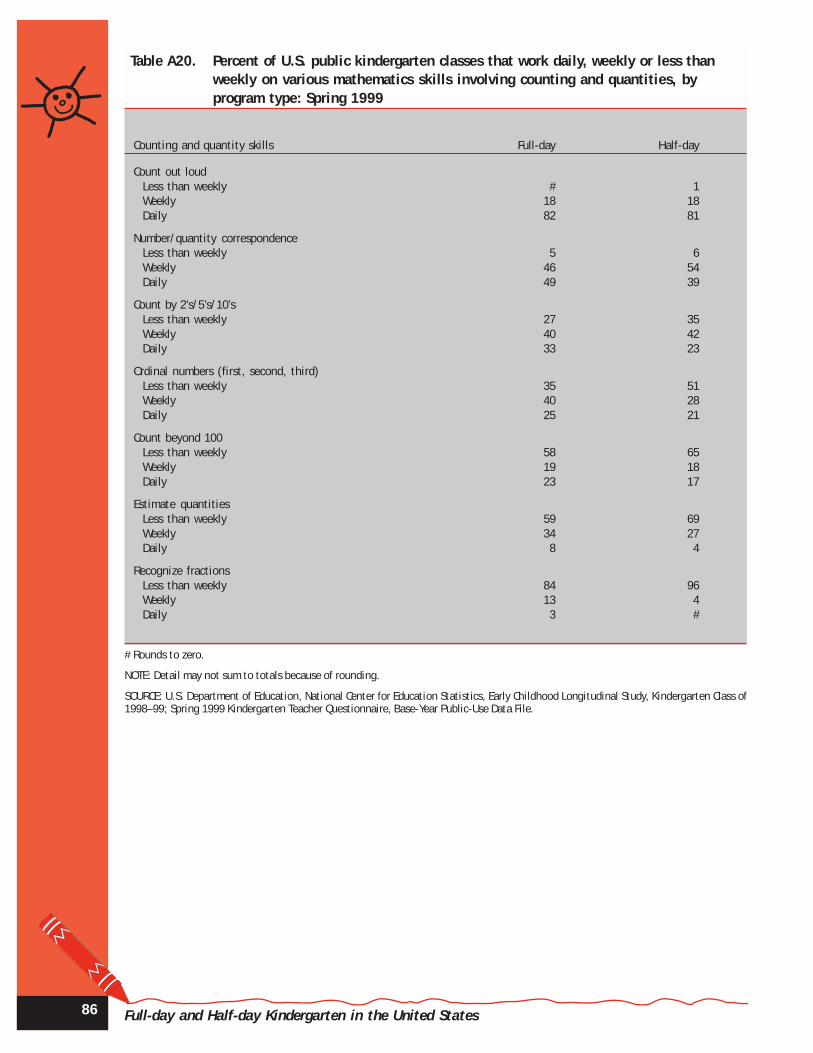
Full-day and Half-day Kindergarten in the United States86
Table A20. Percent of U.S. public kindergarten classes that work daily, weekly or less thanweekly on various mathematics skills involving counting and quantities, byprogram type: Spring 1999
Counting and quantity skills Full-day Half-day
Count out loudLess than weekly # 1Weekly 18 18Daily 82 81
Number/quantity correspondenceLess than weekly 5 6Weekly 46 54Daily 49 39
Count by 2’s/5’s/10’sLess than weekly 27 35Weekly 40 42Daily 33 23
Ordinal numbers (first, second, third)Less than weekly 35 51Weekly 40 28Daily 25 21
Count beyond 100Less than weekly 58 65Weekly 19 18Daily 23 17
Estimate quantitiesLess than weekly 59 69Weekly 34 27Daily 8 4
Recognize fractionsLess than weekly 84 96Weekly 13 4Daily 3 #
# Rounds to zero.
NOTE: Detail may not sum to totals because of rounding.
SOURCE: U.S. Department of Education, National Center for Education Statistics, Early Childhood Longitudinal Study, Kindergarten Class of1998–99; Spring 1999 Kindergarten Teacher Questionnaire, Base-Year Public-Use Data File.

87
Table A21. Percent of U.S. public kindergarten classes that work daily, weekly or less thanweekly on various mathematics skills involving number systems, by program type:Spring 1999
Appendix A: Tables of Estimates
Number systems skills Full-day Half-day
Read 2-digit numbersLess than weekly 20 21Weekly 33 35Daily 46 45
Write numbers 1-10Less than weekly 11 22Weekly 50 58Daily 38 20
Place valueLess than weekly 58 64Weekly 13 11Daily 29 26
Read 3-digit numbersLess than weekly 64 70Weekly 15 13Daily 21 17
Value of coins and cashLess than weekly 45 67Weekly 37 23Daily 18 10
Write numbers 1-100Less than weekly 76 88Weekly 17 10Daily 7 2
NOTE: Detail may not sum to totals because of rounding.
SOURCE: U.S. Department of Education, National Center for Education Statistics, Early Childhood Longitudinal Study, Kindergarten Class of1998–99; Spring 1999 Kindergarten Teacher Questionnaire, Base-Year Public-Use Data File.

Full-day and Half-day Kindergarten in the United States88
Table A22. Percent of U.S. public kindergarten classes that work daily, weekly or less thanweekly on various mathematics skills involving operations, by program type:Spring 1999
Table A23. Percent of U.S. public kindergarten classes that work daily, weekly or less thanweekly on various mathematics skills involving measurement, by program type:Spring 1999
Measurement skills Full-day Half-day
Calendar activitiesLess than weekly 2 2Weekly 5 5Daily 94 93
Tell timeLess than weekly 49 69Weekly 34 22Daily 18 8
Use measuring instrumentsLess than weekly 75 87Weekly 21 11Daily 4 1
NOTE: Detail may not sum to totals because of rounding.
SOURCE: U.S. Department of Education, National Center for Education Statistics, Early Childhood Longitudinal Study, Kindergarten Class of1998–99; Spring 1999 Kindergarten Teacher Questionnaire, Base-Year Public-Use Data File.
Mathematics operations skills Full-day Half-day
Work with counting manipulatives to learn operationsLess than weekly 4 10Weekly 60 68Daily 36 22
Relative quantity (equal, more, less)Less than weekly 19 26Weekly 55 55Daily 26 19
Add single-digit numbersLess than weekly 27 42Weekly 50 47Daily 23 11
Subtract single-digit numbersLess than weekly 41 60Weekly 43 33Daily 17 7
NOTE: Detail may not sum to totals because of rounding.
SOURCE: U.S. Department of Education, National Center for Education Statistics, Early Childhood Longitudinal Study, Kindergarten Class of1998–99; Spring 1999 Kindergarten Teacher Questionnaire, Base-Year Public-Use Data File.

89
Table A24. Percent of U.S. public kindergarten classes that work daily, weekly or less thanweekly on various mathematics skills involving data analysis, by program type:
Spring 1999
Data analysis skills Full-day Half-day
Read simple graphsLess than weekly 39 48Weekly 40 34Daily 20 19
Simple data collection/graphingLess than weekly 57 67Weekly 32 21Daily 10 11
Estimate probabilityLess than weekly 89 94Weekly 8 5Daily 3 1
NOTE: Detail may not sum to totals because of rounding.
SOURCE: U.S. Department of Education, National Center for Education Statistics, Early Childhood Longitudinal Study, Kindergarten Class of1998–99; Spring 1999 Kindergarten Teacher Questionnaire, Base-Year Public-Use Data File.
Table A25. Percent of U.S. public kindergarten classes that work daily, weekly or less thanweekly on various mathematics skills involving geometry, by program type: Spring1999
Geometry skills Full-day Half-day
Name geometric shapesLess than weekly 28 37Weekly 48 47Daily 24 16
Work with geometric manipulativesLess than weekly 17 27Weekly 60 61Daily 22 12
NOTE: Detail may not sum to totals because of rounding.
SOURCE: U.S. Department of Education, National Center for Education Statistics, Early Childhood Longitudinal Study, Kindergarten Class of1998–99; Spring 1999 Kindergarten Teacher Questionnaire, Base-Year Public-Use Data File.
Appendix A: Tables of Estimates

Full-day and Half-day Kindergarten in the United States90
Table A26. Percent of U.S. public kindergarten classes that work daily, weekly or less thanweekly on various mathematics skills involving patterns and sorting, by programtype: Spring 1999
Patterns and sorting skills Full-day Half-day
Copy/extend patternsLess than weekly 23 29Weekly 50 48Daily 28 24
Sort into subgroups using ruleLess than weekly 32 43Weekly 55 51Daily 13 6
Order objects by propertyLess than weekly 37 51Weekly 53 44Daily 10 5
NOTE: Detail may not sum to totals because of rounding.
SOURCE: U.S. Department of Education, National Center for Education Statistics, Early Childhood Longitudinal Study, Kindergarten Class of1998–99; Spring 1999 Kindergarten Teacher Questionnaire, Base-Year Public-Use Data File.
Table A27. Public school first-time kindergartners’ mean reading fall, spring and gain scores(unadjusted), by program type: Fall 1998 to spring 1999
Program type Reading gain Fall score Spring score
All public kindergartners 10.04 21.72 31.76Half-day 9.45 21.88 31.33Full-day 10.55 21.59 32.14
NOTE: Estimates are based on public school, first-time kindergarten children attending a regular kindergarten program (no transitional ormulti-grade classes). Only children who stayed with the same teacher in both the fall and spring and who are assessed in English in boththe fall and the spring are included in the analysis.
SOURCE: U.S. Department of Education, National Center for Education Statistics, Early Childhood Longitudinal Study, Kindergarten Class of1998–99; Teacher Questionnaires and Child Assessment, Base-Year Public-Use data.
Table A28. Public school first-time kindergartners’ mean mathematics fall, spring and gainscores (unadjusted), by program type: Fall 1998 to spring 1999
Program type Math gain Fall score Spring score
All public kindergartners 8.20 19.36 27.56Half-day 7.77 19.79 27.56Full-day 8.57 18.99 27.55
NOTE: Estimates are based on public school, first-time kindergarten children attending a regular kindergarten program (no transitional ormulti-grade classes). Only children who stayed with the same teacher in both the fall and spring and who are assessed in mathematics inboth the fall and the spring are included in the analysis.
SOURCE: U.S. Department of Education, National Center for Education Statistics, Early Childhood Longitudinal Study, Kindergarten Class of1998–99; Teacher Questionnaires and Child Assessment, Base-Year Public-Use data.
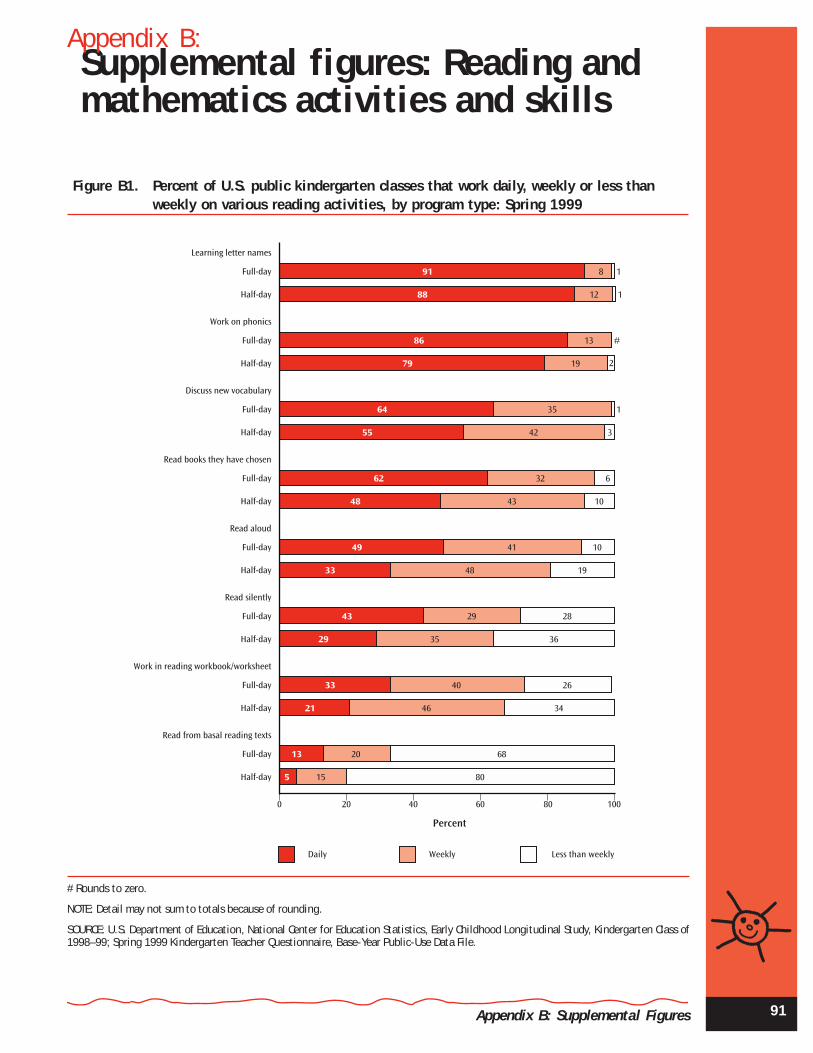
91
Supplemental figures: Reading andmathematics activities and skills
Appendix B:
Appendix B: Supplemental Figures
Figure B1. Percent of U.S. public kindergarten classes that work daily, weekly or less thanweekly on various reading activities, by program type: Spring 1999
# Rounds to zero.
NOTE: Detail may not sum to totals because of rounding.
SOURCE: U.S. Department of Education, National Center for Education Statistics, Early Childhood Longitudinal Study, Kindergarten Class of1998–99; Spring 1999 Kindergarten Teacher Questionnaire, Base-Year Public-Use Data File.
91 8 1
#
88 12
86 13
79 19 2
64 35 1
55 42 3
62 32 6
48 43 10
49 41 10
33 48 19
43 29 28
29 35 36
33 40 26
21 46 34
13 20 68
5 15 80Half-day
Full-day
Half-day
Full-day
Half-day
Full-day
Half-day
Full-day
Half-day
Full-day
Half-day
Full-day
Half-day
Full-day
Half-day
Full-day
Read from basal reading texts
Work in reading workbook/worksheet
Read silently
Read aloud
Read books they have chosen
Discuss new vocabulary
Work on phonics
Learning letter names
Daily Weekly Less than weekly
Percent
0 20 40 60 80 100
1

Full-day and Half-day Kindergarten in the United States92
Figure B2. Percent of U.S. public kindergarten classes that work daily, weekly or less thanweekly on various reading skills, by program type: Spring 1999
# Rounds to zero.
NOTE: Detail may not sum to totals because of rounding.
SOURCE: U.S. Department of Education, National Center for Education Statistics, Early Childhood Longitudinal Study, Kindergarten Class of1998–99; Spring 1999 Kindergarten Teacher Questionnaire, Base-Year Public-Use Data File.
Half-day
Full-day
Half-day
Full-day
Half-day
Full-day
Half-day
Full-day
Half-day
Full-day
Half-day
Full-day
Half-day
Full-day
Vocabulary
Half-day
Full-day
Half-day
Full-day
Half-day
Full-day
Alphabetizing
Reading multi-syllable words
Reading aloud fluently
Rhyming words and word families
Using context cues for comprehension
Make predictions based on text
Conventions of print
Letter/sound match
Letter recognition
Daily Weekly Less than weekly
91
87 12 1
#
1
88 12
79 20 1
78 19 4
70 24 6
52 27
38 29 33
43 49 8
8
36 54 10
39 43 18
28 49 23
28 61 11
18 66 15
24 29 47
13 22 66
13 29 58
7 23 69
8 17 75
4 9 87
Percent
0 20 40 60 80 100
22

93
Figure B3. Percent of U.S. public kindergarten classes that work daily, weekly or less thanweekly on various writing activities, by program type: Spring 1999
NOTE: Detail may not sum to totals because of rounding.
SOURCE: U.S. Department of Education, National Center for Education Statistics, Early Childhood Longitudinal Study, Kindergarten Class of1998–99; Spring 1999 Kindergarten Teacher Questionnaire, Base-Year Public-Use Data File.
Appendix B: Supplemental Figures
76 22 1
56 41 4
53 34 13
32 49 19
34 38 28
17 44 39
19 40 41
8 32 60
13 36 51
5 29 67
6 22 72
2 14 84Half-day
Full-day
Publish own writing
Half-day
Full-day
Write from dictation
Half-day
Full-day
Write stories/reports
Half-day
Full-day
Write in journal
Half-day
Full-day
Write with invented spelling
Half-day
Full-day
Write alphabet
Daily Weekly Less than weekly
Percent
0 20 40 60 80 100

Full-day and Half-day Kindergarten in the United States94
Figure B4. Percent of U.S. public kindergarten classes that work daily, weekly or less thanweekly on various writing skills, by program type: Spring 1999
NOTE: Detail may not sum to totals because of rounding.
SOURCE: U.S. Department of Education, National Center for Education Statistics, Early Childhood Longitudinal Study, Kindergarten Class of1998–99; Spring 1999 Kindergarten Teacher Questionnaire, Base-Year Public-Use Data File.
Half-day
Full-day
Compose stories
Half-day
Full-day
Conventional spelling
Half-day
Full-day
Compose sentences
Half-day
Full-day
Use capitalization and punctuation
Half-day
Full-day
Writing name
85 12 3
74 17 8
42 32 26
27 38 36
32 34 34
16 36 48
21 28 51
12 22 66
9 22 69
3 11 86
Daily Weekly Less than weekly
Percent
0 20 40 60 80 100

95
NOTE: Detail may not sum to totals because of rounding.
SOURCE: U.S. Department of Education, National Center for Education Statistics, Early Childhood Longitudinal Study, Kindergarten Class of1998–99; Spring 1999 Kindergarten Teacher Questionnaire, Base-Year Public-Use Data File.
Figure B5. Percent of U.S. public kindergarten classes that work daily, weekly or less thanweekly on various receptive and expressive language activities, by program type:Spring 1999
Appendix B: Supplemental Figures
Figure B6. Percent of U.S. kindergarten classes that work daily, weekly or less than weekly onvarious receptive and expressive language skills, by program type: Spring 1999
NOTE: Detail may not sum to totals because of rounding.
SOURCE: U.S. Department of Education, National Center for Education Statistics, Early Childhood Longitudinal Study, Kindergarten Class of1998–99; Spring 1999 Kindergarten Teacher Questionnaire, Base-Year Public-Use Data File.
Half-day
Full-day
Dictate stories
Half-day
Full-day
Retell stories
Half-day
Full-day
Hear story/Don’t see print
Half-day
Full-day
Hear story/See print
Daily Weekly Less than weekly
Percent
0 20 40 60 80 100
79 18 3
62 34 4
41 24 35
42 22 36
21 63 16
11 57 32
21 54 25
9 51 40
68 28 5
62 33 5
63 32 6
61 32 7
31 47 22
21 44 35Half-day
Full-day
Identify main idea and parts of story
Half-day
Full-day
Remember and follow directions that include a series of actions
Half-day
Full-day
Communicate complete ideas orally
Daily Weekly Less than weekly
Percent
0 20 40 60 80 100
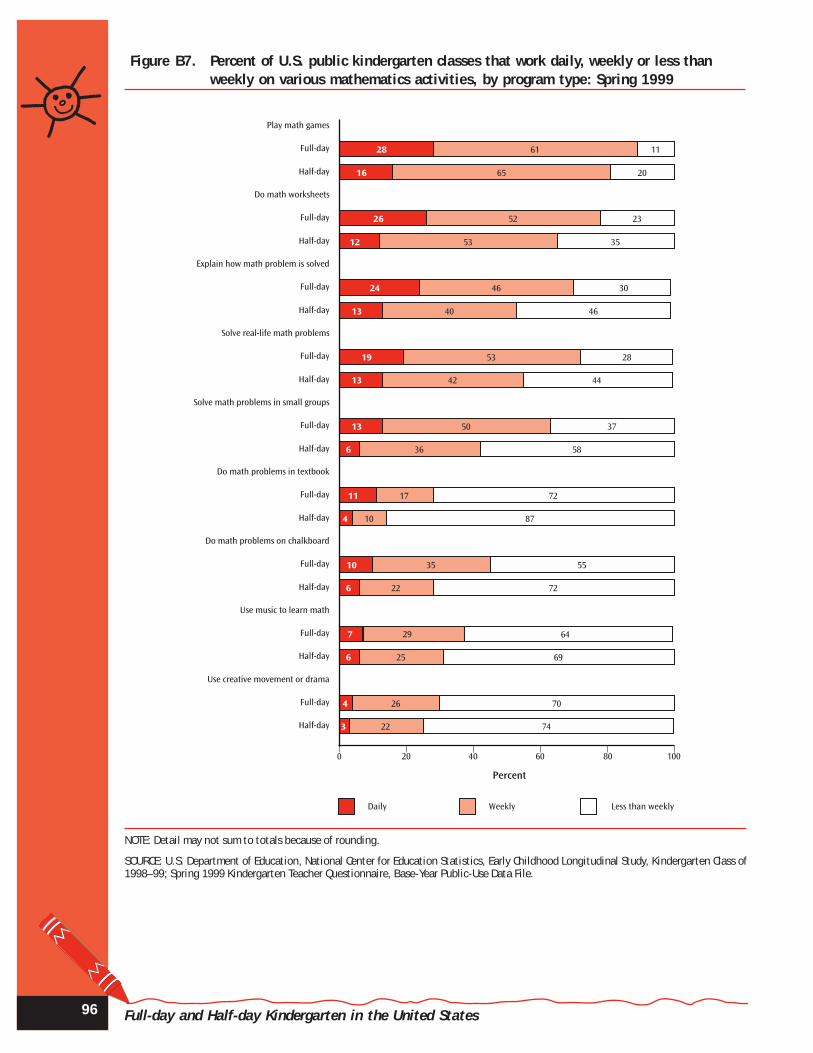
Full-day and Half-day Kindergarten in the United States96
NOTE: Detail may not sum to totals because of rounding.
SOURCE: U.S. Department of Education, National Center for Education Statistics, Early Childhood Longitudinal Study, Kindergarten Class of1998–99; Spring 1999 Kindergarten Teacher Questionnaire, Base-Year Public-Use Data File.
Figure B7. Percent of U.S. public kindergarten classes that work daily, weekly or less thanweekly on various mathematics activities, by program type: Spring 1999
Half-day
Full-day
Use creative movement or drama
Half-day
Full-day
Use music to learn math
Half-day
Full-day
Do math problems on chalkboard
Half-day
Full-day
Do math problems in textbook
Half-day
Full-day
Solve math problems in small groups
Half-day
Full-day
Solve real-life math problems
Half-day
Full-day
Explain how math problem is solved
Half-day
Full-day
Do math worksheets
Half-day
Full-day
Play math games
Daily Weekly Less than weekly
28 61 11
16 65 20
26 52 23
12 53 35
24 46 30
13 40 46
19 53 28
13 42 44
13 50 37
6 36 58
11 17 72
4 10 87
10 35 55
6 22 72
7 64
6 25 69
4 26 70
3 22 74
29
Percent
0 20 40 60 80 100

97Appendix B: Supplemental Figures
# Rounds to zero.
NOTE: Detail may not sum to totals because of rounding.
SOURCE: U.S. Department of Education, National Center for Education Statistics, Early Childhood Longitudinal Study, Kindergarten Class of1998–99; Spring 1999 Kindergarten Teacher Questionnaire, Base-Year Public-Use Data File.
Figure B8. Percent of U.S. public kindergarten classes that work daily, weekly or less thanweekly on various mathematics skills involving counting and quantities, byprogram type: Spring 1999
82 18
81 18 1
#
49 46 5
39 54 6
33 40 27
23 42 35
25 40 35
21 28 51
23 19 58
17 18 65
8 34 59
27 69
3 13 84
4 96
4
Half-day
Full-day
Recognize fractions
Half-day
Full-day
Estimate quantities
Half-day
Full-day
Count beyond 100
Half-day
Full-day
Ordinal numbers (first, second, third)
Half-day
Full-day
Count by 2’s/5’s/10’s
Half-day
Full-day
Number/quantity correspondence
Half-day
Full-day
Count out loud
Daily Weekly Less than weekly
Percent
0 20 40 60 80 100

Full-day and Half-day Kindergarten in the United States98
NOTE: Detail may not sum to totals because of rounding.
SOURCE: U.S. Department of Education, National Center for Education Statistics, Early Childhood Longitudinal Study, Kindergarten Class of1998–99; Spring 1999 Kindergarten Teacher Questionnaire, Base-Year Public-Use Data File.
Figure B9. Percent of U.S. public kindergarten classes that work daily, weekly or less thanweekly on various mathematics skills involving number systems, by program type:Spring 1999
Half-day
Full-day
Write numbers 1–100
Half-day
Full-day
Know value of coins and cash
Half-day
Full-day
Read 3-digit numbers
Half-day
Full-day
Place value
Half-day
Full-day
Write numbers 1–10
Half-day
Full-day
Read 2-digit numbers
46 33 20
45 35 21
38 50 11
20 58 22
29 13 58
26 11 64
21 15 64
17 13 70
18 37 45
10 23 67
7 17 76
2 10 88
Daily Weekly Less than weekly
Percent
0 20 40 60 80 100

99Appendix B: Supplemental Figures
Figure B10. Percent of U.S. public kindergarten classes that work daily, weekly or less thanweekly on various mathematics skills involving operations, by program type:Spring 1999
NOTE: Detail may not sum to totals because of rounding.
SOURCE: U.S. Department of Education, National Center for Education Statistics, Early Childhood Longitudinal Study, Kindergarten Class of1998–99; Spring 1999 Kindergarten Teacher Questionnaire, Base-Year Public-Use Data File.
Half-day
Full-day
Subtract single-digit numbers
Half-day
Full-day
Add single digit numbers
Half-day
Full-day
Relative quantity (equal, more, less)
Half-day
Full-day
Use counting manipulatives to learn operations
7
36 60 4
22 68 10
26 55 19
19 55 26
23 50 27
11 47 42
17 43 41
7 33 60
Daily Weekly Less than weekly
Percent
0 20 40 60 80 100

Full-day and Half-day Kindergarten in the United States100
Figure B11. Percent of U.S. public kindergarten classes that work daily, weekly or less thanweekly on various mathematics skills involving measurement, by program type:Spring 1999
NOTE: Detail may not sum to totals because of rounding.
SOURCE: U.S. Department of Education, National Center for Education Statistics, Early Childhood Longitudinal Study, Kindergarten Class of1998–99; Spring 1999 Kindergarten Teacher Questionnaire, Base-Year Public-Use Data File.
94 5 2
93 5 2
18 34 49
8 22 69
4 21 75
11 87Half-day
Full-day
Work with measuring instruments
Half-day
Full-day
Tell time
Half-day
Full-day
Calendar activities
Daily Weekly Less than weekly
Percent
0 20 40 60 80 100
1
NOTE: Detail may not sum to totals because of rounding.
SOURCE: U.S. Department of Education, National Center for Education Statistics, Early Childhood Longitudinal Study, Kindergarten Class of1998–99; Spring 1999 Kindergarten Teacher Questionnaire, Base-Year Public-Use Data File.
Figure B12. Percent of U.S. public kindergarten classes that work daily, weekly or less thanweekly on various mathematics skills involving data analysis, by program type:Spring 1999
Half-day
Full-day
Estimate probability
Half-day
Full-day
Simple data-collection/graphing
Half-day
Full-day
Read simple graphs
Daily Weekly Less than weekly
Percent
0 20 40 60 80 100
20 40 39
19 34 48
10 32 57
11 21 67
3 8 89
5 94
1

101Appendix B: Supplemental Figures
NOTE: Detail may not sum to totals because of rounding.
SOURCE: U.S. Department of Education, National Center for Education Statistics, Early Childhood Longitudinal Study, Kindergarten Class of1998–99; Spring 1999 Kindergarten Teacher Questionnaire, Base-Year Public-Use Data File.
Figure B13. Percent of U.S. public kindergarten classes that work daily, weekly or less thanweekly on various mathematics skills involving geometry, by program type:Spring 1999
NOTE: Detail may not sum to totals because of rounding.
SOURCE: U.S. Department of Education, National Center for Education Statistics, Early Childhood Longitudinal Study, Kindergarten Class of1998–99; Spring 1999 Kindergarten Teacher Questionnaire, Base-Year Public-Use Data File.
Figure B14. Percent of U.S. public kindergarten classes that work daily, weekly or less thanweekly on various mathematics skills involving patterns and sorting, by programtype: Spring 1999
Half-day
Full-day
Work with geometric manipulatives
Half-day
Full-day
Name geometric shapes
24 48 28
16 47 37
22 60 17
12 61 27
Daily Weekly Less than weekly
Percent
0 20 40 60 80 100
Half-day
Full-day
Order objects by property
Half-day
Full-day
Sort into subgroups using rule
Half-day
Full-day
Copy/extend patterns
28 50 23
24 48 29
13 55 32
6 51 43
10 53 37
5 44 51
Daily Weekly Less than weekly
Percent
0 20 40 60 80 100


103
Standard Error TablesAppendix C:
Table C1. Standard errors for table A1, figures A and 2—Percent of U.S. schools that offerfull-day and half-day kindergarten programs, by school type: 1998–99
Full- Half- Full- Half- Full- Half- Full- Half-School characteristics day day day day day day day day
All schools 2.30 2.38 2.91 3.04 3.56 4.33 4.61 4.77
SOURCE: U.S. Department of Education, National Center for Education Statistics, Early Childhood Longitudinal Study, Kindergarten Class of1998–99; School Administrator and Kindergarten Teacher Questionnaires, Base-Year Public-Use Data Files.
All schools Public Catholic
Otherprivate
Private
Table C2. Standard errors for table A2, figures 3, 4, 5, and 6—Percent of U.S. schools thatoffer full-day and half-day kindergarten programs, by school characteristics: 1998–99
All schools Public PrivateFull- Half- Full- Half- Full- Half-
School characteristics day day day day day day
All schools 2.30 2.38 2.91 3.04 3.71 3.64
RegionNortheast 4.30 4.62 5.03 5.39 8.47 8.47Midwest 4.73 4.16 5.25 5.29 8.65 7.41South 4.16 5.18 4.74 6.26 6.77 7.03West 6.02 5.90 9.51 9.50 6.09 5.97
LocationLarge and mid-sized cities 4.22 4.07 5.86 5.32 4.74 4.70Suburbs/large town 3.54 3.70 3.94 4.17 6.08 6.49Small town/rural 5.24 5.05 4.86 5.49 13.21 11.00
School minority enrollment1
Less than 10% 3.56 3.53 4.59 4.66 7.00 7.0710–24% 5.44 5.56 5.64 5.91 8.20 8.0525–49% 5.67 6.22 6.81 7.69 ‡ ‡50–75% 5.81 6.17 6.30 6.65 ‡ ‡75% or more 4.74 4.80 5.39 5.45 4.56 6.01
Concentration of low-income children in public schools2
0–49% — — 3.78 3.36 — —50% or more — — 4.40 4.87 — —
‡ Reporting standards not met.
— Not available.
1All children who are not identified as White, non-Hispanic are classified as minority children.
2A school’s concentration of poverty is based on a composite of free and reduced-priced lunch and participation in a “school-wide”Title I program. This is calculated only for public schools with a kindergarten program.
NOTE: Percent offering full-day and half-day programs totals more than 100 because some schools have both full-day and half-day programs.
SOURCE: U.S. Department of Education, National Center for Education Statistics, Early Childhood Longitudinal Study, Kindergarten Class of1998–99; School Administrator Questionnaire and Kindergarten Teacher Questionnaires, Base-Year Public-Use Data Files.
Appendix C: Standard Error Tables

Full-day and Half-day Kindergarten in the United States104
Table C3. Standard errors for table A3, figures B, 7, and 8—Percent of U.S. kindergartenchildren enrolled in a full-day kindergarten program, by school characteristics:1998–99
All OtherSchool characteristics kindergartners Public Catholic private
All kindergartners 2.17 2.41 3.78 4.30
RegionNortheast 4.18 4.84 4.61 10.58Midwest 3.78 4.16 6.79 9.37South 3.83 4.12 6.11 6.77West 5.32 5.75 11.87 7.54
LocationLarge and mid-sized cities 3.17 3.76 4.59 6.30Suburbs/large town 3.36 3.76 7.35 7.10Small town/rural 6.51 6.76 8.64 14.60
School minority enrollment1
Less than 10% 3.28 3.87 6.57 8.6810–24% 4.76 5.32 9.79 8.1025–49% 5.72 6.25 13.14 15.8650–75% 5.46 5.75 26.67 14.8375% or more 3.14 3.49 5.02 7.68
School enrollment in poverty2
0–49% — 3.09 — —50% or more — 3.93 — —
— Not available.
1All children who are not identified as White, non-Hispanic are classified as minority children.
2A school’s concentration of poverty is based on a composite of free and reduced-priced lunch and participation in a “school-wide”Title I program. This is calculated only for public schools with a kindergarten program.
SOURCE: U.S. Department of Education, National Center for Education Statistics, Early Childhood Longitudinal Study, Kindergarten Class of1998–99; School Administrator Questionnaire and Kindergarten Teacher Questionnaires, Base-Year Public-Use Data Files.

105
Table C4. Standard errors for table A4, figures 9, 10, 11, and 12—Percent of U.S. kindergar-ten children enrolled in a full-day program, by school type and child and familycharacteristics: 1998–99
All OtherChild and family characteristics kindergartners Public Catholic private
All kindergartners 2.17 2.41 3.78 4.30
Child’s sexMale 2.26 2.47 3.93 4.46Female 2.14 2.42 3.87 4.51
Mother’s educationLess than high school 3.15 3.20 7.58 9.58High school diploma or equivalent 2.66 2.80 4.04 6.44Some college, including vocational/technical 2.41 2.70 3.84 5.02Bachelor’s degree or higher 2.37 2.85 4.72 4.78
Primary Language spoken in homeNon-English 3.21 3.32 6.46 7.48English 2.31 2.61 3.96 4.45
Child’s race/ethnicityWhite, non-Hispanic 2.52 2.84 4.35 5.08Black, non-Hispanic 3.19 3.49 1.75 3.37Hispanic 3.23 3.44 6.63 7.06Asian 3.37 3.88 11.42 9.53Hawaiian Native/Pacific Islander 11.41 11.50 28.50 8.10American Indian/Alaska Native 8.58 9.17 9.98 2.79More than one race, non-Hispanic 4.57 4.94 10.33 8.38
Diagnosed disabilityYes 3.03 3.37 4.60 6.04No 2.25 2.57 3.91 4.63
First time-kindergartnerYes 2.30 2.62 3.89 4.67No 3.59 4.08 9.34 6.53
Poverty status1
Below poverty threshold 3.19 3.23 4.74 7.48At or above poverty threshold 2.12 2.40 3.89 4.38
Child’s age at entry4 yrs, 8 mos — 4 yrs, 11 mos 2.89 3.54 6.04 5.755 yrs, 0 mos — 5 yrs, 3 mos 2.42 2.68 4.08 4.645 yrs, 4 mos — 5 yrs, 7 mos 2.15 2.41 3.92 4.925 yrs, 8 mos — 5 yrs, 11 mos 2.69 2.91 4.78 5.636 yrs, 0 mos — 6 yrs, 7 mos 2.83 3.14 7.75 8.46
1Poverty status is determined by comparing the child’s household income to the national poverty threshold.
SOURCE: U.S. Department of Education, National Center for Education Statistics. Early Childhood Longitudinal Study, Kindergarten Class of1998–99; School Administrator Questionnaire, Kindergarten Teacher Questionnaires and Parent Interview, Base-Year Public-Use Data Files.
Appendix C: Standard Error Tables
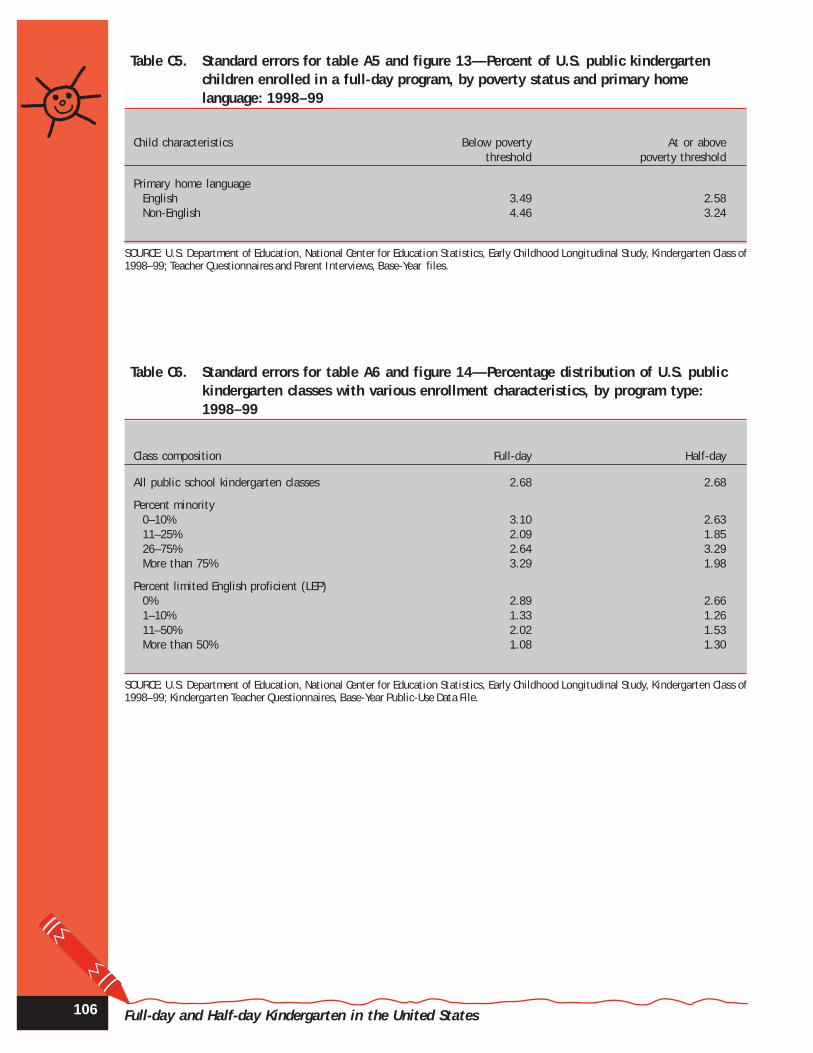
Full-day and Half-day Kindergarten in the United States106
Table C5. Standard errors for table A5 and figure 13—Percent of U.S. public kindergartenchildren enrolled in a full-day program, by poverty status and primary homelanguage: 1998–99
Child characteristics Below poverty At or abovethreshold poverty threshold
Primary home languageEnglish 3.49 2.58Non-English 4.46 3.24
SOURCE: U.S. Department of Education, National Center for Education Statistics, Early Childhood Longitudinal Study, Kindergarten Class of1998–99; Teacher Questionnaires and Parent Interviews, Base-Year files.
Table C6. Standard errors for table A6 and figure 14—Percentage distribution of U.S. publickindergarten classes with various enrollment characteristics, by program type:1998–99
Class composition Full-day Half-day
All public school kindergarten classes 2.68 2.68
Percent minority0–10% 3.10 2.6311–25% 2.09 1.8526–75% 2.64 3.29More than 75% 3.29 1.98
Percent limited English proficient (LEP)0% 2.89 2.661–10% 1.33 1.2611–50% 2.02 1.53More than 50% 1.08 1.30
SOURCE: U.S. Department of Education, National Center for Education Statistics, Early Childhood Longitudinal Study, Kindergarten Class of1998–99; Kindergarten Teacher Questionnaires, Base-Year Public-Use Data File.

107
Table C7. Standard errors for table A7, figures 15, 16, and 17—Percentage distribution ofvarious teacher characteristics in U.S. public kindergarten classes, by programtype: 1998–99
Teacher characteristic Full-day Half-day
Teacher’s raceWhite, non-Hispanic 1.92 1.34Black, non-Hispanic 1.36 0.52Hispanic 1.16 1.04Other, non-Hispanic or multiracial 1.10 0.82
Teacher’s highest degreeBachelor’s 2.17 2.33Master’s 1.96 2.18Doctorate/Specialist 0.88 0.90
Teacher’s certificationEarly Childhood 2.18 3.33Elementary 1.68 2.14
Teacher’s certification typeOther than fully certified 0.89 1.57Fully certified 0.89 1.57
Years teaching kindergartenLess than 3 1.45 1.473 to 9 1.40 1.9610–19 1.21 1.9220 or more 1.20 1.08
SOURCE: U.S. Department of Education, National Center for Education Statistics, Early Childhood Longitudinal Study, Kindergarten Class of1998–99; Kindergarten Teacher Questionnaires, Base-Year Public-Use Data File.
Table C8. Standard errors for table A8, figures 18 and 19—Percentage distribution of classsizes and percent of classes with classroom aides in U.S. public kindergartenclasses, by program type: 1998–99
Class characteristic Full-day Half-day
Class size levelsUp to 17 2.40 3.1818–24 2.63 2.7925 or more 2.06 1.57
Classroom aidesRegular instructional aide 3.83 2.97Special ed. instructional aide 1.87 2.32English as a second language (ESL) instructional aide 1.56 0.90
NOTE: A class is classified as having an aide if the aide spends at least one hour per day in the class working directly with the children inthe class.
SOURCE: U.S. Department of Education, National Center for Education Statistics, Early Childhood Longitudinal Study, Kindergarten Class of1998–99; Kindergarten Teacher Questionnaires, Base-Year Public-Use Data File.
Appendix C: Standard Error Tables

Full-day and Half-day Kindergarten in the United States108
Table C9. Standard errors for table A9, figures 20 and 21—Average minutes per day andpercent of total time that U.S. public kindergarten classes spend in various class-room organizations, by program type: Spring 1999
Time Full-day Half-day
Minutes per dayTeacher directed whole class activities 2.07 2.49Teacher directed small-group activities 1.72 1.92Teacher directed individual activities 1.07 1.39Child selected activities 1.37 1.32
Percent of totalTeacher directed whole class activities 0.71 1.38Teacher directed small-group activities 0.59 1.06Teacher directed individual activities 0.37 0.77Child selected activities 0.47 0.73
SOURCE: U.S. Department of Education, National Center for Education Statistics, Early Childhood Longitudinal Study, Kindergarten Class of1998–99; Spring 1999 Kindergarten Teacher Questionnaire, Base-Year Public-Use Data File.
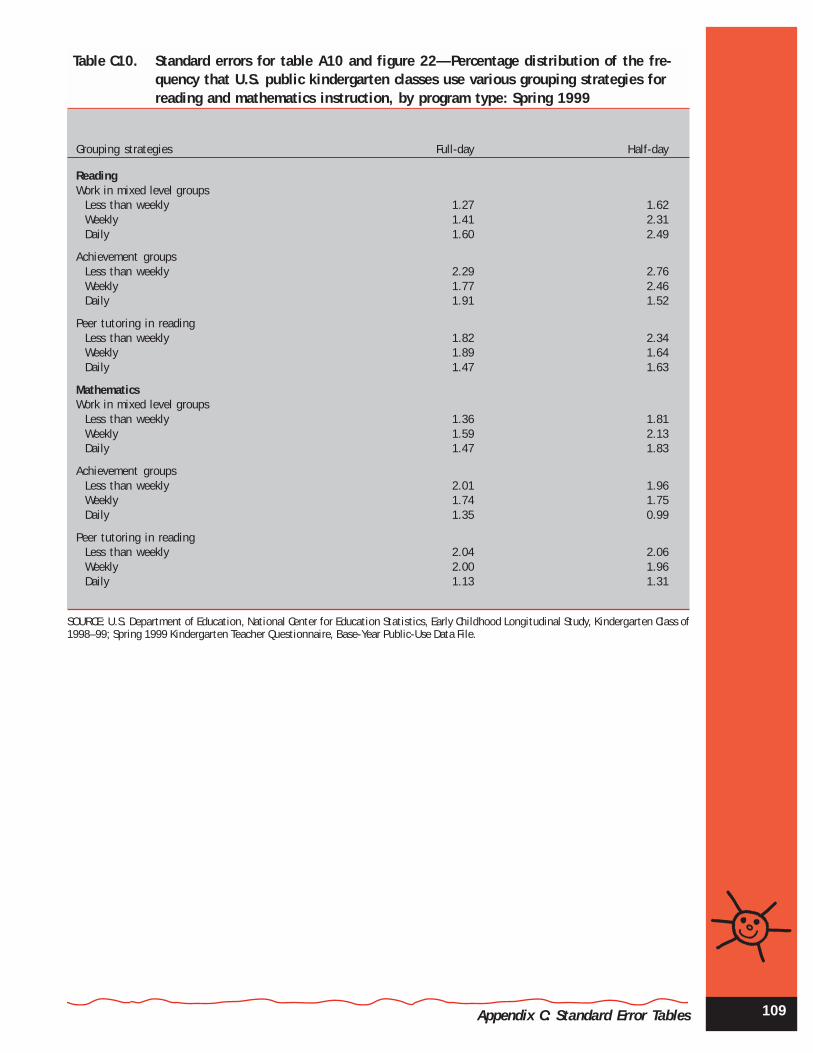
109
Table C10. Standard errors for table A10 and figure 22—Percentage distribution of the fre-quency that U.S. public kindergarten classes use various grouping strategies forreading and mathematics instruction, by program type: Spring 1999
Grouping strategies Full-day Half-day
ReadingWork in mixed level groups
Less than weekly 1.27 1.62Weekly 1.41 2.31Daily 1.60 2.49
Achievement groupsLess than weekly 2.29 2.76Weekly 1.77 2.46Daily 1.91 1.52
Peer tutoring in readingLess than weekly 1.82 2.34Weekly 1.89 1.64Daily 1.47 1.63
MathematicsWork in mixed level groups
Less than weekly 1.36 1.81Weekly 1.59 2.13Daily 1.47 1.83
Achievement groupsLess than weekly 2.01 1.96Weekly 1.74 1.75Daily 1.35 0.99
Peer tutoring in readingLess than weekly 2.04 2.06Weekly 2.00 1.96Daily 1.13 1.31
SOURCE: U.S. Department of Education, National Center for Education Statistics, Early Childhood Longitudinal Study, Kindergarten Class of1998–99; Spring 1999 Kindergarten Teacher Questionnaire, Base-Year Public-Use Data File.
Appendix C: Standard Error Tables

Full-day and Half-day Kindergarten in the United States110
Table C11. Standard errors for table A11, figures C, 23, and 24—Percent of U.S. publickindergarten classes that spend time daily, weekly or less than weekly in varioussubject areas, by program type: Spring 1999
Subject area Full-day Half-day
Reading and language artsNever/less than weekly 0.22 0.23Weekly 0.40 0.70Daily 0.45 0.73
MathematicsNever/less than weekly 0.13 0.05Weekly 0.98 1.69Daily 1.01 1.69
Social studiesNever/less than weekly 0.63 1.20Weekly 1.71 1.99Daily 1.70 1.71
ScienceNever/less than weekly 0.69 1.25Weekly 1.54 1.99Daily 1.51 1.70
MusicNever/less than weekly 0.92 1.49Weekly 2.02 2.81Daily 1.64 2.56
ArtNever/less than weekly 0.54 0.88Weekly 1.82 2.30Daily 1.73 2.09
Dance/creative movementNever/less than weekly 1.50 2.56Weekly 1.45 2.32Daily 1.25 0.94
Theater/creative dramaticsNever/less than weekly 1.59 2.36Weekly 1.40 2.22Daily 0.88 0.63
SOURCE: U.S. Department of Education, National Center for Education Statistics, Early Childhood Longitudinal Study, Kindergarten Class of1998–99; Spring 1999 Kindergarten Teacher Questionnaire, Base-Year Public-Use Data File.

111Appendix C: Standard Error Tables
Table C12. Standard errors for Table A12 and figures 25 and 26—Percent distribution of theamount of time per day U.S. public kindergarten classes spend time on reading/language arts activities and mathematics activities, by program type: Spring 1999
Full-day Half-day
Reading and language arts1–30 0.71 1.5831–60 1.34 2.1761–90 1.32 2.1191+ 1.32 1.28
Mathematics1–30 1.42 2.1831–60 1.58 2.0261–90 1.36 1.1691+ 0.51 0.51
NOTE: ‘Minutes per day’ refers to the time spent per day on those days when the subject is taught.
SOURCE: U.S. Department of Education, National Center for Education Statistics, Early Childhood Longitudinal Study, Kindergarten Class of1998–99; Spring 1999 Kindergarten Teacher Questionnaire, Base-Year Public-Use Data File.

Full-day and Half-day Kindergarten in the United States112
Table C13. Standard errors for table A13, figures D, 27, and B1—Percent of U.S. publickindergarten classes that work daily, weekly or less than weekly on variousreading activities, by program type: Spring 1999
Reading activities Full-day Half-day
Learning letter namesLess than weekly 0.23 0.23Weekly 0.83 1.03Daily 0.84 1.03
Work on phonicsLess than weekly 0.16 0.68Weekly 1.28 1.18Daily 1.29 1.33
Discuss new vocabularyLess than weekly 0.29 0.75Weekly 1.58 1.95Daily 1.58 1.88
Choose to read booksLess than weekly 0.80 1.18Weekly 1.81 2.33Daily 2.01 2.47
Read aloudLess than weekly 1.16 1.79Weekly 1.46 2.43Daily 1.60 2.24
Read silentlyLess than weekly 1.66 2.54Weekly 1.55 1.94Daily 1.87 2.19
Work in reading workbook/worksheetLess than weekly 1.97 2.67Weekly 1.75 2.20Daily 2.15 2.56
Use basal reading textsLess than weekly 1.86 1.79Weekly 1.76 1.56Daily 1.16 0.90
SOURCE: U.S. Department of Education, National Center for Education Statistics, Early Childhood Longitudinal Study, Kindergarten Class of1998–99; Spring 1999 Kindergarten Teacher Questionnaire, Base-Year Public-Use Data File.

113
Table C14. Standard errors for table A14, figures D, 27 and B2—Percent of U.S. publickindergarten classes that work daily, weekly or less than weekly on variousreading skills, by program type: Spring 1999
Appendix C: Standard Error Tables
Reading skills Full-day Half-day
Letter recognitionLess than weekly 0.28 0.39Weekly 0.87 0.96Daily 0.90 1.09
Letter/sound matchLess than weekly 0.21 0.59Weekly 1.24 1.49Daily 1.24 1.38
Conventions of printLess than weekly 0.60 1.18Weekly 1.16 1.67Daily 1.32 2.05
VocabularyLess than weekly 1.68 2.18Weekly 1.46 2.03Daily 1.89 2.09
Make predictions based on textLess than weekly 0.72 1.43Weekly 1.46 2.08Daily 1.52 2.00
Using context cues for comprehensionLess than weekly 1.18 1.72Weekly 1.69 2.46Daily 1.76 1.96
Rhyming words and word familiesLess than weekly 1.08 1.64Weekly 1.58 2.13Daily 1.60 1.30
Reading aloud fluentlyLess than weekly 2.31 2.30Weekly 1.94 1.78Daily 1.38 1.49
Reading multi-syllable wordsLess than weekly 2.00 2.05Weekly 1.45 1.80Daily 1.19 1.07
AlphabetizingLess than weekly 1.69 1.38Weekly 1.38 1.29Daily 0.83 0.69
SOURCE: U.S. Department of Education, National Center for Education Statistics, Early Childhood Longitudinal Study, Kindergarten Class of1998–99; Spring 1999 Kindergarten Teacher Questionnaire, Base-Year Public-Use Data File.
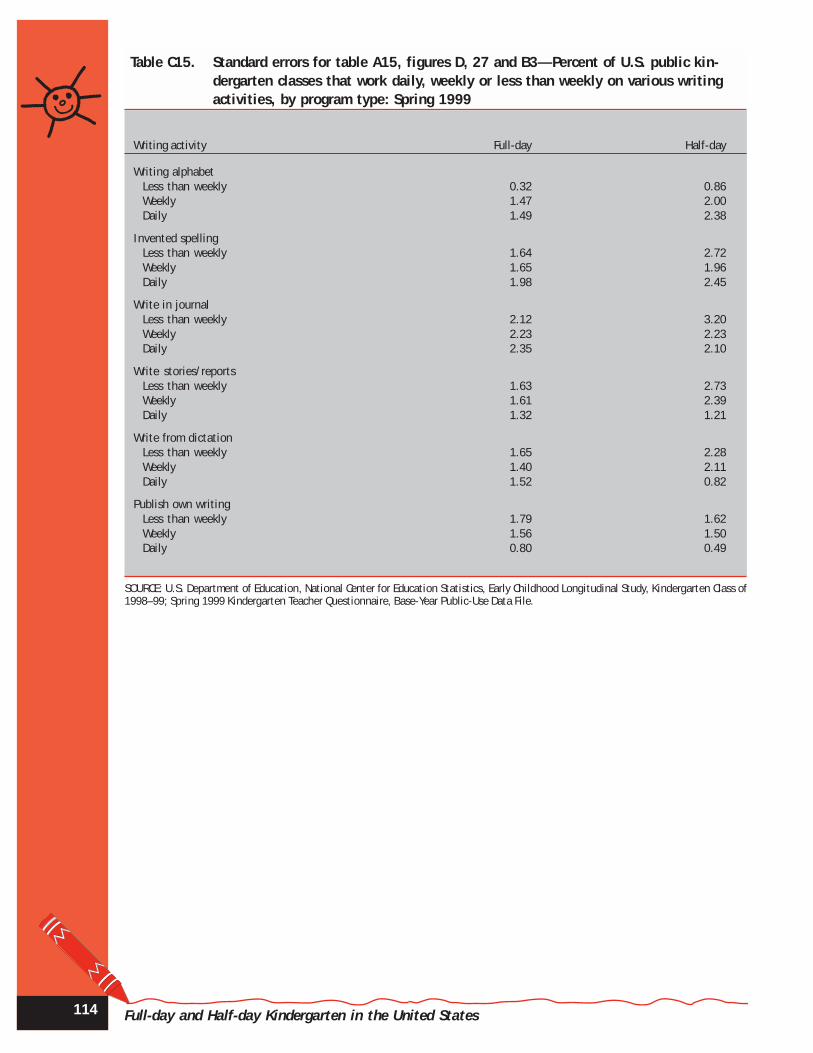
Full-day and Half-day Kindergarten in the United States114
Table C15. Standard errors for table A15, figures D, 27 and B3—Percent of U.S. public kin-dergarten classes that work daily, weekly or less than weekly on various writingactivities, by program type: Spring 1999
Writing activity Full-day Half-day
Writing alphabetLess than weekly 0.32 0.86Weekly 1.47 2.00Daily 1.49 2.38
Invented spellingLess than weekly 1.64 2.72Weekly 1.65 1.96Daily 1.98 2.45
Write in journalLess than weekly 2.12 3.20Weekly 2.23 2.23Daily 2.35 2.10
Write stories/reportsLess than weekly 1.63 2.73Weekly 1.61 2.39Daily 1.32 1.21
Write from dictationLess than weekly 1.65 2.28Weekly 1.40 2.11Daily 1.52 0.82
Publish own writingLess than weekly 1.79 1.62Weekly 1.56 1.50Daily 0.80 0.49
SOURCE: U.S. Department of Education, National Center for Education Statistics, Early Childhood Longitudinal Study, Kindergarten Class of1998–99; Spring 1999 Kindergarten Teacher Questionnaire, Base-Year Public-Use Data File.

115
Table C16. Standard errors for table A16, figures D, 27 and B4—Percent of U.S. public kinder-garten classes that work daily, weekly or less than weekly on various writing skills,by program type: Spring 1999
Writing skills Full-day Half-day
Writing nameLess than weekly 0.51 1.07Weekly 1.02 1.64Daily 1.09 1.97
Use capitalization and punctuationLess than weekly 2.45 2.30Weekly 1.58 1.73Daily 1.97 1.96
Compose sentencesLess than weekly 2.58 2.49Weekly 1.89 2.03Daily 1.82 1.33
Conventional spellingLess than weekly 1.99 2.16Weekly 1.44 1.92Daily 1.53 1.41
Compose and write stories with a beginning, middle and endLess than weekly 1.46 1.50Weekly 1.43 1.39Daily 0.85 0.76
SOURCE: U.S. Department of Education, National Center for Education Statistics, Early Childhood Longitudinal Study, Kindergarten Class of1998–99; Spring 1999 Kindergarten Teacher Questionnaire, Base-Year Public-Use Data File.
Appendix C: Standard Error Tables

Full-day and Half-day Kindergarten in the United States116
Table C17. Standard errors for table A17, figures D, 27 and B5—Percent of U.S. public kinder-garten classes that work daily, weekly or less than weekly on various receptive andexpressive language activities, by program type: Spring 1999
Receptive and expressive language activities Full-day Half-day
Hear story/See printLess than weekly 0.70 0.73Weekly 1.34 1.81Daily 1.16 1.92
Hear story/Don’t see printLess than weekly 1.36 2.46Weekly 1.38 1.58Daily 1.71 2.53
Retell storiesLess than weekly 1.16 2.60Weekly 1.81 2.33Daily 1.52 1.17
Dictate storiesLess than weekly 1.38 2.31Weekly 1.57 2.14Daily 1.39 1.27
SOURCE: U.S. Department of Education, National Center for Education Statistics, Early Childhood Longitudinal Study, Kindergarten Class of1998–99; Spring 1999 Kindergarten Teacher Questionnaire, Base-Year Public-Use Data File.
Table C18. Standard errors for table A18 and figure B6—Percent of U.S. kindergarten classesthat work daily, weekly or less than weekly on various receptive and expressivelanguage skills, by program type: Spring 1999
Receptive and expressive language skills Full-day Half-day
Identify main idea and parts of storyLess than weekly 1.40 2.00Weekly 1.96 2.10Daily 1.48 1.59
Remember and follow directions that include a series of actionsLess than weekly 0.73 0.94Weekly 1.64 1.80Daily 1.74 1.93
Communicate complete ideas orallyLess than weekly 0.74 0.77Weekly 1.26 2.28Daily 1.38 2.45
SOURCE: U.S. Department of Education, National Center for Education Statistics, Early Childhood Longitudinal Study, Kindergarten Class of1998–99; Spring 1999 Kindergarten Teacher Questionnaire, Base-Year Public-Use Data File.

117
Table C19. Standard errors for table A19 and figures 28 and B7—Percent of U.S. publickindergarten classes that work daily, weekly or less than weekly on various math-ematics activities, by program type: Spring 1999
Mathematics activities Full-day Half-day
Play math gamesLess than weekly 0.96 1.64Weekly 1.57 1.95Daily 1.66 1.66
Do math worksheetsLess than weekly 2.08 2.72Weekly 1.64 2.52Daily 2.01 1.49
Explain how math problem is solvedLess than weekly 1.85 2.20Weekly 2.01 2.09Daily 1.43 1.35
Solve real-life math problemsLess than weekly 1.39 2.01Weekly 1.71 1.79Daily 1.28 1.30
Solve math problem in small group or partnerLess than weekly 1.57 2.13Weekly 1.42 2.07Daily 0.96 0.87
Do math problems in textbookLess than weekly 2.55 1.76Weekly 1.72 1.43Daily 1.33 0.97
Complete math problems on chalkboardLess than weekly 1.54 2.16Weekly 1.50 2.04Daily 1.12 1.04
Use music to learn mathLess than weekly 1.85 2.36Weekly 1.68 2.13Daily 0.81 1.16
Use creative movement or drama to understand math conceptsLess than weekly 1.68 1.52Weekly 1.61 1.68Daily 0.61 0.72
SOURCE: U.S. Department of Education, National Center for Education Statistics, Early Childhood Longitudinal Study, Kindergarten Class of1998–99; Spring 1999 Kindergarten Teacher Questionnaire, Base-Year Public-Use Data File.
Appendix C: Standard Error Tables

Full-day and Half-day Kindergarten in the United States118
Table C20. Standard errors for table A20, figures E, 28 and B8—Percent of U.S. public kinder-garten classes that work daily, weekly or less than weekly on various mathematicsskills involving counting and quantities, by program type: Spring 1999
Counting and quantity skills Full-day Half-day
Count out loudLess than weekly 0.17 0.33Weekly 1.23 1.41Daily 1.26 1.43
Number/quantity correspondenceLess than weekly 0.67 0.96Weekly 2.15 1.82Daily 2.25 2.11
Count by 2’s/5’s/10’sLess than weekly 1.91 1.97Weekly 1.73 1.99Daily 1.85 1.82
Ordinal numbers (first, second, third)Less than weekly 1.49 2.51Weekly 1.55 1.77Daily 1.16 1.76
Count beyond 100Less than weekly 1.91 2.20Weekly 1.05 1.48Daily 1.72 1.54
Estimate quantitiesLess than weekly 2.38 1.68Weekly 2.17 1.54Daily 0.95 0.78
Recognize fractionsLess than weekly 1.33 0.84Weekly 1.18 0.88Daily 0.65 0.29
SOURCE: U.S. Department of Education, National Center for Education Statistics, Early Childhood Longitudinal Study, Kindergarten Class of1998–99; Spring 1999 Kindergarten Teacher Questionnaire, Base-Year Public-Use Data File.

119
Table C21. Standard errors for table A21, figures E, 28 and B9—Percent of U.S. public kinder-garten classes that work daily, weekly or less than weekly on various mathematicsskills involving number systems, by program type: Spring 1999
Number systems skills Full-day Half-day
Read 2-digit numbersLess than weekly 1.59 1.99Weekly 2.03 1.45Daily 1.99 2.18
Write numbers 1–10Less than weekly 1.16 1.60Weekly 1.52 2.04Daily 1.46 1.46
Place valueLess than weekly 2.36 2.57Weekly 1.02 1.42Daily 1.83 2.05
Read 3-digit numbersLess than weekly 1.71 2.56Weekly 1.53 1.87Daily 1.54 2.08
Value of coins and cashLess than weekly 2.00 2.73Weekly 1.69 1.84Daily 1.51 1.56
Write numbers 1–100Less than weekly 1.43 1.68Weekly 1.04 1.64Daily 1.05 0.41
SOURCE: U.S. Department of Education, National Center for Education Statistics, Early Childhood Longitudinal Study, Kindergarten Class of1998–99; Spring 1999 Kindergarten Teacher Questionnaire, Base-Year Public-Use Data File.
Appendix C: Standard Error Tables

Full-day and Half-day Kindergarten in the United States120
Table C22. Standard errors for table A22, figures E, 28 and B10—Percent of U.S. publickindergarten classes that work daily, weekly or less than weekly on various math-ematics skills involving operations, by program type: Spring 1999
Table C23. Standard errors for table A23, figures E, 28 and B11—Percent of U.S. publickindergarten classes that work daily, weekly or less than weekly on various math-ematics skills involving measurement, by program type: Spring 1999
Mathematics operations skills Full-day Half-day
Work with counting manipulatives to learn operationsLess than weekly 0.62 1.14Weekly 1.35 1.92Daily 1.39 1.85
Relative quantity (equal, more, less)Less than weekly 1.37 1.83Weekly 1.79 2.04Daily 1.52 1.33
Add single-digit numbersLess than weekly 1.59 2.17Weekly 1.87 2.20Daily 1.53 1.28
Subtract single-digit numbersLess than weekly 1.98 1.82Weekly 1.97 1.65Daily 1.17 0.99
SOURCE: U.S. Department of Education, National Center for Education Statistics, Early Childhood Longitudinal Study, Kindergarten Class of1998–99; Spring 1999 Kindergarten Teacher Questionnaire, Base-Year Public-Use Data File.
Measurement skills Full-day Half-day
Calendar activitiesLess than weekly 0.38 0.43Weekly 0.82 0.86Daily 0.97 0.94
Tell timeLess than weekly 2.06 2.54Weekly 1.96 1.84Daily 1.60 1.35
Use measuring instrumentsLess than weekly 1.46 1.41Weekly 1.25 1.52Daily 0.78 0.51
SOURCE: U.S. Department of Education, National Center for Education Statistics, Early Childhood Longitudinal Study, Kindergarten Class of1998–99; Spring 1999 Kindergarten Teacher Questionnaire, Base-Year Public-Use Data File.

121
Table C24. Standard errors for table A24 and figure B12—Percent of U.S. public kindergartenclasses that work daily, weekly or less than weekly on various mathematics skillsinvolving data analysis, by program type: Spring 1999
Table C25. Standard error for table A24 and figure B13—Percent of U.S. public kindergartenclasses that work daily, weekly or less than weekly on various mathematics skillsinvolving geometry, by program type: Spring 1999
Data analysis skills Full-day Half-day
Read simple graphsLess than weekly 1.83 2.63Weekly 1.78 2.26Daily 1.59 1.83
Simple data collection/graphingLess than weekly 1.73 2.17Weekly 1.68 1.79Daily 0.78 1.48
Estimate probabilityLess than weekly 1.20 1.02Weekly 1.03 0.97Daily 0.56 0.33
SOURCE: U.S. Department of Education, National Center for Education Statistics, Early Childhood Longitudinal Study, Kindergarten Class of1998–99; Spring 1999 Kindergarten Teacher Questionnaire, Base-Year Public-Use Data File.
Geometry skills Full-day Half-day
Name geometric shapesLess than weekly 1.42 2.02Weekly 1.86 2.14Daily 1.56 1.23
Work with geometric manipulativesLess than weekly 1.67 1.87Weekly 1.56 1.81Daily 1.42 1.20
SOURCE: U.S. Department of Education, National Center for Education Statistics, Early Childhood Longitudinal Study, Kindergarten Class of
Appendix C: Standard Error Tables

Full-day and Half-day Kindergarten in the United States122
Table C26. Standard errors for table A26 and figure B14—Percent of U.S. public kindergartenclasses that work daily, weekly or less than weekly on various mathematics skillsinvolving patterns and sorting, by program type: Spring 1999
Patterns and sorting skills Full-day Half-day
Copy/extend patternsLess than weekly 1.55 1.84Weekly 1.71 1.69Daily 1.89 1.78
Sort into subgroups using ruleLess than weekly 1.41 2.40Weekly 1.80 2.34Daily 1.37 0.92
Order objects by propertyLess than weekly 1.22 2.29Weekly 1.71 2.12Daily 1.28 0.91
SOURCE: U.S. Department of Education, National Center for Education Statistics, Early Childhood Longitudinal Study, Kindergarten Class of1998–99; Spring 1999 Kindergarten Teacher Questionnaire, Base-Year Public-Use Data File.
Table C27. Standard errors for table A27, figures F and 29—Public school first-time kinder-gartners’ mean reading fall, spring and gain scores (unadjusted), by program type:Fall 1998 to spring 1999
Program type Reading gain Fall score Spring score
All public kindergartners 0.16 0.18 0.26Half-day 0.17 0.26 0.32Full-day 0.23 0.25 0.40
NOTE: Estimates are based on public school, first-time kindergarten children attending a regular kindergarten program (no transitional ormulti-grade classes). Only children who stayed with the same teacher in both the fall and spring and who are assessed in English in boththe fall and the spring are included in the analysis.
SOURCE: U.S. Department of Education, National Center for Education Statistics, Early Childhood Longitudinal Study, Kindergarten Class of1998–99; Teacher Questionnaires and Child Assessment, Base-Year Public-Use data.
Table C28. Standard errors for table A28, figures G and 31—Public school first-time kinder-gartners’ mean mathematics fall, spring and gain scores (unadjusted), by programtype: Fall 1998 to spring 1999
Program type Math gain Fall score Spring score
All public kindergartners 0.10 0.16 0.23Half-day 0.12 0.25 0.31Full-day 0.15 0.23 0.33
NOTE: Estimates are based on public school, first-time kindergarten children attending a regular kindergarten program (no transitional ormulti-grade classes). Only children who stayed with the same teacher in both the fall and spring and who are assessed in mathematics inboth the fall and the spring are included in the analysis.
SOURCE: U.S. Department of Education, National Center for Education Statistics, Early Childhood Longitudinal Study, Kindergarten Class of1998–99; Teacher Questionnaires and Child Assessment, Base-Year Public-Use data.

123
Survey MethodologyThe Early Childhood Longitudinal Study, Kin-
dergarten Class of 1998–99 (ECLS-K), is beingconducted by Westat for the U.S. Department ofEducation, Institute of Education Sciences, NationalCenter for Education Statistics (NCES). It is de-signed to provide detailed information on children’searly school experiences. The study began in thefall of the 1998–99 school year. The children par-ticipating in the ECLS-K are being followed longi-tudinally through the fifth grade.
A nationally representative sample of 22,782children enrolled in kindergarten during the 1998–99 school year was selected to participate in theECLS-K. The children attend both public and pri-vate schools that offer a kindergarten program. Thesample includes children from different racial/eth-nic and socioeconomic backgrounds, and includesoversamples of Asian children, private school kin-dergartens and private school kindergarten children.
The ECLS-K kindergarten reading assessmentincluded questions designed to measure basic skills(letter recognition, beginning and ending sounds),vocabulary (reading sight words), and comprehen-sion (listening comprehension and reading wordsin context). The ECLS-K kindergarten mathemat-ics assessment was designed to measure skills inconceptual knowledge, procedural knowledge, andproblem solving. Approximately one-half of themathematics assessment consisted of questions onnumber sense, number properties and operations.The remainder of the assessment included ques-tions in measurement; geometry and spatial sense;data analysis, statistics, and probability; and pat-terns, algebra, and functions. The ECLS-K assess-ments were administered individually and took placein the child’s school. The assessors were ECLS-Kstaff with extensive training in how to administerthe assessments using standardized procedures.
The family demographic information presentedin this report was obtained through computer as-sisted telephone interviews (CATI) with thechildren’s parents. Teachers completed question-naires about themselves, their classrooms, and eachchild in the study. The instructional practices and
curricular focus items are based on teachers’ report.As a result, there may be possible response bias dueto social desirability. For example, some teachersmay indicate they use certain instructional activi-ties more often than they actually do if the teachersbelieve that those instructional activities are morehighly valued. Since independent observation ofinstructional activities was not part of the ECLS-Kstudy design, it is not possible to examine whetherresponse bias might have an effect on reported esti-mates.
For complete details about the sample design,response rates and nonresponse bias analysis for theECLS-K, refer to the ECLS-K Base-Year Public-UseData Files User’s Manual and/or the ECLS-K Meth-odology Report. Findings in these reports suggest thatthere is not a bias due to nonresponse.
Statistical ProceduresChapters 2, 3 and 4
Comparisons made in the text must be largerthan 5 percentage points and are tested for statisti-cal significance (alpha = .05) to ensure that the dif-ferences are larger than might be expected due tosampling variation. When comparing estimates be-tween categorical groups (e.g., region, race/ethnicity), t statistics are calculated. The formulaused to compute the t statistic is:
t = Est1
– Est2 / SQRT [(se
1)2
+ (se
2)2]
Where Est1
and Est2 are the estimates being
compared and se1
and se2
are their correspondingstandard errors. For example, information fromTables A1 and C1 are used to compare the percentof public and Catholic schools that offer full-daykindergarten. The formula used to compute thet statistic for the comparison of public and Catho-lic schools is:
Public school estimate – Catholic school estimate
SQRT [(Public se)2 + (Catholic se)2]
57 – 78
SQRT [(2.91)2 + (3.56)2]
t = –4.57
Methodology and Technical NotesAppendix D:
t =
t =
Appendix D: Methodology and Technical Notes

Full-day and Half-day Kindergarten in the United States124
In some instances, it is reported that two esti-mates are “similar” (e.g., “Full-day and half-dayclasses have similar numbers of ESL aides”). Thesestatements are made when, in addition to no statis-tical difference found, a test for equivalence rejectsa null hypothesis that the difference between thetwo estimates is not near zero and therefore the twoestimates are considered to be equivalent. Theequivalence tests are used to identify similar esti-mates with an alpha level of .05 and tolerance boundof 5 percentage points (Rogers, Howard and Vessey1993).
Chapter 5The dependent variables in chapter 5 analyses
are gain scores that represent the differences be-tween the IRT fall and spring scale scores for thereading and mathematics assessments. Using gainscores as the dependent variable rather than springscores as the dependent variable with fall scores as acovariate allows results to be presented in terms ofprogress made during the year regardless of wherealong the continuum that progress is made. Thereare longstanding concerns about the unreliabilityof gain scores in the measurement literature al-though these concerns have more recently beenshown to be largely unfounded and based on faultyassumptions (e.g., Gottman and Rushe 1993; Wil-liams and Zimmerman 1996). Rogosa and Willet(1983) show that gain score reliabilities tend to bestrong when individual differences between pre-testand post-test are substantial, as is the case in mostlongitudinal assessment applications (including thefall and spring kindergarten ECLS-K assessments).Maris (1998) argues that regression toward themean is not a legitimate argument against usinggains scores nor is pretest measurement error a con-cern unless assignment into independent variablegroups is determined from pre-test performance(which is not the case in the ECLS-K). Addition-ally, the use of IRT scale scores and the adaptivetesting approach used in the ECLS-K limit the con-cern that gain scores may be unreliable due to floorand ceiling effects (Rock and Pollack 2002).
Comparisons of simple mean gain scores pre-sented in chapter 5 are done using the t-test proce-dures described for chapters 2, 3 and 4. The regres-sion analyses described in chapter 5 compare mean
gain scores for children in full-day and half-dayprograms while accounting for other child and class-room characteristics and incorporating the nestedstructure of the data. A three-level hierarchical lin-ear modeling (HLM) method is used to calculateunstandardized regression coefficients for terms inthe analyses and to partition the variance associ-ated with each level. This method assures that theproper degrees of freedom are used for estimatingthe regression coefficients at each level of the data.For example, the degrees of freedom for a class-levelvariable will be based on the number of classes ratherthan the number of children. The three-level modelconsists of three submodels, one for each level. Forexample, the model for the mathematics gain scores(table 7) can be expressed as the following equa-tions.
Level-1 modelThe level-1 model specifies the relationship
between child characteristics and children’s math-ematics gains. The intercept (P0), child-level coef-ficients (P1-P8) and error (E) appear at this level. Yis the child’s mathematics gain score.
Y = P0 + P1*(Poverty) + P2*(Race/ethnicity: Black)+ P3*(Race/ethnicity: Hispanic) + P4*(Race/ethnicity: Asian) + P5*( Race/ethnicity: Other)+ P6*(Time lapse) + P7*(Fall math score: Low1/3) + P8*(Fall math score: Middle 1/3) + E
Level-2 modelThe level-2 model specifies the relationship
between program type and classes’ mathematicsgains. The equation includes the level-2 intercept(B00) the class-level coefficients for program type(B01) and error (R0). The level-1 intercept (PO)and each of the level-1 coefficients (P1–P8) aretreated as outcomes in the level 2 equation. In thisanalysis, effects associated with each of the level-1variables are assumed to be invariant (fixed) acrossclasses so no error terms are attached to these.
P0 = B00 + B01*(Program type) + R0P1 = B10P2 = B20P3 = B30P4 = B40P5 = B50P6 = B60P7 = B70P8 = B80

125
Level-3 modelNo school-level characteristics appear in the
model. The level-2 intercept (B00) and the level-2coefficient for program type (B01) as well as thelevel-1 coefficients are considered as outcomes inthe level-3 equation. In this analysis, all child andclass effects are assumed to be fixed across schools.In this application of a 3-level HLM model, level-3is included so that school-level variance componentsare calculated.
B00 = G000 + U00B01 = G010B10 = G100B20 = G200B30 = G300B40 = G400B50 = G500B60 = G600B70 = G700B80 = G800
The regression models presented in chapter 5(tables 5 and 7) were obtained after testing all childand class characteristics discussed in that chapterand many interaction effects between program typeand other class and child characteristics. The maineffects and interaction terms tested in these analy-ses are selected based on the research literaturementioned in this report and on prior analyses donewith the ECLS-K data. The focus of the analyses isto describe the relationship between program typeand cognitive gains while controlling for other re-lated variables and to investigate whether this rela-tionship is consistent across levels of child and otherclass characteristics. The child characteristics con-sidered in these analyses are those that are oftenassociated with academic performance (e.g., West,Denton, and Reaney 2001). The class level charac-teristics tested in these models are those that, likeprogram type, are related to the time and individualattention available for instruction for each child inthe kindergarten classroom. The interactions testedin the analyses investigate whether gains made infull-day programs are differentially associated withother child and class characteristics. As describedin chapter 5, the tested main effects are: povertystatus, race/ethnicity, age, sex, fall reading ability(or fall mathematics ability for the mathematics gainsmodel), time lapse between assessments, programtype, class size, presence of an instructional aide,
relative time for reading instruction (or relative timefor mathematics instruction for the math gainsmodel), use of reading achievement groups (ormathematics groups for the mathematics gainsmodel), region of the country, location, and school’sconcentration of low-income students. The inter-actions effects tested are: ‘program type x race/ethnicity,’ ‘program type x age,’ ‘program type xsex,’ ‘program type x fall reading (or mathematics)ability,’ ‘program type x class size,’ ‘program type xaide,’ ‘program type x aide x race/ethnicity,’ ‘pro-gram type x use of reading (or mathematics) groups.’The initial models were reduced to the final mod-els presented in tables 5 and 7 using a backwardelimination procedure. That is, non-significant ef-fects were dropped from the model one at a timeusing the Wald statistic. Non-significant terms(p>.05) were not included in the final models pre-sented. The regression coefficients, standard errors,and p-values presented in the footnotes accompa-nying statements about non-significant terms arethose obtained when adding the terms to the finalmodels presented in tables 5 and 7. There is noindication of multicollinearity between the inde-pendent variables tested in the models which wouldsuggest that a variable was not included in themodel due to it’s close association with another vari-able in the model. The Variance Inflation Factors(VIF), which provide a measure of the degree ofcollinearity among independent variables all fallbelow the common cutoff threshold of 10.0 (Hair,Anderson, Tatham, and Black 1998). For all vari-ables tested in the reading analysis, the VIF valuesranged from 1.02 to 1.71, and for variables in themathematic analyses the VIF values ranged from1.01 to 1.74.
The HLM method allows the variance compo-nents at each level of a model to be analyzed. Chapter5 presents the variance of gain scores that is associ-ated with each level of the data (i.e., children withinclassrooms, classes within schools, and betweenschools) and the amount of variance at each levelthat can be attributed to the child and classroomcharacteristics specified in the models. Variancecomponents are compared from one model to thenext by calculating the change as a percent. Forexample, the school-level variance of mathematicsgain scores after accounting for child-level charac-teristics is 1.80 and when program type is added to
Appendix D: Methodology and Technical Notes

Full-day and Half-day Kindergarten in the United States126
the model this goes down to 1.49. This representsa change of 17 percent (((1.80–1.48)/1.80)*100).This is interpreted to mean that after accountingfor the relationship between child characteristicsand mathematic score gains, program type accountsfor 17 percent of the variation of mathematics scoregains between schools.
Weights and Standard Errors
Chapters 2, 3 and 4To produce the national school, child and class
level estimates from the ECLS-K data that appearrespectively in chapters 2, 3, and 4 of this report,the sample data were weighted. Weighting the dataadjusts for unequal selection probabilities at theschool and child level and adjusts for school, child,teacher and parent nonresponse. In addition toproperly weighting the responses, special proceduresfor estimating the statistical significance of the esti-mates are employed because of the ECLS-K’s com-plex sample design. Replication methods of vari-ance estimation are used to reflect the sample de-sign used in the ECLS-K. A form of the jackknifereplication method (JK2) using 90 replicates is usedto compute approximately unbiased estimates forthe standard errors of the estimates usingWesVarPC.
Chapter 5The hierarchical linear model analyses presented
in chapter 5 are weighted at the child level to ac-count for unequal selection probabilities andnonresponse.49 The multi-level nature of theseanalyses eliminates the need to take into accountthe complex design of the sample of schools andchildren when estimating variances since class- andschool-level variation are accounted for in the mod-els.50 Reported standard errors and p-values for allcoefficients are those produced using the HLM soft-ware (Bryk and Raudenbush 2002).
Variable DefinitionsEach of the variables used in the report are de-
fined below. Variables not discussed in the findingschapters but that appear in the accompanying tablesof estimates (appendix A) are also defined here.
Chapter 2—School variablesProgram type: Full-day or half-day kindergartenprogram type is determined for teachers frominformation provided by teachers in the fall andspring teacher questionnaires. Inconsistenciesbetween rounds are resolved with informationfrom the field management system used byECLS-K field staff to schedule assessments.Schools that have at least one teacher that isidentified as teaching a full-day class is classifiedas a full-day school and those that have at leastone half-day teacher are classified as a half-dayschool. The estimates for the school level com-parisons sum to more than 100 percent becausethese two categories are not mutually exclusive.
School type: Information from the school adminis-trator questionnaire is used to categorize eachschool as either public, Catholic, other religiousprivate or non-religious private. For cases whereschool administrator information is missing,school sample frame data are used to create thisvariable.
Region: States including in each region are asfollows: the Northeast includes CT, ME, MA,NH, RI, VT, NJ, NY, PA; the Midwest includesIL, IN, MI, OH, WI, IA, KS, MN, MO, NE,ND, SD; the South includes DE, DC, FL, GA,MD, NC, SC, VA, WV, AL, KY, MS, TN, AR,LA, OK, TX; the West includes: AZ, CO, ID,MT, NV, NM, UT, WY, AK, CA, HA, OR, WA.
Location: This variable is assigned on the basis ofthe school’s physical address, or mailing address,if the former is not reported. Location types aregrouped into three categories in this report, Largeand mid-sized cities, Suburbs/large towns, andSmall town/rural.
Large and mid-sized cities
! Large city—central city of a metropolitanstatistical area (MSA) or consolidatedMSA (CMSA), with a population of atleast 250,000.
49 The child level weight C2BYCOM is normalized so thatthe sum of the weights equals the sample size.50 This approach does not take into account clusteringassociated with primary sampling units.

127
! Midsize city—central city of an MSA orCMSA, with a population less than250,000.
Suburbs/large town
! Urban fringe of a large or mid-sizedcity—any incorporated place, Census-designated place (CDP), or non-placeterritory within a CMSA or MSA of alarge or mid-sized city and defined asurban by the U.S. Bureau of the Census.
! Large town—an incorporated place orCDP with a population of at least25,000 and located outside a CMSA orMSA.
Small town/rural
! Small town—an incorporated place orCDP with a population between 2,500and 24,999 and located outside a CMSAor MSA.
! Rural—any incorporated place, CDP, ornon-place territory designated as rural bythe U.S. Bureau of the Census.
School minority enrollment: Information from theschool administrator questionnaire is used tocreate this variable. This variable represents thepercent of children enrolled at all grade levels inthe school who are identified as something otherthan “White, non-Hispanic.”
School’s concentration of low-income students: Astandard indicator used for describing the incomelevel of a school’s student population is thepercent of the students who are eligible for free orreduced-priced lunch. Eligibility for free orreduced-priced meals is based on householdincome which must be below 185 percent of thefederal poverty level to qualify for reduced-pricedmeals and below 130 percent of the federalpoverty level for free meals. For the purpose ofthis report, schools with 50 percent or more ofthe its total enrollment eligible for free or reducedpriced meals are classified as high poverty schoolsand schools with between 0–49 percent ofenrolled children eligible for free or reduced-priced meals are designated as non-highpoverty schools. Administrators reported thenumber of children at their school who are
eligible for free lunch and for reduced-pricedlunch. The two values are added together andconverted to a percent of the school’s totalenrollment. However, these items on the schooladministrator questionnaire have a high level ofitem non-response (these data are missing forapproximately 38 percent of public schools).Schools qualify for school-wide Title I fundingwhen 50 percent or more of the students areeligible for free or reduced-priced lunch. Thus,for schools where the free and reduced-pricedlunch information is missing, participation in a“school-wide” Title I program is used as anindicator of whether the free or reduced-pricedlunch eligibility is below or above 50 percent.
Chapter 3—Child variablesFull-day enrollment estimates were presented
at the child-level by the school-level variables de-scribed above and by the following child-level vari-ables.
Program type: Full-day or half-day kindergartenprogram type is determined for teachers frominformation provided by teachers in the fall andspring teacher questionnaires. Inconsistenciesbetween rounds are resolved with informationfrom the field management system used byECLS-K field staff to schedule assessments. Achild’s program type is determined by theprogram type of the teacher to whom the child islinked.
Sex: This variable was obtained during the schoolvisit and verified when necessary during theparent interview.
Mother’s education: This variable is constructedusing a question about the highest grade themother had completed and for cases where shedid not complete high school, whether themother had obtained a high school equivalencydegree. This information is collapsed into fourcategories: less than high school, high schooldiploma or equivalent, some college includingvocational/technical training, and bachelor’sdegree or higher.
Primary language spoken in the home: A dichoto-mous variable is used to indicate whether or notEnglish was the primary language spoken at
Appendix D: Methodology and Technical Notes

Full-day and Half-day Kindergarten in the United States128
home. This composite is constructed by usingresponses to three questions in the parent inter-view: whether another language other thanEnglish was regularly spoken at home; if yes,whether English was also spoken at home; and ifEnglish and one or more other languages werespoken at home, which of those languages isconsidered the home’s primary language.
Child’s race/ethnicity: The race/ethnicity compos-ite is computed using two parent-reportedvariables, ethnicity and race. Parents indicatedwhether the child is Hispanic and then selectedone or more races. All Hispanic children areclassified as Hispanic regardless of the raceindicated and all non-Hispanic children whobelong to more than one racial group are groupedin the “other” category for analyses in this report.
Diagnosed disability: This composite variable isderived from parent information on whether thechild has been diagnosed by a professional ashaving problems with attention, activity level,coordination, speech, hearing, or vision, or hasparticipated in therapy or programs form childrenwith disabilities.
First time kindergartner: Approximately 5percent of the kindergarten children in the studyhad also been in kindergarten the previous schoolyear. Children that were not repeating kindergar-ten were designated as first time kindergartners.Both types of kindergartners are represented inchapter 3 where child-level estimates are pre-sented. In chapter 5, however, only first timekindergartners are represented in the analyses offall to spring gain scores.
Poverty status: The child poverty variable isbased on the federal government’s povertythreshold, which is calculated using householdincome and the number of people living in thehousehold. Income is imputed for children forwhom this information is missing using relateddata from the parent interview. In 1998, thepoverty threshold for a family of four was$16,655. This variable has two categories,children whose household is at or above thepoverty threshold and children whose householdis below the poverty threshold.
Child’s age at entry: This variable is the child’sage at the beginning of the 1998–99 school year.This variable was constructed using two variables:month and year of birth.
Chapter 4—Class variablesProgram type: Full-day or half-day kindergartenprogram type is determined for teachers frominformation provided by teachers in the fall andspring teacher questionnaires. Inconsistenciesbetween rounds are resolved with informationfrom the field management system used byECLS-K field staff to schedule assessments.Morning and afternoon classes for teachers thatteach two half-day classes are treated as twoseparate classes in this report. Teachers with twohalf-day classes provided the class compositioninformation (percent minority and percentlimited English proficiency), separately for eachclass.
Percent minority: Information from the teacherquestionnaire is used to create this variable. Thisvariable is the percent of children in the class whoare identified as something other than “White,non-Hispanic.”
Percent limited English proficient: Teachersprovide information about the number of chil-dren in the class that have limited Englishproficiency. This number is converted into apercent of the class using the total class sizecomposite variable described below.
Teacher’s race/ethnicity: The teacher’s race/ethnicity composite is computed using two itemsfrom the teacher questionnaire, ethnicity andrace. Teacher’s indicated whether they are His-panic and then selected one or more races. AllHispanic teachers are classified as Hispanicregardless of the race indicated and all non-Hispanic teachers who belong to more than oneracial group are grouped in the “other” category.
Teachers provided information about this andother background characteristics (highest degree,certification, and years teaching kindergarten) onquestionnaires distributed in the fall. Teachers newto the study in the spring received questionnaireswith these items during the spring data collection.

129
Teacher’s highest degree: Teachers provided theirhighest level of education on the teacher ques-tionnaire. The categories were collapsed to:bachelor’s degree, master’s degree, and doctorateor educational specialist degree. No public schoolteachers had less than a bachelor’s degree as theirhighest education level.
Teacher certification: There are two separatevariables for teachers certification: one indicatingwhether the teacher is certified in early childhoodeducation and one indicating whether the teacheris certified in elementary education. This infor-mation comes from the teacher questionnaires.
Teachers’ certification type: Teachers who reporthaving a “regular” teaching certificate or “thehighest certification available” were grouped intothe category “fully certified.” Teachers who reporthaving a temporary, probational, provisional, oremergency certificate, or those who report havingan alternative certification program are groupedinto the category “other”.51
Years teaching kindergarten: This variable is froma single question on the teacher questionnaire.The teachers provided the number of years,including the current school year, that they havetaught kindergarten (including “transistional/readiness kindergarten” and “transistional/pre-1st
grade”).
Class size: Teachers with two half-day classesprovided class size information separately for eachclass. This variable is derived from multipleteacher questionnaire items. Class size is based onthe total enrollment item that follows the enroll-ment counts for students of different racial/ethnicbackgrounds. For classes where this informationwas missing, the total enrollment item followingthe enrollment counts for students of different
ages was used. A third measure, the sum of thenumber of boys and the number of girls in theclass was used when the other enrollment itemsare missing. This class size composite variable wasthen converted into a three-category variable: upto 17, 18–24, and 25+. The rationale for choos-ing these cut-off points is explained on page 52.
Classroom aides: Teachers provide informationabout three types of paid classroom aides—regular, special education and English as a secondlanguage (ESL) aides. Information about the aidesin the class was collected in the spring of 1999.For this report, a class is identified as having oneof these three types of aides if the aide is paid (asopposed to a volunteer), works directly withchildren on instructional tasks (as opposed tohelping with non-instructional tasks) and spendsat least an hour per day in the classroom. Teacherswith two half-day classes did not provide thisinformation separately for each class. It is as-sumed that teachers report this information forthe entire day rather than for each class sepa-rately. Therefore, when constructing this variableteachers with two half-day classes had to reporthaving the aide for at least two hours during theday in order to have the aide count for the twoclasses. An assumption is made for these teachersthat an aide they have for two hours during theday spends about an hour in each of their twoclasses.
Classroom organization: In the spring of thekindergarten year, teachers report the amount oftime per day their students spend in differenttypes of teacher-directed activities—whole class,small group and individual—and the amount oftime per day students spend in child-selectedactivities. The response categories for each of thesefour items are “no time,” “half an hour or less,”“about one hour,” “about two hours,” and “threeor more hours.” In order to create a time estimatethat could be averaged, the five response catego-ries are converted to minutes; 0, 15, 60, 120, and180, respectively. The time spent in each of thesedifferent arrangements is reported both in termsof actual number of minutes and in terms of thepercent of the total class time that is devoted toeach activity. The total available time was calcu-lated by adding the number of minutes across the
51The ECLS-K does not include teachers with probationarycertificates in its estimate of teachers with full certificationbecause probationary certificates were grouped along withtemporary and emergency certification on the ECLS-Kquestionnaire. Published reports based on the 1999–2000Schools and Staffing Survey (e.g., Seastrom et al. 2002)have treated teachers with probationary certificates ascertified. Data from the 1999–2000 SASS indicate that 3percent of public school kindergarten teachers in 1999–2000 who were certified had a probationary certificate.
Appendix D: Methodology and Technical Notes

Full-day and Half-day Kindergarten in the United States130
four variables. The percent of total time for eachvariable (whole class, small group, individual, orchild-selected) was calculated by dividing thenumber of minutes for that variable by thenumber of sum of the minutes reported across thefour variables. Teachers with two half-day classesdid not report this information separately for eachof their classes; it was assumed that their re-sponses would be similar for each class and werelinked to both of their classes as reported.
Grouping strategies: Teachers report the groupingstrategies they use on the spring teacher question-naire. Six variables are reported, three for readinginstruction and three for mathematics instruc-tion—mixed level groups, achievement groups,and peer tutoring. Teachers report the frequencythat they use each of these grouping strategiesand the responses for each are collapsed into threecategories: 1) daily, 2) weekly (“two or three timesa week” and “once a week”), and 3) less thanweekly (“once a month,” “two or three times amonth” and “never”). Responses provided byteachers with two half-day classes were linked toboth of their classes.
Subject areas—frequency: Teachers report thefrequency their children have various subject areason the spring teacher questionnaire. The subjectareas are, reading language arts, mathematics,social studies, science, music, art, dance/creativemovement, and theater/creative dramatics. Forthe purpose of this report the responses to theseitems are collapsed into three categories: 1) daily,2) weekly (“two or three times a week” and “once aweek”), and 3) less than weekly (“once a month,”“two or three times a month” and “never”).Responses provided by teachers with two half-dayclasses were linked to both of their classes.
Subject areas—minutes per day: Teachers reportthe number of minutes their children spend onsubject areas on the days that the subject area istaught. The number of minutes per day forreading and the number of minutes per day formathematics are reported using the same responsecategories that appear on the questionnaire, “1–30 minutes a day,” “31–60 minutes a day,”“61–90 minutes a day,” and “more than 90minutes a day.” In chapter four, these variables
are presented for all classes, without regard to thenumber of days the subject area is taught.Responses provided by teachers with two half-dayclasses were linked to both of their classes.
Reading and mathematics skills and activities: Thevariables for specific skills and activities discussedin chapter four and shown in figures B1 to B14come from the spring teacher questionnaires. Forthe purpose of this report the responses to theseitems are collapsed into three categories: 1) daily,2) weekly (“two or three times a week” and “once aweek”), and 3) less than weekly (“once a month,”“two or three times a month” and “never”). Theresponse categories for the list of skills differslightly from the ones used for activities; “nottaught” appears on the list of skills and is treatedthe same as “never” responses on the list ofactivities.
Additional variables for Chapter 5Many of the variables used in the analyses de-
scribed in chapter five are defined above (e.g., pro-gram type, class size, and child’s race/ethnicity).The variables unique to chapter five are describedbelow. Complete descriptions of every chapter 5variable including how they are used in the contextof the regression analyses appear in that chapter onpages 51 through 54.
Reading gain score: This is the difference betweenthe child’s spring and fall reading IRT scalescores. The fall and spring IRT scale scoresrepresent estimates of the number of itemsstudents would have answered correctly if theyhad taken all of the 72 questions in the readingtest.
Mathematics gain score: This is the differencebetween the child’s spring and fall reading IRTscale scores. The fall and spring IRT scale scoresrepresent estimates of the number of itemsstudents would have answered correctly if theyhad taken all of the 64 questions in the math-ematics test.
Initial reading ability: The distribution of allchildren’s fall reading scale scores are examinedand three equal-sized groups are formed torepresent low, middle and high initial readingability groups.

131
Initial mathematics ability: Like reading, thedistribution of all children’s fall mathematics scalescores are examined and three equal-sized groupsare formed to represent low, middle and highinitial math ability groups.
Time lapse between assessments: The number ofdays between the fall and spring assessment datesis calculated and transformed so that 1 equals180 days (approximately the mean time lapse)and other values represent a proportion of 180days (e.g., 150 days = .83). This variable hasvalues ranging from .64 to 1.46. See page 52 for adiscussion about why this variable is included.
Relative time for reading instruction: This is adichotomous classroom variable indicatingwhether or not the class spends a relatively largeamount of time on reading/language arts instruc-tion. This variable is based on teachers’ responsesto questions about the number of minutes perday and number of times per week they havereading instruction in their class. Since full-dayand half-day classes do not have the same amountof total time during the day for instruction, therelative time for reading instruction variable iscreated separately for full-day and half-dayprograms. For full-day classes, the modal response
for reading instruction is the category 61–90minutes per day and for half-day classes themodal response category is 31–60 minutes perday. For the purpose of these analyses a full-dayclass is categorized as having “more” time forreading instruction, if reading is taught at least3–4 times a week and more than 90 minutes perday. Half-day classes are categorized as having“more” time for reading instruction if reading istaught at least 3–4 times a week and more than60 minutes per day.
Relative time for mathematics instruction: Thedistribution of responses for amount of timespent on mathematics instruction is examined tocreate a “time for math instruction” variable. Themodal response for full-day classes is 31–60minutes per day, so classes are coded as having“more” time for math instruction when math istaught more than 60 minutes per day (and atleast 3–4 times per week). In half-day classes, themode response is 1–30 minutes per day so theseclasses are classified as having “more” time formathematics instruction if they have math formore than 30 minutes per day (and at least 3–4times per week).
Appendix D: Methodology and Technical Notes