fujikura ltd. annual report 2017 profile..... 16 for the future ..... 23 2030 vision..... 24 open...
TRANSCRIPT
Fujikura Ltd. AN
NU
AL REPO
RT 2017

Table of Contents“Tsunagu” Technology ...................................................................................... 2Fujikura’s History ................................................................................................. 4President’s Message .......................................................................................... 6At a Glance ............................................................................................................ 8Financial Highlights .........................................................................................10Progress of 2020 Mid-term Business Plan ..............................................12Company Profile ...............................................................................................16For the future .....................................................................................................232030 Vision ..........................................................................................................24Open Innovation...............................................................................................25New Business Development ........................................................................26Special Feature ..................................................................................................27R&D Activity for Future Growth ..................................................................28Corporate Social Responsibility ..................................................................30Top Management .............................................................................................34Corporate Governance ...................................................................................35Risks .......................................................................................................................39Financial Section ...............................................................................................41Management Discussion & Analysis .........................................................42Financial Review ...............................................................................................44Global Network .................................................................................................74Main Consolidated Subsidiaries/Investor Information .................... 75
2 3Fujikura Annual Report 2017 Fujikura Annual Report 2017
“Tsunagu”Technology
Fujikura Group Corporate PhilosophyMission
The Fujikura Group’s mission is to create exceptional value for our customers around the world using “Tsunagu”
(the Japanese word meaning “connecting”) technologies.We dedicate ourselves to providing exceptional products and solutions earning
our customers’ trust and contributing to society.
Vision• Fujikura’s vision is to be the most trusted partner in our markets, to
continuously develop innovative and relevant products and solutions, and to positively impact our communities.
• We strive to become the leading player in our markets by utilizing our “Tsunagu” technologies, tirelessly developing innovative and useful products and solutions.
• Each individual within the company will endeavor to become an essential player, thus developing a team that can truly help Fujikura make its mark on the world stage.
Core Values• Customer Satisfaction “Are you doing enough to ensure customers are perfectly satisfied?”• Change for the Better “Are you willing to take up challenges to drive progress?”• Collaboration “As a Fujikura associate, are you driven to work together with others to deliver
the best possible result for our company?”
Behavior Standards• Always consider the customer first. Make customer satisfaction your highest
priority.• Consider what to accept and what to reject.• Identify and demonstrate clear goals.• Stay ahead of emerging technologies and connect people and solutions to the
communities we serve.• Choose your actions based on facts.

4 5Fujikura Annual Report 2017 Fujikura Annual Report 2017
Begi
nnin
g
1883 November 3 Zenpachi Fujikura goes to see a
demonstration of the arc light on the balcony of the postal service and telegraph office on Nihonbashi-dori with his youngest brother, Tomekichi, and takes an interest in electricity.
1885 Zenpachi Fujikura begins manufacturing silk and cotton insulated winding wires.
1886 Tomekichi Fujikura travels to USA.
Esta
blis
hmen
t
1890 Tomekichi Fujikura returns from the USA.
1893 Launch of manufacture of first rubber-insulated wires in Japan.
1901 Founder, Zenpachi Fujikura passes away (59).
Reorganization as an unlimited partnership named Fujikura Electric Wire & Rubber Co., Ltd. was founded.
Representative: Tomekichi Matsumoto
Capital: 25,000 yen1903 Appointment of Fujikura plant as
a Japan’s first rubber-insulation factory by the Department of Communication.
1910 Establishment of Fujikura Electric Wire Corporation.
Representative: Tomekichi Fujikura
Capital: 500,000 yen1916 Launch of copper refining, rolling
and wiring operations.1918 Acquisition of the patent for
multi-layered rubber-insulated wires.
1919 Established “Fujikura Gakuen”, a special facility for mentally-challenged children, on Oshima island.
Rest
orat
ion
afte
r the
Ear
thqu
ake
and
Fujik
ura
of T
echn
olog
y 1923 Completion of the Fukagawa head office and plant.
Total destruction of the Fukagawa head office and plant by fire in the aftermath of the Great Kanto Earthquake.
1925 Delivery of 1200 mm twisted pair cables made of domestically manufactured insulated paper to the Department of Communication.
1930 Launch manufacturing of unit-type city cables.
1931 Launch manufacturing of “Fujikousen”, Japan’s first electric wire for aircraft.
Fujikura’sHistory
In November 1883, Zenpachi and his brother went to see
the arc light demonstration held on Nihonbashi-dori. They
subsequently embarked on the electrical wire business after
noticing the similarities in braiding technology for the hair
ornaments in Zenpachi’s home business and the insulation for
electrical wire.
Over the more than 130 years since then, Fujikura has
been the first to succeed in many things, both in Japan
and worldwide. Fujikura was the first company in Japan to
manufacture of rubber insulation for wires and “Fujikousen”
electrical wire for aircraft prior to the war, then was the first to
discover the ultra low-loss area of the optical fiber sector after
the war. This achievement by Fujikura and other companies was
recognized as an IEEE Milestone.
Contributing to the prosperity of society by supplying highly
reliable products to the world through innovative technologies,
and maintaining high product quality through the unbroken
succession of exacting standards of monozukuri (craftsmanship)
from our predecessors is what has ensured a relationship of trust
between Fujikura and its customers right up to the present.
This is the point from which Fujikura started and by which it
lives today.
The diversification and globalization of its business led Fujikura to establish many overseas locations from the 1980s to the present. The Fujikura Group currently operates 140 companies in 29 countries.
Of particular note is Fujikura Electronics (Thailand) Ltd., which is part of the Electronics Business Company and was established in 1984. Since that time, the Kingdom of Thailand has been one of Fujikura’s main manufacturing locations. It was damaged by flooding in 2011, but Fujikura succeeded in restoring operations within a short period of time.
Fujikura’s Automotive Products Company has kept pace with the global expansion of our customers by establishing and operating locations overseas.
Post
war
and
hig
h ec
onom
ic g
row
th p
erio
d
1945 Complete destruction of Fukagawa plant in Tokyo Air Raid.
1949 Delivery of Japan’s first 24-core TV camera cables to NHK (Japan Broadcasting Corporation).
1957 Launch of wiring harness manufacturing.
1958 First-time delivery of 154 kV OF cables to Tokyo Electric Power Co., Inc.
Establishment of Tama Fujikura Gakuen.
1964 Development of equipment for the manufacture of SZ-twisted telecommunications cable.
1965 Launch manufacturing of printed circuits using a die stamp method.
1968 Relocation of head office to the Kasumigaseki Bldg.
Peri
od o
f uph
eava
l and
har
dshi
ps
1975 Joint optical fiber research agreement signed by Nippon Telegraph and Telephone Public Corporation, Furukawa Electric Co., Ltd., Sumitomo Electric Industries, Ltd. and Fujikura.
Development of Japan’s first flat-type elevator cables.
1976 Development of world’s first long-wavelength/ultralow loss optical fiber in cooperation with Nippon Telegraph and Telephone Public Corporation.
1977 Relocation of the head office to the Fujikura Bldg. in Gotanda.
1979 Launch manufacture of FPCs for electronic devices.
World’s first transmission loss of only 0.27 dB/km achieved with a low-loss single-mode optical fiber.
1980 Development of single-mode optical fusion splicers.
1981 Development of heat pipes for snow melting.
Development of Japan’s first OPGWs (Optical Fiber Composite Overhead Ground Wire).
1982 Development of semiconductor pressure sensors.
Launch of membrane switch manufacturing.
1983 Delivery of optical fiber for the Pan-Japan (longitudinal) optical fiber transmission line.
1985 Development of the world’s first core alignment fusion splicer.
1987 Successful fabrication of oxide superconducting wires.
1988 Development of world’s first CS trolley wires.
Development of world’s first multi optical fiber fusion splicers.
1990 Development of EDFA (erbium-doped optical fiber amplifier).
Completion of New Fukagawa Head Office Building.
Glo
baliz
atio
n ne
wte
ch
1992 The corporate name changed to Fujikura Ltd.
1993 Delivery of 500 kV CV cables and Hokkaido-Honshu optical fiber integrated submarine cables.
1995 Development of super low loss multi-fiber optical connectors.
1998 Delivery of World’s largest 500 kV DC OF submarine cables to Kansai Electric Power Co., Inc. and J Power (Electric Power Development Co., Ltd.)
Development of the first recyclable, ecological electrical wire in the world
1999 Development of a new signal cable for the “Shinkansen” bullet train.
2000 Completion of a major urban redevelopment project on the site of the previous Fukagawa Plant, and opening of the “Fukagawa Gatharia” complex.
2001 Commercialization and marketing of FTTH optical fiber products.
Development of a seat sensor for automobiles.
2002 Live wire insulation diagnostic device for high-voltage CV cables wins Shibusawa Award.
Delivery of cables for a deep-earth exploration vessel.
2003 Development of dye-sensitized solar cells.
2004 Delivery of cables for ultra-high speed elevators.
Peri
od o
f maj
or g
loba
l com
peti
tion
2005 Adoption of corporate philosophy: “MVCV (Mission, Vision, Core Value)”
Establishment of VISCAS Corporation, a joint venture company in high voltage business with Furukawa Electric Co., Ltd.
Establishment of Fujikura Dia Cable Ltd. in a joint venture with Mitsubishi Cable Industries Ltd.
2007 Shatters the critical current record with an yttrium-based oxide superconducting wire.
2010 Completion of ‘Fukagawa Gatharia’ (Fukagawa re-development project)
Open “Millennium Woods”, Fujikura Bio-Garden.
2011 Damage from floods in the Kingdom of Thailand.
2013 Introduction of in-house company system through organizational restructuring.
2015 Establishment of AFLIG, LLC, a company in the U.S. that manufactures and sells optical fiber splicing products.
The VAD method is recognized as a milestone by the IEEE.
2016 Consolidation of all manufacture and sale of industrial electrical wire in Fujikura Dia Cable Ltd.
Reorganization of VISCAS Corporation and transfer of the distribution line and overhead power line business to Fujikura.
Founder, Zenpachi Fujikura

7Fujikura Annual Report 20176 Fujikura Annual Report 2017
the future
This fiscal year is key to achieving the 2020 Mid-term Business Plan.
We will put forth our best effort on this as we also prepare for future growth by
continuing to work on strengthening and maintaining the earning power of the
Fujikura Group and focus on return regardless of scale in FY2017.
Bridge to
The business environment during FY2016 produced stiff headwinds as
demand for electronics products from major customers fell in the face
of exchange rate volatility stemming from Brexit and the inauguration
of the Trump administration. However, market demand was strong,
primarily in telecommunications, and this resulted in a growth in profit
despite the decline in revenue. The operating margin also increased by
0.4 percentage point to 5.2% and it is my view that the company has
taken another step toward a recovery in earning power.
When it was first announced last year, the 2020 Mid-term Business
Plan called for a year-on-year decline in both revenues and profits
during FY2016. However, the positive effects of various measures
implemented brought about this improvement. As demonstrated
by the electronics segment, I believe this shows that the company
has reached the point of being able to maintain a profit margin at
or above a certain level even in the face of a decline in demand, and
demonstrates the benefits achieved from the structural reform of our
business, which was completed in FY2015.
While FY2016 provided a steady start to the 2020 Mid-term Business
Plan as the initial fiscal year in that plan, the favorable results were due
to results achieved during the 2015 Mid-term Business Plan. I therefore
regard FY2017 as the true start of the 2020 Mid-term Business Plan.
FY2017 is the second year of the 2020 Mid-term Business Plan, and
will be the year during which the results of measures initiated since I
became the company president will begin to emerge in stages.
During FY2017, my aim is to achieve a solid launch of the increased
production capacity that Fujikura has invested in since last year and to
maintain a sense of urgency in meeting market demand, particularly in
the telecommunications business, which will benefit from a tailwind.
The Fujikura Group will continue to build an unshakeable foundation
for the core pillars of our business, not just during this 2020 Mid-term
Business Plan but also in the next, 2025 Mid-term Business Plan.
We anticipate demand stemming from the debut of new models
by major customers in the electronics business this year. However,
we will still continue our work on reinforcement to create a corporate
structure with solid earning power by being prepared to react swiftly to
fluctuations in demand, just as we did in FY2016.
We project an operating margin of 5.4% in FY2017, a 0.2 percentage
point increase compared to FY2016 due to the initiatives detailed above
and to a change in the method of depreciation, and intend to make
steady progress toward achieving an operating margin of 7.0%, which is
a goal of the 2020 Mid-term Business Plan.
Masahiko ItoPresident & CEO
President’s Message

8 9Fujikura Annual Report 2017 Fujikura Annual Report 2017
Americas34Japan
41
21 Asia &
Oceania
24EMEA
China20
Global Operation Network (Number of group companies)10 Years of Business Trend Net Sales by Segment
Power & Telecommunication Systems Electronics Business
Net Sales: ¥653 billion
Ratio of Operating Income to Net sales: 5.2%
Real Estate BusinessAutomotive Products
Net Sales: ¥349 billionRatio of Operating Income to Net sales: 5.8%
Net Sales: ¥156 billionRatio of Operating Income to Net sales: 4.8%
Net Sales: ¥10 billionRatio of Operating Income to Net sales: 45.8%
Net Sales: ¥133 billionRatio of Operating Income to Net sales: 1.9%
0
100
200
300
400
500
600
700
0
5
10
15
20
25
30
35
40
45
2007 2008
Lehman Shock Earthquake in Japan Flood in Thailand
2009 2010 2011 2012 2013 2014 2015 2016
(Billions of yen) (Billions of yen)
20
0
1816
13
6
20 25
660
574
504 521 509 491
590
661678 653
Power & Telecommunication Systems (Power Systems)
Power & Telecommunication Systems (Telecommunication Systems)
Electronics Business
Automotive Products
Others
OP
3234
At a Glance
1%2%
Power & Telecommunication Systems: 349.6 (Power Systems: 196.0 Telecommunication Systems: 153.6)
Net SalesTotal
653.7
(Billions of yen)
53%
24%
20%
Electronics Business: 156.7Automotive Products: 133.1Real Estate Business: 10.1Other: 4.1

10 11Fujikura Annual Report 2017 Fujikura Annual Report 2017
Financial Highlights
For the Year (Billions of yen)
653.7 Net Sales –3.6%
34.2 Operating Income +4.9%
12.9 Net Income Attributable to Owners of Parent +14.0%
45.6 Capital Expenditures +42.7%
15.6 R&D Expenditures –3.7%
62.7 EBITDA +16.8%
6.4% ROE +18.4%
At Year-End
588.6 Total Assets +6.5%
224.5 Total Net Assets +3.0%
56,961 Number of Employees +5.3%
Per Share Data
44.61 Net Income (Loss)—Primary +20.6%
– Net Income—Fully Diluted
¥10.00 Cash Dividends
0
100
200
300
400
500
600
700
800Net Sales
653.7
45.6
34.2
62.7
224.5
6.4
2012 2013 2014 2015 2016 2017 2012 2013 2014 2015 2016 2017
2012 2013 2014 2015 2016 2017 2012 2013 2014 2015 2016 2017
2012 2013 2014 2015 2016 2017 2012 2013 2014 2015 2016 2017
Operating Income
0
5
10
15
20
25
30
35
40
0
10
20
30
40
50
60
70
EBITDA (Earnings Before Interest, Taxes, Depreciation and Amortization)
0
50
100
150
200
250
300
Total Net Assets
-4
-2
0
2
4
6
8Rate of Return on Equity (%) (Billions of yen)
(Billions of yen) (Billions of yen)
(Billions of yen) (Billions of yen)
Capital Expenditures, Research and Development Expenses
Capital ExpendituresResearch and Development Expenses
0
10
20
30
40
50
60
15.6

12 13Fujikura Annual Report 2017 Fujikura Annual Report 2017
As a company creating customer value, we will become a promising company with a futurewith “strong earning power” and “power of strong metabolism”!
Progress of 2020 Mid-term Business Plan
Growth Strategy and Key MeasuresWe have adopted the following growth strategy to achieve the goals of the mid-term plan.
Goals to be Achieved in FY2020
Developing deeper tieswith strategic customers
Speed upnew business creation
Open innovation
Management reform & business structural
reform
• Ratio of operating income to net sales:
7.0% or higher
• Net sales: 900 billion yen
• ROE: 10% or higher
• D/E ratio: 40:60 (0.66 times)
■■ Developing deeper ties with strategic customers - Work to achieve greater business growth - Seize new business opportunities
See the next page for further details.
i) Strengthen EPC/ service businessii) Approach to overseas key customers by providing strategic products (SWR/WTC)iii) Strengthen relation with strategic customers further
■■ Strengthen the structure for promoting new business■■ Key areas
- Automotive-related - Industrial machinery - Medical devices
Actions in Fiber laser business - Introduce more competitive products - Strengthening marketing capabilities
■■ Supply the missing pieces of portfolios and value chains and create new value for customers■■ Speed up technology development, business development, and business growth
New actions to create innovation - Develop 2030 Vision - Hold a matching event with start-up companies
■■ Response to a Corporate Governance Code■■ Improve the quality and speed of decision-making in a diverse range of businesses■■ Strengthen the management base
i) Structural reform for domestic cable & wire business - Viscas Corporation reorganization - Fujikura Dia Cable Ltd. business integration
ii) Corporate governance reform
Ratio of operating income to net sales
4.85.2
4.1
6.2
7.0
5.4
FY2015 FY2016 FY2017Est.
FY2018Plan
FY2020Plan
FY2018Plan
FY2020Plan
(%)
FY2017 Business Plan2020 Mid-term Business Plan
3
4
5
6
7
8
Net sales
678.5
653.7
690 810
900
700
FY2015 FY2016 FY2017Est.
(billion yen)
FY2017 Business Plan2020 Mid-term Business Plan
0
200
400
600
800
1000
ROE
5.4
7.1
6.4
9.0
10.0
9.0
FY2015 FY2016 FY2017Est.
FY2018Plan
FY2020Plan
(%)
FY2017 Business Plan2020 Mid-term Business Plan
4
6
8
10
12
D/E ratio
1.011.11
0.66
FY2015 FY2016 FY2020Plan
(times)
FY2017 Business Plan2020 Mid-term Business Plan
0.0
0.5
1.0
1.5
2.0

14 15Fujikura Annual Report 2017 Fujikura Annual Report 2017
■■DC’s demand is expected to be stable in the future
(i) Scope of the Company➔■ Capture optical interconnection solution business in DCs market thoroughly➔■ Market is of a wide range (Connector, terminal, ultra multi-core cable etc.)
(ii) Contribution of AFLIG acquired in December 2015➔■ Started to work for a globally expanding hyper scale/enterprise DC customers
■■Business expansion and strengthening of profitability has been bearing fruits steadily
1. EPC service for overseas large telecommunication companies
■■Respond to customers’ requirements by high quality products and technologies as well as flexible production system
Building flexible production system(i) Turning fixed cost into variable cost(ii) Manpower saving by automatization of inspection
process and other method Improvement in productivity per capital
We will enhance improvement further in FY2017
(i) FTTH engineering for cities is 2 times up YoY(ii) Construction in a big city in the country(iii) New entry into FTTH construction for an electric power
company
2. Emerging countries (Myanmar, Brazil) Receiving orders by market environment improvement
■■We have been recognized by customers since last year. Expect revenue growth in FY2017■■We will improve optical cable business’s profitability by introducing high value added products
Thin and light super multi- core cable which is easy to installReduced -external diameter- by 37% and -weight- by 64% compared with conventional 1728-core-cable
Rapidly growing net sales of SWR/WTC (Net sales in April in 2016 was regarded as 100)
Number of construction project in citiesFY2015 indexed to 100
Improving productivityProductivity indexed to April 2015 = 100
Responding to strong demand of the growing data center business Strengthen EPC/ service business
Aggressive response to customers’ requirements in FPC Business
Approach to overseas key customers by providing strategic products (Spider Web Ribbon/Wrapping Tube Cable)
Comparison of cross section of optical cables
*Image only
● Applying Spider Web Ribbon● 12 fiber mass fusion splicing● Easy separation into single fibers by hand● Easy identification of ribbons and fibers● Full dry cable● Easy and quick access to fibers● Smallest cable diameter & lightest weight in the world● Long cable length / drum
Strength Member(Glass FRP)
Spider Web Ribbon with Ringmarking
Fujikurahttp://www.fujikura.co.jp Search
Water Blocking Tape
Spider web ribbon
Wrapping Tube
Water absorbent yarn
Ripcords
Bundle Unit by Bunching Tape
288-1728F Ribbon Full Dry Central Core Cable
Fujikura has developed industry-changing ribbonized optical fiber product called Spider Web Ribbon (SWR). This product allows 12 fiber mass fusion splicing as well as drastically reduces cable outer diameter and weight. Applying SWR, totally unique features of optical cable called wrapping tube cable (WTC) are now released for 288 - 1728 fibers inside. In addition to 12 fiber mass fusion splicing, WTC's jelly-free central fiber core construction significantly reduces cable deployment time by allowing easy access to fibers and eliminating jelly cleaning time.
April March0
50
100
150
200
250
300
2015 20160
100
200
300
2015 2016
60%
80%
100%
120%
140%
160%
Securing high productivity in low seasonAbout 30% up

16 17Fujikura Annual Report 2017 Fujikura Annual Report 2017
Company Profile | Power & Telecommunication Systems Company
Net Sales and Ratio of OperatingIncome to Net Sales
(Billions of yen)
FY2014 FY2015
366.2 366.5
FY2016 FY2017Est.
Net Sales Ratio of Operating Income to Net Sales (%)
0
100
200
300
400
5.8%5.8%
3.2%3.2%
3.9%3.9%
349.6349.6
5.8%5.8%
365.6365.6
3,456We launched sales of a small-diameter, lightweight 3,456-fiber WTC optical cable that is easy to handle. It increases the data transmission capacity of existing line conduits.
Double Electrical transmission capacity can be doubled simply by replacing overhead transmission lines with Invar conductor wires of the same size. It eliminates the need to install new transmission lines and is economical.
CCS (Combined Charging System) Rapid Charger ConnectorWe have obtained CE certification for the CCS rapid charger connectors in addition to CHAdeMO. They can be used in many types of electric vehicles.
High-Density Optical Termination RackA high-density optical termination rack for multifiber cables that can be placed in a small space such as limited floor space of a data center.
Field Installable Optical ConnectorField installable optical connectors that can resolve cabling congestion in an optical termination rack.
This fiscal year we will reach our goal of completing the structural reforms, product differentiation, and development of production technology we embarked on last fiscal year. We will also move forward with putting the infrastructure in place to enable rapid response to robust demand from the communications market, and will strengthen our earning power.
Hideyuki Hosoya Senior Vice President &
Member of the Board
The Power & Telecommunication System Company
implemented structural reform in our businesses and
reallocated resources to growth areas to become a highly
profitable and innovative company. FY2017 is the year in
which we will complete that structural reform.
FY2016 saw an increase in demand for optical fiber,
mainly in China and North America, from brisk investment in
data center wiring, mobile communication networks, FTTx
networks, and other communications infrastructure. The
global optical fiber shortage is expected to persist in FY2017
as well. We will invest in increased production capacity for
optical fiber and optical cable as we ascertain the trends in
demand for these.
Rapid growth in the electric power infrastructure market
is projected in Myanmar and other Southeast Asian countries
and in Brazil and neighboring countries in FY2017. Fujikura
will join hands with partners in those countries to promote
engineering, procurement, and construction businesses.
We will invest many resources in development of new
products and production technologies, strive to differentiate
our businesses in terms of quality, cost, delivery and service
(QCDS), and create new businesses capable of competing
worldwide.
We will complete most preparations for the key measures
the Company will implement to achieve the 2020 Mid-term
Business Plan during FY2017.
Entering a New Phase of Growth

18 19Fujikura Annual Report 2017 Fujikura Annual Report 2017
Company Profile | Electronics Business Company
171.7161.1 156.7
(Billions of yen)
FY2014 FY2015
136.1
FY2016 FY2017Est.
0
60
120
180
4.7%4.7%
7.6%7.6%
4.8%4.8%5.6%5.6%
Net Sales and Ratio of OperatingIncome to Net Sales
Net Sales Ratio of Operating Income to Net Sales (%)
33 yearsIt has been 33 years since the Company first set up operations in Thailand. We have nine manufacturing plants, and employees numbered 40,000 at the peak, but have made progress in improving efficiency and automation since the floods, and currently have around 16,000 employees.
5/9 plantsOur Thai employees are growing in skill and we have reached to point where five of our nine plants, including our main plant, are run by a Thai manager. We will also continue to increase localization in the future.
Heat Pipe for Single Lens Reflex Digital CameraThis cooling module using a thin heat pipe cools the high-performance CMOS sensor and image processor efficiently, thereby controlling heat build-up when shooting video over a long period of time.
High-speed Transmission Flexible Printed Circuit (FPC)Fujikura has achieved greater impedance control than before through high-precision circuit formation technology, and developed a multilayer FPC capable of high-speed transmission that uses materials with low dielectric constant and a low dielectric loss tangent as the interlayer adhesive for the multilayer substrate.
Board-to-Board Connectors for Automotive and Industrial UseFujikura has expanded its line-up with a board-to-board connector that features a floating mechanism with the ability to accommodate positional deviation.
We have recovered from the flood damage and the demands and expectations of our customers have increased even more. We will continue to take on the challenge of “Quality” as the framework of business management in FY2017 as well.
Takashi Sato Senior Executive Vice President &
Representative Director
”Quality” as Framework of Business Management
As the initial year of the 2020 Mid-term Business Plan, FY2016 was an
important year as the launching point onto a new path of growth. The
business environment was nevertheless extremely severe due to global
fluctuation in smartphone demand, high exchange rate volatility, and
other factors. Despite such severe conditions, the company came very
close to achieving the initial plan by reducing fixed costs, increasing the
ratio of variable costs, and engaging in activities focused on improving
quality and increasing automation. The Company was consequently
able to contribute to group profits again in FY2016, following our
full recovery from the flooding in Thailand in FY2015. The Electronics
Business is an important pillar of the Fujikura Group, and we will
therefore continue to work diligently to steadily improve productivity,
increase automation, and adapt to seasonal fluctuations in the future.
FY2017 is the year that true growth will be evident. Customers are
looking to our company more than ever before and orders for highly
sophisticated products are likewise increasing despite the stiffening
competition. We are therefore working diligently on efforts to reduce costs,
improve quality, and increase automation to enable the company to meet
the expectations of our customers precisely. We will also simultaneously
finish sowing the seeds for the future aimed at achieving the goals of the
2020 Mid-term Business Plan. The establishment of a New Electronics
Product R&D Center and Production Innovation Center are main facets of
this and we will harvest the fruits of these efforts in FY2018 and beyond.
FY2017 plans call for net sales of 171.7 billion yen and operating
income of 9.6 billion yen, exceeding FY2016. The entire Company will
once again work as one team to achieve the goals for this fiscal year.

20 21Fujikura Annual Report 2017 Fujikura Annual Report 2017
Company Profile | Automotive Products Company
FY2014 FY2015 FY2016 FY2017Est.
0
50
100
150
3.3%3.3%1.8%1.8% 1.9%1.9% 1.8%1.8%
146.7146.7133.1133.1135.8143.5143.5
Net Sales and Ratio of OperatingIncome to Net Sales
Net Sales Ratio of Operating Income to Net Sales (%)
(Billions of yen)
19 Countries
65 LocationsDuring FY2017, we will expand globally to 19 countries and 65 locations (38 plants and 27 offices), and will build a framework and profit structure capable of meeting customer needs swiftly.
Gear Change in the Auto Business!
CHAdeMO InletThis is a quick charge connector for electric motor vehicles which can meet CHAdeMO specifications. This connector can reduce the insertion force more than 30% compared to conventional connectors, enabling one-handed operation.
Seat Sensor (for S-shaped seat springs)This new seat sensor attaches to the springs installed under the seat cushion material.We have succeeded in reducing the size compared to existing sensors.
Aluminum Conductor Cables and Corrosion Protection for TerminalsAluminum conductor cables are an effective means of reducing the weight of automotive wire harnesses. Fujikura will start mass production of wire harnesses using aluminum conductor cables from July 2017.
We will work mainly with a major European customer to achieve sound growth in the harness business and generate new business on the automotive platform that will form a bridge to the future and contribute to the stable growth of the Fujikura Group.
Akira Sasagawa Senior Vice President & Member of the Board
Despite growth in volume sales, the company saw a 2.7 billion
yen decline in sales to 133.1 billion yen. This represented
a decline of 2.0% compared to last fiscal year and resulted
from the substantial impact of yen appreciation. We achieved
growth in operating income despite difficulties in hiring
personnel in Europe during the fourth quarter. This growth
was attributable to structural reforms in the Asian region
which strengthened the profit structure.
We will continue to put a tri-regional structure into place
with regional headquarters for Europe, North and South
Americas, and Asia and will check in with these regional
headquarters as we develop new products on the automotive
platform through the development of electronic components
and other integrated products. The Advanced Automotive
Technology Center, which was established in 2013, will also
work to invent new products and new technologies targeted
at the next generation of automobiles based on all-Fujikura
technology, and in line with electric vehicle, environmental
friendliness, autonomous car, connected cars, and other
trends.
During FY2017 we will work to normalize operations in
the European region. Many new model launches are also
planned at various locations. Our plan calls for 146.7 billion
yen in sales, an increase of 13.6 billion yen over FY2016, and
2.6 billion yen in operating income. The three global regional
headquarters will work in unison to achieve these goals.

22 Fujikura Annual Report 2017
This year marks the 17th anniversary of the grand opening of Fukagawa Gatharia. We will utilize the management expertise we have accumulated since then to maintain and increase the value of our assets over the medium to long-term and fulfil the role of
supporting our main business.
Tetsu Ito Senior Vice President &
Member of the Board
Company Profile | Real Estate Business Company
The Real Estate Business Company has been engaged in the real estate
leasing and management business since we began redeveloping the former
plant site in FY1998. This business is focused mainly on five office buildings
and two commercial buildings. We possess roughly 107,000 m2 in total
leasable office space. Located less than 4 kilometers from Marunouchi in the
center of Tokyo, we have used the prime location to our advantage and have
been running at full occupancy since FY2014 thanks to good tenants, which
include a bank.
The basic policy of our real estate business has always been to utilize
our heritage of land assets effectively and earn income to support the
manufacturing business. Our goal is to improve tenant satisfaction and
maintain a high occupancy rate for leased offices over the medium to long-
term through systematic investment and renovation to improve the value of
the current buildings and facilities.
While a decline in rental fees for some office tenants and other factors
caused a decline in both revenues and income in FY2016, we expect to achieve
year on year growth in both sales and operating income in FY2017 due to the
acquisition of one office building. Our plan calls for operating income of 5.2
billion yen.
Maintain a Stable Profit Structure
FY2014 FY2015 FY2016 FY2017Est.
10.810.1
(Billions of yen)
10.710.6
0
4
8
12
47.9%47.9%50.4%50.4%
45.8%45.8%48.1%48.1%
Net Sales and Ratio of OperatingIncome to Net Sales
Net Sales Ratio of Operating Income to Net Sales (%)
Occupancy Rate:
100%
The occupancy rate has been 100% in both the office buildings and commercial buildings since
FY2014.
Operating Margin:
48%While modest in terms of the size of net sales, the Real Estate Business Company makes a relatively large contribution to Fujikura in terms of operating income. We anticipate an operating margin of 48%, which will help to support the entire company. For the future
Since its founding in 1885, Fujikura has
supplied customers with highly reliable
products and services in the business
segments of power, telecommunications,
electronics, and automotive components, and
has contributed to the development of Japan and
many countries and regions around the world through
its advanced technology.
We also launched an initiative to supplement the missing
pieces and create new value through open innovation, based on
the 2020 Mid-term Business Plan.
The following pages are divided in sections that touch on our vision
for the future, initiatives in new business promotion, and R&D, and revisit
Fujikura’s successful contributions to optical fiber technology.
We welcome the opportunity to offer readers a more in-depth understanding
of Fujikura’s technology, which we have provided in countless original products
around the world by continually taking on technical challenges.
* Notes on photos: Named the “Ichikawa,” this was a hair ornament produced in the home business of the
founder. He handed out several hundred of these Ichikawa ornaments to Kabuki theater-goers each day as the
famous Kabuki actor, Ichikawa Danjuro IX recommended them from the stage.
The founder sensed the advent of the “age of electricity” at a demonstration of the arc lamp in Nihonbashi. He perceived
the common element of braiding in both the hair ornament and electrical wire, and later entered the electrical wire sector.

24 25Fujikura Annual Report 2017 Fujikura Annual Report 2017
2030 Vision Open Innovation
We will take on the challenge of creating new
businesses by collaborating with start-up companies
in four market sectors: Advanced Communication,
Energy & Industry, Life-Assistance, and Vehicle. Our
initial action will be to utilize an open innovation
platform and engage in open innovation with start-up
companies via a public tender format.
We established the Innovative Business Development
Division within the New Business Development Center as
the main vehicle for pursuing concrete initiatives. Adding
business vision and strategy formulation, new business
start-up planning and verification, and other functions
to the current new business incubation function of the
Center will enable the Center to play a lead role in new
business creation and promotion in all areas across the entire group. We have also established a Silicon Valley Office within the Center.
This office will collect information on technologies, markets, and start-up companies from a global perspective, explore and engage
in collaboration, and formulate and verify business concepts.
The first step toward realizing the 2030 Vision. Contained in the 2030 Vision that we recently formulated is the concept of resolving
the problems of our future society. We thought a diverse range of opinions, views,
and resources was necessary to realize this, both in the process of resolving
problems and in the stage before that, the process of detecting problems. We
therefore felt it was necessary to create an ecosystem in which we also direct our
attention outward, and work with those who share our vision to detect and resolve
problems.
Fujikura’s goal is to be a top contender in “connecting” goods, people, and
solutions. By developing a hybrid mix of the management resources we have
cultivated in many areas with unique, innovative products and services possessed by
those outside the company, we hope to, together, create “Tsunagu” (“connecting”)
solutions that will lead to the solutions to the problems that society will likely face
in the near future, and meet challenges of the future society through innovation. We
also wish to motivate the potential innovators that exist within Fujikura.
Fujikura will work to create new value through open innovation as the first step
toward realizing the 2030 Vision.
The Fujikura Group provides “Tsunagu” (“connecting”) technologies that will resolve problems to make our future society sustainable and pleasant,
and will continue to increase our corporate value.
As the world changes at a speed and magnitude never witnessed before, responding accurately to the problems of the future
society to come is essential in order to pave Fujikura’s own path to the future. While the future in 2030 is not something
that we can reach simply by continuing to build on the present, it is certainly not unattainable. It is a suitable timeline for
formulating our vision and setting the milestones to get there.
Under the watchword of 2030 Vision, we will work to create new value through open innovation in the envisioned four
areas of Advanced Communication, Energy & Industry, Life-Assistance, and Vehicle.
Keisuke OkamuraExecutive Officer
Venture Matching
F u j i k u r a G r o u p 2 0 3 0 V i s i o n
Energy&Industry
AdvancedCommunication
Life-Assistance
Vehicle
solving social problems by connecting “People” , “Things” and “Story” .
“Tsunagu” Solutions
A comfortable and sustainable “Mirai” society
Human ResourcesEntrepreneurs
solve social issues.
CultureChallenges are respected and failures are not
blamed.
Health ManagementEach employee is working vividly.
BlandFujikura group
connects “things” , “people” & “story”
TechnologyWisdoms and skills
control light & electricity The Fujikura Group generates
new value through open innovation and accelerates the
change process
The Fujikura Group solves problemsin a comfortable and sustainable “Mirai” (the Japanese word meaning “future” )
society by means of providing “Tsunagu” solutions, and enhances the corporate value.
Brand

26 27Fujikura Annual Report 2017 Fujikura Annual Report 2017
Ultra-compact CMOS ModuleWe are working on development of an ultra-compact CMOS module of less than 1 mm in diameter and are aiming to apply it to areas where an image sensor cannot be inserted, such as catheters for angioscopic visualization. Fusion of the ultra-compact CMOS image sensor chip with the optical technology, micro coaxial cable, and precision processing technology that Fujikura possesses will contribute to the creation of a new medical solution optimally focused on the patient’s quality of life.
Substrate with Embedded IC Chip Stack PackageWe have begun shipping samples of Chip-stack WABE®, a polyimide multi-layer substrate with an IC chip-stack embedded vertically in the substrate. Because this technology enables a much greater degree of miniaturization in the external dimensions of an electronic circuit module using multiple IC chips compared to other mounting techniques, it has received praise from many customers recommending its use. In the future, utilization of the advantages its compactness provides will contribute to minimally invasive medical devices, and to a substantial reduction in the weight of portable diagnostic equipment and healthcare devices.
Application Developed for Use of Yttrium-based High-temperature Superconducting Wire in Medical MRIs, etc. Fujikura has long been engaged in the development of long-length mass production technology aimed at commercialization of high-temperature superconducting wires, and our work has been highly praised both in Japan and overseas. Yttrium-based high-temperature superconducting wire, which does not require liquid helium and retains high conductivity even in strong magnetic fields, is promising for application to medical MRIs and other technology. Fujikura was selected as the subcontractor for a NEDO project that began in FY2016. The project is targeted at development of practical technology for high-temperature superconducting wire used in coils with a strong magnetic field. We are working on developing technology that will improve the property and productivity for commercialization.
Active Optical Cable (AOC) Contributing to Innovation in the Manufacturing IndustryFujikura sells an active optical cable (AOC) that connects to industrial cameras used in machine vision. Industrial cameras used for product inspection, image monitoring, and for other purposes on the manufacturing line are high-resolution, and have greater data capacity. Progress is also being made on speeding up data transmission. The optical communication technology in Fujikura’s optical camera connector cable enables speeds and long-distance connections that were impossible with existing metal cables, and has contributed to the expansion of application to industrial cameras, which are in high demand amid the trend of innovation in the manufacturing industry.
New Business Development Special FeatureAccelerating our ability to metabolize changes Fujikura has been working on activities under the banner of our “power of a strong metabolism” growth strategy in our 2020 Mid-
term Business Plan and we will accelerate the speed of new business creation even further.
New Businesses: Medical business, Cloud communications, High-temperature superconductors
Fujikura, A World Leader in Optical Fiber TechnologyRyozo Yamauchi, Advisor, Ph.D. in Engineering
Fujikura’s Ultra Low-loss Technology was the Focus of the WorldOptical fiber networks support the high-speed communications infrastructure of the world. Corning, Inc. of the U.S. corroborated 20 dB/km in 1970, based on the thesis published by C.K. Kao, Ph.D. in 1966. This marked the beginning of optical fiber development by companies in Japan, the U.S., and Europe.
In 1975, Fujikura formed a joint research group with NTT (then Nippon Telegraph and Telephone Public Corporation) and two other companies and began research on low-loss optical fiber. Fujikura was the first in the world to achieve ultra low-loss of 0.47 dB/km at a long wavelength band of 1.2 μm or longer by reducing the residual water content in glass as far as possible. Fujikura also verified that germanium was the most suitable additive to incorporate in the optical fiber core to achieve low loss in the 1.3 μm to 1.6 μm wavelength range used for optical communication. Today, germanium is added to 99% of optical fibers worldwide. These achievements formed one part of the global foundation for optical fiber.
Enormous Contribution to Practical Application of Optical Fiber NetworksEstablishing technology that did not use patents on manufacturing methods owned by Corning or AT&T was required to develop practical applications for optical fiber communications. Fujikura worked to create a practical application of the VAD (vapor-phase axial deposition) method used to manufacture optical fiber preform in an axial direction. In 1977, Fujikura succeeded in reducing the water content
to the maximum extent and achieved low-loss transmission under 0.20 dB/km. The commercialization of the VAD method adapted for mass production led to the universal introduction of single-mode fiber capable of supporting high-volume transmission over long distances. Today, 60% of all optical fibers in the world are manufactured using the VAD method. In 2015, an IEEE Milestone was awarded to the VAD as a significant technical achievement. The key to building an optical fiber network was low-loss splicing of single-mode fibers with a thin core. In 1985, Fujikura developed a core alignment fusion splicer as a solution. This product still commands top global market share, leading the top optical fiber technology in the world, along with Fujikura’s optical fiber manufacturing technology.
“Tsunagu” (“Connecting”) Technology Forming a Bridge to the FutureOptical fibers do not only support wired communications networks; they support the rapidly expanding mobile communications at the back end. Using the accumulated optical technology, Fujikura is engaged in
advanced research on high-performance optical devices, high-power optical fiber lasers, and other products in addition to multi-core optical fibers that will support high-volume transmission in the future.
Fujikura continues to take on the challenge of achieving high-speed high-volume communication with our “Tsunagu” (“connecting”) technologies as information and communication technology evolves. We will continue to create a future of value through highly reliable products and advanced solutions.

28 29Fujikura Annual Report 2017 Fujikura Annual Report 2017
Research and Development ExpensesResearch and Development Expenses by Segment (Billions of yen)
(Billions of yen)
FY2012 FY2013 FY2015FY2014
Automotive Products
1.2
ElectronicsBusiness
4.9
Power &TelecommunicationSystems
9.4
Total15.6
0
5
10
15
20
14.9 14.6 15.2 16.2
FY2016
15.6
Advanced Technology Laboratory In addition to developing materials that form the foundation of
Fujikura, our laboratory has been conducting cutting-edge research
on energy conservation and renewable energy sources, specifically
on the development of functional single crystals, dye-sensitized
solar cells, and high-temperatures superconducting wires. In the
electronics field, we have been focusing on developing advanced
technologies which include R&D for future technologies such
as sensors, printed wiring boards, and high functional printed
electronics. In response to the acceleration of technological
innovation in telecommunication, we have also been promoting
R&D on next-generation optical fibers, optical devices and optical
modules, fiber laser technologies, and other applications.
Transparent Electroconductive Film with Ultra-fine Silver MeshFujikura has developed a propriety printing method that uses electroconductive silver paste that makes it easy to create film by printing ultra-fine lines of 2 μm in width. Such ultra-fine lines cannot be seen with the naked eye, and enable the production of transparent electro-conductive film. We are working to develop next-generation applications of this technology, including transparent touch sensors for curved surfaces and flexible displays, a transparent heater for a vehicle’s front windshield, transparent antennas, and other applications.
High-Power Fiber LaserThe Fujikura Group is engaged in the manufacture of fiber lasers as light sources used for the processing of materials, a product with a growing market. The Fujikura Group possesses all the technical know-how required to develop and manufacture fiber lasers including not only optical fiber and optical semiconductor-related technologies, but also cooling technologies. We have now fused these various technologies to achieve an increase in the previous maximum fiber laser output of 6kW to more than 10 kW (10.4 kW). We have also achieved a high, 40% rate of efficiency in the conversion of electric power to laser light (with DC supply), even at an output of 10 kW.
Multicore Fiber/Horizon PrizeThe Horizon Prize is awarded by the EU Commission in the European Union. It is an award for taking on challenges based on Horizon 2020 (an EU framework program for research and innovation with a total budget of 80 billion Euros for over seven years, from 2014 to 2020). Fujikura was awarded the Horizon Prize along with two universities in November 2016 for the results achieved by a transmission system using the multi-core fiber developed by Fujikura, the single photonic chip-based supercontinuum source developed by the Technical University of Denmark (DK), and the multi-core erbium doped fiber amplifiers (MC-EDFAs) developed by the University of Southampton (UK). This system is capable of transmissions at 1 petabit per second or faster along a transmission line of more than 1,000 kilometers, without the need for complex electrical processing and demonstrated that it would lead to energy savings and reduced cost.
Research Fields
Akira WadaSenior Vice President & Member of the Board
R&D Activity for Future Growth
We will concentrate the research and development activity in the three
technology platform of optical and wireless communications, electronic
components, and electric wire and cable, which form the core technology base
that supports “Tsunagu” technologies. We will pursue to expand into areas
peripheral to our core technology base while also strengthen the underlying
technology that makes up our technical base further.
Based on our ”Tsunagu” technologies, we will integrate our core technology,
in the business domains of telecommunication, electronics, energy, automotive
products, and medical devices & industrial equipments, and will accelerate the
metabolism by developing new products by which social needs were taken
before others and creating new businesses.
We will concentrate on developing human resources who are capable of
viewing R&D from the perspective of commercial potential. We will promote
the development of a research system to utilize the global human resources.
Through them, we will promote R&D activity with keeping an eye on global
trends in technology, and will be “R&D unit” who can proposes a growth strategy.

30 31Fujikura Annual Report 2017 Fujikura Annual Report 2017
Corporate Social ResponsibilityFujikura GakuenFujikura Gakuen social welfare corporation—The starting point for the CSR activities of the Fujikura Group—Fujikura Gakuen, a social welfare corporation, was founded on June 7, 1919, nearly 100 years ago
in the town of Motomachi on Izu Oshima. Harukichi Nakauchi, the brother of the founder Zenpachi
Fujikura (and originally the auditor), donated a sizable amount of his personal assets (currently
worth approximately 2 billion yen), approximately 132,000 m2 of land on Izu Oshima, and the land
and building to establish the school and residence for mentally handicapped children and adults.
Today, Fujikura Gakuen has facilities on Izu Oshima and in Tama (city of Hachioji). These facilities have
around 100 workers who provide 24-hour care and education to approximately 130 residents.
Since our founding, the succession of presidents and officers served as governors in supporting
management of Fujikura Gakuen, and both the company and individual employees have continued
to donate to this day. The main types of support activities include volunteer activities by new
employees and on-site sale of products made at the Fuji Café, an establishment operated by Fujikura
Gakuen to support self-reliance of residents.
We intend to carefully preserve this tradition of activities that support Fujikura Gakuen in the
future, as the “starting point” of Fujikura’s corporate social contribution activities.
2050 Long-term Environmental Vision—Taking on the Challenge of Protecting the Environment for the Future—
According to forecasts from the Organization for Economic Co-operation and Development (OECD) and other international
institutions, the global environment is heading toward crisis conditions. Abnormal weather patterns from climate change caused by
greenhouse gas emissions have become a threat to our daily lives. Both population growth and growth in economic activity are also
increasing the severity of widespread environmental problems on a global scale, such as water shortages and resource depletion,
severe air pollution, and decreasing biodiversity.
The Fujikura Group is a global citizen that conducts operations globally. In light of the aforementioned trends and looking toward
the future in 2050, the Fujikura Group plans to undertake four challenges to minimize its impact on the environment.
Harukichi Nakauchi
Volunteer day for new employees
Fujikura Gakuen in Izu Oshima
Challenge 1 Zero CO2 emissions at plants by 2050 (2050 Zero Emission Challenge)
We aim to reduce our CO2 emissions by 2030 by an amount that surpasses the level required of the industry by the government (versus FY2013).[Main Activities] (1) Improve environmental performance of products(2) Use renewable energies(3) Employ hydrogen energyThese are Fujikura’s three pillars for reducing CO2 emissions
Challenge 2 Minimize use of water at plants and wastewater management
—Do not use, reuse, and return to nature clean—[Main Activities] (1) Minimize water use during the production process and reuse water(2) Recycle plant wastewater, including the use of rainwater(3) Treat wastewater to a level of quality that is safe and sufficient for its
return to nature, etc.
Challenge 3 Symbiosis between plant workers and nature[Main Activities] (1) Enrich and use the Millennium Woods biotope garden at Fujikura
sites around the world(2) Promote regional activities to preserve the natural environment(3) Promote natural environment education for future generations, etc.
Challenge 4 Effective use of resources and resource cycle[Main Activities] (1) Use eco-materials(2) Engage in environmentally-friendly and long-life product
manufacturing(3) Develop recycling technologies, etc.
Challenges for the 4th 60 years of leadership (2065)Furthermore, once the Group reduces its environmental burden to zero, in 2065, the year in which Fujikura will mark the company’s Fourth Founding, the Group will embark on measures to bring about positive benefit to the global environment.

33Fujikura Annual Report 201732 Fujikura Annual Report 2017
Work Style Innovation
Promoting Diversity at the Fujikura Group
Masahiko ItoPresident & CEO
Our 2020 Mid-term Business Plan advocates the management policy of making Fujikura a highly profitable company with stronger
“metabolism”, with the entire group uniting in a teamwork approach. One aspect of the policies formulated according to these
principles is promoting diversity.
In order to increase our competitiveness in an environment in which Japan’s population is graying (aging and declining) and
business is globalizing, it will be important for us to create a system that can make use of diverse human resources, irrespective of
their nationality, ethnicity, gender, religion, age, previous career or employment.
I believe that our employees are our most important assets. Promoting diversity will be a further step in ensuring that the
employees of the Fujikura Group are healthy in mind and body, highly creative, and a vibrant assemblage of human resources.
1. The Fujikura Group’s Declaration of Promoting Diversity We will move forward with creating a system that can make use of diverse human resources, irrespective of their nationality,
ethnicity, gender, religion, age, or previous career or employment.
We believe that breakthroughs will arise in the form of creative and cutting-edge ideas as people with varied backgrounds and
ways of thinking put forth diverse opinions and work out conflicts between differing viewpoints.
2. The Significance of Diversity for the Fujikura Group• By providing an environment that makes it easy for employees both to deal with personal needs and desires and professional
needs and desires, we will strive to hire and retain superior human resources, which will contribute to the profitability of the
company.
• We will cultivate a climate that is inclusive, where diverse people can cooperate, one that welcomes new concepts, and a
culture in which creative ideas are likely to arise, thus enhancing our “metabolism”.
The 5th Stakeholder Dialogue
Every year, Fujikura hosts an expert to seek out the advice of stakeholders concerning issues that Fujikura should address and
employees engage in dialogue with the expert with the goal of using this advice in corporate activities.
This year, which marks the fifth year of the dialogue, we invited Professor Hiroki Sato, an expert in the human resources field from
the graduate school at Chuo University to engage in a dialogue with a wide range of Fujikura employees, from company officers to line
managers, and the people directly responsible for the work. The theme was “Initiatives aimed at work style innovation in the Fujikura Group.”
Date: February 23, 2017
Location: Head Office, Fujikura Ltd.
Expert: Hiroki Sato, Professor, Graduate School of Strategic Management, Chuo University
Theme: Initiatives aimed at workplace reform of the Fujikura Group
Main Opinions• It is important to develop employees to prevent capable employees from having to shoulder the bulk of the overtime work. It is
important to work to increase the skill level of all employees.
• In divisions with a lot of overtime, make it a practice to think about how to perform the work for one week by specifying days on
which employees will return home at a specified time in advance, and scheduling work to ensure that they go home without fail.
• The location of first assignment is important to the development of new employees. They should be assigned to managers who can
see and develop the potential of their subordinates.
• Diversity management means accepting employees that have a diverse range of values. Employees who are work-driven and think
only of work are not bad, and not accepting only employees with that sort of values is not good.
“White 500”
Fujikura was certified by the Ministry of Economy, Trade and Industry (METI) as one of the “White
500,” an Excellent Enterprise of Health and Productivity Management. This recognizes the value of
the company’s own activities.

34 35Fujikura Annual Report 2017 Fujikura Annual Report 2017
Chairman of the Board & Representative Director
Yoichi Nagahama
President & CEO & Representative Director
Masahiko Ito
Senior Executive Vice President & Representative Director
Takashi Sato
Senior Vice Presidents & Members of the Board
Director Full-time Audit & Supervisory Committee Member
Yasuyuki Oda
Director (Outside director) Audit & Supervisory Committee Members
Soichiro SekiuchiMasaaki ShimojimaKenichiro AbeYoshio Shirai
Jody GallagherToru AizawaMasahiro IkegamiTeiji Suzuki
Ikuo KobayashiTakeshi SatoYukihiro Nakayama
Hideo NaruseHideo Shiwa
Kiminori SatoKeisuke OkamuraKenji NishideRyoichi HaraMasaaki Kimpara
Toru NakazawaKinya TakimuraMasataka MitoHideo GotoToshiyuki Hayami
Akira WadaAkira SasagawaHideyuki Hosoya
Takeaki KitajimaTakashi TakizawaTetsu Ito
Directors
Executive Officers Other Than Members of the Board
Managing Executive Officers
Senior Managing Executive Officers
Executive Officers
Front row from left: Hideyuki Hosoya, Akira Wada, Yoichi Nagahama, Masahiko Ito, Takashi Sato, Akira Sasagawa, Takeaki KitajimaBack row from left: Kenichiro Abe, Soichiro Sekiuchi, Tetsu Ito, Takashi Takizawa, Yasuyuki Oda, Masaaki Shimojima, Yoshio Shirai
Top Management Corporate Governance
Corporate Governance ReformFujikura has considered governance reform as one part of the company’s growth strategy since the Corporate Governance Code
was formulated. We will begin implementation this fiscal year.
BackgroundFujikura consists of three in-house companies for each of its main businesses. Each of these companies has been assigned an
executive director who is responsible for the individual company. Fujikura wanted an agile system that would enable the executive
director in charge of each company to make swift, decisive decisions because the products handled by the businesses that each
company manages naturally differ, and the customers and competitive environments of these businesses also differ.
The annual and mid-term business plans, major M&A proposals, and other important matters relating to the growth of the entire
company are determined by resolution of the Board of Directors, and we recognized the need for full discussion and reflection of the
diverse experience and objective opinions of external directors in making decisions.
It also aimed strengthen the audit and supervisory function that supports the system described above.
• Switch to a company with an audit & supervisory committee in June 2017
• Increase the number of outside directors by 3 directors to 4 directors
• Delegate considerable authority to executive directors
• Strengthen the audit and supervisory function
■ Corporate Governance Initiatives19991992 2005 2009
1 Outside Director
Increased from 1 to 4
Outside Directors
Corporate Philosophy
Outside Auditors
Shigenobu Tanaka9th President
Akira Tsujikawa10th President
Kazuhiko Ohashi 11th President
2016
2017
2013
Masahiko Ito13th President
Switch to a company with an audit & supervisory committee Committees established (Nominating Advisory Committee, Remuneration Advisory Committee)
President
Organizational Structure
Outside Directors
Yoichi Nagahama 12th President
Corporate Philosophy enacted
Switch to in-house company system
1994
Increased from 1 to 2

36 37Fujikura Annual Report 2017 Fujikura Annual Report 2017
Fujikura switched from the existing organizational structure of
a company with a board of corporate auditors to a company
with an audit and supervisory committee upon approval of the
annual General Meeting of Shareholders on June 29, 2017.
(i) Overview of Corporate Governance Structure
and the Reasons for Adopting this Structure Operation of the Company’s business is organized into three
in-house companies for each of its main businesses, the Power
& Telecommunication Systems Company, the Electronics
Business Company, and the Automotive Products Company.
An executive director is assigned to oversee each of the in-
house companies. The businesses that each of the companies
is responsible for handle a broad range of products and the
customers and competitive environment of each company
differs greatly. We therefore believe it necessary to build an
agile structure that enables the executive director in charge
of each company to make decisions swiftly and decisively.
We also believe that a structure for making decisions after
sufficient deliberation that reflect the diverse knowledge and
independent perspectives of outside directors is necessary
for important matters that relate to the growth of the entire
company such as annual and mid-term business plans and
large mergers and acquisitions, and these are designated as
matters requiring approval by the Board of Directors.
This need for the abovementioned decision-making
structure has led us to determine the most appropriate
corporate management structure for our company to be
that of a company with an audit and supervisory committee
because this system is agile and capable of reflecting diverse
knowledge and independent perspectives.
Specifically, this system will achieve the following: (1) It
will enable swift decision-making by narrowing the scope
of matters requiring approval of the Board of Directors,
which consists of nine directors who are not audit and
supervisory board members and five directors who are
audit and supervisory board members (four of which are
outside directors), to business plans and other important
matters, thereby reducing the number of matters requiring
deliberation. It will also enable the reflection of diverse,
independent perspectives by taking advantage of the broad
range of experience possessed by the four outside directors
(consisting of two outside directors with expertise in corporate
management in the financial and manufacturing sectors,
one attorney, and one C.P.A.). (2) It will also enable agile
management by the executive director in charge of a specific
business by delegating decisions concerning that business to
that executive director.
A Nominating Advisory Committee and a Remuneration
Advisory Committee have been established as advisory
bodies to the Board of Directors to ensure objectivity and
transparency in nominating directors and determining their
remuneration.
(ii) System of Internal Controls The system of internal controls consists of an internal audit
division, a management division for the entire company,
and management divisions within each in-house company.
These organizations monitor the legality and appropriateness
of the execution of daily business. The retention and
management of important management information is
handled by specifying and following rules on management of
documents and electronic information. The Company has also
established a Risk Management Committee. This committee
is responsible for identifying common company-wide risks,
establishing a compliance structure, and operating an internal
whistleblowing system, among other duties.
To ensure proper operation of our subsidiaries, we have
established a system in which each group company is overseen
by the in-house company or corporate division (hereafter, “in-
house company, etc.”) with which it is affiliated. Management of
these companies is within the scope of executive responsibilities
defined for the head of the in-house company, etc. The specific
responsibilities of each in-house company, etc. are: 1) to
develop a system of reporting for business results, personnel
and organizational matters, capital investment, product
quality, and other important matters; 2) to develop a certain
level of accountability and a system for provision of support
and guidance by each in-house company, etc. in regard to risk
management; 3) to formulate a corporate group business plan,
and manage reconciliation of results vs. the budget and human
resources exchanges; and 4) to obligate each group company
to appoint a compliance administrator and develop an official
whistle-blowing system for each of the group companies
overseen.
(iii) Internal AuditsThe Audit Division was set up as a dedicated internal audit
entity. It conducts audits of each division (mainly sales and
marketing divisions) and Group companies. In FY2016, the
Audit Division conducted audits of nine divisions and 14 Group
companies.
The Audit Division exchanges information with the Audit
& Supervisory Committee on a regular basis. It also conducts
audits under the guidance and direction of the Audit &
Supervisory Committee when necessary, and reports the results
of audits to the Audit & Supervisory Committee on a regular
basis.
(iv) Audit & Supervisory Committee Activities The Audit & Supervisory Committee consists of five committee
members, four of which are outside directors. The members
of the Audit & Supervisory Committee elect a Full-time Audit
& Supervisory Committee Member from among themselves
to ensure the effectiveness of Audit & Supervisory Committee
activities. Mr. Yasuyuki Oda, the Full-time Audit & Supervisory
Committee Member, possesses many years of experience
in the Finance and Accounting Division of our company.
Mr. Masaaki Shimojima, an Audit & Supervisory Committee
Member, possesses many years of management experience
in a key position in a major city bank. Mr. Kenichiro Abe,
an Audit & Supervisory Committee member, is a certified
public accountant. All of these committee members possess
considerable knowledge of finance and accounting.
Audits confirm that the execution of duties by the
Board of Directors complies with laws and regulations and
the corporate Articles of Incorporation and that company
operations are being executed appropriately. This is
accomplished by establishing a system of internal controls and
monitoring and verifying the status of operations and other
aspects. Audits are conducted from the perspectives of legality
and appropriateness. This is accomplished by conducting
onsite audits of each in-house company and Group company,
examining important documents, and attending key meetings.
The Audit & Supervisory Committee holds a monthly
meeting and otherwise meets as necessary to report and
discuss the findings of committee members. Fujikura’s system
also ensures that the Full-time Audit & Supervisory Board
Member can attend and voice his opinions at key meetings
where decisions on business operations are discussed. The
system also ensures that Audit & Supervisory Committee
members have the opportunity to exchange opinions
with executive officers on a regular basis and also have
opportunities to request information.
At the start of every fiscal year, accounting auditors provide
an explanation of their audit plans to the Audit & Supervisory
Committee. The accounting auditors report the results of their
quarterly and fiscal year-end audits, versus the plan at the start
of the year, to the Audit & Supervisory Committee. To facilitate
an adequate exchange of opinions, Audit & Supervisory
Committee members also hold discussions several times a year
with accounting auditors to confer on details, the audit system,
and other issues.
An Audit & Supervisory Committee Office has been
established to support the Audit & Supervisory Committee.
The Audit & Supervisory Committee Office reports directly
to the Audit & Supervisory Committee and maintains
independence from executive officers within the company.
It provides support to the Audit & Supervisory Committee as
directly ordered by the Audit & Supervisory Committee.
(v) Limited Liability Agreement As specified in Article 427, Paragraph 1 of the Companies
Act, Fujikura concludes limited liability agreements with
all outside directors. These agreements limit the liability of
outside directors to the minimum liability specified in Article
425, Paragraph 1 of the Companies Act for indemnification
of damages specified in Article 423, Paragraph 1 of the same
act, when duties are executed in good faith without gross
negligence.
(vi) Outside DirectorsThe Company has four outside directors: Mr. Soichiro Sekiuchi,
Masaaki Shimojima, Kenichiro Abe, and Mr. Yoshio Shirai.
All are directors who are Audit & Supervisory Committee
members. Mr. Sekiuchi is an attorney, Mr. Shimojima has
AppointAppoint
Assistance
Appoint
Delegation of important business execution
Cooperation
Supervision
Inquiry
Report
Inquiry
Report
Reporting/Cooperation
Internal Audit
Audit and Supervisory Committee O�ce
Nominating Advisory Committee (Election of candidates for Directors)
Audit Division
General Meeting of Shareholders
Board of Directors
Acc
ount
ing
Aud
itor
s Directors not serving as Audit and Supervisory Committee Members
Directors serving as Audit and Supervisory Committee Members Remuneration Advisory Committee
(Compensation to o�cers)
Group Companies
Supervision
Executive DirectorsIn-house Companies
Audit and Supervisory Committee

38 39Fujikura Annual Report 2017 Fujikura Annual Report 2017
corporate experience in finance, Mr. Abe is a certified public
accountant, and Mr. Shirai has corporate experience in
manufacturing. The backgrounds of each of these directors
enable them to utilize their extensive expertise at Board of
Directors meetings and voice a broad range of independent
opinions.
Each of the outside directors audits the performance
of duties by directors from the perspective of legality and
appropriateness. They accomplish this through onsite audits
of each corporate division and Group company, examining
important documents, and attending Board of Directors
meetings. They communicate with the Full-time Audit &
Supervisory Committee Member by reporting and discussing
their findings at monthly Audit & Supervisory Committee
meetings. Materials for Board of Directors meetings and Audit
& Supervisory Committee meetings are also distributed in
advance.
Mr. Soichiro Sekiuchi, is an attorney-at-law with highly
specialized skills acquired over many years of working
on corporate legal matters. This has given him sufficient
knowledge of corporate management. Mr. Sekiuchi is an
attorney of Tokyo Yurakucho Law Office. Fujikura transacts no
business with this firm and Mr. Sekiuchi therefore meets the
criteria for independence specified by Fujikura and is qualified
to serve as an outside director, which requires that he maintain
an independent status. Fujikura has reported Mr. Sekiuchi as
an independent officer to the Tokyo Stock Exchange.
Mr. Masaaki Shimojima has considerable knowledge in finance
and accounting, derived from many years of experience in a key
position at a major city bank. He is also well-versed in corporate
management. Mr. Shimojima was previously an executive officer at
Sumitomo Mitsui Banking Corporation, which is one of Fujikura’s
main banks, but retired in June 2003. Mr. Shimojima therefore
meets the Fujikura’s criteria for independence and is qualified to
serve as an outside director, which requires that he maintain an
independent status. Fujikura has reported Mr. Shimojima as an
independent officer to the Tokyo Stock Exchange.
Mr. Kenichiro Abe possesses highly specialized expertise
as a certified public accountant and ample knowledge of
corporate management gleaned from many years working
as an accounting auditor for numerous companies. We note
that Mr. Abe was previously a Representative Partner at
PricewaterhouseCoopers Aarata, which is our accounting firm,
but left the company in June 2012. He was not an audit partner
for Fujikura while at PricewaterhouseCoopers Aarata. Mr. Abe
therefore meets Fujikura’s criteria for independence and is
qualified to serve as an outside director, which requires that he
maintain an independent status. Fujikura has reported Mr. Abe
as an independent officer to the Tokyo Stock Exchange.
Mr. Yoshio Shirai has ample experience and knowledge as
a manager through his career history as a senior managing
officer of Toyota Motor Corporation, president & CEO of Hino
Motors, Ltd., and vice chairman of Toyota Tsusho Corporation.
Mr. Shirai also possesses experience as an outside director
from service as an outside director and Audit & Supervisory
Committee member for Seiko Epson Corporation from FY2016.
Mr. Shirai also served as an executive officer of Toyota Tsusho
Corporation within the past three years, however Fujikura’s
total sales and purchasing transactions with the company
amounted to less than 1% of consolidated net sales for
both Fujikura and Toyota Tsusho Corporation. Toyota Tsusho
therefore does not constitute a material business partner
under the criteria for independence established by Fujikura.
The same also applies to transactions between Fujikura and
Toyota Motor Corporation or Hino Motors, Ltd. where Mr.
Shirai was an executive officer in the past. Mr. Shirai therefore
meets Fujikura’s criteria for independence and is qualified to
serve as an outside director, which requires he maintain an
independent status. Fujikura has also reported Mr. Shirai as an
independent officer to the Tokyo Stock Exchange.
(Criteria for Independence of Outside Directors)
Fujikura has established the following criteria for determining
the independence of outside directors.
Individuals who currently constitute one of the following,
individuals who constituted one of the following during
the past three years, and individuals who have a spouse or
a relative within two degrees of kinship who constitutes or
within the past three years constituted one of the following do
not qualify as independent.
• A material business partner of the Fujikura Group*1 or
executive officer of such*2
• An entity having Fujikura Group as a material business
partner or an executive officer of such
• A shareholder who holds 10% or more of total voting rights
in Fujikura or an executive officer of such
• An entity or the executive officer of such who received
cash or other substantial remuneration*3 from Fujikura or a
subsidiary of Fujikura, other than the remuneration received
for serving as an outside officer.
*1 Material business partner: Customers whose purchases from
Fujikura account for 1% or more of the consolidated net sales of
the Fujikura Group and vendors for which Fujikura’s purchases
account for 1% or more of that vendor’s consolidated net sales.
*2 Executive officer: An executive director or employee who reports
directly to the executive director
*3 Substantial remuneration: More than 10 million yen a year
Risks that could potentially have an adverse impact to the
business performance, share price, and financial health of the
Fujikura Group are discussed below. It should be noted that
the risks involved with the forward-looking statements herein
are those identified by the Fujikura Group in its securities
report filed with the Ministry of Finance (submitted on June
29, 2017).
(1) Demand Trends
Given that our products are mainly used in infrastructures
or are components used in finished consumer goods, our
business performance is, almost without fail, impacted by
economic cycles. In addition, capital expenditure trends
in various markets and changes in consumer purchasing
attitudes are also factors that impact our performance.
(2) Fluctuations in Foreign Exchange Rates
We carry out currency hedging strategies within the scope
of actual demand to minimize, to the best of our ability,
the negative impact that currency rate fluctuations have
on foreign-currency denominated sales. There is possibility
of an adverse impact to earnings due to exchange rate
fluctuations, as we cannot always fully avert exchange rate
risks. Moreover, Group operations include the manufacturing
and sales of products overseas, primarily in Asia. Accordingly,
the earnings, expenses, assets, and other items denominated
in local currencies, are translated into yen when we create our
consolidated financial statements. Depending on the foreign
exchange rates at the time, although these accounting items
retain their value in local currencies, there is a possibility value
will be eroded after conversion into yen.
(3) Fluctuations in Materials Costs
Copper is the main material used in Group products. Copper
prices fluctuate mainly depending on shifts in international
supply-demand trends. A sharp change in copper price cannot
always be readily reflected in product prices. Consequently, there
is a possibility that a pronounced upshot in copper prices could
impact the Group’s business performance.
(4) Product Defects
The Fujikura Group carries out the manufacturing of various
products in accordance with strict product quality control
standards. Nonetheless, there is no guarantee that we will
never experience a product defect or that quality complaints
will not arise further out. We have product liability insurance
but there is no assurance that this policy will cover all of our
liability costs in the end. Serious complaints and product
defects that lead to product liability cases trigger considerable
costs and have a grave impact on how society evaluates the
Group. The adverse impact connected with this includes the
possibility of a decline in sales.
(5) Regulations
The regulations in the markets in which we operate apply to
our business activities. There are a number of regulations,
including government approval and authorization for
businesses and investments, regulations and taxes on business
transactions and trade, regulations controlling financial
transactions, and environmental restrictions. The Fujikura
Group carries out its business activities in compliance with
these regulations. Going forward, the business activities of our
Group could potentially be limited, should it become difficult
to comply with laws and ordinances after key revisions have
been made or if tougher restrictions are put in place. We
anticipate a rise in costs to remain in compliance with these
regulations. This will potentially have an adverse impact on
Group earnings.
(6) Lawsuits, Legal Action by Regulatory Authorities, and Other Legal Procedures
In performing our business activities, the Fujikura Group is
at risk of lawsuits, legal action by regulatory authorities, and
other legal issues. Potential risks include damage complaints
stemming from lawsuits, legal action by regulatory authorities,
other legal issues, fines being imposed by regulatory
authorities, and restrictions placed on business operations.
Lawsuits, legal action by regulatory authorities, and other legal
procedures pose a potential risk to the Group’s businesses,
earnings, and financial health.
(7) Political and Economic Trends
We conduct our Power & Telecommunication Systems
Company, Electronics Business Company and Automotive
Products Company at home and abroad. Consequently,
political unrest and other conditions, mainly in the countries
in which we operate, could possibly have a negative impact on
our business performance.
Risks

40 41Fujikura Annual Report 2017 Fujikura Annual Report 2017
(8) Interest Rate Fluctuations Our financing takes into account a balance between the demand for
capital, the climate in financial markets, and procurement methods.
A rise in interest rates translates into a rise in interest payments.
Accordingly, we view the rise in interest rates as a potential risk to our
business performance.
(9) Intellectual Properties
We protect our proprietary technologies with patents and
other intellectual property rights. At the same time, we are very
cautious not to infringe on the intellectual property rights of
a third party. However, during the diversification of product
structure and manufacturing technologies, and the expansion of
our business operations overseas, there is a possibility that our
products could inadvertently breach the intellectual property
rights of rival products. In this case, we would inevitably have to
halt sales and implement corrective measures, such as changing
our product design. Also, a third party could infringe upon our
intellectual property rights but due to the differences in laws
in other countries, there is a possibility our rights would not be
adequately protected. In light of this, we view this as another
potential risk to our business activities and performance.
(10) Information Leak
The Group possesses a substantial amount of private
individual and sensitive information related to its business
activities. We are doing our utmost to maintain the
confidentiality of this information. However, we cannot rule
out the possibility of this information being leaked externally
due to some unexpected incident. This type of information
leak would potentially damage our image and result in
compensation for damages, which in turn would have a
negative impact on Group earnings and financial health.
(11) Disaster RiskThe Fujikura Group has a number of factories in Japan and
overseas. In the event our production facilities are destroyed
due to a natural disaster at one of our factory locations,
including wind and water damage due to a large-scale
earthquake or typhoon, it is likely that our capacity utilization
would decline due to suspended operations and expenses
would increase due to reflecting facilities repairs. Natural
disaster would potentially have a negative impact on the
Fujikura Group’s production system, its financial health, and
earnings.
42 Management Discussion & Analysis
44 Financial Review44 Consolidated Balance Sheets
46 Consolidated Statements of Income
47 Consolidated Statements of Comprehensive Income
50 Consolidated Statements of Cash Flows
51 Notes to the Consolidated Financial Statements
72 Independent Auditor’s Report
Financial Section

42 43Fujikura Annual Report 2017 Fujikura Annual Report 2017
Q1 Please explain the underlying reasons why you forecast growth in revenue for FPC even though demand for FPC for smartphones has softened.
A End product functions are increasing year after year and the number of FPC units handled is increasing. In addition to this, the number of mounted components that we are paid for is increasing, so we project an increase in revenues, extrapolating from the current forecast.
The plan has been formulated based on various considerations in addition to forecasts received from our customers. However, we are working on developing business in FPC installed in vehicles and other applications, although it will depend on the trend in the market for the end products.
Q2 What is the status of optical fiber? A Market demand is robust and company production is
running at full operating capacity both in Japan and overseas. We think there will be even greater growth in optical fiber demand in the future, particularly in the FTTx and DC markets in North America and Europe. Fujikura has already released a strategic product in optical cables, and it is receiving good reviews. We recognize that the optical-related segment is a growth market, and will be moving forward with capital investment.
Management Discussion & Analysis Q3 You are planning major capital investments this fiscal year. Does that change your views on capital investment and M&A in the 2020 Mid-term Business Plan?
A It doesn’t basically change anything. We will proceed according to the mid-term business plan as initially formulated. I will explain the thinking behind that once again. We will invest a considerably large sum of 200 billion yen over the five years of the 2020 Mid-term Business Plan, and the cumulative depreciation over that same period will also be around 200 billion yen. This will be invested in strategic growth areas, focusing on IT-related investment in the Power & Telecommunications Systems Company and on investment in development and automation and other types of rationalization in the Electronics Business. We intend to engage in active M&A. There are no specific targets at present, however. Please regard M&A investment as a number in addition to this number.
Q4 What is the status of new businesses? A We are moving forward with product development
and marketing of fiber lasers, which were transferred to the telecommunications business in FY2016. At present, we have received many order inquiries, and are aiming to turn this into a contribution to profits as quickly as possible. We are also injecting resources into automotive-related, industrial equipment-related, and medical device-related business, three key segments in the current mid-term business plan.
Q5 Open innovation was mentioned as a key measure
in the mid-term business plan. What is that? A We do not regard our mission as being simply to sell
things, but how to respond and provide the value that customers seek. Therefore, our intention is to determine if anything needed to provide that value is missing from our value chain and procure it from elsewhere to supply the missing pieces in the value chain. To restate this in other terms, it is to move away from the need to produce everything in-house. M&A is also one way to supply the missing pieces and we intend to pursue M&A actively. We presented the 2030 vision and advanced plans for collaboration with venture companies as new initiatives during this fiscal year. These also are in line with this view.
Q6 The market is focusing on ROE. What is your forecast for ROE?
A We set the goal in the 2020 Mid-term Business Plan at 10% or higher. It was 6.4% in FY2016. Income taxes, etc. deferred from past fiscal years in Thailand (2.7 billion yen) were a temporary factor behind the decline in ROE, but the return on equity (ROE) for FY2016 would have been 7.8% absent the temporary factor. We think we are on track for achieving the goal of 10% or higher in the mid-term business plan.
Q7 What are your views on shareholder return? A Distribution of profits with a consideration for balance
is fundamental. Our ultimate goal is to increase income per share as we invest in growth and improve financial soundness, and would like to tie these together here. We will aim to increase the amount of dividends by increasing income per share. Our goal for the dividend payout ratio over the five years of the 2020 Mid-term Business Plan hinges on 20% or higher. Our forecast for net income in FY2017 is 20 billion yen. If you exclude the number of treasury shares held by the company, the number of shares outstanding is 285 million shares, and a dividend per share of 14 yen would be a payout ratio of around 20%. Dividends per share of 14 yen would be an increase of 4 yen per share versus FY2016.
Q8 What are your views on governance? A We recognize the great importance of ensuring
transparency and fairness as fundamental to governance. A system of governance that is fully fleshed out in terms of content, rather than just being a structure for external appearances, is essential. We transitioned to being a company with audit and supervisory committee this fiscal year. This was done to strengthen the supervisory and audit functions and increase the speed of decision-making through the delegation of authority, keeping the need to work for real management reform in mind.
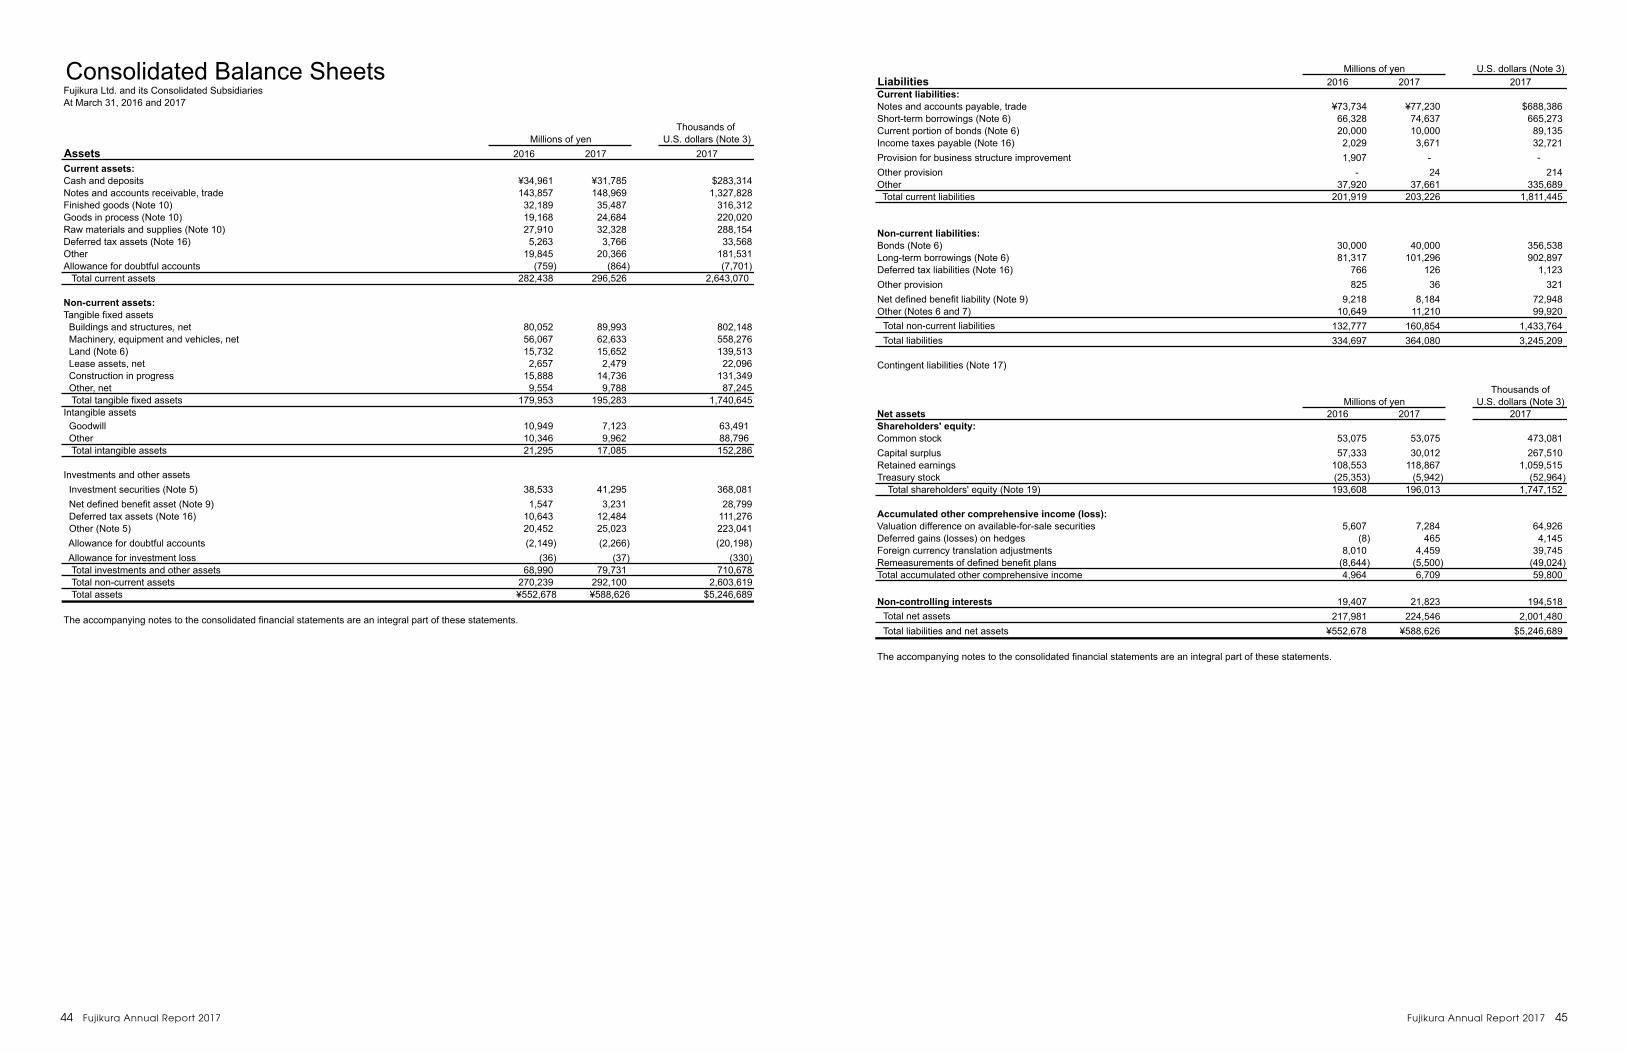
44 45Fujikura Annual Report 2017 Fujikura Annual Report 2017
Consolidated Balance SheetsFujikura Ltd. and its Consolidated Subsidiaries At March 31, 2016 and 2017
Thousands of Millions of yen U.S. dollars (Note 3)
Assets 2016 2017 2017Current assets:Cash and deposits ¥34,961 ¥31,785 $283,314Notes and accounts receivable, trade 143,857 148,969 1,327,828Finished goods (Note 10) 32,189 35,487 316,312Goods in process (Note 10) 19,168 24,684 220,020Raw materials and supplies (Note 10) 27,910 32,328 288,154Deferred tax assets (Note 16) 5,263 3,766 33,568Other 19,845 20,366 181,531Allowance for doubtful accounts (759) (864) (7,701) Total current assets 282,438 296,526 2,643,070
Non-current assets:Tangible fixed assets Buildings and structures, net 80,052 89,993 802,148 Machinery, equipment and vehicles, net 56,067 62,633 558,276 Land (Note 6) 15,732 15,652 139,513 Lease assets, net 2,657 2,479 22,096 Construction in progress 15,888 14,736 131,349 Other, net 9,554 9,788 87,245 Total tangible fixed assets 179,953 195,283 1,740,645Intangible assets Goodwill 10,949 7,123 63,491 Other 10,346 9,962 88,796 Total intangible assets 21,295 17,085 152,286
Investments and other assets Investment securities (Note 5) 38,533 41,295 368,081 Net defined benefit asset (Note 9) 1,547 3,231 28,799 Deferred tax assets (Note 16) 10,643 12,484 111,276 Other (Note 5) 20,452 25,023 223,041 Allowance for doubtful accounts (2,149) (2,266) (20,198) Allowance for investment loss (36) (37) (330) Total investments and other assets 68,990 79,731 710,678 Total non-current assets 270,239 292,100 2,603,619 Total assets ¥552,678 ¥588,626 $5,246,689
The accompanying notes to the consolidated financial statements are an integral part of these statements.
Thousands ofMillions of yen U.S. dollars (Note 3)
Liabilities 2016 2017 2017Current liabilities:Notes and accounts payable, trade ¥73,734 ¥77,230 $688,386Short-term borrowings (Note 6) 66,328 74,637 665,273Current portion of bonds (Note 6) 20,000 10,000 89,135Income taxes payable (Note 16) 2,029 3,671 32,721Provision for business structure improvement 1,907 - -Other provision - 24 214Other 37,920 37,661 335,689 Total current liabilities 201,919 203,226 1,811,445
Non-current liabilities:Bonds (Note 6) 30,000 40,000 356,538Long-term borrowings (Note 6) 81,317 101,296 902,897Deferred tax liabilities (Note 16) 766 126 1,123Other provision 825 36 321Net defined benefit liability (Note 9) 9,218 8,184 72,948Other (Notes 6 and 7) 10,649 11,210 99,920 Total non-current liabilities 132,777 160,854 1,433,764 Total liabilities 334,697 364,080 3,245,209
Contingent liabilities (Note 17)
Thousands ofMillions of yen U.S. dollars (Note 3)
Net assets 2016 2017 2017Shareholders' equity:Common stock 53,075 53,075 473,081Capital surplus 57,333 30,012 267,510Retained earnings 108,553 118,867 1,059,515Treasury stock (25,353) (5,942) (52,964) Total shareholders' equity (Note 19) 193,608 196,013 1,747,152
Accumulated other comprehensive income (loss):Valuation difference on available-for-sale securities 5,607 7,284 64,926Deferred gains (losses) on hedges (8) 465 4,145Foreign currency translation adjustments 8,010 4,459 39,745Remeasurements of defined benefit plans (8,644) (5,500) (49,024)Total accumulated other comprehensive income 4,964 6,709 59,800
Non-controlling interests 19,407 21,823 194,518 Total net assets 217,981 224,546 2,001,480 Total liabilities and net assets ¥552,678 ¥588,626 $5,246,689
The accompanying notes to the consolidated financial statements are an integral part of these statements.

46 47Fujikura Annual Report 2017 Fujikura Annual Report 2017
Consolidated Statements of IncomeFujikura Ltd. and its Consolidated Subsidiaries For the Years Ended March 31, 2016 and 2017
Thousands of Millions of yen U.S. dollars (Note 3)
2016 2017 2017Net sales ¥678,528 ¥653,795 $5,827,569Cost of sales (Notes 8, 9 and 10) 551,920 525,150 4,680,898Gross profit 126,607 128,644 1,146,662Selling, general and administrative expenses (Notes 8 and 9):Packing and transportation expenses 16,592 16,946 151,047Personnel expenses 39,623 39,814 354,880Other 37,758 37,652 335,609Total selling, general and administrative expenses 93,974 94,413 841,546 Operating income 32,632 34,230 305,107
Non-operating income:Interest income 227 267 2,380Dividend income 1,210 1,128 10,054Foreign exchange gains 134 746 6,649Share of profit of entities accounted for using equity method - 1,046 9,323Reversal for product repair expenses 313 - -Other 838 866 7,719Total non-operating income 2,725 4,055 36,144Non-operating expenses:Interest expenses 2,783 2,623 23,380Share of loss of entities accounted for using equity method 2,918 - -Loss on retirement of non-current assets 565 643 5,731Other 4,460 2,463 21,954Total non-operating expenses 10,727 5,730 51,074 Ordinary income 24,629 32,555 290,177Extraordinary gains:Gain on sales of investment securities 2,420 465 4,145Gain on sales of fixed assets (Note 11) 325 180 1,604Total extraordinary gains 2,745 646 5,758Extraordinary losses:Business structure improvement expenses (Note 12) 7,801 3,187 28,407Litigation settlement 1,155 1,143 10,188Other 1,227 539 4,804Total extraordinary losses 10,183 4,870 43,409 Income before income taxes 17,191 28,331 252,527
Income taxes (Note 17):Current 8,711 10,868 96,871Income taxes for prior periods (Note 13) - 2,764 24,637Deferred (4,069) (2,329) (20,759)Total income taxes 4,641 11,303 100,749Profit 12,549 17,027 151,769Profit attributable to non-controlling interests 1,232 4,127 36,786
Profit attributable to owners of parent ¥11,317 ¥12,900 $114,984
The accompanying notes to the consolidated financial statements are an integral part of these statements.
Consolidated Statements of Comprehensive IncomeFujikura Ltd. and its Consolidated Subsidiaries For the Years Ended March 31, 2016 and 2017
Thousands of Millions of yen U.S. dollars (Note 3)
2016 2017 2017Profit ¥12,549 ¥17,027 $151,769Other comprehensive income Valuation difference on available-for-sale securities (5,409) 1,600 14,262 Deferred gains (losses) on hedges (13) 642 5,722 Foreign currency translation adjustments (16,314) (3,495) (31,153) Remeasurements of defined benefit plans, net of taxes (4,185) 3,127 27,872 Share of other comprehensive income of entities accounted for using equity method (508) (359) (3,200) Other comprehensive income (Note 14) (26,431) 1,516 13,513Comprehensive income (13,881) 18,543 165,282(Breakdown) Comprehensive income attributable to owners of parent (14,410) 14,645 130,537 Comprehensive income attributable to non-controlling interests ¥529 ¥3,898 $34,745
The accompanying notes to the consolidated financial statements are an integral part of these statements.

48 49Fujikura Annual Report 2017 Fujikura Annual Report 2017
Consolidated Statements of Changes in Net AssetsFujikura Ltd. and its Consolidated Subsidiaries For the Years Ended March 31, 2016 and 2017
Millions of yen Shareholders' equity
Number ofshares issued
Commonstock
Capitalsurplus
Retainedearnings
Treasurystock
Totalshareholders'
equity
Balance at March 31, 2015 360,863,421 ¥53,075 ¥55,035 ¥99,539 (¥19,762) ¥187,888Dividends paid - - (2,303) - (2,303)Profit attributable to owners of parent - - 11,317 - 11,317Purchase of treasury stock - - - (5,590) (5,590)Disposal of treasury stock - 0 - 0 0Change in treasury shares of parent arising fromtransactions with non-controlling shareholders - 2,282 - - 2,282
Purchase of shares of consolidated subsidiaries - 15 - - 15Change of scope of equity method - - (0) - (0)Net changes of items other than shareholders' equity - - - - - Total changes of items during period - 2,297 9,013 (5,590) 5,720Balance at March 31, 2016 360,863,421 ¥53,075 ¥57,333 ¥108,553 (¥25,353) ¥193,608Dividends paid - - (2,636) - (2,636)Profit attributable to owners of parent - - 12,900 - 12,900Purchase of treasury stock - - - (7,910) (7,910)Retirement of treasury stock (65,000,000) - (27,320) - 27,320 -Change of scope of consolidation - - 51 - 51Net changes of items other than shareholders' equity - - - - - Total changes of items during period - (27,320) 10,314 19,410 2,404Balance at March 31, 2017 295,863,421 ¥53,075 ¥30,012 ¥118,867 (¥5,942) ¥196,013
Millions of yen Accumulated other comprehensive income
Valuationdifference on
available-for-salesecurities
Deferred gains(losses) on
hedges
Foreigncurrency
translationadjustments
Remeasurementsof defined
benefitplans
Totalaccumulated
othercomprehensive
income
Non-controllinginterests
Total netassets
Balance at March 31, 2015 11,078 71 24,059 (4,516) 30,692 15,946 234,527Dividends paid - - - - - - (2,303)Profit attributable to owners of parent - - - - - - 11,317Purchase of treasury stock - - - - - - (5,590)Disposal of treasury stock - - - - - - 0Change in treasury shares of parent arising fromtransactions with non-controlling shareholders - - - - - - 2,282
Purchase of shares of consolidated subsidiaries - - - - - - 15Change of scope of equity method - - - - - - (0)Net changes of items other than shareholders' equity (5,471) (80) (16,048) (4,127) (25,727) 3,461 (22,266)Total changes of items during period (5,471) (80) (16,048) (4,127) (25,727) 3,461 (16,545)Balance at March 31, 2016 ¥5,607 (¥8) ¥8,010 (¥8,644) ¥4,964 ¥19,407 ¥217,981Dividends paid - - - - - - (2,636)Profit attributable to owners of parent - - - - - - 12,900Purchase of treasury stock - - - - - - (7,910)Retirement of treasury stock - - - - - - - Change of scope of consolidation - - - - - - 51Net changes of items other than shareholders' equity 1,676 473 (3,550) 3,144 1,744 2,415 4,160Total changes of items during period 1,676 473 (3,550) 3,144 1,744 2,415 6,564Balance at March 31, 2017 ¥7,284 ¥465 ¥4,459 (¥5,500) ¥6,709 ¥21,823 ¥224,546
The accompanying notes to the consolidated financial statements are an integral part of these statements.
Thousands of U.S. dollars (Note 3) Shareholders' equity
Number ofshares issued
Commonstock
Capitalsurplus
Retainedearnings
Treasurystock
Totalshareholders'
equity
Balance at March 31, 2016 360,863,421 $473,081 $511,035 $967,582 ($225,983) $1,725,715Dividends paid - - (23,496) - (23,496)Profit attributable to owners of parent - - 114,984 - 114,984Purchase of treasury stock - - - (70,505) (70,505)Retirement of treasury stock (65,000,000) - (243,515) - 243,515 - Change of scope of consolidation - - 455 - 455Net changes of items other than shareholders' equity - - - - - Total changes of items during period - (243,515) 91,933 173,010 21,428Balance at March 31, 2017 295,863,421 $473,081 $267,510 $1,059,515 ($52,964) $1,747,152
Thousands of U.S. dollars (Note 3) Accumulated other comprehensive income
Valuationdifference on
available-for-salesecurities
Deferred gains(losses) on
hedges
Foreigncurrency
translationadjustments
Remeasurementsof defined
benefitplans
Totalaccumulated
othercomprehensive
income
Non-controllinginterests
Total netassets
Balance at March 31, 2016 $49,978 ($71) $71,397 ($77,048) $44,246 $172,983 $1,942,963Dividends paid - - - - - - (23,496)Profit attributable to owners of parent - - - - - - 114,984Purchase of treasury stock - - - - - - (70,505)Retirement of treasury stock - - - - - - -Change of scope of consolidation - - - - - - 455Net changes of items other than shareholders' equity 14,939 4,216 (31,643) 28,024 15,545 21,526 37,080Total changes of items during period 14,939 4,216 (31,643) 28,024 15,545 21,526 58,508Balance at March 31, 2017 $64,926 $4,145 $39,745 ($49,024) $59,800 $194,518 $2,001,480
The accompanying notes to the consolidated financial statements are an integral part of these statements.

50 51Fujikura Annual Report 2017 Fujikura Annual Report 2017
Consolidated Statements of Cash FlowsFujikura Ltd. and its Consolidated SubsidiariesFor the Years Ended March 31, 2016 and 2017
Thousands of Millions of yen U.S. dollars (Note 3)
2016 2017 2017Cash flows from operating activities:Income before income taxes ¥17,191 ¥28,331 $252,527Depreciation and amortization 26,311 27,589 245,913Amortization of goodwill 3,149 3,545 31,598Increase (decrease) in provisions 396 217 1,934Interest and dividend income (1,437) (1,395) (12,434)
Interest expenses 2,783 2,623 23,380
Share of (profit) loss of entities accounted for using equity method 2,918 (1,046) (9,323)Business structure improvement expenses 6,358 2,405 21,437Decrease (increase) in notes and accounts receivable, trade 4,432 (7,463) (66,521)Decrease (increase) in inventories (4,579) (11,361) (101,266)Increase (decrease) in notes and accounts payable, trade 559 6,363 56,716Increase (decrease) in other current liabilities (0) 3,068 27,346Decrease (increase) in net defined benefit asset 1,367 1,340 11,944
Increase (decrease) in net defined benefit liability (642) (10) (89)Other, net (887) 1,462 13,031 Sub-total 57,923 55,670 496,212Interest and dividend income received 2,018 2,398 21,374Interest paid (2,876) (2,681) (23,897)Income taxes (paid) refund (8,791) (11,764) (104,858) Net cash provided by (used in) operating activities 48,274 43,623 388,831Cash flows from investing activities:Net decrease (increase) in time deposits (1,099) (433) (3,860)Payments for purchase of property, plant and equipment and other assets (30,821) (46,495) (414,431)Proceeds from sales of property, plant and equipment and other assets 2,481 2,205 19,654Proceeds from sales of investment securities 4,313 550 4,902Payments of loans receivable (791) (11,774) (104,947)Collection of loans receivable 225 3,626 32,320Purchase of long-term prepaid expenses (2,464) (2,649) (23,612)Proceeds from transfer of business 1,802 - - Payments for transfer of business - (4,120) (36,723)Purchase of investments in subsidiaries resulting in change in scope of consolidation (9,731) - - Proceeds from sales of shares of subsidiaries resulting in change in scope of consolidation 45 - - Payments for investments in capital of subsidiaries and affiliates (1,222) (1,477) (13,165)Other, net (19) (65) (579) Net cash provided by (used in) investing activities (37,283) (60,633) (540,449)Cash flows from financing activities:Net increase (decrease) in short-term loans payable (3,402) (2,673) (23,826)Net increase (decrease) in commercial papers (2,000) (2,000) (17,827)Proceeds from long-term loans payable 22,808 46,155 411,400Repayment of long-term loans payable (20,378) (13,866) (123,594)Redemption of bonds - (20,000) (178,269)Proceeds from issuance of bonds - 19,901 177,387Proceeds from share issuance to non-controlling shareholders 1,500 - - Cash dividends paid (2,303) (2,636) (23,496)Purchase of treasury stock (5,590) (7,909) (70,496)Dividends paid to non-controlling interests (565) (558) (4,974)Other, net 0 - - Net cash provided by (used in) financing activities (9,932) 16,411 146,279Effect of exchange rate change on cash and cash equivalents (2,304) (812) (7,238)Net increase (decrease) in cash and cash equivalents (1,245) (1,410) (12,568)Cash and cash equivalents at beginning of period 33,336 32,091 286,042Cash and cash equivalents at end of period (Note 15) ¥32,091 ¥30,680 $273,465
The accompanying notes to the consolidated financial statements are an integral part of these statements.
Notes to the Consolidated Financial StatementsFujikura Ltd. and its Consolidated SubsidiariesFor the years ended March 31, 2016 and 2017
1. Basis of PresentationAccounting principles
The accompanying Consolidated Financial Statements of Fujikura Ltd. (the "Company") and its consolidated subsidiaries (together, the "Companies")are prepared on the basis of accounting principles generally accepted in Japan, which are different in certain respects, application and disclosure requirements, from International Financial Reporting Standards, and are prepared by the Company as required by the Financial Instruments and Exchange Act of Japan.The Company adopted the "Practical Solution on Unification of Accounting Policies Applied to Foreign Subsidiaries for Consolidated FinancialStatements" (Accounting Standards Board of Japan ("ASBJ") PITF No. 18, Mar 26, 2015) and "Practical Solution on Unification of Accounting Policies Applied to Associates Accounted for Using the Equity Method" (PITF No. 24, March 10, 2008) and made necessary adjustments for the preparation of the Consolidated Financial Statements.In preparing the Consolidated Financial Statements, certain reclassification and presentation adjustments have been made to the Consolidated Financial Statements filed with the Director of the Kanto Local Finance Bureau in Japan in order to present these Consolidated Financial Statements in a form which is more familiar to readers of these Consolidated Financial Statements outside Japan.
2. Summary of Significant Accounting Policies(a) Consolidation and investments in affiliates
The Consolidated Financial Statements include the accounts of the Company and all significant subsidiaries (99 subsidiaries at March 31, 2016 and 97 subsidiaries at March 31, 2017). All significant intercompany transactions, accounts and unrealized intercompany profits are eliminated in consolidation.The difference between the cost and the underlying net equity of the investment in consolidated subsidiaries at the time of acquisition is deferred and amortized over a five-year period. Investments of 50% or less in companies over which the parent company does not have control but has theability to exercise significant influence, and investments in unconsolidated subsidiaries are generally accounted by the equity method(10 companies at March 31, 2016 and 2017) and included in Investment securities in the Consolidated Balance Sheets.When the accounts of subsidiaries and affiliates are not significant in relation to the Consolidated Financial Statements, they are carried at cost.The excess of the cost over the underlying net equity of investments in unconsolidated subsidiaries and affiliates accounted on an equity basisis deferred and amortized over a five-year period. Consolidated net income includes the Company's Equity in earnings of affiliates after eliminationof unrealized intercompany profits.
(b) Translation of foreign currency transactions and accountsForeign currency transactions are translated using the foreign exchange rates prevailing at the transaction dates. Receivables and payablesdenominated in foreign currencies are translated at the balance sheet date using current exchange rates. All asset and liability accounts of foreign subsidiaries and affiliates are translated into Japanese Yen at current exchange rates at the respective balance sheet dates and all income and expense accounts of those subsidiaries are translated at the average exchange rate for the respective fiscal year then ended.Foreign currency financial statement translation differences are reported as a separate component of Net Assets in the Consolidated Balance Sheets.
(c) Consolidated Statement of Cash FlowsFor the purpose of reporting cash flows, cash and cash equivalents include all highly liquid investments, with original maturities of three months orless, that are readily convertible to known amounts of cash and are so near maturity that they present only an insignificant risk of change in value because of changes in interest rates.
(d) Valuation of Investment securitiesSecurities held by the Companies have been classified into the following categories depending on the purpose for which they are held:Held-to-maturity debt securities: These securities are carried at amortized cost. Any premium or discount arising on acquisition is amortized and recognized as an adjustment to interest income/expense.Other securities: These securities are investment securities expected to be held in the long term. Securities for which fair values are readily determinable are carried at fair value with unrealized gains and losses, net of applicable income taxes, being recorded in net assets. Securities for which fair values are not readily determinable are recorded using the moving average cost.
(e) InventoriesInventories are valued at the lower of cost or market, cost being determined mainly using the weighted average method.
(f) Property, plant and equipmentThe declining-balance method is generally used for the computation of depreciation of property, plant and equipment. However, the straight-line method is used for buildings (excluding accompanying facilities) acquired on and after April 1, 1998 as well as building accompanying facilities and structuresacquired on and after April 1, 2016. The estimated useful lives are as follows:
Buildings: mainly 50 yearsMachinery and equipment: mainly 7 yearsIntangible fixed assets: mainly 5 years
(g) Lease assetsFinance leases are depreciated using the straight-line method over their respective lease terms with no residual values.
(h) Allowance for doubtful accountsAllowance for doubtful accounts provides for estimated uncollectible accounts at amounts either specifically assessed or an amountcomputed based on historical loss experience.
(i) Allowance for investment lossAllowance for investment loss provides for anticipated losses due to the decline of values of investments in unconsolidated subsidiaries andaffiliates, considering financial conditions, etc.
(j) Provision for business structure improvementProvision for business structure improvement is to cover losses incurred due to improvements made to the business structure.Accordingly, a reasonably estimated amount is posted to this allowance to cover expenses that are likely to arise going forward.
(k) Provision for loss on guaranteesProvision for loss on guarantees provides for anticipated losses due to execution of guarantees, considering financial conditions in guaranteedcompanies.

52 53Fujikura Annual Report 2017 Fujikura Annual Report 2017
(l) Accounting method for retirement benefitsI. Attribution method for the estimated amount of retirement benefits In calculating retirement benefits obligations, the method to attribute the estimated amount of retirement benefits to a period until the end of the consolidated fiscal year is based on the plan’s benefit formula.II. Accounting methods for actuarial differences and prior service cost Prior service cost is accounted for according to the straight-line method as they are incurred for a certain number of years (principally fifteen years) within the average remaining years of service of employees at the time of incurring. Actuarial differences are charged to expenses from the fiscal year subsequent to the fiscal year when incurred using a straight-line method mainly based on determined years (principally fifteen years) within the average remaining years of service of employees when incurred.
(m) Accounting for long-term construction-type contractsThe percentage-of-completion method of accounting is applied for the construction contracts which fulfill the conditions that the outcome of theconstruction activity is reasonably estimated during the course of the activity. Otherwise, the completed-contract method is applied. The cost-to-cost method is applied for estimating the percentage of completion.
(n) Hedge accounting The Companies apply hedge accounting for certain derivative financial instruments, which include foreign currency forward exchange contracts,interest rate swap agreements and commodity futures contracts. The companies utilize these hedging instruments to hedge risks of future changes in foreign exchange rates, interest rates and prices of raw materials within the normal course of the Companies' operations.Foreign currency exchange forward contracts: The Companies utilize foreign currency forward exchange contracts to limit exposure to changes in foreign currency exchange rates on accounts receivable and payable and cash flows generated from anticipated transactions denominated in foreign currencies. For foreign currency forward exchange contracts, which are designated as hedges, the Companies have adopted the accounting method where foreign currency denominated assets and liabilities are measured at the contract rate of the respective foreign currency forward exchange contract. With respect to such contracts for anticipated transactions, the contracts are marked-to-market and the resulting unrealized gains/losses are deferred and recorded in the income statement when the exchange gains/losses on the hedged items or transactions are recognized.Interest rate swap agreements: The Companies utilize interest rate swap agreements in order to limit the Companies' exposure with respect to adverse fluctuations in interest rates underlying the debt instruments. The related interest differentials paid or received under the interest rate swap agreements are recognized in interest expense over the term of the agreements.Commodity futures contracts: The Companies utilize commodity futures contracts to hedge the risk of future price fluctuations in some raw materials.
(o) GoodwillGoodwill is amortized using the straight-line method over 5 years.
(p) Income taxesIncome taxes are computed using the asset and liability approach. Under this approach, deferred tax assets and liabilities are recognizedfor the expected future tax consequences of temporary differences between the financial reporting basis and tax basis of assets and liabilities.Valuation allowances are recorded to reduce deferred tax assets when it is more likely than not that the tax benefits will not be realized.The Company files its tax return under the consolidated tax filing system for notional taxes.
(q) Consumption taxThe tax-excluded method is used with respect to consumption tax and local consumption taxes.
(r) Appropriations of retained earningsAppropriations of retained earnings reflected in the accompanying Consolidated Financial Statements are recorded upon approval bythe shareholders.
(s) Other basis for presentation of Consolidated Financial Statements Amounts less than ¥1 million have been omitted. As a result, the total shown in the Consolidated Financial Statements and notes thereto do not necessarily agree with the sum of the individual account balances.
(t) ReclassificationCertain accounts in the Consolidated Financial Statements for the year ended March 31, 2016 have been reclassified to conform tothe 2017 presentation.
(New Accounting Pronouncements and Changes in Accounting Policies)(Application of the Practical Solution on a Change in Depreciation Method due to Tax Reform 2016)
(Additional Information)(Application of Revised Implementation Guidance on Recoverability of Deferred Tax Assets)The Companies have adopted the "Revised Implementation Guidance on Recoverability of Deferred Tax Assets" (ASBJ Guidance No. 26, March 28, 2016)from the current fiscal year.
In accordance with revisions to the Corporate Tax Act, the Company has adopted the "Practical Solution on a Change in Depreciation Method due to Tax Reform 2016" (PracticalIssues Task Force (PITF) No. 32, June 17, 2016) for the current fiscal year. Accordingly, the Companies have changed the depreciation method of buildings accompanyingfacilities and structures obtained on or after April 1, 2016 from the declining-balance method to the straight-line method.As a result, operating income, ordinary income and income before income taxes for the current fiscal year increased by ¥206 million ($1,836 thousand), respectively.
3. United States Dollar AmountsAmounts in U.S. dollars are included solely for the convenience of readers outside Japan. The rate of exchange on March 31, 2017(¥112.19=US$1.00), has been used for translation purposes. The inclusion of such amounts is not intended to imply that Japanese Yenhas been or could be readily converted, realized or settled in U.S. dollars at this rate or any other rate.
4.Financial Instruments(a) Information on financial instruments Policies
The Companies enter into financing arrangements (primarily through bank loans or corporate bonds) based on the planned capital expenditures of its businesses. The Companies invest in low risk financial assets using available cash, finance their short-term working capital needs through commercial papers and bank loans. The Companies use derivative transactions within predetermined transaction volumes to limit the risk of significant fluctuations in foreign currency exchange rates, interest rates, and copper and aluminum prices.
The Companies do not enter into derivative transactions for speculative purposes.
Details of financial instruments and related risksTrade notes and accounts receivable are exposed to customer credit risk. Also, trade receivables denominated in foreign currencies, whichare derived from the Company's global business expansion, are exposed to fluctuations in foreign currency exchange rates, however, the exposure is mitigated by entering into foreign exchange forward contracts.
Investment securities consist mainly of equity securities, which are exposed to market price fluctuation risks.
Trade notes and accounts payable have payment terms within one year. Also, within these accounts there are foreign currency denominated balances generated from the import of raw materials and therefore the balances are exposed to fluctuations in foreign currency exchange rates. However, such balances are typically less than accounts receivable balances denominated in the same currencies. Borrowings and corporate bonds are used primarily for capital expenditures and have maturity dates within mainly five years subsequent to the balance sheet date. Certain borrowing contracts are based on variable, or floating, interest rates, which are exposed to fluctuation risk and are hedged via interest rate swap agreements.
Derivative transactions are comprised primarily of foreign exchange forward contracts hedging foreign currency exchange rate fluctuationrisk in trade receivables/payables denominated in foreign currencies, of interest rate swap agreements hedging interest rate fluctuation riskin bank loans, and commodity forward contracts hedging the risk of copper and aluminum price fluctuation.
Risk management over financial instruments (1) Credit risk management (risk of customers' default risk, etc.)
The Company periodically monitors major customers' financial conditions and performs customer specific aging analyses. In addition, the Company monitors doubtful accounts due to the current economic difficulties in accordance with the credit management policy. The consolidated subsidiaries and affiliates are also required to conform with the credit management policy of the Company.
In order to mitigate credit risks to the greatest extent possible with regards to derivative transactions, the Companies' counterparties arefinancial institutions that maintain high credit ratings.
The financial assets exposed to credit risks recorded in the Consolidated Balance Sheets represent the maximum exposure to credit riskas of March 31, 2016 and March 31, 2017.
(2) Market risk management (risk of fluctuations in foreign currency rates, interest rates, etc.)The Company and certain consolidated subsidiaries generally use foreign exchange forward contracts to limit foreign currency exchange rate fluctuation risk in trade receivables/payables denominated in foreign currencies. Depending on the foreign currency market condition, the Companies use foreign exchange forward contracts for trade receivables denominated in foreign currencies generated from highly probable forecasted export transactions. Also, the Company and certain consolidated subsidiaries use interest rate swap agreements to limit interest rate fluctuation risk associated with bank loans.
In relation to investment securities, the Companies continuously monitor the related market values and financial condition of the issuers while also taking into consideration their business relationships with the issuers.
In executing and managing the daily operations of derivative transactions, the Companies regularly monitor transaction balances/volumesand profit/loss status. Such information is periodically reported to the responsible management team and is audited by certain administration divisions. Prior approval by an Executive Officer of the Company is generally required to enter into significant transactions, transaction modifications or applications for the use of new financial instruments.
(3) Liquidity risk management for financing activities (risk of inability to repay on the due date)The Company manages liquidity risk by preparing cash flow forecasts, led by the finance division, based on relevant information reported from the respective divisions.
Supplementary information on the fair value of financial instrumentsThe fair value of financial instruments is based on market values as well as reasonably determined values in situations where the market fair value is unavailable. The determination of such values is based on certain assumptions, which may result in different outcomes if other assumptions are applied.

54 55Fujikura Annual Report 2017 Fujikura Annual Report 2017
(b) Fair values of financial instruments
The book value of financial instruments in the Consolidated Financial Statements, their fair value and net difference
at March 31, 2016 and 2017, respectively, are shown below:
Millions of yen
2016
(1) Cash and deposits ¥34,961 ¥34,961 ¥ -
(2) Notes and accounts receivable, trade 143,857
Less: Allowance for doubtful accounts (745)
Total 143,111 143,111 -
(3) Investment securities 30,745 29,070 (1,675)
(4) Notes and accounts payable, trade 73,734 73,734 -
(5) Short-term borrowings (*1) 52,982 52,982 -
(6) Commercial papers 2,000 2,000 -
(7) Income taxes payable 2,029 2,029 -
(8) Bonds (*2) 50,000 50,688 688
(9) Long-term borrowings (*1) 94,663 95,685 1,021
(10) Derivative Instruments (*3) Non-hedge derivative instruments (60) (60) - Designated hedge instruments ¥58 ¥58 ¥ -
(*1) ¥13,346 million of the Long-term borrowings which mature within 1 year and are recorded in "Short-term borrowings"
in the consolidated balance sheets are included in "Long-term borrowings" above.
(*2) ¥20,000 million of the bonds which mature within 1 year and are recorded in "Current portion of bonds"
in the consolidated balance sheets are included in "Bonds" above.
(*3) Net receivables and (liabilities) related to the derivative transactions are presented net.
Millions of yen Thousands of U.S. dollars
2017
(1) Cash and deposits ¥31,785 ¥31,785 ¥ - $283,314 $283,314 $ -
(2) Notes and accounts receivable, trade 148,969 1,327,828
Less: Allowance for doubtful accounts (847) (7,550)
Total 148,122 148,122 - 1,320,278 1,320,278 -
(3) Investment securities 33,396 34,534 1,138 297,674 307,817 10,144
(4) Notes and accounts payable, trade 77,230 77,230 - 688,386 688,386 -
(5) Short-term borrowings (*1) 49,529 49,529 - 441,474 441,474 -
(6) Income taxes payable 3,671 3,671 - 32,721 32,721 -
(7) Bonds (*2) 50,000 50,272 272 445,673 448,097 2,424
(8) Long-term borrowings (*1) 126,404 126,681 276 1,126,696 1,129,165 2,460
(9) Derivative Instruments (*3) Non-hedge derivative instruments (163) (163) - (1,453) (1,453) - Designated hedge instruments ¥823 ¥823 ¥ - $7,336 $7,336 $ -
(*1) ¥25,108 million (US$223,799 thousand) of the Long-term borrowings which mature within 1 year and are recorded in "Short-term borrowings"
in the consolidated balance sheets are included in "Long-term borrowings" above.
(*2) ¥10,000 million (US$89,135 thousand) of the bonds which mature within 1 year and are recorded in "Current portion of bonds"
in the consolidated balance sheets are included in "Bonds" above.
(*3) Net receivables and (liabilities) related to the derivative transactions are presented net.
Book value Fairvalue
Difference
Book value Fairvalue
Difference
Book value Fairvalue
Difference
Note 1: Method used to determine fair value of financial instruments, securities and derivative instruments:
(1) Cash and deposits
The cost of cash and deposits approximate fair value due to their short term maturities.
(2) Notes and accounts receivable, trade
The cost of notes and accounts receivable, trade approximate fair value due to their short term maturities. For certain accounts receivables,
the Companies enter into foreign exchange forward contracts for which a simplified method of determining fair value is applied and allowable under JGAAP.
The fair values of such receivables are determined on an aggregate basis with the related foreign exchange forward contract.
(3) Investment securities
The fair value of listed equity securities are determined using quoted market prices for those securities. The fair value of debt securities are determined
using quoted market prices or the prices provided by the counterparty financial institutions.
(4) Notes and accounts payable, trade, (5) Short-term borrowings and (6) Income taxes payable
The costs of these items approximate fair values due to their short term maturities.
(7) Bonds
The fair value of bonds issued by the Company is determined using quoted market prices.
(8) Long-term borrowings
The fair value of these items is determined based on the present value of the principal and interest discounted at the current interest rate
charged for a similar borrowing. For long-term debt with a floating interest rate, the Companies enter into interest swaps for
which a simplified method is applied and allowable under JGAAP. Such long-term borrowings are combined with the related interest swaps and their fair
values are determined based on the present value of the principal and interest reflecting the swap discounted at the current interest rate charged for
a similar borrowing.
(9) Derivative instrumentsThe Companies use a forward exchange rate for foreign exchange forward contracts. Commodity futures contracts fair values are calculated based on LME(London Metal Exchange) and SHFE (Shanghai Futures Exchange) official prices and current exchange rates. Foreign exchange forward contracts
are accounted for combined with the accounts receivables designated as hedged items, and their fair values are included in the related accounts receivable.
Interest swaps for which a simplified method allowed under JGAAP is applied are combined with the long-term debts designated as hedged
items, and their fair values are included in long-term debt.
Note 2: Financial instruments for which estimation of fair value is extremely difficult
2016 Millions of yen
Description Amount recorded in consolidated
balance sheets
Non-public companies ¥7,787
2017 Millions of yen Thousands of U.S. dollars
Description Amount recorded in consolidated Amount recorded in consolidated
balance sheets balance sheets
Non-public companies ¥7,899 $70,407
These items are not included in "(3) Investment securities" because it is extremely difficult to determine their fair value as
there is no quoted market price for these companies available and it is difficult to estimate the future cash flows of these companies.

56 57Fujikura Annual Report 2017 Fujikura Annual Report 2017
Note 3: The aggregate annual maturities of cash and deposits, and receivables at March 31, 2016 and 2017 are as follows:
Millions of yen
At March 31, 2016 Due within1year
Due after 1 yearthrough5 years
Due after 5years through
10 yearsDue after 10
years
Cash and deposits ¥34,961 ¥ - ¥ - ¥ - Notes and accounts receivable, trade 142,790 1,067 - - Total ¥177,752 ¥1,067 ¥ - ¥ -
Millions of yen
At March 31, 2017 Due within1year
Due after 1 yearthrough5 years
Due after 5years through
10 years
Due after 10years
Cash and deposits ¥31,785 ¥ - ¥ - ¥ - Notes and accounts receivable, trade 148,969 0 - - Total ¥180,755 ¥0 ¥ - ¥ -
Thousands of U.S. dollars
At March 31, 2017 Due within1year
Due after 1 yearthrough5 years
Due after 5years through
10 years
Due after 10years
Cash and deposits $283,314 $ - $ - $ - Notes and accounts receivable, trade 1,327,828 0 - -Total $1,611,151 $0 $ - $ -
Note 4: The annual maturities of bonds and long-term borrowings at March 31, 2016 and 2017 are as follows:
At March 31, 2016
Bonds
Millions of yenYear ending March 31, 2017 ¥20,0002018 10,0002019 20,0002020 - 2021 - 2022 and thereafter -
Long-term borrowings Millions of yen
Year ending March 31, 2017 ¥13,3462018 17,3592019 2,6962020 27,8262021 33,4322022 and thereafter 2
At March 31, 2017
Bonds Thousands of Millions of yen U.S. dollars
Year ending March 31, 2018 ¥10,000 $89,1352019 20,000 178,2692020 - -2021 - -2022 10,000 89,1352023 and thereafter 10,000 89,135
Long-term borrowings Thousands of Millions of yen U.S. dollars
Year ending March 31, 2018 ¥25,108 $223,7992019 9,721 86,6482020 38,645 344,4602021 42,927 382,6282022 10,000 89,1352023 and thereafter 1 9
5. Investment Securities
The aggregate cost, gross unrealized gains, gross unrealized losses and fair value of held-to-maturity investment securities at March 31, 2016 and 2017 consisting primarily of equity securities are as follows:
Thousands of Millions of yen U.S. dollars
2016 2017 2017Cost ¥16,003 ¥15,962 $142,276Gross unrealized gains 7,991 9,472 84,428Gross unrealized losses (912) (203) (1,809)Fair value ¥23,081 ¥25,231 $224,895
Available-for-sale investment securities sold during the year ended March 31, 2016 and 2017 are as follows:
At March 31, 2016 Millions of yen
2016Investment securities Sales amount ¥4,313 Gain on sales of investment securities 2,420 Loss on sales of securities 8
At March 31, 2017 Thousands of Millions of yen U.S. dollars
2017 2017Investment securities Sales amount ¥350 $3,120 Gain on sales of investment securities 465 4,145 Loss on sales of securities - -
Investments in unconsolidated subsidiaries and affiliates at March 31, 2016 and 2017 are as follows:Thousands of
Millions of yen U.S. dollars2016 2017 2017
Investments securities ¥13,444 ¥14,228 $126,821Investments and other assets, other 11,518 11,830 105,446
¥24,962 ¥26,058 $232,267
6. Short-term Borrowings, Long-term DebtShort-term borrowings at March 31, 2016 and 2017 are as follows:
Thousands of Millions of yen U.S. dollars
2016 2017 2017Loans, principally from banks, with weighted-average interest rates of1.5% and 1.5% per year at March 31, 2016 and 2017, respectively. ¥52,982 ¥49,529 $441,474Commercial papers, with weighted-average interest rates of 0.0%per year at March 31, 2016. 2,000 - -
¥54,982 ¥49,529 $441,474

58 59Fujikura Annual Report 2017 Fujikura Annual Report 2017
Long-term debt at March 31, 2016 and 2017 is as follows:Thousands of
Millions of yen U.S. dollars2016 2017 2017
Unsecured loans from banks and other financial institutions with maturity dates from 2017 to 2028 with weighted-average interest rates of 1.2% and 1.3% at March 31, 2016 and 2017, respectively.
¥94,663 ¥126,404 $1,126,696
Lease obligations 609 330 2,941
Unsecured straight bonds issued from January 31, 2008 to September 6, 2016 with interest rates ranging from 0.1% to 1.8%, maturity dates September 7, 2016 to September 6, 2023 50,000 50,000 445,673
145,273 176,735 1,575,319
Less: current portion due within one year Long term borrowings (13,346) (25,108) (223,799) Bonds (20,000) (10,000) (89,135) Lease obligations (340) (136) (1,212) Total (33,687) (35,244) (314,146)
¥111,586 ¥141,490 $1,261,164
The Companies' assets pledged as collateral for other interest-bearing debts at March 31, 2016 and 2017 are as follows:Thousands of
Millions of yen U.S. dollars
2016 2017 2017Carrying values of property, plant and equipment:Land ¥992 ¥992 $8,842
The annual maturities of long-term debts are as follows:Thousands of
Long term borrowings Millions of yen U.S. dollarsYear ending March 31,2019 ¥9,721 $86,6482020 38,645 344,4602021 42,927 382,6282022 10,000 89,135
Thousands of Lease obligations Millions of yen U.S. dollarsYear ending March 31,2019 ¥105 $9362020 45 4012021 30 2672022 13 116
Thousands of Bonds Millions of yen U.S. dollarsYear ending March 31,2019 ¥20,000 $178,2692020 - - 2021 - - 2022 10,000 $89,135
7. Other Long-term LiabilitiesOther than the loans and debts included in note 6, interest-bearing debts, which consisted of guarantee money received in the amounts of¥2,704 million and ¥2,124 million (US$18,932 thousand), were recorded as a part of other long-term liabilities in the Consolidated Balance Sheetsas of March 31, 2016 and 2017, respectively.
8. Research and Development CostsResearch and development costs included in Selling, general and administrative expenses and Cost of sales, in aggregate, for the years endedMarch 31, 2016 and 2017, amounted to ¥16,210 million and ¥15,614 million (US$139,175 thousand), respectively.
9. Severance Indemnities and Pension Plans(a) Outline of retirement and severance benefits plans adopted by the Companies The Company and its domestic consolidated subsidiaries sponsor various defined benefit plans such as corporate pension plans, employees' pension funds and lump sum retirement plans for their employees. Certain consolidated subsidiaries also sponsor defined contribution plans.
(b) Defined benefit plan The following tables present summaries of the benefit obligations for defined pension plans, plan assets and the associated funded status recorded in the Consolidated Balance Sheets. (1) Benefit obligations at the beginning of the period and the end of the period (excluding those plans that adopt the simplified method as discussed in (3) below)
Thousands of U.S. dollars
2016 2017 2017Balance at the beginning of the period ¥55,480 ¥58,195 $518,718 Service cost 2,239 2,537 22,613 Interest cost 476 183 1,631 Actuarial (gains) or losses 4,281 (1,359) (12,113) Retirement benefits paid (4,098) (5,164) (46,029) Other (184) (493) (4,394)Balance at the end of the period ¥58,195 ¥53,897 $480,408
(2) Plan assets at the beginning of the period and the end of the period (excluding those plans that adopt the simplified method as discussed in (3) below)
Thousands of U.S. dollars
2016 2017 2017Balance at the beginning of the period ¥56,028 ¥52,651 $469,302 Expected return on plan assets 1,090 917 8,174 Actuarial (gains) or losses (2,442) 71 633 Employer's contributions 1,447 1,470 13,103 Retirement benefits paid (3,472) (4,003) (35,681)Balance at the end of the period ¥52,651 ¥51,105 $455,522
(3) Defined benefit liability at the beginning of the period and the end of the period for consolidated subsidiaries adopting the simplified method
Thousands of U.S. dollars
2016 2017 2017Balance at the beginning of the period ¥1,950 ¥2,126 $18,950 Retirement benefit cost 393 300 2,674 Retirement benefits paid (144) (117) (1,043) Annual contribution (73) (149) (1,328)Balance at the end of the period ¥2,126 ¥2,160 $19,253
(4) Reconciliation between the liabilities (assets) recorded in the Consolidated Balance Sheets and the balances of defined benefit obligations and plan assets
Thousands of U.S. dollars
2016 2017 2017Retirement benefit obligations of the savings plans ¥57,679 ¥53,451 $476,433Plan assets (41,571) (39,396) (351,154)Retirement benefits trusts (12,753) (13,436) (119,761)
3,353 618 5,509Retirement benefit obligations of the non-savings plans 4,317 4,333 38,622Net liabilities and assets recorded on the Consolidated Balance Sheets 7,670 4,952 44,139Net defined benefit liability 9,218 8,184 72,948Net defined benefit asset (1,547) (3,231) (28,799)Net liabilities (assets) recorded on the Consolidated Balance Sheets ¥7,670 ¥4,952 $44,139
(5) Components of net periodic retirement benefits costs
Thousands of U.S. dollars
2016 2017 2017Service cost ¥2,239 ¥2,537 $22,613Interest cost 476 183 1,631Expected return on plan assets (1,090) (917) (8,174)Recognized actuarial (gains) or losses 2,136 2,540 22,640Amortization of prior service cost (258) (263) (2,344)Net retirement benefit costs of the plans adopting the simplified method 393 300 2,674Retirement benefit costs related to the defined benefit plans ¥3,896 ¥4,380 $39,041Note. Extra retirement payments for the years ended March 31, 2016 and 2017 in the amount of ¥1,263 million and ¥1,497 million (US$ 13,343 thousand) respectively, are accounted for as "Business structure improvement expenses" of Extraordinary loss.
(6) Remeasurements of defined benefit plans before deduction of deferred taxThousands of
U.S. dollars2016 2017 2017
Unrecognized prior service cost ¥258 ¥243 $2,166Unrecognized actuarial (gains) or losses 4,618 (3,980) (35,476)Total ¥4,876 (¥3,737) ($33,310)
Millions of yen
Millions of yen
Millions of yen
Millions of yen
Millions of yen
Millions of yen

60 61Fujikura Annual Report 2017 Fujikura Annual Report 2017
(7) Accumulated other comprehensive income before deduction of deferred tax on defined retirement benefit plansThousands of
U.S. dollars2016 2017 2017
Unrecognized prior service cost (¥1,303) (¥1,059) ($9,439)Unrecognized actuarial (gains) or losses 12,638 8,658 77,173Total ¥11,335 ¥7,598 $67,724
(8) Plan assets consisted of the following : 2016 2017Bonds 44 29 %Equity securities 17 19Cash and deposits 18 27General accounts 6 7Others 15 17Total 100 100 %Note. Employee retirement benefits trusts contributed to the company pension plan as of March 31, 2016 and 2017 represent approximately 23% and 25% of "Plan assets" respectively.
(9) Method to establish a long-term expected return on plan assets To determine the long-term expected return on plan assets, the present and expected allocation of plan assets and the present and expected future returns from a variety of plan assets have been taken into account.
(10) The actuarial assumptions used2016 2017
Discount rates Mainly 0.2% Mainly 0.4% Expected long-term expected return on plan assets Mainly 2.5% Mainly 2.5% Lump sum election rate Mainly 56.9% Mainly 63.7% Re-evaluation rate Mainly 1.5% Mainly 1.0%
(c) Defined contribution plan Total annual contributions to the defined contribution plans for the years ended March 31, 2016 and 2017 are ¥420 million and ¥395 million (US$ 3,521 thousand), respectively.
10. InventoriesInventories are valued at the lower of cost or market and the associated losses on inventory devaluation have been included in "Cost of sales" for the years ended March 31, 2016 and 2017 in the amounts of ¥1,621 million and ¥2,007 million (US$17,889 thousand), respectively.
11.Gain on Sales of Fixed Assets Thousands of U.S. dollars
2016 2017 2017Buildings ¥418 ¥145 $1,292Land (92) 34 303Total ¥325 ¥180 $1,604
12.Business Structure Improvement ExpensesFor the Year Ended March 31, 2016 Millions of yenExtraordinary loss due to reorganization and liquidation of Viscas Corporation ("Viscas") ¥6,358Special retirement pay and other outlays paid to early retirees at overseas subsidiaries 1,442Total ¥7,801
Extraordinary loss due to reorganization and liquidation of Viscas
Thousands of For the Year Ended March 31, 2017 Millions of yen U.S. dollarsExtraordinary loss due to reorganization and liquidation of Viscas Corporation ("Viscas") ¥1,642 $14,636Special retirement pay and other outlays paid to early retirees at overseas subsidiaries 1,544 13,762Total ¥3,187 $28,407
Extraordinary loss due to reorganization and liquidation of Viscas
13.Corporate Taxes for Past Fiscal Years
Millions of yen
Millions of yen
On April 25, 2016, the Company and Furukawa Electric Co., Ltd. ("Furukawa") signed an agreement on the reorganization and liquidation of their joint ventureViscas. On October 1, 2016, in accordance with the agreement, the Distribution and Overhead Transmission Businesses of Viscas were transferred to theCompany, and the Underground Transmission and Submarine Cable Businesses of Viscas were transferred to Furukawa.The extraordinary losses of 1,642 million yen recognized in conjunction with the reorganization and liquidation of Viscas consist of a loss on the transfer ofbusinesses, cost for the relocation and removal of facilities, a loss on valuation of the investment and loss on the transfer of ownership, due to the liquidationand sale of Viscas.
Fujikura Electronics (Thailand) Ltd. ("FETL"), a consolidated subsidiary in Thailand, received the following notices from the Thai tax authorities requiring anamendment of corporate tax payments made in the past fiscal years: (1) a notice on May 21, 2013 for 883 million baht, (2) a notice on May 28, 2014 for 29million baht, (3) a notice on May 21, 2015 for 7 million baht and (4) a notice on January 14, 2016 for 1 million baht. FETL believed that such notices did nothave a legitimate reasoning and were unacceptable. As such, FETL filed an appeal with the Revenue Department’s Board of Appeal in Thailand and a lawsuitwith the Central Tax Court.On May 16, 2016, the Supreme Court of Thailand made a judgement to reject another lawsuit and appeal filed by other companies, which was similar to thecase filed by FETL. Furthermore, on June 16, 2016, the Thai Ministry of Finance announced the following notifications:1) the tax filing period would be extended and 2) payment of additional taxes and delinquency charges would be exempted if the below conditions were met;- Withdrawal of lawsuit with the Central Tax Court no later than August 1, 2016;- Withdrawal of appeal with the Revenue Department’s Board of Appeal no later than August 1, 2016;- Approvals by both the Central Tax Court and the Revenue Department’s Board of Appeal; and- Revision of tax filing and payment of corresponding taxes.Afterward, the National Council for Peace and Order announced a notice on July 29, 2016, stating the filing period of corporate taxes would be extended toAugust 15, 2016.In accordance with the notices received, the Fujikura Group withdrew the lawsuit and the appeal, and then revised the tax filing and paid the correspondingtaxes based on the recalculation of the taxable income in line with the method instructed by the Thai Tax Authorities which covered the fiscal years not subjectto the tax amendment as well as group companies in Thailand including DDK (Thailand) Ltd. who was not subject to the tax amendment.On that basis, the Company recorded income taxes for prior periods of 2,764 million yen (US$24,637 thousand).
On April 25, 2016, the Company and Furukawa Electric Co., Ltd. ("Furukawa") signed a basic agreement for the reorganization and liquidation of their jointventure Viscas. Under this agreement, the Distribution and Overhead Transmission Businesses are to be transferred to the Company on October 1, 2016, andthe Underground Transmission and Submarine Cable Businesses are to be transferred to Furukawa on the same date. The 6,358 million yen included inextraordinary loss for the reorganization and liquidation of Viscas mainly reflects expected business transfer losses and expected losses on doubtful accountsand the transfer of equity interest due to the liquidation and sale of Viscas’ overseas subsidiaries.
14. Consolidated Statements of Comprehensive IncomeFor the Years Ended March 31, 2016 and 2017Amount of reclassification and tax effect related to other comprehensive income are summarized as follows:
Thousands of Millions of yen U.S. dollars
Valuation difference on available-for-sale securities 2016 2017 2017 Amount arising during the year (¥5,615) ¥2,384 $21,250 Reclassification adjustment (2,180) (182) (1,622) Before tax effect adjustment (7,795) 2,201 19,619 Tax effect 2,386 (601) (5,357) Valuation difference on available-for-sale securities (5,409) 1,600 14,262
Deferred gains or losses on hedges Amount arising during the year (24) 681 6,070 Before tax effect adjustment (24) 681 6,070 Tax effect 11 (39) (348) Deferred gains or losses on hedges (13) 642 5,722
Foreign currency translation adjustments Amount arising during the year (16,416) (3,472) (30,947) Reclassification adjustment 102 (22) (196) Foreign currency translation adjustments (16,314) (3,495) (31,153)
Remeasurements of defined benefit plans, net of taxes Amount arising during the year (6,763) 1,559 13,896 Reclassification adjustment 1,879 2,277 20,296 Before tax effect adjustment (4,883) 3,836 34,192 Tax effect 698 (709) (6,320) Remeasurements of defined benefit plans, net of taxes (4,185) 3,127 27,872
Share of other comprehensive income of associates accounted for using equity method Amount arising during the year (755) (430) (3,833) Reclassification adjustment 247 71 633 Share of other comprehensive income of associates accounted for using equity method (508) (359) (3,200)
Other comprehensive income (¥26,431) ¥1,516 $13,513
15. Supplementary Cash Flow Information A reconciliation of cash and cash equivalents in the Consolidated Statement of Cash Flows and account balances in the Consolidated Balance Sheets at March 31, 2016 and 2017 are as follows:
Thousands of Millions of yen U.S. dollars
2016 2017 2017Cash and deposits ¥34,961 ¥31,785 $283,314Deposits with original maturities of over three months (2,870) (1,105) (9,849)Cash and cash equivalents ¥32,091 ¥30,680 $273,465

62 63Fujikura Annual Report 2017 Fujikura Annual Report 2017
16. Income TaxesThe Company and its domestic subsidiaries are subject to a number of different income taxes which, in aggregate, indicate a normalstatutory tax rate in Japan of approximately 32.5% and 30.4% for the years ended March 31, 2016 and 2017, respectively.A reconciliation between the normal statutory income tax rate and the effective income tax rate in the accompanying ConsolidatedStatements of Income for the years ended March 31, 2016 and 2017 are as follows:
2016 2017Normal statutory tax rate 32.5 % 30.4 %Effect on tax rate resulting from permanent differences 0.6 0.3Equity in losses of affiliates (0.9) (1.1)Tax exemption in foreign tax jurisdiction (8.1) (4.6)Valuation allowance (3.0) 2.5Effect of lower tax rates at overseas subsidiaries (12.1) (4.3)Amortization of Goodwill 6.0 4.2Income taxes for prior periods - 6.2Foreign taxes included in deductible expenses 7.6 3.9Other 4.5 2.3Effective income tax rate 27.0 % 39.9 %
The significant components of deferred tax assets and liabilities at March 31, 2016 and 2017 are as follows:Thousands of
Millions of yen U.S. dollars2016 2017 2017
Deferred tax assets:Inventory devaluations ¥877 ¥1,190 $10,607Bonus accrual 2,323 2,554 22,765Net defined benefit liability 4,566 4,386 39,094Elimination of intercompany profits on inventories 162 308 2,745Enterprise taxes 132 172 1,533Net operating losses carried forward 18,837 18,309 163,196Loss on valuation of investment securities 2,310 2,249 20,046Depreciation 3,160 3,412 30,413Allowance for doubtful accounts 1,016 2,400 21,392Impairment losses 1,242 1,100 9,805Elimination of intercompany profits on fixed assets 814 810 7,220Foreign tax credit carried forward 1,708 276 2,460Other 6,164 4,832 43,070Gross deferred tax assets 43,317 42,003 374,392Less: valuation allowance (24,641) (21,519) (191,809)Total deferred tax assets 18,676 20,484 182,583
Deferred tax liabilities:Special tax-purpose reserve for deferred gain on sale of property 733 722 6,436Retained earnings of equity-method affiliated company 543 931 8,298Unrealized gains on investment securities 1,428 2,030 18,094Other 847 681 6,070Total deferred tax liabilities 3,552 4,367 38,925Net deferred tax assets ¥15,123 ¥16,116 $143,649
Net deferred tax assets (liabilities) included in the Consolidated Balance Sheets are as follows:Thousands of
Millions of yen U.S. dollars2016 2017 2017
Current assets - Deferred tax assets ¥5,263 ¥3,766 $33,568Non-current assets - Deferred tax assets 10,643 12,484 111,276Current liabilities - Other (16) (7) (62)Non-current liabilities - Deferred tax liabilities (766) (126) (1,123)Net deferred tax assets
17. Contingent Liabilities Thousands of
Millions of yen U.S. dollarsGuarantees for loans borrowed / notes issued by: 2016 2017 2017Employees ¥260 ¥220 $1,961Procable Energia e Telecomunicacoes S.A., affiliated company - 2,923 26,054VISCAS corporation, affiliated company 7,667 130 1,159Other unconsolidated subsidiaries and affiliates 3,411 2,474 22,052
¥11,339 ¥5,749 $51,243

64 65Fujikura Annual Report 2017 Fujikura Annual Report 2017
18. Derivative Instruments(a) Derivative instruments not accounted for under hedge accounting(1) Foreign forward exchange contractsAt March 31, 2016 Millions of yen
2016Sell USD ¥6,130 ¥501 ¥75 ¥75 YEN 129 - (0) (0) Others 228 - 0 0Buy USD 6,751 139 (103) (103) YEN 713 - 7 7 Others 8 - (0) (0) Total ¥13,961 ¥640 (¥21) (¥21)
At March 31, 2017 Millions of yen Thousands of U.S. dollars
2017Sell USD ¥7,279 - ¥46 ¥46 $64,881 - $410 $410 YEN 348 - (4) (4) 3,102 - (36) (36) Others 153 - (1) (1) 1,364 - (9) (9)Buy USD 20,921 885 (335) (335) 186,478 7,888 (2,986) (2,986) YEN 424 - (6) (6) 3,779 - (53) (53) Others 218 - (5) (5) 1,943 - (45) (45) Total ¥29,345 ¥885 (¥307) (¥307) $261,565 $7,888 ($2,736) ($2,736)
(2) Interest Rate SwapsAt March 31, 2016 N/A
At March 31, 2017 N/A
(3) Commodity Futures ContractsAt March 31, 2016 Millions of yen
2016 Sell ¥2,326 ¥ - ¥18 ¥18 Buy 372 39 (57) (57) Total ¥2,699 ¥39 (¥38) (¥38)
At March 31, 2017 Millions of yen Thousands of U.S. dollars
2017
Notionalamount
Notionalamount to be
settled in morethan one year
Fairvalue
Gain (loss)
Notionalamount
Notionalamount to be
settled in morethan one year
Fairvalue
Gain (loss)
Sell ¥2,996 ¥ - ¥25 ¥25 $26,705 $ - $223 $223 Buy 1,890 83 119 119 16,846 740 1,061 1,061 Total ¥4,887 ¥83 ¥144 ¥144 $43,560 $740 $1,284 $1,284
(b) Derivative instruments accounted for under hedge accounting
(1) Foreign forward exchange contracts
At March 31, 2016 Millions of yen
2016Accounted for combined with the accounts designated as hedged items (allowed under JGAAP) Accounts receivable, trade Sell USD ¥25,558 - ¥ - EUR 1,080 - -
Accounted for by the method in the principle Accounts receivable, trade Sell USD 5,734 71 76 EUR 687 - (1)Total ¥33,060 ¥71 ¥74
Notionalamount
Notionalamount to be
settled in morethan one year
Fairvalue
Gain (loss)
Notionalamount
Notionalamount to be
settled in morethan one year
Fairvalue
Gain (loss)
Notionalamount
Notionalamount
Notionalamount to be
settled in morethan one year
Fairvalue
Notionalamount to be
settled in morethan one year
Fairvalue
Gain (loss)
Notionalamount
Notionalamount to be
settled in morethan one year
Fairvalue
Gain (loss)
At March 31, 2017 Millions of yen Thousands of U.S. dollars
2017Accounted for combined with the accounts designated as hedged items (allowed under JGAAP) Accounts receivable, trade Sell USD ¥26,029 - ¥ - $232,008 - $ - EUR 966 - - 8,610 - -
Accounted for by the method in the principle Accounts receivable, trade Sell USD 12,448 1,483 189 110,955 13,219 1,685 EUR 641 122 7 5,714 1,087 62 Accounts payable, trade Buy USD 291 - (4) 2,594 - (36) Others 61 - 0 544 - 0
Total ¥40,439 ¥1,606 ¥192 $360,451 $14,315 $1,711
(2) Interest Rate SwapsAt March 31, 2016 Millions of yen
2016Accounted for by the simplified method allowed under JGAAPInterest Rate Swaps Long-term debt Pay Fixed interest / Rec. Floating interest ¥72,500 ¥63,500 ¥ -
Accounted for by the method in the principleInterest Rate Swaps Long-term debt Pay Fixed interest / Rec. Floating interest 1,000 1,000 (16)Total ¥73,500 ¥64,500 (¥16)
At March 31, 2017 Millions of yen Thousands of U.S. dollars
2017
Accounted for by the simplified method allowed under JGAAPInterest Rate Swaps Long-term debt Pay Fixed interest / Rec. Floating interest ¥77,773 ¥60,851 ¥ - $693,226 $542,392 $ -
Total ¥77,773 ¥60,851 ¥ - $693,226 $542,392 $ -
(3) Commodity Futures ContractsAt March 31, 2016 N/A
At March 31, 2017 Millions of yen Thousands of U.S. dollars
2017
Accounted for by the method in the principleCommodity Futures Contracts Raw materials Sell ¥3,630 - 630 $32,356 - 5,615
Total ¥3,630 ¥ - ¥630 $32,356 $ - $5,615
19. Supplementary Information for the Consolidated Statements of Changes in Net AssetsFor the Year Ended March 31, 2016(a) Type and number of outstanding shares
Year ended March 31, 2016
Type of sharesIssued stock: Common stock TotalTreasury stock: Common stock (*1)(*2) 9,589 0 Total 9,589 0(*1) Treasury stock increased due to the repurchase of 9,589,000 shares.(*2) Treasury stock decreased due to the selling of stock less than one unit.
(b) Dividends (1) Dividends paid to shareholders:
Amount Amount
Date of approval (Millions ofyen)
per share(Yen)
June 26, 2015 Common ¥1,082 ¥3.5stock
October 29, 2015 Common ¥1,221 ¥4.0stock
(2) Dividends with a shareholders' cut-off date during the current fiscal year but an effective date subsequent to the current fiscal year-end:Amount Amount
Date of approval (Millions ofyen) per share (Yen)
June 29, 2016 Common ¥1,198 Retained ¥4.0stock earnings
Resolutionapproved by
Type ofshares
Paid from Shareholders'cut-off date
Effectivedate
Annual general meeting March 31, 2016
June 30, 2016of shareholders
Annual general meeting March 31, 2015
June 29, 2015of shareholders
Board of directors September 30, 2015
December2, 2015
51,738 61,32751,738 61,327
Resolutionapproved by
Type ofshares
Shareholders'cut-off date
Effectivedate
360,863 - 360,863360,863 - 360,863
- -
Thousands of sharesBalance at Increase in shares Decrease in shares Balance at
beginning of year during the year during the year end of year
Notionalamount
More than oneyear of Notional
amount
Fairvalue
Notionalamount
More than oneyear of Notional
amount
Fairvalue
Notionalamount
More than oneyear of Notional
amount
Fairvalue
Notionalamount
More than oneyear of Notional
amount
Fairvalue
Notionalamount
More than oneyear of Notional
amount
Fairvalue
Notionalamount
More than oneyear of Notional
amount
Fairvalue
Notionalamount
More than oneyear of Notional
amount
Fairvalue

66 67Fujikura Annual Report 2017 Fujikura Annual Report 2017
For the Year Ended March 31, 2017(a) Type and number of outstanding shares
Year ended March 31, 2017
Type of sharesIssued stock: Common stock (*1) TotalTreasury stock: Common stock (*1)(*2) Total(*1) The decrease of 65,000,000 shares during the year is due to the retirement of treasury stock.(*2) Treasury stock increased due to the repurchase of 14,280,000 shares.
(b) Dividends (1) Dividends paid to shareholders:
Amount Amount Amount Amount
Date of approval (Millions ofyen)
(Thousands ofU.S. dollars)
per share(Yen)
per share(U.S. dollars)
June 29, 2016 Common ¥1,198 $10,678 ¥4.0 $0.04stock
October 28, 2016 Common ¥1,438 $12,818 ¥5.0 $0.04stock
(2) Dividends with a shareholders' cut-off date during the current fiscal year but an effective date subsequent to the current fiscal year-end:Amount Amount Amount Amount
Date of approval (Millions ofyen)
(Thousands ofU.S. dollars) per share (Yen) per share
(U.S. dollars)June 29, 2017 Common ¥1,426 $12,711 Retained ¥5.0 $0.04
stock earnings
20. Investment and Rental PropertyThe Companies own office buildings including land for rent in Tokyo and other districts. Profits generated from these investments and rental properties were ¥5,426 million and ¥4,626 million (US$41,234 thousand) for the fiscal years ended March 31, 2016 and 2017, respectively. The majority of rental revenues were recorded in Net sales and majority of rental costs were recorded in Cost of sales in the Consolidated Statements of Income.Book value, increase and decrease during the year and fair value of the investment and rental property at March 31, 2016 and 2017are as follows:
For the Year Ended March 31, 2016
Millions of yen
Amounts in the Consolidated Balance Sheets (*1)Balance at beginning Increase and decrease in Balance at end Fair value at end
of the year property during the year (*2) of the year of the year (*3)¥41,334 (¥1,147) ¥40,187 ¥99,057
(*1) Amounts in the Consolidated Balance Sheets are computed based on acquisition costs after deducting accumulated depreciation and impairment charges. (*2) The primary decrease in property during the year is the depreciation of office buildings for rent in the amount of ¥1,720 million.(*3) Fair value at end of year was primarily based on "Real Estate Appraisal Standards".
For the Year Ended March 31, 2017
Millions of yen
Amounts in the consolidated balance sheet (*1)Balance at beginning Increase and decrease in Balance at end Fair value at end
of the year property during the year (*2) of the year of the year (*3)¥40,187 ¥7,216 ¥47,404 ¥114,775
Thousands of U.S. dollars
Amounts in the Consolidated Balance sheets (*1)Balance at beginning Increase and decrease in Balance at end Fair value at end
of the year property during the year (*2) of the year of the year (*3)$358,205 $64,319 $422,533 $1,023,041
(*1) Amounts in the Consolidated Balance Sheets are computed based on acquisition costs after deducting accumulated depreciation and impairment charges. (*2) The primary increase in property during the year is the acquisition of assets for rent in the amount of ¥9,060 million (US$80,756 thousand).(*3) Fair value at end of the year is primarily estimated by the Company based on "Real Estate Appraisal Standards".
Effectivedate
Annual general meeting March 31, 2017
June 30, 2017of shareholders
Board of directors September 30, 2016
December2, 2016
Resolutionapproved by
Type ofshares
Paid from Shareholders'cut-off date
Resolutionapproved by
Type ofshares
Shareholders'cut-off date
Effectivedate
Annual general meeting March 31, 2016
June 30, 2016of shareholders
61,327 14,280 65,000 10,61061,327 14,280 65,000 10,610
360,863 - 65,000 295,863360,863 - 65,000 295,863
Thousands of sharesBalance at Increase in shares Decrease in shares Balance at
beginning of year during the year during the year end of year
21. Segment Information(Segment Information)(a) Summary of reporting segments
The Group's reporting segments are components of the Group for which separate financial statements are available that are regularly monitoredby the management in deciding how to allocate resources and in assessing performance.The Group classifies its businesses into 4 segments, which are "Power & Telecommunication Systems Company", "Electronics Business Company", "Automotive Products Company", "Real Estate Business Company", considering similarities in production methods, production process, applications and sales methods.Starting from the consolidated fiscal year, some of the businesses previously reported as "Other" have been transferred to "Power & Telecommunication Systems Company", as a result of a review of management structure in order to improve the efficiency of these businesses which are expected to become in operation.
Definitions of the four segments for the years ended March 31, 2016 and 2017 are as follows: The Power & Telecommunication Systems Company deals with power cables, telecommunication cables, aluminum wires, enameled wires, optical fibers, optical fiber cables, telecommunication components, optical components, fiber optic equipment, network equipment, installation, etc. The Electronics Business Company deals with flexible printed circuits, electronic wiring, HDD components, various kinds of connectors, etc. The Automotive Products Company deals with automotive wire harnesses, accessories & installation, etc. The Real Estate Business Company deals with real estate, etc.
(b) Basis of calculation for sales, profits or losses, assets, liabilities and other items by reporting segmentsAccounting policy and method used for segment information by reporting segments are identical to those as described in "2. Summary of Significant Accounting Policies" above. Profits by reporting segment are based on operating income as stated in the Consolidated Statements of Income.
(c) Information on sales, profit or loss, assets, liabilities, and other items by reporting segment
For the year ended March 31, 2016
Millions of yenPower &
Telecommuni- Other Adjustment Consolidated cation Systems (*1) (* 2,3,4) total
Reporting segments Company
Sales to outside customers ¥366,523 ¥161,166 ¥135,876 ¥10,709 ¥4,252 ¥678,528 - ¥678,528Inter-segment sales 203 99 41 - 13 359 (359) -Total sales 366,727 161,265 135,918 10,709 4,266 678,887 (359) 678,528Segment profit (loss) 14,316 12,268 2,386 5,394 (1,733) 32,632 - 32,632Segment total assets 241,611 124,337 77,136 36,177 5,833 485,096 67,581 552,678
Depreciation and amortization 8,995 9,167 3,335 1,739 347 23,585 2,725 26,311Impairment losses 302 116 - - - 419 - 419Capital expenditures ¥7,225 ¥15,178 ¥6,036 ¥679 ¥236 ¥29,356 ¥2,623 ¥31,979
Notes:(*1) "Other" includes new businesses to launch which are excluded from the aforementioned 4 segments.(*2) Adjustment of ¥67,581 million in "Segment total assets" represents common assets not allocated to each reporting segment in the amount of ¥90,624 million and elimination of inter-segment transactions in the amount of ¥(23,042) million. Common assets mainly consisted of assets related to investment securities, research and development and administrative divisions of the Company.(*3) Adjustment of ¥2,725 million of "Depreciation and amortization" represents depreciation and amortization associated with common assets not allocated to each reporting segment.(*4) Adjustment of ¥2,623 million of "Capital expenditures" represents an increase in common assets not allocated to each reporting segment.
For the year ended March 31, 2017
Millions of yenPower &
Telecommuni- Other Adjustment Consolidated cation Systems (*1) (* 2,3,4) total
Reporting segments Company
Sales to outside customers ¥349,656 ¥156,737 ¥133,107 ¥10,183 ¥4,111 ¥653,795 - ¥653,795Inter-segment sales 442 268 35 - 25 772 (772) -Total sales 350,098 157,005 133,143 10,183 4,137 654,567 (772) 653,795Segment profit (loss) 20,366 7,557 2,569 4,661 (924) 34,230 - 34,230Segment total assets 236,170 131,658 89,137 42,833 5,154 504,954 83,672 588,626
Depreciation and amortization 9,222 9,725 3,834 1,814 423 25,020 2,568 27,589Impairment losses 1 25 - - - 27 - 27Capital expenditures ¥11,454 ¥15,063 ¥7,500 ¥8,545 ¥368 ¥42,933 ¥2,689 ¥45,623
Thousands of U.S. dollarsPower &
Telecommuni- Other Adjustment Consolidated cation Systems (*1) (* 2,3,4) total
Reporting segments Company
Sales to outside customers $3,116,641 $1,397,067 $1,186,443 $90,766 $36,643 $5,827,569 - $5,827,569Inter-segment sales 3,940 2,389 312 - 223 6,881 (6,881) -Total sales 3,120,581 1,399,456 1,186,764 90,766 36,875 5,834,450 (6,881) 5,827,569Segment profit (loss) 181,531 67,359 22,899 41,546 (8,236) 305,107 - 305,107Segment total assets 2,105,090 1,173,527 794,518 381,790 45,940 4,500,882 745,806 5,246,689
Depreciation and amortization 82,200 86,683 34,174 16,169 3,770 223,015 22,890 245,913Impairment losses 9 223 - - - 241 - 241Capital expenditures $102,095 $134,263 $66,851 $76,165 $3,280 $382,681 $23,968 $406,658
Notes:(*1) "Other" includes new businesses to launch which are excluded from the aforementioned 4 segments.(*2) Adjustment of ¥83,672 million (US$745,806 thousand) in "Segment total assets" represents common assets not allocated to each reporting segment in the amount of ¥111,221 million (US$991,363 thousand) and elimination of inter-segment transactions in the amount of ¥(27,549) million (US$(245,557) thousand). Common assets mainly consisted of assets related to investment securities, research and development and administrative divisions of the Company.(*3) Adjustment of ¥2,568 million (US$22,890 thousand) of "Depreciation and amortization" represents depreciation and amortization associated with common assets not allocated to each reporting segment.(*4) Adjustment of ¥2,689 million (US$23,968 thousand) of "Capital expenditures" represents an increase in common assets not allocated to each reporting segment.
Real EstateBusinessCompany
Total
ElectronicsBusinessCompany
AutomotiveProductsCompany
Real EstateBusinessCompany
Total
ElectronicsBusinessCompany
AutomotiveProductsCompany
Real EstateBusinessCompany
Total
ElectronicsBusinessCompany
AutomotiveProductsCompany

68 69Fujikura Annual Report 2017 Fujikura Annual Report 2017
(Related information)(a)Geographical segment information
SalesMillions of yen
2016 Japan U.S. China Others TotalSales to external customers ¥269,528 ¥148,891 ¥103,849 ¥156,258 ¥678,528
Tangible fixed assetsMillions of yen
2016 Japan Thailand China Others TotalTangible fixed assets ¥91,033 ¥44,508 ¥19,862 ¥24,549 ¥179,953
SalesMillions of yen Thousands of U.S. dollars
2017 Japan U.S. China Others Total Japan U.S. China Others TotalSales to external customers ¥256,000 ¥124,401 ¥96,991 ¥176,401 ¥653,795 $2,281,843 $1,108,842 $864,524 $1,572,342 $5,827,569
Tangible fixed assetsMillions of yen Thousands of U.S. dollars
2017 Japan Thailand China Others Total Japan Thailand China Others TotalTangible fixed assets ¥99,921 ¥50,880 ¥17,976 ¥26,505 ¥195,283 $890,641 $453,516 $160,228 $236,251 $1,740,645
(b) Major customer informationThis information has been omitted as there were no customers to whom the Group individually recorded external sales representing 10% or more of consolidated net sales for the years ended March 31, 2016 and 2017.
(c) Goodwill information
For the year ended March 31, 2016
Millions of yenPower &
Telecommuni- cation Systems
Reporting segments CompanyAmortization ¥3,145 ¥4 - - ¥3,149Unamortized goodwill 10,941 8 - - 10,949
For the year ended March 31, 2017
Millions of yenPower &
Telecommuni- cation Systems
Reporting segments CompanyAmortization ¥3,541 ¥4 - - ¥3,545Unamortized goodwill 7,119 4 - - 7,123
Thousands of U.S. dollarsPower &
Telecommuni- cation Systems
Reporting segments CompanyAmortization $31,563 $36 - - $31,598Unamortized goodwill 63,455 36 - - 63,491
ElectronicsBusinessCompany
AutomotiveProductsCompany
Real EstateBusinessCompany
Total
ElectronicsBusinessCompany
AutomotiveProductsCompany
Real EstateBusinessCompany
Total
ElectronicsBusinessCompany
AutomotiveProductsCompany
Real EstateBusinessCompany
Total
22. Related Parties (Related party transactions) The tables below summarize the related party transactions with unconsolidated subsidiaries and affiliated companies accounted forusing the equity method for the year ended March 31:2016 (Millions of yen)
Relationship Name ofcompany Location Paid-in-Capital Description of
businessShare of voting
rights (%)Relations withrelated parties
Description oftransaction
Amount oftransactions
(Note 4)
Financialstatementline-item
The fiscal year-end balance
(Note 4)Affiliatedcompany
VISCASCorporation
Shinagawa,Tokyo
13,600
Directly owned(50%)
Supply of rawmaterials withcharge (Note1)
7,633
Other currentassets
3,735
Guarantees(Note 2)
7,667 - -
2017 (Millions of yen)
Relationship Name ofcompany Location Paid-in-Capital Description of
businessShare of voting
rights (%)Relations withrelated parties
Description oftransaction
Amount oftransactions
(Note 4)
Financialstatementline-item
The fiscal year-end balance
(Note 4)Affiliatedcompany
VISCASCorporation
Shinagawa,Tokyo
10
Directly owned(50%)
Supply of rawmaterials withcharge (Note1)
3,273
Other currentassets
29
Guarantees(Note 2)
130 - -Loan(Note 3) -
Long-termloansreceivable
8,071
2017 (Thousands of U.S. dollars)
Relationship Name ofcompany Location Paid-in-Capital Description of
businessShare of voting
rights (%)Relations withrelated parties
Description oftransaction
Amount oftransactions
(Note 4)
Financialstatementline-item
The fiscal year-end balance
(Note 4)Affiliatedcompany
VISCASCorporation
Shinagawa,Tokyo
89
Directly owned(50%)
Supply of rawmaterials withcharge (Note1)
29,174
Other currentassets
258
Guarantees(Note 2)
1,159 - -Loan(Note 3) -
Long-termloansreceivable
71,940
Terms and conditions of the above transactions and the policy to determine the terms and conditions:(Note) 1. For supply of raw materials with charge, terms and conditions were determined with consideration of market prices.
2. In the previous fiscal year, the Company provided guarantees for borrowings from banks and for fulfillment of contracts.In the current fiscal year, the Company provided guarantees for fulfillment of contracts.
3. The Group utilizes a cash management system to control treasury among the group companies. Only the balance at the end of the fiscal year is disclosed as it is difficult to calculate the total amount for each transactionusing the cash management system. Note that interest rates are determined based on the market interest rates.
4. Consumption taxes are not included in the amount of transactions but are included in the fiscal year-end balance.
Power &Telecommuni‐cation SystemsCompany
Supply of rawmaterials fromthe Company,Guarantees, Financialassistance
Supply of rawmaterials fromthe Company,Guarantees,Concurrentservice asdirector
Power &Telecommuni‐cation SystemsCompany
Power &Telecommuni‐cation SystemsCompany
Supply of rawmaterials fromthe Company,Guarantees, Financialassistance

70 71Fujikura Annual Report 2017 Fujikura Annual Report 2017
(Condensed financial information of significant affiliates) The condensed financial information of VISCAS Corporation for the year ended March 31, 2017 is as follows:
Thousands of U.S. dollars
2016 2017 2017 Total current assets ¥23,243 ¥14,774 $131,687 Total non-current assets 6,262 144 1,284
Total current liabilities 29,735 24,169 215,429 Total non-current liabilities 2,780 20 178
Total net assets (3,009) (9,271) (82,637)
Net Sales 45,742 22,682 202,175 Loss before income taxes (19,722) (6,311) (56,253) Loss (¥19,731) (¥6,366) ($56,743)
23. Per Share InformationYen U.S. dollars
Per share: 2016 2017 2017Net income per share- basic ¥36.98 ¥44.61 $0.398Net income per share- fully diluted (*1) - - -Cash dividends 8.00 10.00 0.089Net assets per share ¥662.93 ¥710.68 $6.335
(*1) As the Company does not have any instruments that have dilutive effect, the Company has not disclosed net income (loss) per share-fully diluted data.
Thousands of Millions of yen U.S. dollars
Basis for computation of per share data: 2016 2017 2017
Profit attributable to owners of parent ¥11,317 ¥12,900 $114,984Profit attributable to common shareholders ¥11,317 ¥12,900 $114,984
Thousands of shares2016 2017
Number of weighted average shares 306,006 289,205
24. Subsequent EventsThere are no significant subsequent events.
Millions of yen

72 73Fujikura Annual Report 2017 Fujikura Annual Report 2017

75Fujikura Annual Report 201774 Fujikura Annual Report 2017
EMEA1 Fujikura Europe Ltd.2 Fujikura Automotive Europe GmbH3 Fujikura Automotive Europe, S.A.U.4 Fujikura Automotive Ukraine Lviv, LLC5 Fujikura Automotive Russia Cheboksary LLC6 Fujikura Automotive Romania S.R.L.7 Fujikura Automotive MLD S.R.L.8 Fujikura Automotive Morocco Tangier, S.A. Fujikura Automotive Morocco Kenitra, S.A.
Thailand9 Fujikura Electronics (Thailand) Ltd. DDK (Thailand) Ltd. Fujikura Automotive (Thailand) Ltd.
Southeast Asia0 Fujikura Federal Cables Sdn. Bhd. Fujikura Asia (Malaysia) Sdn. Bhd.q Fujikura Asia Ltd.w Fujikura Fiber Optics Vietnam Ltd. DDK VIETNAM Ltd. Fujikura Electronics Vietnam Ltd.e Fujikura Automotive Vietnam Ltd.r PT Fujikura Indonesia
Chinat Fujikura Zhuhai Co., Ltd.y Fujikura Automotive Guangzhou Co., Ltd. u Fujikura Hong Kong Ltd.
i Fujikura Fiber-Home Opto-Electronics Material Technology Co., Ltd.
o Fujikura (China) Co., Ltd. Fujikura Electronics Shanghai Ltd. Shanghai Fujikura Grandway Co., Ltd. DDK (Shanghai) Co., Ltd. Fujikura Hengtong Aerial Cable System Ltd.
Koreap Fujikura Korea Automotive Ltd.
Indiaa Fujikura Automotive India Private Ltd.
Americass Fujikura America, Inc.d Fujikura Automotive Mexico S. de R.L. de C.V.f Fujikura Automotive America LLC.g America Fujikura Ltd. h Fujikura Automotive Paraguay S.A.j Fujikura Cabos Para Energia e Telecomunicacoes Ltda
Japan㉘ DDK Ltd. Fujikura Automotive Asia Ltd.㉙ Nishi Nippon Electric Wire & Cable Co., Ltd.
h
12
6
5
4
s
da
g
j
f
p ㉘㉙
oiy ut
r
ew
q0
9
3
8
7
Global Network
Investor Information
As of March 31, 2017
Company NameEquity Ownership
Percentage, IncludingIndirect Ownership
Paid-in Capital(Millions) Major Line of Businesses
Fujikura Dia Cable Ltd. 70.0% ¥5,400 Electric wires and cables
Nishi Nippon Electric Wire & Cable Co., Ltd.
60.7% ¥960 Electric wires and cables and optical cables
Yonezawa Electric Wire Co., Ltd. 94.8% ¥400 Electric wires and cables
America Fujikura Ltd. 100.0% US$202OPGW, optical cables, optical fusion splicers, optical connection parts and telecommunications related work
DDK Ltd. 99.8% ¥100 Connectors
Tohoku Fujikura Ltd. 100.0% ¥1,000 FPCs and sensors
Fujikura Electronics (Thailand) Ltd. 100.0% THB11,552 FPCs and electronic components
Fujikura Electronics Shanghai Ltd. 100.0% RMB97 FPCs
Fujikura Automotive Asia Ltd. 100.0% ¥1,772 Wire harnesses for automobiles
Fujikura Automotive Europe S.A.U. 100.0% EUR10 Wire harnesses for automobiles
■ Major Shareholders As of March 31, 2017
Number ofShares Held(Thousands)
Ratio ofShareholding
(%)
The Master Trust Bank of Japan, Ltd. (Trust Account) 23,891 8.37
Japan Trustee Services Bank, Ltd. (Trust Account) 17,931 6.28
Mitsui Life Insurance Company Limited 10,192 3.57
Sumitomo Mitsui Banking Corporation 8,456 2.96
The Shizuoka Bank, Ltd. 7,713 2.70
Japan Trustee Services Bank, Ltd. (Sumitomo Mitsui Trust Bank, Limited Retirement Benefit Trust Account)
6,777 2.37
Dowa Metals & Mining Co., Ltd. 6,563 2.30
Fujikura Employees Shareholding Association 5,246 1.84
THE BANK OF NEW YORK MELLON 140044 5,202 1.83
Japan Trustee Services Bank, Ltd. (Trust Account 5) 5,061 1.77
Notes: 1. Although the Company owns 10,505,062 shares of treasury stock, this is excluded from the above table.2. The percentage values presented in “Percentage of total shares issued” are calculated excluding treasury stock.
■ Head Office 1-5-1, Kiba, Koto-ku, Tokyo 135-8512, Japan URL: www.fujikura.co.jp/eng
■ Year of Foundation 1885
■ Date of Incorporation March 18, 1910
■ Common Stock Authorized: 1,190,000,000 sharesIssued: 295,863,421 shares Capital: ¥53,075 million
■ Number of Shareholders 20,558
■ Independent Auditors PricewaterhouseCoopers Aarata
■ Further Information For further information on this Annual Report,please contact the Investor Relations Group at the Head Office.
■ Contact Investor Relations Group Tel: +81-3-5606-1112 Fax: +81-3-5606-1501 E-mail: [email protected]
Main Consolidated Subsidiaries