fugitive emissions detection using toxic vapor analyzers
TRANSCRIPT

Fugitive Emissions Detection Using Toxic Vapor Analyzers
Advances in Air Pollution Control Technology Workshop
Bob FrancisThermo Fisher Scientific

2
Presentation Overview
• Clean Air Act - Driver• Background• LDAR
• TVA 1000B -Current Technology• Performance and Specifications• O&M• Current Markets
• Shale Gas - Emerging Application
3
Clean Air Act and LDAR

4
Clean Air Act - History
• 1970 – CAA Established to regulate air emissions• Gives Environmental Protection Agency authority to
establish National Ambient Air Quality Standards (NAAQS) to protect public and environment.
• 1974 – Original goal to have NAAQS established in each state with appropriate implementation plans
• 1977 - CAA amendment delayed deadline for state NAAQS to 1990
• 1983 – Method 21 promulgated (limited)
• 1990 - CAA amended to address new requirements such as acid rain, ozone depletion and air toxins.

5
Organization of the Clean Air Act
Seven Titles:I. National Ambient Air Quality Standards Program
and New Source Performance StandardsII. Mobile Sources ProgramIII. National Emission Standards for Hazardous Air
PollutantsIV. Acid Rain ProgramV. Operating Permit ProgramVI. Stratospheric Ozone Protection ProgramVII. Enforcement Provisions
Title I Title II Title III Title IV Title V Title IV Title VII
CAA

6
Clean Air Act – Key Elements
• Title I• New, existing & modified source requirements• List of Major Source Categories• Standards of Performance for Specific Sources
• Title III• List of HAPs and Source Categories (189 HAPs & 174 source
categories plus provisions for update)
• Title V• Operating Permit Program
• Federal, State and Local monitoring requirements

7
Leak Detection And Repair (LDAR) Definitions
• Method 21: Defined in 40 CFR Part 60. This describes the protocol for monitoring fugitive emissions. Facilities impacted includes not only facilities such as chemical and petro-chemical plants, but also, pharmaceutical, pulp and paper, semi-conductor and oil seed facilities. These areas are addressed by individual sub-parts with the regulations and new sub-parts continue to be added
This method defines the monitoring requirements with respect to technology, response time, response factors and other critical parameters.

8
LDAR Definitions
• LDAR: Leak Detection & Repair program. Facilities must develop a program to control and record the results of their monitoring. These records are audited by EPA and local regulatory agencies for compliance to operating permit. Fewer leaks mean lower emissions, reduced monitoring and process savings.
• The permit defines what components (valves, flanges, compressors, etc.) are be monitored and leak definitions (level). Basically any point at which two pipes are joined needs to be monitored. Some facilities have more than 2.5 million points to be monitored.

9
LDAR Definitions
• LDAR Software: Software serves two purpose in a LDAR program of a facility. In addition to collecting the monitoring results, they also provide compliance reports, quality control data, and total emission predictions. There are a few major players in addition to many smaller independent programs developed by contractors.
• Software has also evolved over the past 4-6 years from data logging and transferring to field collection and reporting

10
LDAR Definitions
• Consent Decree: If a facility is found to be in violation of the operating permit, they are fined and agree to perform additional monitoring (increased frequency and number of monitoring points) to show “due diligence” and possible other constraints.
• As facilities become more efficient (less leaks), they can reduce the frequency of monitoring. If a consent decree is issued, all monitoring returns to original schedule

11
LDAR Definitions
• Contractors: Supply manpower, analyzers, knowledge and record keeping to those facilities required to comply with Method 21. Some contractors have worked with other manufacturers to develop alternative means of capturing the monitoring results. (software & hardware). These services often differentiate themselves in the industry based on data conversion and data management offerings.
• Very interesting dynamic in area of physically performing the monitoring – frequently changes from outsourcing to contractors and performance by internal personnel.
• Many facilities will use contractors due to their expertise and save money, however the results of the monitoring and reports remain the responsibility of the company (not the contractor).

12
LDAR Definitions
• Equipment: Nearly all facilities use FID analyzers for monitoring due to stability and response factors. Data collection may be mandated by permit or consent decree (electronic data capture is required on consent decrees – either on the instrument itself or through a device with a direct, immediate connection).
• Equipment must meet requirements defined in Method 21 (response time of less than 30 seconds, intrinsically safe, response factors less than 10, ¼ inch (6.4 mm) probe opening and quarterly precision tests).
• Daily calibrations required as close to, but not exceeding the leak definition. Some states require second calibration at midday.
• Quarterly precision tests confirm proper performance

13
CENTURY® TVA1000B

14
• Basic Theory:
Sample is introduced into an ionization chamber and burned in a hydrogen flame. This process separates free ions, which in turn are attracted to a collecting electrode. The collection of the ions result in an increase current which is proportional to the concentration of the compound (compared to a known calibration standard). The by- products of the process are H2O and CO2.
Flame Ionization Detection (FID)

15
Diagram of FID

16
• Advantages
• Wide dynamic and linear range• Highly sensitive to hydrocarbon vapors• Very stable and repeatable• Unaffected by ambient levels of CO, CO2 and water vapor
• Disadvantages
• Requires hydrogen supply• Requires oxygen > 16% to operate• Total hydrocarbon detector - not specific• Reduced flow impact readings
Flame Ionization Detection
17
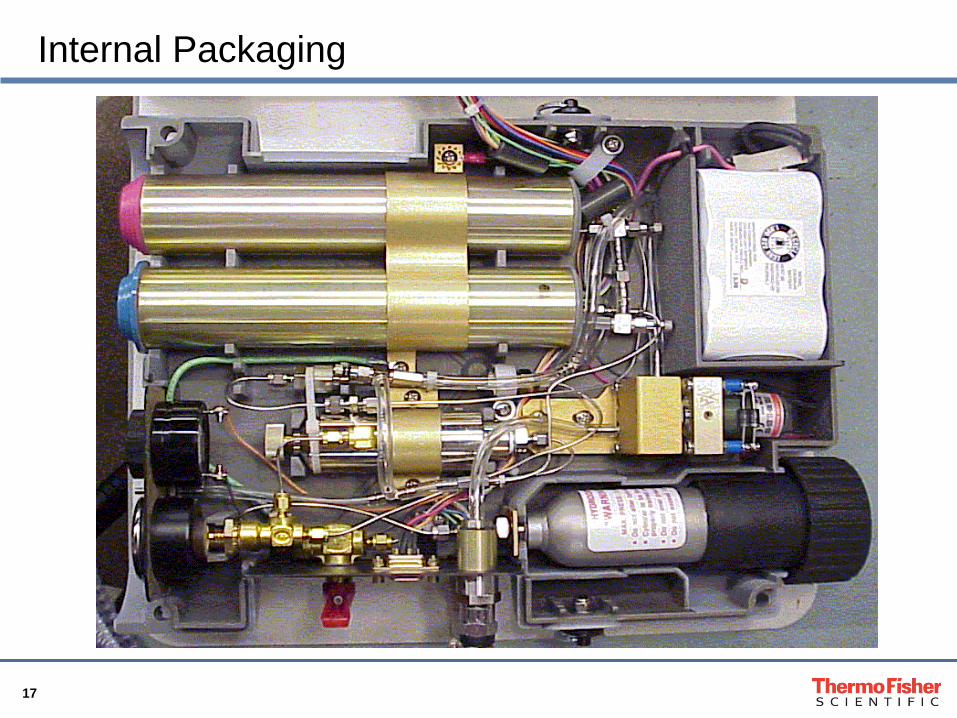
Internal Packaging
18
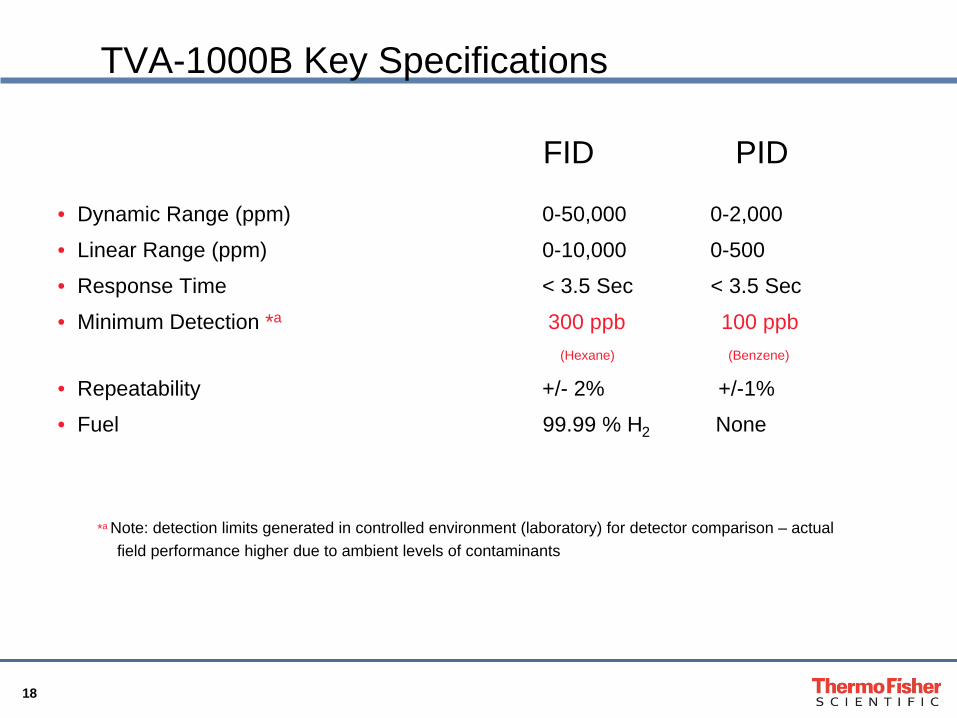
TVA-1000B Key Specifications
• Dynamic Range (ppm) 0-50,000 0-2,000
• Linear Range (ppm) 0-10,000 0-500
• Response Time < 3.5 Sec < 3.5 Sec
• Minimum Detection *a 300 ppb 100 ppb (Hexane) (Benzene)
• Repeatability +/- 2% +/-1%
• Fuel 99.99 % H2 None
*a Note: detection limits generated in controlled environment (laboratory) for detector comparison – actual field performance higher due to ambient levels of contaminants
FID PID

19
Operation and Maintenance
• Operation
• Intuitive menu driven • Fill hydrogen cylinder and ignite flame• Most applications begin with daily zero/span calibration• Determine logging parameters to be used• Quick start guide included with operator manual
• Maintenance
• Visual inspection• Check filters and sample line daily• Inspect and clean detector capsule as required• Maintenance checklist also included with operator manual
20
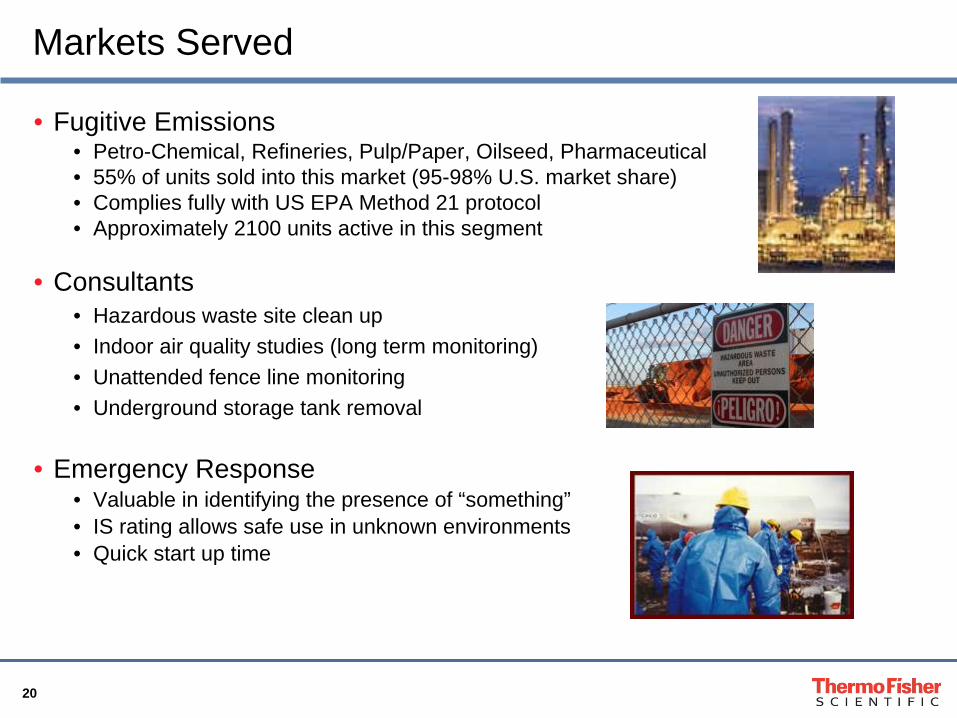
Markets Served
• Fugitive Emissions• Petro-Chemical, Refineries, Pulp/Paper, Oilseed, Pharmaceutical • 55% of units sold into this market (95-98% U.S. market share)• Complies fully with US EPA Method 21 protocol• Approximately 2100 units active in this segment
• Consultants• Hazardous waste site clean up• Indoor air quality studies (long term monitoring)• Unattended fence line monitoring• Underground storage tank removal
• Emergency Response• Valuable in identifying the presence of “something”• IS rating allows safe use in unknown environments• Quick start up time

21
Shale Gas Monitoring Air Monitoring
22
Shale Gas Monitoring - Air Monitoring
• May be more questions than answers at this point in time
• Over 25 shale deposit areas within United States• Estimated 15,000 total wells
• Provides growing, clean source for power generation• Currently provides approximately 15% total gas production (estimate to
potentially triple in 25 years)• Low carbon emissions
• Fielding inquiries from Marcellus Shale (Northeastern US) and Barnett Shale (Texas) for monitoring equipment.
• Contractors have purchased for well site monitoring at Marcellus Shale• TVA units used in initial studies in Dallas area

23
Shale Gas Monitoring - Air Monitoring
• No firm regulations to date• Texas Commission of Environmental Quality (TCEQ) is looking to establish
standards• Pennsylvania DEP (Bureau of Air Quality) has also performed initial
investigation to determine compounds present and risks• In absence of regulations, OSHA and NIOSH exposure levels often used.
• Compounds observing in this type of mining quite varied• Reports of over 50 different compounds seen at well head• What to measure (and not measure)
• Concerns over level of various compounds at different concentrations• Barnett looking at benzene at 0.25 PPB• Concerns over potentially explosive levels (methane above 5%)

24
Shale Gas Monitoring - Air Monitoring
• How to measure?• Summa canisters
• Collects complete sample, easy, relatively expensive, not “real time”
• Portable hydrocarbon analyzer (TVA)• Relatively inexpensive, simple to operate, fast response• Not s expensive post collection analysis and cleaning, not “real time” specific analysis in
complex mixture (survey tool), no sub-PPM measurements
• Infrared camera• Very good survey tool (fly-overs), especially high concentrations• Expensive, not specific, relatively poor detection limits (5,000 PPM)
• Long path FTIR• Very good detection limits, specific gas capability, quite expensive
• Field GC• Relatively fast analysis, specific analysis, moderately priced, high maintenance, requires
support gases

25
Shale Gas Monitoring – Air Monitoring
Next steps?
We will continue to work to identify potential benefits of TVA as regulations and methods are developed.
Thank You! Questions?