fuels in the baltic sea pm after seca 2016:12 - trafa.se · pdf file8 abstract after the...
TRANSCRIPT
Fuels in the Baltic Seaafter SECA
PM2016:12

Fuels in the Baltic Seaafter SECA
PM2016:12

TrafikanalysAdress: Torsgatan 30113 21 StockholmTelefon: 010 414 42 00Fax: 010 414 42 10E-post: [email protected]: www.trafa.seAnsvarig utgivare: Brita SaxtonPubliceringsdatum: 2016-08-25
3
Förord
Trafikanalys följer utvecklingen inom sjöfarten efter att kravet på svavelhalten i marint bränsle
inom SECA skärptes första januari 2015. Nya bränslen har börjat användas i fartygen för att
uppfylla de nya kraven om högst 0,1 viktprocent svavel i bränslet. För att kunna ge möjliga
förklaringar till förändringar i sjöfartens utsläpp behöver man känna till vilka bränslen som
används, vad de innehåller och vilka utsläpp dessa genererar. Livscykelanalyser inkluderar
utsläpp från hela produktionskedjan till slutanvändning. Denna rapport presenterar uppskatt-
ningar av bränsleanvändning och fördelning mellan bränsletyper före och efter införandet av
svaveldirektivet. Livscykelanalyser visar att utsläppen från marint bränsle förändras med
avseende på bland annat koldioxid och partiklar beroende på vilken bränsletyp som används.
Trots att direktivet leder till lägre svavelutsläpp kan således andra utsläpp öka.
Datainsamling och analys har utförts av professor Karin Andersson och Dr Selma Brynolf vid
institutionen för Sjöfart och marin teknik på Chalmers tekniska högskola. Rapporten har
skrivits av Karin Andersson och Selma Brynolf i samarbete med Trafikanalys projektledare
Märit Izzo. I projektgruppen har även Krister Sandberg ingått. Vi vill även tacka
Transportstyrelsen, Naturvårdsverket och Energimyndigheten för hjälp med datainsamling,
faktagranskning och kommentarer.
Östersund i augusti 2016
Brita Saxton
Generaldirektör

4
5
Table of Contents
Förord ............................................................................................................................................... 3
Sammanfattning .............................................................................................................................. 7
Abstract ............................................................................................................................................ 8
1 Introduction ............................................................................................................................. 9
1.1 Background ............................................................................................................. 9
1.2 Goal of report ........................................................................................................ 10
1.3 Method .................................................................................................................. 10
2 Fuels used in the Baltic Sea 2015 ....................................................................................... 13
2.1 Description of the fuels used ................................................................................. 13
2.2 Production of petroleum fuels ............................................................................... 16
2.3 Data collection....................................................................................................... 16
2.4 Scenarios for fuel use in SECA ............................................................................. 19
3 Environmental indicators for marine fuels ......................................................................... 23
3.1 Data used in the environmental assessment ........................................................ 23
3.2 Environmental indicators ....................................................................................... 26
3.3 Results for different ship categories ...................................................................... 28
3.4 Estimates of the effect of SECA regulation on life cycle emissions ...................... 30
4 Discussion ............................................................................................................................. 33
5 Conclusions .......................................................................................................................... 35
References ..................................................................................................................................... 37
Appendix ........................................................................................................................................ 41

6
7
Sammanfattning
Efter att svavelreglerna för marina bränslen trädde i kraft 1 januari 2015 i utsläppskontroll-
området i Nordsjön och Östersjön (SECA) har det skett en förändring av fartygens bränsle-
användning. Den tillåtna svavelhalten ändrades från 1 viktsprocent till 0,1 procent. Det 1
procentiga bränslet som finns på marknaden är huvudsakligen tjockolja, ”heavy fuel oil” (HFO)
som är en restprodukt från raffinaderier. Det 0,1 procentiga bränslet är till stor del destillat som
”marine gas oil” (MGO) eller ”marine diesel oil” (MDO). Efter att regelverket trädde i kraft, har
så kallade ”hybridbränslen” (även kallat SECA-bränslen) eller ultra-low sulphur fuel oils
(ULSFO) börjat användas i allt högre grad. Det finns även rederier som väljer att konvertera
fartygen till att drivas på LNG (flytande naturgas) eller att fortsätta använda HFO med
avgasrening, så kallad skrubber.
För att utvärdera effekten av svavelreglerna, även med avseende på förändringar i bränsle-
produktion och utsläpp, måste man känna till vilka bränslen som används och vilka emissioner
dessa ger upphov till i ett livscykelperspektiv.
Rapporten innehåller två delar där den första syftar till att utreda vilka marina bränslen som
används i Östersjön efter 1 januari 2015 i jämförelse med 2014. I den andra delen utvärderas
emissionerna relaterade till sjöfartsbränslen i ett livscykelperspektiv när förhållandena
förändrats. De emissioner som inkluderas är koldioxid (CO2), partiklar (PM),
svaveloxider(SOx), metan (CH4) och kväveoxider (NOx).
Vid mätningar av svaveloxid i omgivningsluft är det tydligt att dessa har minskat drastiskt efter
att regelverket infördes. För att utvärdera påverkan på alla emissioner som uppstår när man
övergår till hybridbränsle krävs fler emissionsmätningar och data från raffinaderier. Påverkan
på raffinaderiet är inte extremt stor och emissionerna per megajoule bränsle är påtagligt högre
från ”tank till propeller” än från ”källa till tank”. Vilken blandning av bränslen som används i
SECA påverkar emissionerna på olika sätt. I denna studie dras följande slutsatser om
skillnader mellan 2014 och 2015:
Även om det inte är möjligt att göra en strikt kvantifiering av fördelningen mellan
MGO, hybridbränslen, LNG och HFO med skrubber i dag, är det tydligt att för-
ändringarna i totala koldioxidutsläpp från en ny bränslefördelning är relativt små och
osäkerheten i tillgängliga data är för stor för att man ska kunna dra långtgående
slutsatser.
De totala koldioxidutsläppen kommer att vara mycket större än vad som kan accep-
teras för att uppfylla det Europeiska målet om att minska koldioxidutsläppen från
sjöfarten med 40 procent till 2050 jämfört med 2005 nivån. Förändrade utsläpp från
raffinaderier ändrar inte den bilden i någon påtaglig grad.
Utsläppen av svaveldioxid har minskat kraftigt.
Effekten av att använda hybridbränsle i stället för MGO verkar motverka den för-
väntade marginella minskningen i partikelemissioner genom att HFO används i
mindre grad. Mycket mindre partikelutsläpp fås med LNG eller metanol.
NOx emissioner påverkas inte i signifikant grad av att byta från HFO till MGO eller
hybridbränsle. De enda bränslen i studien som påverkar detta är LNG och metanol.
8
Abstract
After the sulphur regulation for marine fuels was entered into force 1st of January 2015 in the
North Sea and the Baltic Sea sulphur emission control area, SECA, a change in the kinds of
fuels used has occurred. The allowed sulphur content in marine fuels was decreased from 1
per cent to 0.1 per cent by mass. The 1 per cent sulphur fuel available on the market is mainly
heavy fuel oils, HFO, which is a residue fraction from refineries. The 0.1 per cent fuels
available are primarily distillate fuels like marine gas oil, MGO, or marine diesel oil, MDO.
However, after the introduction, a number of “hybrid fuels” (or ECA fuels, or ultra-low sulphur
fuel oils, ULSFO), have been introduced to the market. Also, in order to comply with the
stricter regulation it is also possible to convert the ship to run on LNG (liquefied natural gas)
fuel or to use HFO with abatement equipment, “scrubber”.
Besides the sulphur emissions, other environmental effects of the regulations need to be
evaluated. Changes in fuel production, the types of fuels used and the emissions in a “well-to-
propeller” perspective related to the fuels have to be assessed.
The first part of the report aims at investigating what marine fuels are used in the Baltic Sea
after January 1st 2015. The second part evaluates the emissions from marine fuels taking a life
cycle perspective. The considered emissions are carbon dioxide (CO2), particulate matter
(PM), sulphur oxides (SOx), methane (CH4), and nitrogen oxides (NOx).
It is clear from measurements in ambient air that the sulphur oxide emissions have decreased
significantly since the introduction of the stricter regulation. To assess the other emissions
more measurements of exhaust emissions and refinery data are necessary. The impact on
emissions from the refinery processes is small. However, the emissions per MJ fuel used are
significantly higher from the tank-to-propeller analysis than from the well-to-tank analysis. The
mix of fuels used in the SECA area is affecting the emissions in various ways.
Although a strict quantification of the distribution between MGO, hybrid fuels, LNG
and HFO with scrubber is not possible today, it is clear that the changes in total CO2
emissions caused by the possible fuel mix is quite small, and the uncertainties in data
are too large to draw far reaching conclusions from.
The total emissions of CO2 from marine fuels will continue to be high and the
changes in emissions from refineries will not change this picture to a significant
degree.
The effect of using hybrid fuel instead of MGO seems to counteract the expected
minor decrease in particle emissions due to less HFO used. Less particle emissions
is obtained by use of LNG or methanol.
The total emissions of SOx is significantly reduced.
The NOx emissions are not affected significantly change from HFO to MGO or hybrid
fuel. The only fuels that affects this are LNG and methanol.
9
1 Introduction
The increased attention to air emissions from shipping in recent years has resulted in stricter
regulations. The International Maritime Organization (IMO), the United Nations agency
responsible for the safety and security of shipping and the prevention of marine pollution by
ships, has adopted regulations regarding the sulphur content in marine fuels and the
emissions of NOX (IMO, 2013). It is also expected that the PM emissions will be reduced
indirectly by these regulations. In addition, the European Commission’s white paper “Road-
map to a Single European Transport Area”, dated 2011, states that CO2 emissions from
maritime transport in the European Union should be reduced by 40 per cent by 2050
compared to 2005 levels (European Commission, 2011).
The global limit on the sulphur content of marine fuels will be reduced significantly to 0.5 per
cent sulphur by 2020 or, at the latest, 2025,1 versus the present cap of 3.5 per cent. This
regulation is stricter in certain emission control areas (ECAs). Beginning in 2015, emissions of
SO2 will be limited to the equivalent of 0.1 wt. per cent sulphur in combusted fuel within the
sulphur emission control areas (SECAs) in the Baltic Sea, the North Sea, the English Channel,
the United States Caribbean Sea and along the coasts of the United States and Canada.
1.1 Background
After the sulphur regulations for marine fuels entering into force 1st of January 2015 in the
North Sea and the Baltic Sea sulphur emission control area, SECA, a change in the kinds of
fuels used has occurred. The allowed sulphur contents in marine fuels was at that time
decreased from 1 per cent to 0.1 per cent by mass. The 1 per cent sulphur fuels on the market
are mainly heavy fuel oils, HFO, a residue fraction from refineries. The 0.1 per cent fuels
available are to a large degree distillate fuels like marine gas oil, MGO, or marine diesel oil,
MDO. These are lighter and less viscous fractions, and usually with lower contents of other
contaminants.
The regulation can also be fulfilled by use of an almost sulphur free gaseous fuel, liquid
natural gas, LNG. LNG can be used in dual fuel engines which also can be run on HFO, MDO
or MGO. Small amounts of diesel oil is used in the dual fuel engines to improve ignition. This
solution sets demands on a different solution for fuel tanks, since the fuel is liquid at very low
temperature, - 162oC. A technical solution is to remove the sulphur from the exhausts by
“scrubbers”, a technology that is well proven from land use (Brynolf et al., 2014b).
The change of sulphur contents in the fuel will, as is the intention with the regulation, decrease
the emissions of sulphur oxides. It is also envisaged that a “cleaner” fuel will result in less
1 A review of the availability of fuel oil is to be completed in 2018. If the parties decide that it is impossible for ships to comply, then the standard will postponed until 2025 IMO 2013. MARPOL ANNEX VI AND NTC 2008 WITH GUIDELINES FOR IMPLEMENTATION, London, CPI Group (UK) Ltd.The sulphur content in marine fuels in the European Union is reduced to 0.5 per cent by 2020 EUROPEAN COMMISSION 2012. Directive 2012/33/EU of the European Parliament and of the Council of 21 November 2012 amending Council Directive 1999/32/EC as regards the sulphur content of marine fuels. Journal of the European Union.
10
particle emissions, an emission that is not regulated today. When the regulation was intro-
duced, it was expected that it would be a large change in fuel use, from HFO to distillates or
scrubber installations and also some engine retrofits to LNG. However, after the introduction,
a number of “hybrid fuels” (or ECA fuels, or ultra-low sulphur fuel oils, ULSFO), have also
entered the market. In this report we will use the term hybrid fuels. These hybrid fuels fulfil the
sulphur requirements but are more similar to residual fuels than distillates in terms of viscosity
and lubricity. They are also less expensive than distillates. However, hybrid fuels do not
belong to a well-defined fuel category, but a trade name for a category of fuel that suits large
marine diesel engines and fulfil the sulphur regulation.
In order to assess the environmental effects of the sulphur regulation, also with respect to
changes in fuel production in refineries, the fuels used and the emissions related to the fuels
have to be known. Avis and Birch (2009) predicted the impacts on the EU refining industry and
markets of the regulation and found that carbon dioxide emissions likely will increase.
In 2010, the first decrease of level of fuel sulphur in the SECA (from 1.5 to 1 per cent) was
entered into force. Model calculations of the effects on emissions from ships in the Baltic Sea
and North Sea found that particle emissions decreased (Jonson et al., 2015). At the same
time, however, other positive environmental effects seem to have been counteracted by an
increase in transport at that time.
In contrast, (so far) the result of the 2015 regulation in terms of sulphur concentration in the
ambient air seems very good. Atmospheric surveillance in Sweden and Denmark show lower
concentrations in 2015 than in previous years (Pihl-Karlsson, 2015, Einemo, 2016). The
reductions are in the order of 50 per cent or more. The effect on other emissions is not
possible to assess from the present monitoring. The expectation that other emissions like
particles would decrease when using low sulphur fuel cannot be validated since there are no
emission measurements. The predicted effect on emissions and energy use from refineries
when producing larger quantities of low sulphur fuel were estimated in early consequence
analyses (Dastillung, 2009, Calzado Catalá et al., 2013), but the outcome after the regulation
is not evaluated.
1.2 Goal of report
The report comprises two parts. The first part aims to assess the marine fuels used in the
Baltic Sea after January 1st 2015 for comparison to 2014. The second part evaluate the
emissions from shipping under the changed conditions taking a life cycle perspective on the
fuels.
The first part focuses on the use of marine fuels and the production of marine hybrid fuels.
The second is an assessment of emissions related to fuels “from well to propeller” before and
after the change. The considered emissions are carbon dioxide (CO2), particulate matter (PM),
sulphur oxides (SOx), methane (CH4), and nitrogen oxides (NOx).
1.3 Method
Information on usage of marine fuel, marine fuel sales and fuel quality in the SECA is poor or
non-existent. In this study, literature data estimating total fuel consumption by using AIS data
11
have been used as a source. In addition, various sources of information have been used to
provide a basis for estimating the distribution between fuel qualities.
The Swedish Transport Agency is the surveying authority for controlling the sulphur content in
bunker fuel. Randomized fuel samplings from ships calling Swedish ports are analysed by an
accredited laboratory to monitor the fulfilment of the regulation. During 2015 around 400
samples were taken. These results have been available for the study.
The sales of bunker fuel in Sweden are reported to the Swedish Energy Agency (Energi-
myndigheten) and to the Swedish Chemicals Agency (Kemikalieinspektionen) for use in
energy statistics. The Swedish Energy Agency have until now been collecting data in terms of
fuel oil (eldningsolja, Eo1 and Eo 2-6) which does not provide details on fuel quality. The
sulphur contents is not reported here, which may be due to the fact that this is only an issue
for bunker fuel for shipping.
Through the Swedish Shipowner’s Association (Svensk Sjöfart) a questionnaire on fuel
qualities and quantities used by the members in 2015 was sent out. This reaches only
Swedish ship-owners with ships in routes within SECA, but it provides another set of data to
combine with the bunker fuel samples.
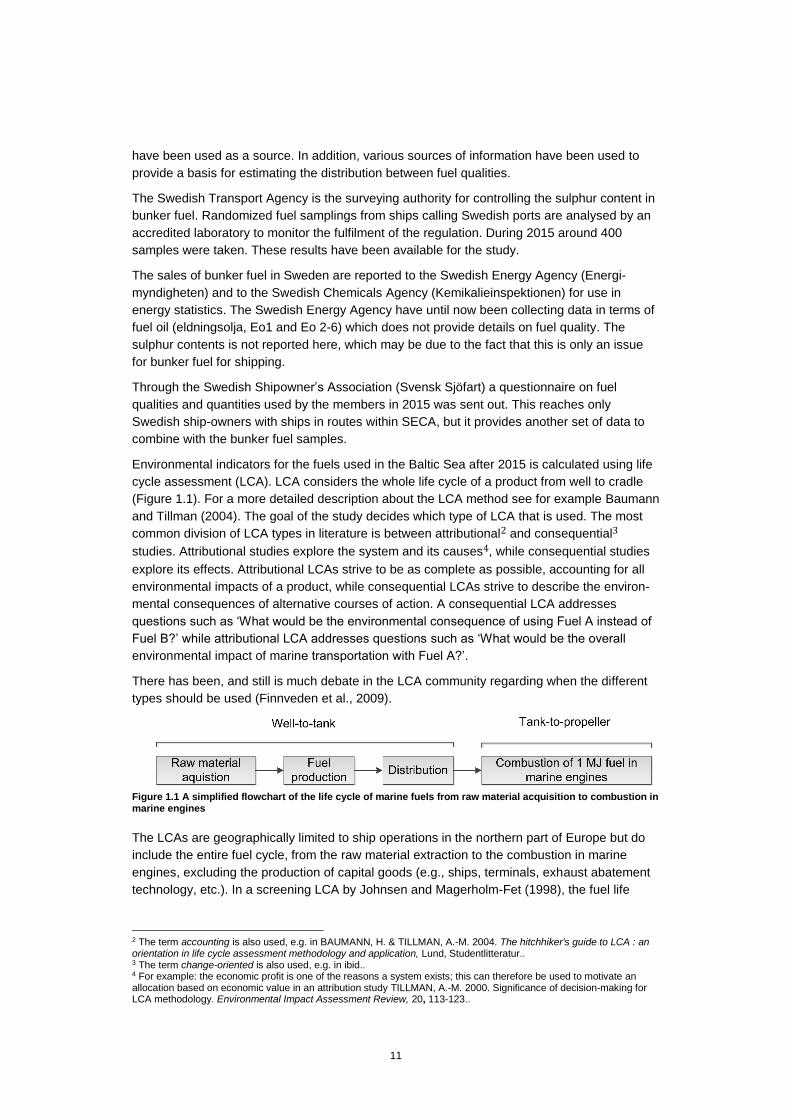
Environmental indicators for the fuels used in the Baltic Sea after 2015 is calculated using life
cycle assessment (LCA). LCA considers the whole life cycle of a product from well to cradle
(Figure 1.1). For a more detailed description about the LCA method see for example Baumann
and Tillman (2004). The goal of the study decides which type of LCA that is used. The most
common division of LCA types in literature is between attributional2 and consequential3
studies. Attributional studies explore the system and its causes4, while consequential studies
explore its effects. Attributional LCAs strive to be as complete as possible, accounting for all
environmental impacts of a product, while consequential LCAs strive to describe the environ-
mental consequences of alternative courses of action. A consequential LCA addresses
questions such as ‘What would be the environmental consequence of using Fuel A instead of
Fuel B?’ while attributional LCA addresses questions such as ‘What would be the overall
environmental impact of marine transportation with Fuel A?’.
There has been, and still is much debate in the LCA community regarding when the different
types should be used (Finnveden et al., 2009).
Figure 1.1 A simplified flowchart of the life cycle of marine fuels from raw material acquisition to combustion in marine engines
The LCAs are geographically limited to ship operations in the northern part of Europe but do
include the entire fuel cycle, from the raw material extraction to the combustion in marine
engines, excluding the production of capital goods (e.g., ships, terminals, exhaust abatement
technology, etc.). In a screening LCA by Johnsen and Magerholm-Fet (1998), the fuel life
2 The term accounting is also used, e.g. in BAUMANN, H. & TILLMAN, A.-M. 2004. The hitchhiker's guide to LCA : an orientation in life cycle assessment methodology and application, Lund, Studentlitteratur.. 3 The term change-oriented is also used, e.g. in ibid.. 4 For example: the economic profit is one of the reasons a system exists; this can therefore be used to motivate an allocation based on economic value in an attribution study TILLMAN, A.-M. 2000. Significance of decision-making for LCA methodology. Environmental Impact Assessment Review, 20, 113-123..
12
cycle was shown to be responsible for the largest proportion of the environmental impact
associated with a ship’s life cycle.
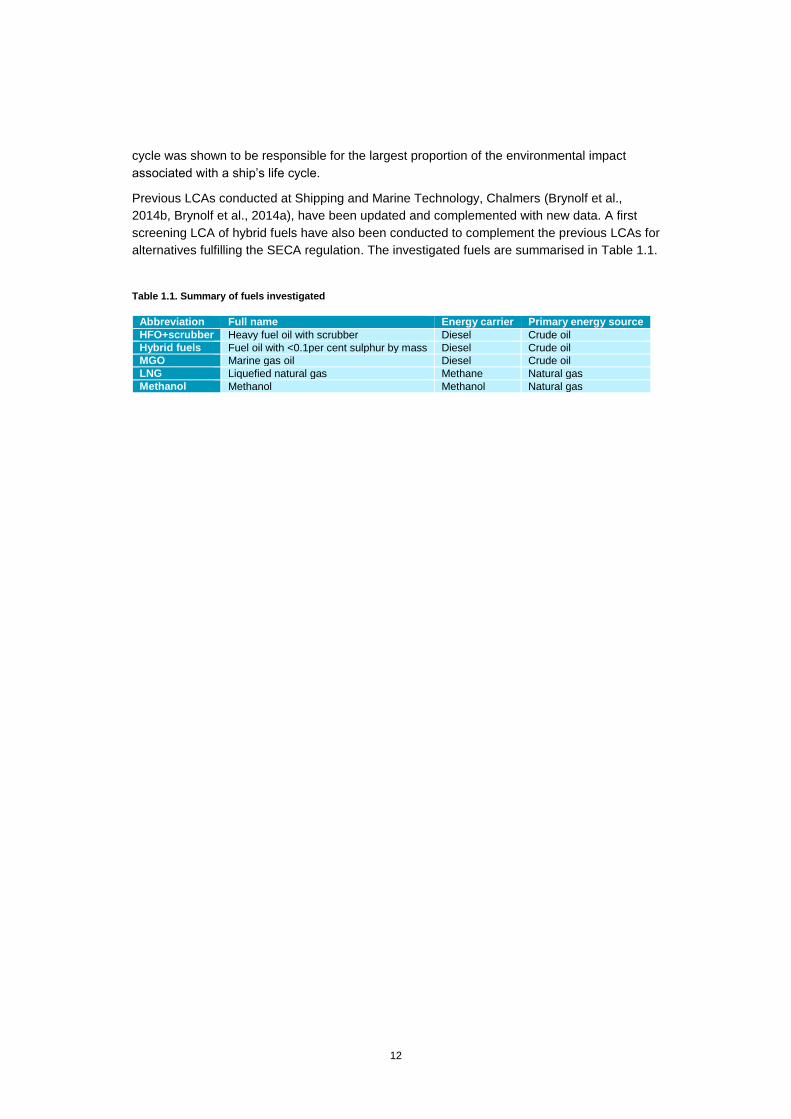
Previous LCAs conducted at Shipping and Marine Technology, Chalmers (Brynolf et al.,
2014b, Brynolf et al., 2014a), have been updated and complemented with new data. A first
screening LCA of hybrid fuels have also been conducted to complement the previous LCAs for
alternatives fulfilling the SECA regulation. The investigated fuels are summarised in Table 1.1.
Table 1.1. Summary of fuels investigated
Abbreviation Full name Energy carrier Primary energy source
HFO+scrubber Heavy fuel oil with scrubber Diesel Crude oil
Hybrid fuels Fuel oil with <0.1per cent sulphur by mass Diesel Crude oil
MGO Marine gas oil Diesel Crude oil
LNG Liquefied natural gas Methane Natural gas
Methanol Methanol Methanol Natural gas
13
2 Fuels used in the Baltic Sea 2015
The main fuels used in the Baltic Sea are petroleum fuels divided into residual oils, or heavy
fuel oils (HFO) and distillate oils (MGO, MDO). HFO usually has a higher sulphur content than
0.1 per cent, but can be used in ships that have installed sulphur dioxide exhaust gas
cleaning, scrubber. A category of fuels “in between” HFO and distillates with less than 0.1 per
cent sulphur has also come into use. The category is often called “hybrid fuel” or “ECA fuel”.
In general, the marine fuels have a flash point above 60oC for safety reasons. For fuels with
lower flash point than 60oC special regulations for use apply (Lloyds Register, 2015b). Low
flashpoint fuels are usually more or less sulphur free and offer an opportunity to fulfil the
SECA regulation. A change to low flashpoint fuels requires technical modifications to the
engine but can be economically attractive as long as the crude oil price is high. The most
common low flash point fuel used in the area is LNG, but methanol is also tested.
Marine fuels are standardised in terms of parameters of importance to use in engines, and
several standards exist. The ISO 8217 standard is often used but also other standards like the
European “International Council on Combustion Engines” (CIMAC), the British Standard
BS6843-1:1996 and the American Society for Testing and Materials (ASTM) D-975 (ABS,
2015) are used. The purpose of the standards is not to manage emissions, but there is a need
for more details of the fuel in order to assess the environmental performance.
2.1 Description of the fuels used
Heavy oils
The heavy fuel oils (HFO) are what remains after the distillate fuel oils and lighter hydro-
carbons are removed in the refinery. These fuel oils are used in production of electric power,
vessel bunkering, and various industrial purposes. There are numerous different qualities of
heavy fuel oils and one main difference is the viscosity.
Common heavy fuel oils in marine applications are IFO 180 and IFO 380, where the number
refers to the viscosity in cSt at 50oC5 (see Table A.1 in the Appendix). The viscosity when
injecting to the engine has to be sufficiently low, normally 10-15 cSt, which is accomplished by
heating the fuel. The highest viscosity available on the market is HFO 700. This fuel behaves
almost like a solid, and is not very much used.
HFO with less than 1.0 per cent sulphur is referred to as low sulphur heavy fuel oil, LSHFO.
These qualities may exist naturally when using low sulphur crude oil (“sweet crude”) but are
mainly the result of desulphurisation at the refinery. When the sulphur contents is lower than
5 The kinematic viscosity describes the movement of a fluid under influence of gravity. The unit of measurement is mm2/s or cSt, centi Stoke. As comparison, olive oil has a viscosity of around 25 cSt at 50 oC, fresh water 0.5 cSt.
14
0.1 per cent the quality is called ultra-low sulphur fuel oil, ULSFO. This fraction is one of the
possible hybrid fuel fractions.
Distillates
Marine distillates defined by ISO 8217 are DMX, DMA, DMB and DMC. DMX is a special fuel
with low flash point (min 43oC). The demand for DMC is small due to higher density and more
impurities compared to DMB. MDO (marine diesel oil) is a fuel that meets the DMA standard.
ULSD is often used as a name of fuel for land use. The sulphur content varies – in the United
States and Canada it is maximised to 0.00015 per cent (15 ppm), in Europe, Australia and
New Zealand 10 ppm and in many other countries 50 ppm (ABS, 2015).
Hybrid fuels
Hybrid fuels fulfil the 0.1 per cent sulphur regulations and have similarities both with HFO and
distillates. They are often more viscous and have better lubricity than distillates, which is an
advantage for use in engine systems designed for HFO. This means that they can replace
residual fuel, but need heating and are not suitable for engines that are designed to be
running on distillate only. The hybrid fuels may contain solids, aluminium silicate particles
called “cat fines”, from catalytic processes in the refinery that have to be removed before use
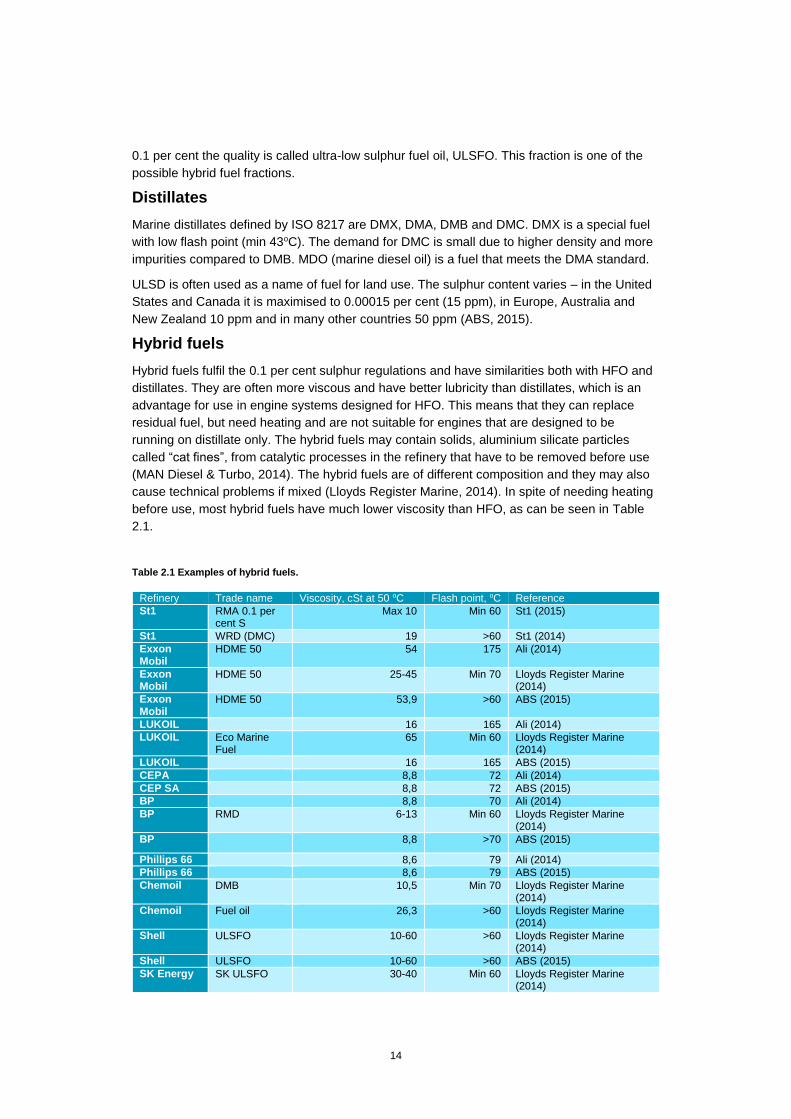
(MAN Diesel & Turbo, 2014). The hybrid fuels are of different composition and they may also
cause technical problems if mixed (Lloyds Register Marine, 2014). In spite of needing heating
before use, most hybrid fuels have much lower viscosity than HFO, as can be seen in Table
2.1.
Table 2.1 Examples of hybrid fuels.
Refinery Trade name Viscosity, cSt at 50 oC Flash point, oC Reference
St1 RMA 0.1 per cent S
Max 10 Min 60 St1 (2015)
St1 WRD (DMC) 19 >60 St1 (2014)
Exxon Mobil
HDME 50 54 175 Ali (2014)
Exxon Mobil
HDME 50 25-45 Min 70 Lloyds Register Marine (2014)
Exxon Mobil
HDME 50 53,9 >60 ABS (2015)
LUKOIL 16 165 Ali (2014)
LUKOIL Eco Marine Fuel
65 Min 60 Lloyds Register Marine (2014)
LUKOIL 16 165 ABS (2015)
CEPA 8,8 72 Ali (2014)
CEP SA 8,8 72 ABS (2015)
BP 8,8 70 Ali (2014)
BP RMD 6-13 Min 60 Lloyds Register Marine (2014)
BP 8,8 >70 ABS (2015)
Phillips 66 8,6 79 Ali (2014)
Phillips 66 8,6 79 ABS (2015)
Chemoil DMB 10,5 Min 70 Lloyds Register Marine (2014)
Chemoil Fuel oil 26,3 >60 Lloyds Register Marine (2014)
Shell ULSFO 10-60 >60 Lloyds Register Marine (2014)
Shell ULSFO 10-60 >60 ABS (2015)
SK Energy SK ULSFO 30-40 Min 60 Lloyds Register Marine (2014)
15
The availability of hybrid fuels is good in the Baltic Sea and North Sea area, with many ports
that offer bunkering along the main transport routes. According to Odland (2015) there are at
least 21 locations in the SECA from Great Britain to Finland where hybrid fuel is available for
bunker. The dominating amount of sea traffic in the Baltic Sea is in the Baltic Proper (south of
the Gulf of Bothnia), where also most of the bunker facilities are found.
Low flashpoint fuels
LNG has gained increased importance as a marine fuel because it can comply with the
strictest environmental regulations currently in force. It has a sulphur content of only a few
ppm, and four-stroke SI and DF engines will comply with the NOX Tier III regulations6. How-
ever, one problem associated with the use of LNG is the potential leakage of methane, a
stronger greenhouse gas than CO2.
LNG usually consists of methane, nitrogen and a small proportion of ethane and propane. The
use of LNG as a fuel in shipping has earlier been limited to LNG carriers, which use the boil-
off gas as fuel in steam turbines, but now also many LNG-fuelled ships are coming into
operation (DNV GL, 2014). The LNG-fuelled ships are either equipped with spark-ignited (SI)
lean-burn gas engines or dual-fuel (DF) engines. DF engines can run on either LNG or
HFO/MGO. When using LNG, a small amount of diesel pilot fuel is injected for ignition.
Examples of ships that operates in the Baltic Sea and are using LNG are passenger ferries,
tank and bulk ships. The ferry Viking Grace is operating on LNG in the Baltic Sea and there
are more LNG-fuelled ferries and cruise ships being built.
Methanol is the simplest alcohol, an excellent replacement for gasoline, and is used in mixed
fuels, but may also achieve a good performance in diesel engines. The use in diesel engines
requires an ignition enhancer, which may be a small amount of diesel oil. In all tests per-
formed, methanol shows good combustion properties and energy efficiency as well as low
emissions from combustion (Andersson, 2015). The fuel is almost sulphur free and the NOx
emissions measured from converted marine engines are close to or below the Tier III level.
A full scale test of conversion and operation of a RoPax ferry, Stena Germanica, to methanol
fuel is in progress with support from the EU Ten-T program. The main objective of the project
is to develop the fuel conversion and infrastructure. It includes conversion of engine and fuel
supply system on board, bunkering facilities and permit/regulation development.
Alcohol fuels such as methanol has lower energy contents than traditional fuels which is a
disadvantage. Given equivalent energy density, space requirements for storing methanol in a
tank will be double that of traditional diesel fuels. This has been handled in the Stena
conversion by using ballast tanks for fuel storage.
HFO and emission abatement
Fuel with higher sulphur contents than 0.1 per cent may be used together with emission
abatement, scrubber (Brynolf et al., 2014b). The scrubber removes the sulphur from the
exhausts using water as absorbent. The scrubber may use seawater, which is returned to the
sea (open loop scrubber) or water with added chemicals in a closed system (closed loop
scrubber). There are also scrubbers that work in both modes (hybrid scrubbers). The scrubber
system, independent of mode, will produce waste that has to be left in port where the amount
for closed loop operation will be larger (Andersson et al., 2016).
6 Tier III regulates the NOx emissions from new ships in the NOx ECA. In force in the North American ECA and US Caribbean ECA since 2016. There are discussions to implement a NOx ECA also in the Baltic and North Sea.
16
2.2 Production of petroleum fuels
Crude oil is extracted from onshore and offshore locations, and the characteristics of the oil
vary greatly depending on the location of the oil field and the age of the production site.
Typical crude oil contains 84.5 per cent carbon, 13 per cent hydrogen, 1-3 per cent sulphur
and less than 1 per cent each of nitrogen, oxygen, metals and salts, but these amounts vary
greatly (Aitani, 2004). Crude oil can be transported either by pipeline or by a crude oil carrier
from the extraction site to the refineries.
After the removal of contaminants, the crude oil is distilled in atmospheric and vacuum towers
to separate the crude into fractions, depending on their differences in boiling temperature. To
obtain a larger share of lighter products, the heavier products are usually chemically modified
by either thermal or catalytic cracking (Hocking, 2005). Different refinery processes may be
used in the production of marine fuels, e.g., atmospheric distillation, vacuum distillation,
thermal cracking, catalytic cracking, hydrocracking and coking. The set of refining processes
used varies from one refinery to the next, and the feedstock for these processes also varies
from one facility to the next and over time.
Gas oils are light, and heavy fractions and blends thereof, from straight-run and cracked
origins, have a boiling range between 200 and 350°C. They are predominantly used as auto-
motive diesel fuels and as domestic heating fuels. MGO is also produced from this fraction
(Alfke et al., 2007). HFO consists of various mixtures of residual oils from the distilling and
conversion processes in the refinery. These products are used as marine bunker fuels, in
power stations and in industrial furnaces. The HFOs can be blended with gas oils to adjust the
density, viscosity and sulphur content (Alfke et al., 2007).
Hybrid fuels are in this report defined as all fuels that are not distillates but comply with the 0.1
per cent sulphur by mass limit. There are various ways for refineries to produce these types of
fuels. Two main options are suggested by Avis and Birch (2009): desulfurizing low sulphur
topped crude oil or desulfurizing vacuum gas oils. They also suggest that there may be other
possibilities to produce hybrid fuels by blending and desulfurizing different fractions in the
refinery. Which options that exists will depend on the refinery configuration. This have also
been verified with industry representatives (Tamm, 2016, Reid, 2016).
The hybrid fuel HDME50 produced by ExxonMobil is a hydro-processed vacuum gas oil
(Forget, 2016). Another example is residue thickened distillates which are distillates that
contains a small amount of residue, this have been introduced by for example Shell and is
usually sold as an ISO 8217:2015 RMD80 grade (Forget, 2016). Calzado Catalá et al. (2013)
assumes that the 0.1 per cent sulphur fuels in Europe will be produced from vacuum gas oils
and middle distillate components. They consider the residual crude fractions produced in EU
to be too high in sulphur to be blended into 0.1 per cent sulphur fuels and that the desulphuri-
sation technology only can be used for a small proportion of the crudes processed in the EU.
2.3 Data collection
The total amount of marine fuel used in the Baltic Sea is quite difficult to assess. Bunkering
occurs in many different ports and at sea, within and outside the SECA. National fuel statistics
17
are thus not very useful for assessing marine fuel use. If also the fuel quality is to be included,
the task becomes even more challenging. It is not relevant to expect that the low sulphur fuel
is intended only for use within SECA, since low sulphur fuel is required also when entering
many ports outside the SECA, for example in the EU.
Bunkering in Sweden is recorded in terms of energy use by the Swedish Energy Agency. Until
now the fuel has been categorized in terms of “heating fuel” (Eldningsolja 1-5) and not in
terms of marine qualities. The sulphur content is not recorded in the statistics. For land based
use, there are national regulations for sulphur concentration, but for international bunker only
the SECA rules are applicable. The Swedish Chemicals Agency (KemI) has the overall
responsibility for bunker within Sweden, but does not collect data on fuel quality. The
recording of fuel, using bunker receipts by KemI is only done if there is a deviation in fuel
delivery reported by the ship-owner to the transport agency (Sohlberg, 2016). The Swedish
Transport Agency (Transportstyrelsen) are surveilling the regulations compliance by sampling
fuel from ships in ports. In 2015, fuel samples from 400 ships calling Swedish ports have been
taken, mainly from ships operating outside the SECA. The total number of calls in the ports in
the Baltic sea is very large, in 2006 it was over 379 000 calls recorded (Saurama, 2006) and
the traffic has increased since. However, this number includes all calls by ferries, where many
routes are short and frequently operated, but the 400 samples taken still represents a very
small part of the total ship calls.
A coming European regulation on Monitoring, Reporting and Verification of Carbon Dioxide
from Ships (MRV) will enter into force in 2018 and may give a future possibility to monitor the
fuel use. The MRV will cover aggregated annual CO2 emissions at sea and in ports in the EU
related to cargo carried and distance travelled, but also the amount and emission factor for
each type of fuel consumed in total (Lloyds Register, 2015a).
Fuel use in the Baltic Sea from AIS data
Automated Identification System (AIS)7 data makes it possible to estimate the total fuel use
using transport distance and speed together with recorded IMO numbers of ships where data
on engine type and size are available. According to studies made annually for the HELCOM
by Johansson and Jalkanen (2015), based on AIS data, the total emissions from all vessels in
the Baltic Sea in 2014 were: CO2 15.0 M tonne, SOx 81 k tonne and NOx 320 k tonne. The
CO2 emissions corresponds to 4 750 k tonne of fuel, of which 22 per cent is from auxiliary
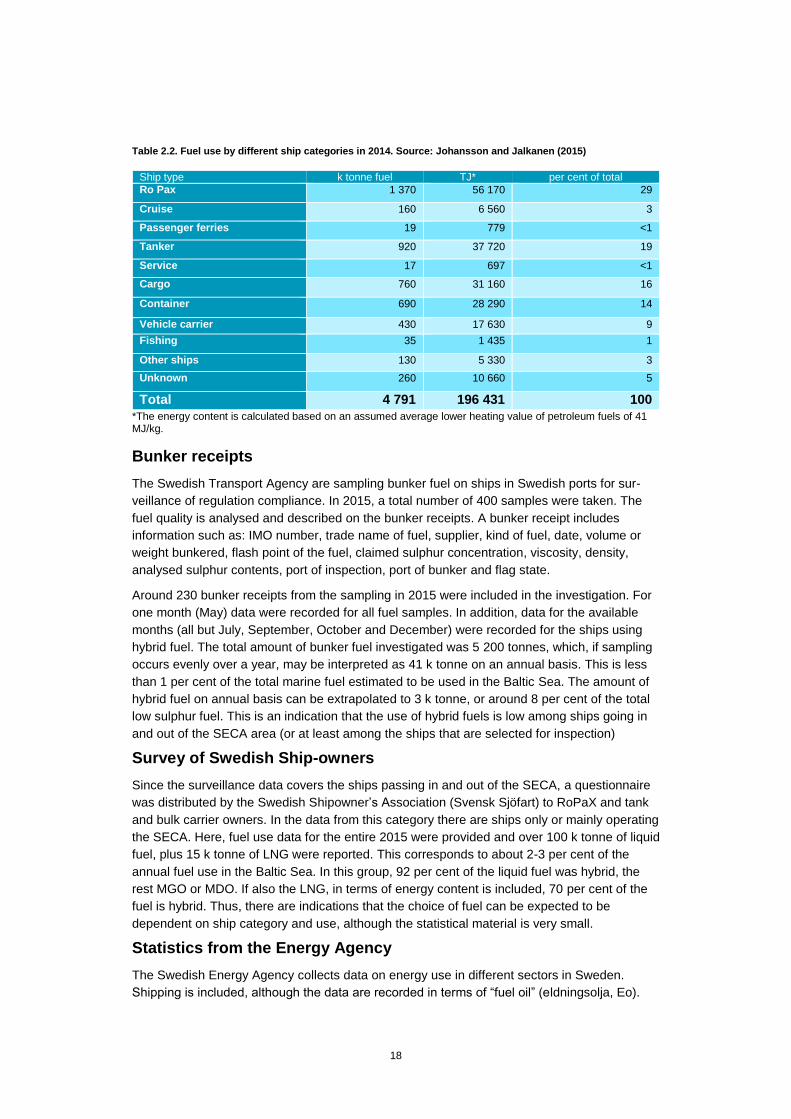
engines. The distribution of fuel use between ship types is show in Table 2.2.
The total fuel use in 2015 is under assessment, and will be published at the HELCOM
Maritime Meeting in September 2016 (Jalkanen, 2016). From Table 2.2 it may be estimated
that around 30 per cent of the fuel use can be attributed to RoPax ferries, mainly running on
fixed routes all year round, although with large increase in traffic during summer. RoPax
ferries also seem to be a segment with large use of hybrid fuel (see Statistics from Swedish
Ship-owners below).
7 AIS is a maritime transponder/receiver system defined by the International Maritime Organization, IMO. AIS operates in the very high frequency, VHF, band. It provides ID, position, course, speed and other ship data.
18
Table 2.2. Fuel use by different ship categories in 2014. Source: Johansson and Jalkanen (2015)
Ship type k tonne fuel TJ* per cent of total
Ro Pax 1 370 56 170 29
Cruise 160 6 560 3
Passenger ferries 19 779 <1
Tanker 920 37 720 19
Service 17 697 <1
Cargo 760 31 160 16
Container 690 28 290 14
Vehicle carrier 430 17 630 9
Fishing 35 1 435 1
Other ships 130 5 330 3
Unknown 260 10 660 5
Total 4 791 196 431 100
*The energy content is calculated based on an assumed average lower heating value of petroleum fuels of 41 MJ/kg.
Bunker receipts
The Swedish Transport Agency are sampling bunker fuel on ships in Swedish ports for sur-
veillance of regulation compliance. In 2015, a total number of 400 samples were taken. The
fuel quality is analysed and described on the bunker receipts. A bunker receipt includes
information such as: IMO number, trade name of fuel, supplier, kind of fuel, date, volume or
weight bunkered, flash point of the fuel, claimed sulphur concentration, viscosity, density,
analysed sulphur contents, port of inspection, port of bunker and flag state.
Around 230 bunker receipts from the sampling in 2015 were included in the investigation. For
one month (May) data were recorded for all fuel samples. In addition, data for the available
months (all but July, September, October and December) were recorded for the ships using
hybrid fuel. The total amount of bunker fuel investigated was 5 200 tonnes, which, if sampling
occurs evenly over a year, may be interpreted as 41 k tonne on an annual basis. This is less
than 1 per cent of the total marine fuel estimated to be used in the Baltic Sea. The amount of
hybrid fuel on annual basis can be extrapolated to 3 k tonne, or around 8 per cent of the total
low sulphur fuel. This is an indication that the use of hybrid fuels is low among ships going in
and out of the SECA area (or at least among the ships that are selected for inspection)
Survey of Swedish Ship-owners
Since the surveillance data covers the ships passing in and out of the SECA, a questionnaire
was distributed by the Swedish Shipowner’s Association (Svensk Sjöfart) to RoPaX and tank
and bulk carrier owners. In the data from this category there are ships only or mainly operating
the SECA. Here, fuel use data for the entire 2015 were provided and over 100 k tonne of liquid
fuel, plus 15 k tonne of LNG were reported. This corresponds to about 2-3 per cent of the
annual fuel use in the Baltic Sea. In this group, 92 per cent of the liquid fuel was hybrid, the
rest MGO or MDO. If also the LNG, in terms of energy content is included, 70 per cent of the
fuel is hybrid. Thus, there are indications that the choice of fuel can be expected to be
dependent on ship category and use, although the statistical material is very small.
Statistics from the Energy Agency
The Swedish Energy Agency collects data on energy use in different sectors in Sweden.
Shipping is included, although the data are recorded in terms of “fuel oil” (eldningsolja, Eo).
19
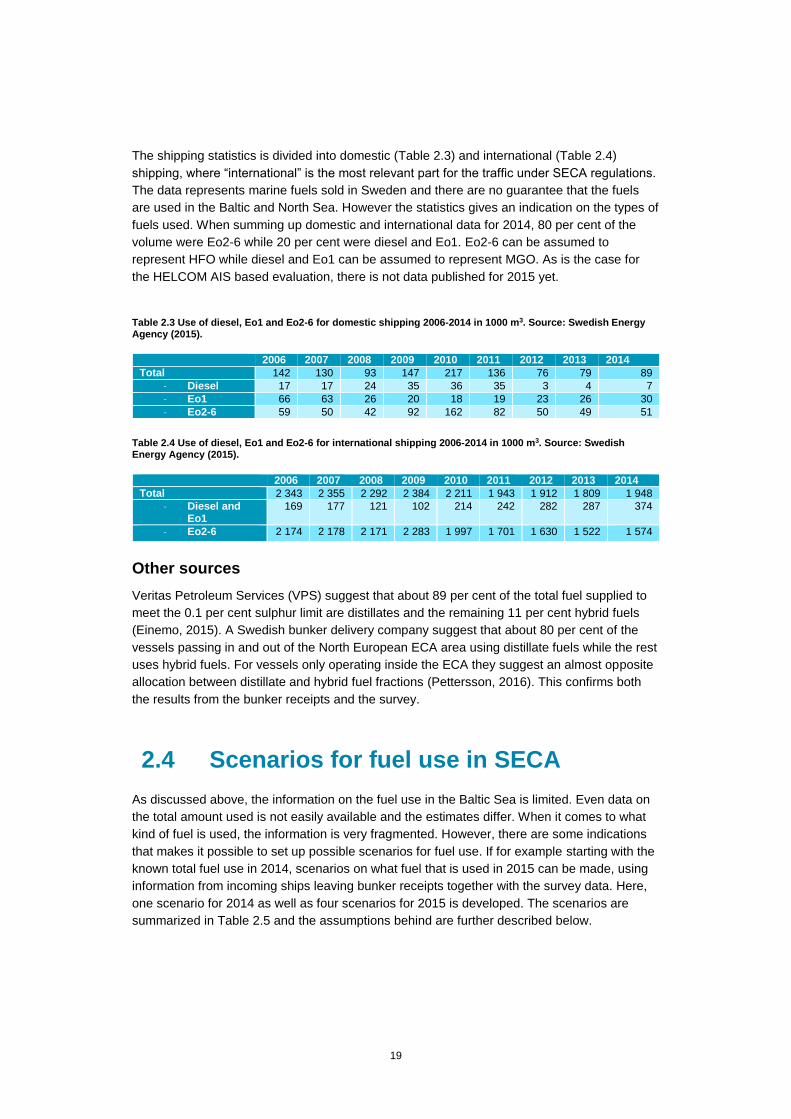
The shipping statistics is divided into domestic (Table 2.3) and international (Table 2.4)
shipping, where “international” is the most relevant part for the traffic under SECA regulations.
The data represents marine fuels sold in Sweden and there are no guarantee that the fuels
are used in the Baltic and North Sea. However the statistics gives an indication on the types of
fuels used. When summing up domestic and international data for 2014, 80 per cent of the
volume were Eo2-6 while 20 per cent were diesel and Eo1. Eo2-6 can be assumed to
represent HFO while diesel and Eo1 can be assumed to represent MGO. As is the case for
the HELCOM AIS based evaluation, there is not data published for 2015 yet.
Table 2.3 Use of diesel, Eo1 and Eo2-6 for domestic shipping 2006-2014 in 1000 m3. Source: Swedish Energy Agency (2015).
2006 2007 2008 2009 2010 2011 2012 2013 2014
Total 142 130 93 147 217 136 76 79 89
- Diesel 17 17 24 35 36 35 3 4 7
- Eo1 66 63 26 20 18 19 23 26 30
- Eo2-6 59 50 42 92 162 82 50 49 51
Table 2.4 Use of diesel, Eo1 and Eo2-6 for international shipping 2006-2014 in 1000 m3. Source: Swedish Energy Agency (2015).
2006 2007 2008 2009 2010 2011 2012 2013 2014
Total 2 343 2 355 2 292 2 384 2 211 1 943 1 912 1 809 1 948
- Diesel and Eo1
169 177 121 102 214 242 282 287 374
- Eo2-6 2 174 2 178 2 171 2 283 1 997 1 701 1 630 1 522 1 574
Other sources
Veritas Petroleum Services (VPS) suggest that about 89 per cent of the total fuel supplied to
meet the 0.1 per cent sulphur limit are distillates and the remaining 11 per cent hybrid fuels
(Einemo, 2015). A Swedish bunker delivery company suggest that about 80 per cent of the
vessels passing in and out of the North European ECA area using distillate fuels while the rest
uses hybrid fuels. For vessels only operating inside the ECA they suggest an almost opposite
allocation between distillate and hybrid fuel fractions (Pettersson, 2016). This confirms both
the results from the bunker receipts and the survey.
2.4 Scenarios for fuel use in SECA
As discussed above, the information on the fuel use in the Baltic Sea is limited. Even data on
the total amount used is not easily available and the estimates differ. When it comes to what
kind of fuel is used, the information is very fragmented. However, there are some indications
that makes it possible to set up possible scenarios for fuel use. If for example starting with the
known total fuel use in 2014, scenarios on what fuel that is used in 2015 can be made, using
information from incoming ships leaving bunker receipts together with the survey data. Here,
one scenario for 2014 as well as four scenarios for 2015 is developed. The scenarios are
summarized in Table 2.5 and the assumptions behind are further described below.
20
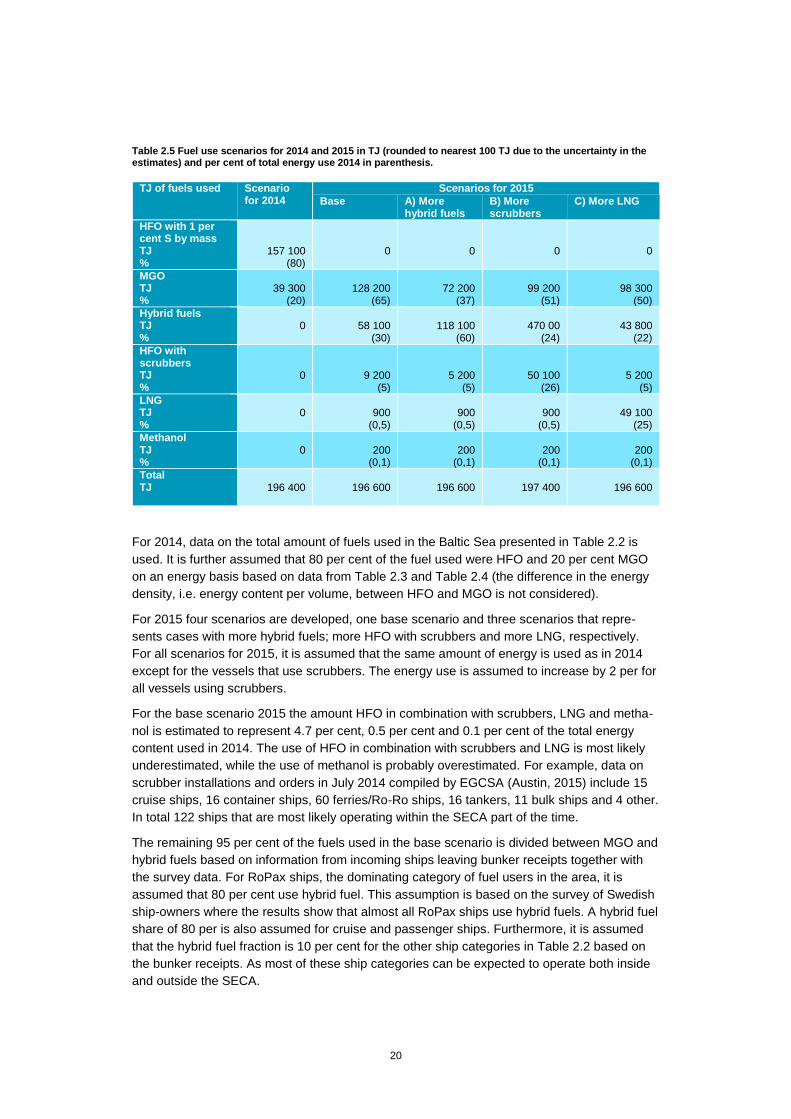
Table 2.5 Fuel use scenarios for 2014 and 2015 in TJ (rounded to nearest 100 TJ due to the uncertainty in the estimates) and per cent of total energy use 2014 in parenthesis.
TJ of fuels used Scenario for 2014
Scenarios for 2015
Base A) More hybrid fuels
B) More scrubbers
C) More LNG
HFO with 1 per cent S by mass TJ %
157 100 (80)
0
0
0
0
MGO TJ %
39 300
(20)
128 200
(65)
72 200
(37)
99 200
(51)
98 300
(50)
Hybrid fuels TJ %
0
58 100
(30)
118 100
(60)
470 00
(24)
43 800
(22)
HFO with scrubbers TJ %
0
9 200 (5)
5 200 (5)
50 100 (26)
5 200 (5)
LNG TJ %
0
900
(0,5)
900
(0,5)
900
(0,5)
49 100
(25)
Methanol TJ %
0
200
(0,1)
200
(0,1)
200
(0,1)
200
(0,1)
Total TJ
196 400
196 600
196 600
197 400
196 600
For 2014, data on the total amount of fuels used in the Baltic Sea presented in Table 2.2 is
used. It is further assumed that 80 per cent of the fuel used were HFO and 20 per cent MGO
on an energy basis based on data from Table 2.3 and Table 2.4 (the difference in the energy
density, i.e. energy content per volume, between HFO and MGO is not considered).
For 2015 four scenarios are developed, one base scenario and three scenarios that repre-
sents cases with more hybrid fuels; more HFO with scrubbers and more LNG, respectively.
For all scenarios for 2015, it is assumed that the same amount of energy is used as in 2014
except for the vessels that use scrubbers. The energy use is assumed to increase by 2 per for
all vessels using scrubbers.
For the base scenario 2015 the amount HFO in combination with scrubbers, LNG and metha-
nol is estimated to represent 4.7 per cent, 0.5 per cent and 0.1 per cent of the total energy
content used in 2014. The use of HFO in combination with scrubbers and LNG is most likely
underestimated, while the use of methanol is probably overestimated. For example, data on
scrubber installations and orders in July 2014 compiled by EGCSA (Austin, 2015) include 15
cruise ships, 16 container ships, 60 ferries/Ro-Ro ships, 16 tankers, 11 bulk ships and 4 other.
In total 122 ships that are most likely operating within the SECA part of the time.
The remaining 95 per cent of the fuels used in the base scenario is divided between MGO and
hybrid fuels based on information from incoming ships leaving bunker receipts together with
the survey data. For RoPax ships, the dominating category of fuel users in the area, it is
assumed that 80 per cent use hybrid fuel. This assumption is based on the survey of Swedish
ship-owners where the results show that almost all RoPax ships use hybrid fuels. A hybrid fuel
share of 80 per is also assumed for cruise and passenger ships. Furthermore, it is assumed
that the hybrid fuel fraction is 10 per cent for the other ship categories in Table 2.2 based on
the bunker receipts. As most of these ship categories can be expected to operate both inside
and outside the SECA.
21
In scenario A it was assumed that the share of hybrid fuels were 90 per cent for RoPax, cruise
and passenger ships and 50 per cent for the other ship categories. In scenario B it was
assumed that 25 per cent of the fuels used were HFO in combination with scrubbers. This
resulted in a total use of 26 per cent of HFO with scrubbers when also considering an increase
in energy use with 2 per cent. In scenario C it was assumed that 25 per cent of the fuel used
was LNG.
In these scenarios the hybrid fuel fraction varies between 20-60 per cent. However, when
trying to estimate the share of MGO and hybrid fuels used in 2015 based on the data collected
from bunker receipts and Swedish ship-owners a use of 20 – 40 per cent of hybrid fuel seem
more likely. Still, use of hybrid fuel in addition to distillates may thus be of importance to the
environmental impact from shipping.

22
23
3 Environmental indicators for marine fuels
Environmental indicators for the marine fuels used in the Baltic Sea from 2015 are developed
using LCA. The main data used in this assessment is summarised in the PhD thesis ”Environ-
mental assessment of present and future marine fuels” by Brynolf (2014). A number of smaller
modifications and additional data sources are also used. This data is described in Section 3.1.
The life cycle results are presented in Section 3.2 divided on well-to-tank and tank-to-
propeller. Section 3.3 in this chapter present the results for some selected ship types, and
finally how the SECA regulation affects emissions in a life cycle perspective.
3.1 Data used in the environmental
assessment
The main steps considered in the fuel life cycles are raw material extraction, fuel production,
fuel distribution (well-to-tank), and fuel combustion in marine engines (tank-to-propeller). For
HFO and MGO new data are considered for the raw material extraction and fuel production.
For hybrid fuel, new data are added for all steps but using the same data as for MGO
regarding the fuel need during distribution. For LNG the fuel combustion stage is updated with
new data. For methanol no new data are added and the result are therefore identical to Table
5-1 and 5-2 in Brynolf (2014).
HFO, MGO and hybrid fuel
The data in Brynolf (2014) for HFO and MGO production is based on an attributional LCA
approach investigating the question ‘What would be the overall environmental impact of HFO
and MGO production?’. If you instead would like to investigate what is the environmental
consequences of using HFO with a high sulphur content (>0.1 mass per cent) with a scrubber
or a low sulphur marine fuel (MGO or hybrid fuel with <0.1 mass per cent), a consequential
LCA approach is needed. The data used in Brynolf (2014) for HFO and MGO production
(ELCD core database version II, 2010a, ELCD core database version II, 2010b) are not
applicable for that and therefore needs to be exchanged. As this data include both the crude
oil extraction and the HFO and MGO production, new data for crude oil extraction is also
needed. The new data for crude oil extraction can be seen in Table 3.1.
24
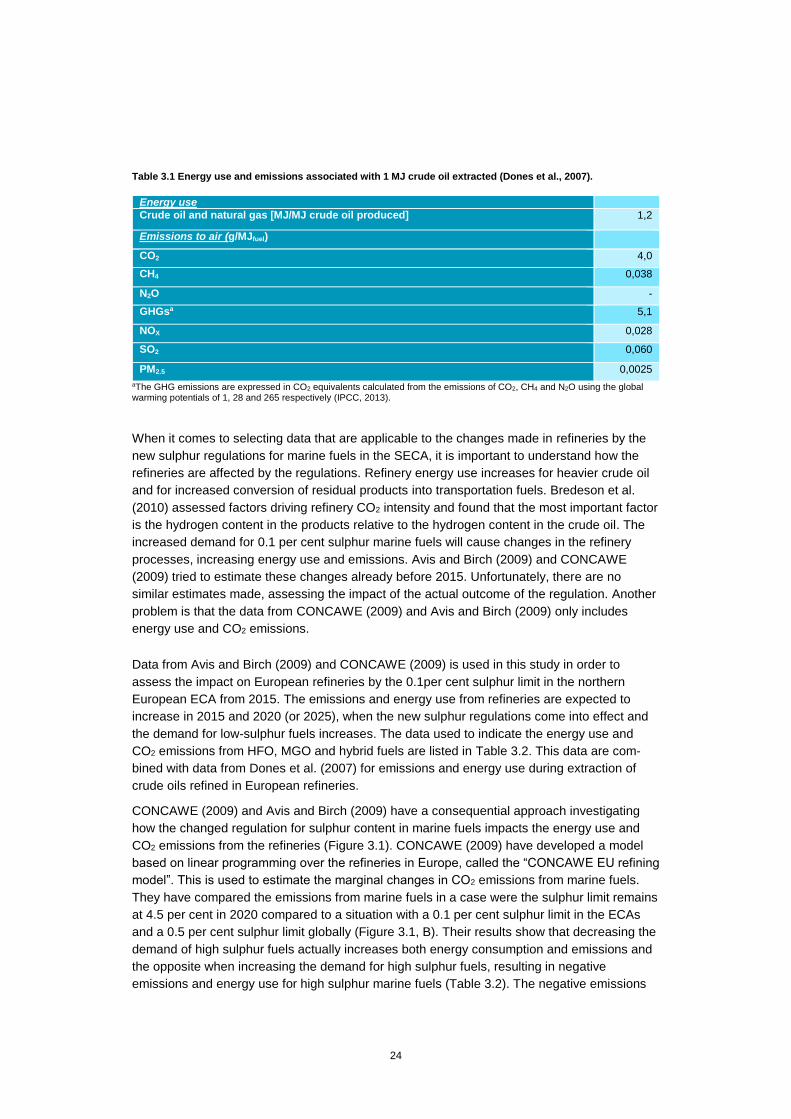
Table 3.1 Energy use and emissions associated with 1 MJ crude oil extracted (Dones et al., 2007).
Energy use
Crude oil and natural gas [MJ/MJ crude oil produced] 1,2
Emissions to air (g/MJfuel)
CO2 4,0
CH4 0,038
N2O -
GHGsa 5,1
NOX 0,028
SO2 0,060
PM2.5 0,0025
aThe GHG emissions are expressed in CO2 equivalents calculated from the emissions of CO2, CH4 and N2O using the global warming potentials of 1, 28 and 265 respectively (IPCC, 2013).
When it comes to selecting data that are applicable to the changes made in refineries by the
new sulphur regulations for marine fuels in the SECA, it is important to understand how the
refineries are affected by the regulations. Refinery energy use increases for heavier crude oil
and for increased conversion of residual products into transportation fuels. Bredeson et al.
(2010) assessed factors driving refinery CO2 intensity and found that the most important factor
is the hydrogen content in the products relative to the hydrogen content in the crude oil. The
increased demand for 0.1 per cent sulphur marine fuels will cause changes in the refinery
processes, increasing energy use and emissions. Avis and Birch (2009) and CONCAWE
(2009) tried to estimate these changes already before 2015. Unfortunately, there are no
similar estimates made, assessing the impact of the actual outcome of the regulation. Another
problem is that the data from CONCAWE (2009) and Avis and Birch (2009) only includes
energy use and CO2 emissions.
Data from Avis and Birch (2009) and CONCAWE (2009) is used in this study in order to
assess the impact on European refineries by the 0.1per cent sulphur limit in the northern
European ECA from 2015. The emissions and energy use from refineries are expected to
increase in 2015 and 2020 (or 2025), when the new sulphur regulations come into effect and
the demand for low-sulphur fuels increases. The data used to indicate the energy use and
CO2 emissions from HFO, MGO and hybrid fuels are listed in Table 3.2. This data are com-
bined with data from Dones et al. (2007) for emissions and energy use during extraction of
crude oils refined in European refineries.
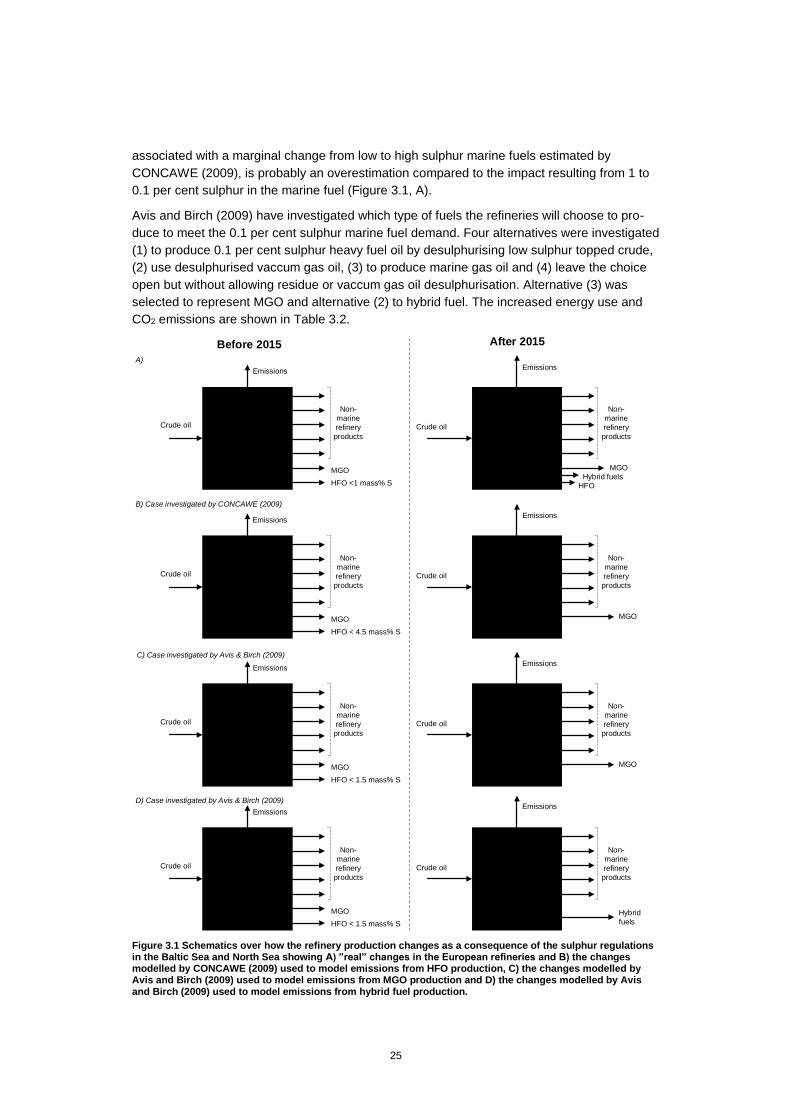
CONCAWE (2009) and Avis and Birch (2009) have a consequential approach investigating
how the changed regulation for sulphur content in marine fuels impacts the energy use and
CO2 emissions from the refineries (Figure 3.1). CONCAWE (2009) have developed a model
based on linear programming over the refineries in Europe, called the “CONCAWE EU refining
model”. This is used to estimate the marginal changes in CO2 emissions from marine fuels.
They have compared the emissions from marine fuels in a case were the sulphur limit remains
at 4.5 per cent in 2020 compared to a situation with a 0.1 per cent sulphur limit in the ECAs
and a 0.5 per cent sulphur limit globally (Figure 3.1, B). Their results show that decreasing the
demand of high sulphur fuels actually increases both energy consumption and emissions and
the opposite when increasing the demand for high sulphur fuels, resulting in negative
emissions and energy use for high sulphur marine fuels (Table 3.2). The negative emissions
25
associated with a marginal change from low to high sulphur marine fuels estimated by
CONCAWE (2009), is probably an overestimation compared to the impact resulting from 1 to
0.1 per cent sulphur in the marine fuel (Figure 3.1, A).
Avis and Birch (2009) have investigated which type of fuels the refineries will choose to pro-
duce to meet the 0.1 per cent sulphur marine fuel demand. Four alternatives were investigated
(1) to produce 0.1 per cent sulphur heavy fuel oil by desulphurising low sulphur topped crude,
(2) use desulphurised vaccum gas oil, (3) to produce marine gas oil and (4) leave the choice
open but without allowing residue or vaccum gas oil desulphurisation. Alternative (3) was
selected to represent MGO and alternative (2) to hybrid fuel. The increased energy use and
CO2 emissions are shown in Table 3.2.
Before 2015 After 2015
Crude oil Crude oil
HFO <1 mass% S
MGO
HFO
MGO
Hybrid fuels
Crude oil Crude oil
HFO < 4.5 mass% S
MGO MGO
Crude oil Crude oil
HFO < 1.5 mass% S
MGO MGO
Crude oil Crude oil
HFO < 1.5 mass% S
MGO Hybrid
fuels
B) Case investigated by CONCAWE (2009)
C) Case investigated by Avis & Birch (2009)
A)
D) Case investigated by Avis & Birch (2009)
EmissionsEmissions
EmissionsEmissions
Emissions
EmissionsEmissions
Emissions
Non-
marine
refinery
products
Non-
marine
refinery
products
Non-
marine
refinery
products
Non-
marine
refinery
products
Non-
marine
refinery
products
Non-
marine
refinery
products
Non-
marine
refinery
products
Non-
marine
refinery
products
Figure 3.1 Schematics over how the refinery production changes as a consequence of the sulphur regulations in the Baltic Sea and North Sea showing A) ”real” changes in the European refineries and B) the changes modelled by CONCAWE (2009) used to model emissions from HFO production, C) the changes modelled by Avis and Birch (2009) used to model emissions from MGO production and D) the changes modelled by Avis and Birch (2009) used to model emissions from hybrid fuel production.
26
One measurement on a vessel using HFO with 0.48 per cent sulphur and a hybrid fuel with
0.092 per cent sulphur has been made which indicated a reduction in particle mass by about
50 per cent with hybrid fuel. The other emissions except for sulphur dioxide were on the same
level as for HFO (Zetterdahl et al., 2016). This is just one measurement made on one type of
hybrid fuel and the emission can be expected to vary as the fuel quality differs significantly
between the hybrid fuels. However, as this is the only measurement it is used here to indicate
emissions from hybrid fuels.
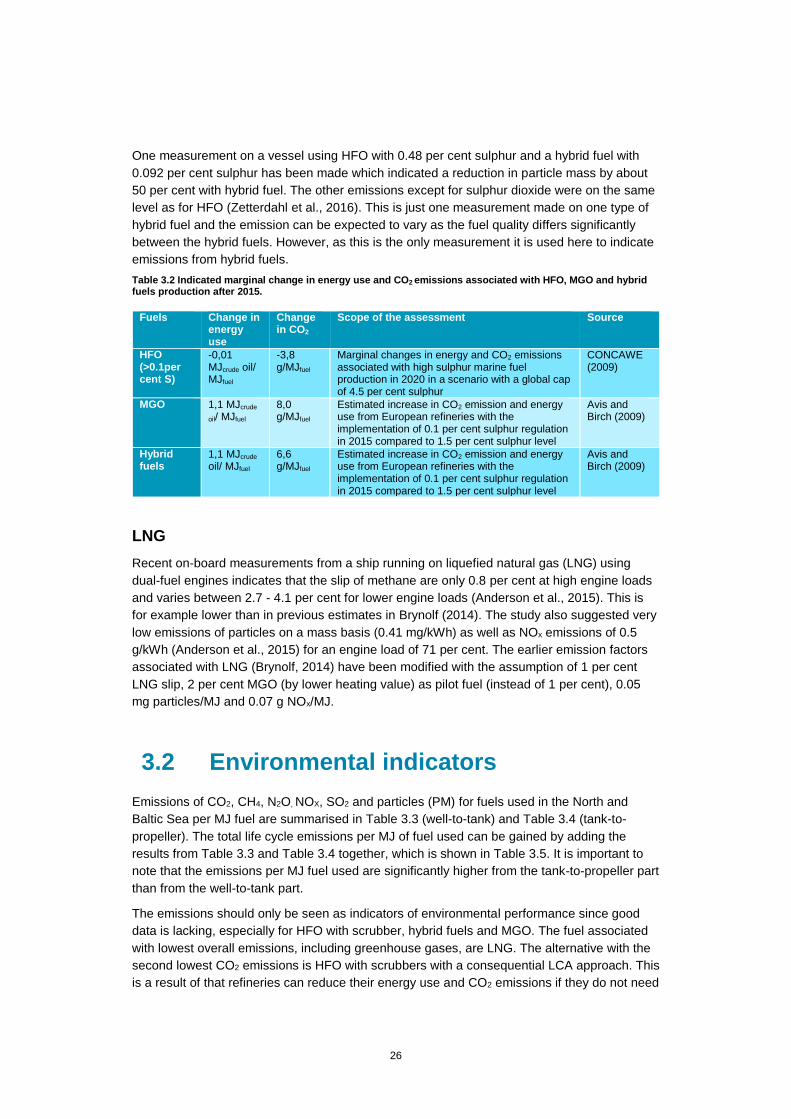
Table 3.2 Indicated marginal change in energy use and CO2 emissions associated with HFO, MGO and hybrid fuels production after 2015.
Fuels Change in energy use
Change in CO2
Scope of the assessment Source
HFO (>0.1per cent S)
-0,01 MJcrude oil/ MJfuel
-3,8 g/MJfuel
Marginal changes in energy and CO2 emissions associated with high sulphur marine fuel production in 2020 in a scenario with a global cap of 4.5 per cent sulphur
CONCAWE (2009)
MGO 1,1 MJcrude
oil/ MJfuel
8,0 g/MJfuel
Estimated increase in CO2 emission and energy use from European refineries with the implementation of 0.1 per cent sulphur regulation in 2015 compared to 1.5 per cent sulphur level
Avis and Birch (2009)
Hybrid fuels
1,1 MJcrude oil/ MJfuel
6,6 g/MJfuel
Estimated increase in CO2 emission and energy use from European refineries with the implementation of 0.1 per cent sulphur regulation in 2015 compared to 1.5 per cent sulphur level
Avis and Birch (2009)
LNG
Recent on-board measurements from a ship running on liquefied natural gas (LNG) using
dual-fuel engines indicates that the slip of methane are only 0.8 per cent at high engine loads
and varies between 2.7 - 4.1 per cent for lower engine loads (Anderson et al., 2015). This is
for example lower than in previous estimates in Brynolf (2014). The study also suggested very
low emissions of particles on a mass basis (0.41 mg/kWh) as well as NOx emissions of 0.5
g/kWh (Anderson et al., 2015) for an engine load of 71 per cent. The earlier emission factors
associated with LNG (Brynolf, 2014) have been modified with the assumption of 1 per cent
LNG slip, 2 per cent MGO (by lower heating value) as pilot fuel (instead of 1 per cent), 0.05
mg particles/MJ and 0.07 g NOx/MJ.
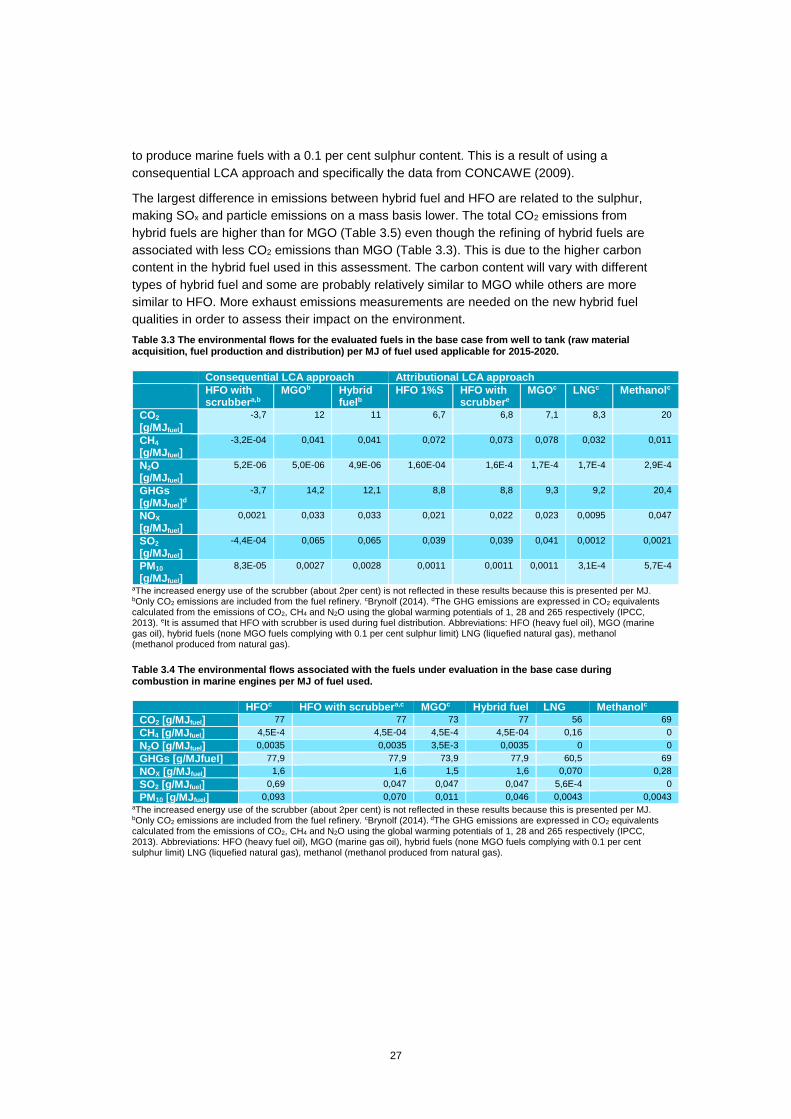
3.2 Environmental indicators
Emissions of CO2, CH4, N2O, NOX, SO2 and particles (PM) for fuels used in the North and
Baltic Sea per MJ fuel are summarised in Table 3.3 (well-to-tank) and Table 3.4 (tank-to-
propeller). The total life cycle emissions per MJ of fuel used can be gained by adding the
results from Table 3.3 and Table 3.4 together, which is shown in Table 3.5. It is important to
note that the emissions per MJ fuel used are significantly higher from the tank-to-propeller part
than from the well-to-tank part.
The emissions should only be seen as indicators of environmental performance since good
data is lacking, especially for HFO with scrubber, hybrid fuels and MGO. The fuel associated
with lowest overall emissions, including greenhouse gases, are LNG. The alternative with the
second lowest CO2 emissions is HFO with scrubbers with a consequential LCA approach. This
is a result of that refineries can reduce their energy use and CO2 emissions if they do not need
27
to produce marine fuels with a 0.1 per cent sulphur content. This is a result of using a
consequential LCA approach and specifically the data from CONCAWE (2009).
The largest difference in emissions between hybrid fuel and HFO are related to the sulphur,
making SOx and particle emissions on a mass basis lower. The total CO2 emissions from
hybrid fuels are higher than for MGO (Table 3.5) even though the refining of hybrid fuels are
associated with less CO2 emissions than MGO (Table 3.3). This is due to the higher carbon
content in the hybrid fuel used in this assessment. The carbon content will vary with different
types of hybrid fuel and some are probably relatively similar to MGO while others are more
similar to HFO. More exhaust emissions measurements are needed on the new hybrid fuel
qualities in order to assess their impact on the environment.
Table 3.3 The environmental flows for the evaluated fuels in the base case from well to tank (raw material acquisition, fuel production and distribution) per MJ of fuel used applicable for 2015-2020.
Consequential LCA approach Attributional LCA approach
HFO with scrubbera,b
MGOb Hybrid fuelb
HFO 1%S HFO with scrubbere
MGOc LNGc Methanolc
CO2 [g/MJfuel]
-3,7 12 11 6,7 6,8 7,1 8,3 20
CH4 [g/MJfuel]
-3,2E-04 0,041 0,041 0,072 0,073 0,078 0,032 0,011
N2O [g/MJfuel]
5,2E-06 5,0E-06 4,9E-06 1,60E-04 1,6E-4 1,7E-4 1,7E-4 2,9E-4
GHGs [g/MJfuel]
d
-3,7 14,2 12,1 8,8 8,8 9,3 9,2 20,4
NOX [g/MJfuel]
0,0021 0,033 0,033 0,021 0,022 0,023 0,0095 0,047
SO2 [g/MJfuel]
-4,4E-04 0,065 0,065 0,039 0,039 0,041 0,0012 0,0021
PM10 [g/MJfuel]
8,3E-05 0,0027 0,0028 0,0011 0,0011 0,0011 3,1E-4 5,7E-4
aThe increased energy use of the scrubber (about 2per cent) is not reflected in these results because this is presented per MJ. bOnly CO2 emissions are included from the fuel refinery. cBrynolf (2014). dThe GHG emissions are expressed in CO2 equivalents calculated from the emissions of CO2, CH4 and N2O using the global warming potentials of 1, 28 and 265 respectively (IPCC, 2013). eIt is assumed that HFO with scrubber is used during fuel distribution. Abbreviations: HFO (heavy fuel oil), MGO (marine gas oil), hybrid fuels (none MGO fuels complying with 0.1 per cent sulphur limit) LNG (liquefied natural gas), methanol (methanol produced from natural gas).
Table 3.4 The environmental flows associated with the fuels under evaluation in the base case during combustion in marine engines per MJ of fuel used.
HFOc HFO with scrubbera,c MGOc Hybrid fuel LNG Methanolc
CO2 [g/MJfuel] 77 77 73 77 56 69
CH4 [g/MJfuel] 4,5E-4 4,5E-04 4,5E-4 4,5E-04 0,16 0
N2O [g/MJfuel] 0,0035 0,0035 3,5E-3 0,0035 0 0
GHGs [g/MJfuel] 77,9 77,9 73,9 77,9 60,5 69
NOX [g/MJfuel] 1,6 1,6 1,5 1,6 0,070 0,28
SO2 [g/MJfuel] 0,69 0,047 0,047 0,047 5,6E-4 0
PM10 [g/MJfuel] 0,093 0,070 0,011 0,046 0,0043 0,0043 aThe increased energy use of the scrubber (about 2per cent) is not reflected in these results because this is presented per MJ. bOnly CO2 emissions are included from the fuel refinery. cBrynolf (2014). dThe GHG emissions are expressed in CO2 equivalents calculated from the emissions of CO2, CH4 and N2O using the global warming potentials of 1, 28 and 265 respectively (IPCC, 2013). Abbreviations: HFO (heavy fuel oil), MGO (marine gas oil), hybrid fuels (none MGO fuels complying with 0.1 per cent sulphur limit) LNG (liquefied natural gas), methanol (methanol produced from natural gas).
28
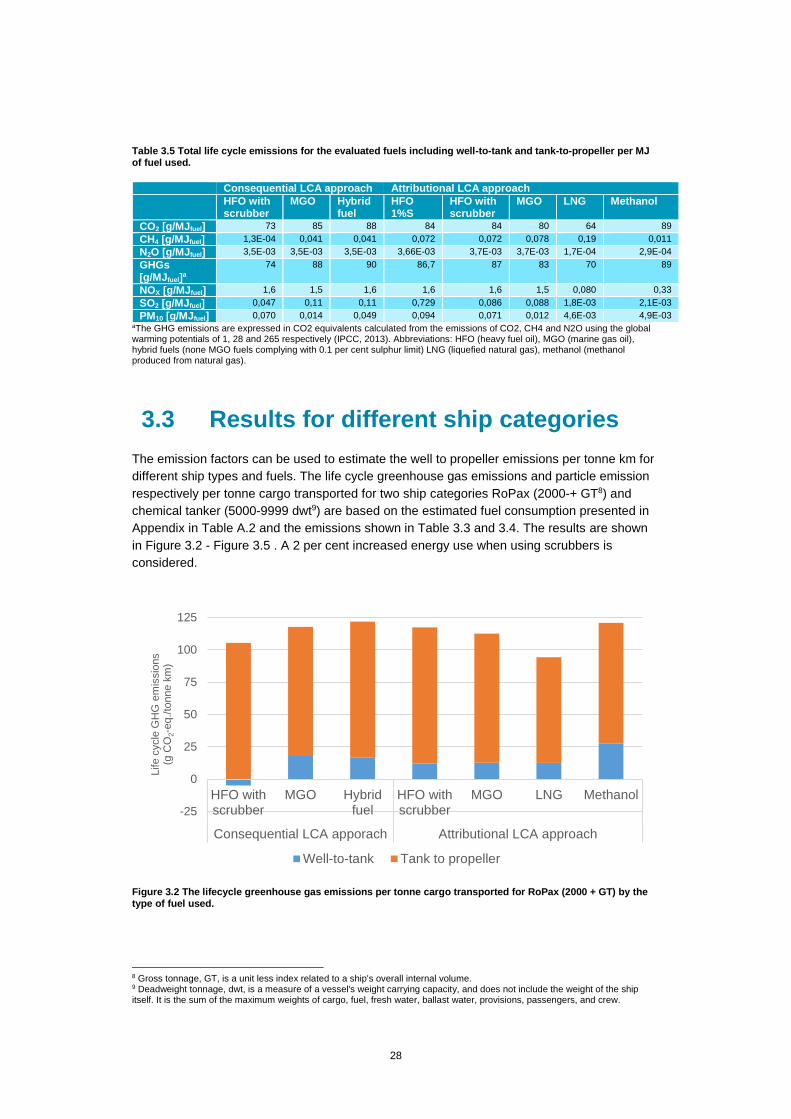
Table 3.5 Total life cycle emissions for the evaluated fuels including well-to-tank and tank-to-propeller per MJ of fuel used.
Consequential LCA approach Attributional LCA approach
HFO with scrubber
MGO Hybrid fuel
HFO 1%S
HFO with scrubber
MGO LNG Methanol
CO2 [g/MJfuel] 73 85 88 84 84 80 64 89
CH4 [g/MJfuel] 1,3E-04 0,041 0,041 0,072 0,072 0,078 0,19 0,011
N2O [g/MJfuel] 3,5E-03 3,5E-03 3,5E-03 3,66E-03 3,7E-03 3,7E-03 1,7E-04 2,9E-04
GHGs [g/MJfuel]
a
74 88 90 86,7 87 83 70 89
NOX [g/MJfuel] 1,6 1,5 1,6 1,6 1,6 1,5 0,080 0,33
SO2 [g/MJfuel] 0,047 0,11 0,11 0,729 0,086 0,088 1,8E-03 2,1E-03
PM10 [g/MJfuel] 0,070 0,014 0,049 0,094 0,071 0,012 4,6E-03 4,9E-03 aThe GHG emissions are expressed in CO2 equivalents calculated from the emissions of CO2, CH4 and N2O using the global warming potentials of 1, 28 and 265 respectively (IPCC, 2013). Abbreviations: HFO (heavy fuel oil), MGO (marine gas oil), hybrid fuels (none MGO fuels complying with 0.1 per cent sulphur limit) LNG (liquefied natural gas), methanol (methanol produced from natural gas).
3.3 Results for different ship categories
The emission factors can be used to estimate the well to propeller emissions per tonne km for
different ship types and fuels. The life cycle greenhouse gas emissions and particle emission
respectively per tonne cargo transported for two ship categories RoPax (2000-+ GT8) and
chemical tanker (5000-9999 dwt9) are based on the estimated fuel consumption presented in
Appendix in Table A.2 and the emissions shown in Table 3.3 and 3.4. The results are shown
in Figure 3.2 - Figure 3.5 . A 2 per cent increased energy use when using scrubbers is
considered.
Figure 3.2 The lifecycle greenhouse gas emissions per tonne cargo transported for RoPax (2000 + GT) by the type of fuel used.
8 Gross tonnage, GT, is a unit less index related to a ship's overall internal volume. 9 Deadweight tonnage, dwt, is a measure of a vessel's weight carrying capacity, and does not include the weight of the ship itself. It is the sum of the maximum weights of cargo, fuel, fresh water, ballast water, provisions, passengers, and crew.
-25
0
25
50
75
100
125
HFO withscrubber
MGO Hybridfuel
HFO withscrubber
MGO LNG Methanol
Consequential LCA apporach Attributional LCA approach
Life c
ycle
GH
G e
mis
sio
ns
(g C
O2-e
q./
tonne k
m)
Well-to-tank Tank to propeller
29
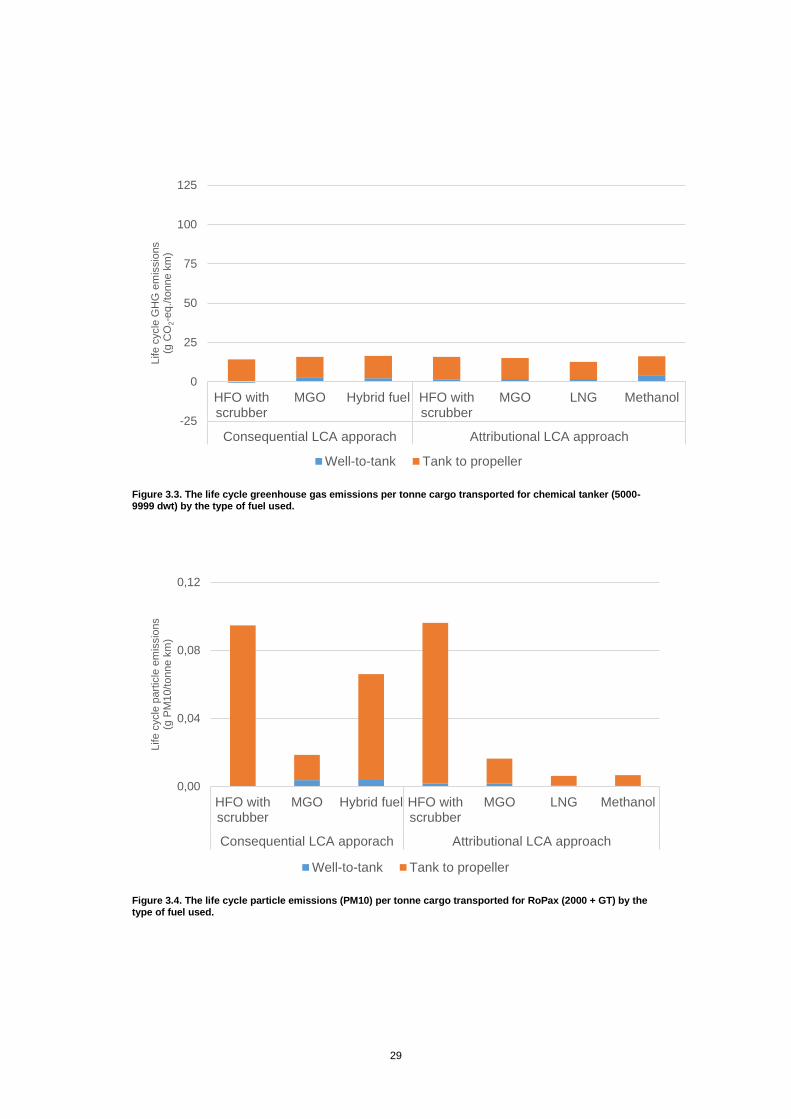
Figure 3.3. The life cycle greenhouse gas emissions per tonne cargo transported for chemical tanker (5000-9999 dwt) by the type of fuel used.
Figure 3.4. The life cycle particle emissions (PM10) per tonne cargo transported for RoPax (2000 + GT) by the type of fuel used.
-25
0
25
50
75
100
125
HFO withscrubber
MGO Hybrid fuel HFO withscrubber
MGO LNG Methanol
Consequential LCA apporach Attributional LCA approach
Life c
ycle
GH
G e
mis
sio
ns
(g C
O2-e
q./
tonne k
m)
Well-to-tank Tank to propeller
0,00
0,04
0,08
0,12
HFO withscrubber
MGO Hybrid fuel HFO withscrubber
MGO LNG Methanol
Consequential LCA apporach Attributional LCA approach
Life c
ycle
part
icle
em
issio
ns
(g P
M10/t
onne k
m)
Well-to-tank Tank to propeller
30
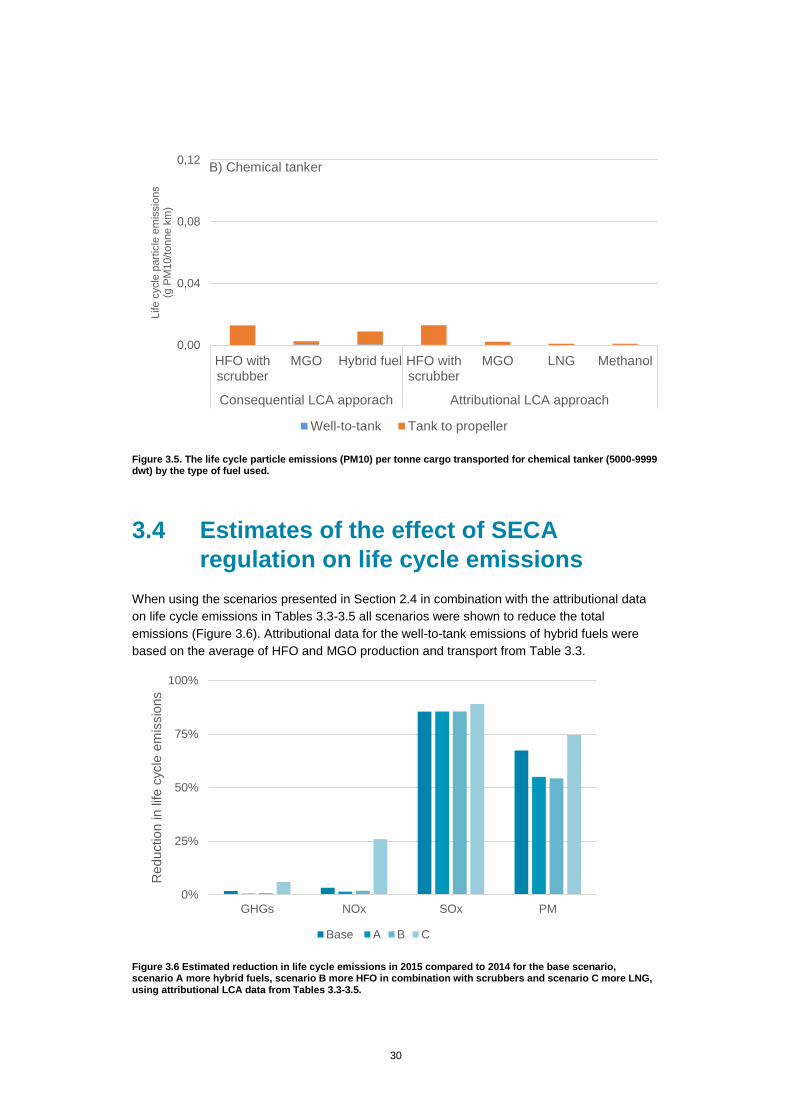
Figure 3.5. The life cycle particle emissions (PM10) per tonne cargo transported for chemical tanker (5000-9999 dwt) by the type of fuel used.
3.4 Estimates of the effect of SECA
regulation on life cycle emissions
When using the scenarios presented in Section 2.4 in combination with the attributional data
on life cycle emissions in Tables 3.3-3.5 all scenarios were shown to reduce the total
emissions (Figure 3.6). Attributional data for the well-to-tank emissions of hybrid fuels were
based on the average of HFO and MGO production and transport from Table 3.3.
Figure 3.6 Estimated reduction in life cycle emissions in 2015 compared to 2014 for the base scenario, scenario A more hybrid fuels, scenario B more HFO in combination with scrubbers and scenario C more LNG, using attributional LCA data from Tables 3.3-3.5.
0,00
0,04
0,08
0,12
HFO withscrubber
MGO Hybrid fuel HFO withscrubber
MGO LNG Methanol
Consequential LCA apporach Attributional LCA approach
Life c
ycle
part
icle
em
issio
ns
(g P
M10/t
onne k
m)
Well-to-tank Tank to propeller
B) Chemical tanker
0%
25%
50%
75%
100%
GHGs NOx SOx PM
Reduction in life c
ycle
em
issio
ns
Base A B C
31
Although all scenarios shows a decrease in emissions it should be noted that the attributional
data do not consider the increase in energy use and emissions which is the result of producing
more low sulphur fuels. This is instead reflected in the consequential data in Table 3.3 and 3.5
which suggests an increase in the emissions for MGO and hybrid fuels. It is not possible to
use the consequential data in combination with the scenarios as the consequential data are
already considering a change in fuel mix (see Figure 3.1).
The small reduction in GHG emissions shown in Figure 3.4 would most likely result in an
increase in GHGs if using a consequential LCA approach. For NOx it can be seen that it is
only scenario C with 25% LNG which results in a large decrease in NOx emissions. For SO2
and particle mass the decrease in life cycle emission is substantial.

32
33
4 Discussion
An ideal way to assess the life cycle impact of implementing the 0.1per cent sulphur regulations
in the SECA area would be to compare the emissions in 2014 and 2015 from the entire fuel life
cycle. In order to do this there is a need to first know which types of fuels used and how much
of the fuels that are used. Second, data on the life cycle emissions from use of these fuels
compared to the previously used fuels are needed. This includes data regarding how emissions
changed from the refineries. Emissions from refineries could be estimated with a tool like the
“CONCAWE EU refining model” when knowing the exact quantities and qualities of crude oil
based fuels used. To get the full picture, data for coming years would also be interesting to study
as the fuels used are continuously changing.
The data available on what fuels are used in the Baltic Sea area is not sufficient for a deeper
analysis of the total picture of emissions after 1st of January 2015. More comprehensive data
will be available when HELCOM update their data for 2015 and still more when the demand
for MRV from ships calling European ports is in place in 2018. There is no comprehensive
information regarding the use of HFO in combination with scrubbers in the Baltic Sea. How-
ever, the use is probably not insignificant as the number of installations and orders for
scrubbers was 122 in July 2014 (Austin, 2015). As an example, Finnlines installed exhaust
gas scrubbers on 15 ships during 2015 (Finnlines, 2016). There will also probably be more
changes in fuels with time. So far only one full year have passed since the regulation came
into effect.
It is clear from measurements in ambient air that the sulphur oxide emissions have decreased
significantly and that particle emissions have decreased to some extent on a mass basis. To
assess the impacts on emissions from using hybrid fuels more measurements of exhaust
emissions are necessary. The only measurement made (Zetterdahl et al., 2016) indicated a
decrease in particle mass of about 50per cent. However from a health aspect it is also
interesting to assess the number of particles. Zetterdahl et al. (2016) did not see the same
reduction in particle number as in particle mass with the hybrid fuel assessed.
The data used in the consequential LCA approach do not include other emissions than CO2. It
is applicable for a change when all the demand is for HFO or MGO, while in reality a mix of
fuels are used. However the data can be seen as representative of the effect of changes
made in refineries even if the magnitude of change is different
Furthermore, there is a number of potential contribution factors that are not considered. For
example potential reduction in storage capacity and the indirect emissions of CO2 to the ocean
by sea water scrubbers. Open loop sea water scrubbers discharge the scrubber water in the
open sea, thereby indirectly releasing CO2 to the atmosphere. Approximately 2 moles of CO2
is formed for every mole of SO2 released. This would increase the CO2 emissions from use of
scrubbers with approximately 1.5 g/MJ HFO combusted and is not included in the result
presented in Tables 3.3-3.5.
Scrubbers, LNG and methanol may reduce the cargo capacity of vessels and thereby increase
the fuel consumption. The energy density is higher for LNG than for methanol, but LNG needs
to be stored in cryogenic tanks at -162 ͦ C (Gullberg and Gahnström, 2011). The cargo capacity
was shown to be reduced by 4per cent in LNG retrofit of a feeder container vessel, whereas
34
another retrofit of a tanker vessel did not result in any reduced cargo capacity (Gullberg and
Gahnström, 2011). It is also possible that a scrubber will affect the stability of the vessel
thereby reducing the cargo capacity. The actual space requirement for scrubbers, LNG and
methanol will vary from vessel to vessel and is difficult to estimate.
It is clear that the emissions of SO2 have decreased since 2015 as well as emissions of
particle mass but to a lesser extent. CO2 emissions are not regulated in the SECA and it is
unclear how the life cycle emissions of CO2 emissions have changed as some fuels show
slightly higher CO2 emissions while others show slightly lower. With the existing data available
for a consequential LCA approach, it seems to be quite small differences in CO2 emissions
between MGO and hybrid fuels and a larger difference between using high sulphur HFO with
scrubber compared to using MGO or hybrid fuel. However, the most important aspect
regarding the CO2 emissions from the assessed option is that none of these leads to a large
reduction. Other resources than crude oil and natural gas will be necessary in the future to
reduce the emissions (Brynolf et al., 2014a, Bengtsson et al., 2012).
35
5 Conclusions
The mix of fuels used in the SECA is affecting the emissions from shipping in various ways.
- Although a strict quantification of the distribution between MGO, hybrid fuels, LNG
and HFO with scrubber is not possible today, it is clear that the changes in total CO2
emissions caused by the possible fuel mix is quite small, and the uncertainties in data
is too large to draw far reaching conclusions from this.
- The total emissions of CO2 from shipping will, for all fossil fuels used, be much larger
than is required to fulfil the European goal to decrease CO2 emissions from shipping
with 40per cent by 2050 compared to the 2005 levels. The changes in emissions from
refineries will not change this picture to a significant degree.
- The total emissions of SOx is significantly reduced.
- The effect of using hybrid fuel instead of MGO seems to counteract the expected
minor decrease in particle emissions due to less HFO used. Less particle emissions
is obtained by the use of LNG or methanol
- The NOx emissions are not affected to any significant degree by change from HFO to
MGO or hybrid fuel. The only fuels that affect NOx emissions are LNG and methanol.

36
37
References
ABS 2015. Fuel switching advisory. Huston: American Bureau of Standards. AITANI, A. M. 2004. Oil Refining and Products. In: CUTLER, J. C. (ed.) Encyclopedia of Energy.
New York: Elsevier. ALFKE, G., IRION, W. W. & NEUWIRTH, O. S. 2007. Oil Refining. Ullmann's Encyclopedia of
Industrial Chemistry. Wiley-VCH Verlag GmbH & Co. KGaA. ALI, L., PRUIR, A, ALI, BEAZIT, 2014. Hybrid fuels - an alternative for the new global emissions
legislation? Mirce cel batran, Naval academy scientific bulletin, XVII, 50-51.
ANDERSON, M., SALO, K. & FRIDELL, E. 2015. Particle- and Gaseous Emissions from an LNG Powered Ship. Environmental Science & Technology, 49, 12568-12575.
ANDERSSON, K., BRYNOLF, S., LINDGREN, F. & WILEWSKA-BIEN, M. (eds.) 2016. Shipping and the Environment - Improving Environmental Performance in Marine Transportation: Springer Verlag.
ANDERSSON, K., MARQUEZ SALAZAR, C, 2015. Methanol as a marine fuel. London: FCBI Energy.
AUSTIN, C. 2015. Marine Scrubbers: The Guide 2015, London, fathom. AVIS, M. J. & BIRCH, C. H. 2009. Impacts on the EU refining industry & markets of IMO
specification changes & other measures to reduce the sulphur content of certain fuels, prepared for the Directorate General Environment. Purvin & Gerts Inc.
BAUMANN, H. & TILLMAN, A.-M. 2004. The hitchhiker's guide to LCA : an orientation in life cycle assessment methodology and application, Lund, Studentlitteratur.
BENGTSSON, S., FRIDELL, E. & ANDERSSON, K. 2012. Environmental assessment of two pathways towards the use of biofuels in shipping. Energy Policy, 44, 451-463.
BREDESON, L., QUICENO-GONZALEZ, R., RIERA-PALOU, X. & HARRISON, A. 2010. Factors driving refinery CO2 intensity, with allocation into products. International Journal of Life Cycle Assessment, 1-10.
BRYNOLF, S. 2014. Environmental assessment of present and future marine fuels. Doctor of Philosophy, Chalmers University of Technology.
BRYNOLF, S., FRIDELL, E. & ANDERSSON, K. 2014a. Environmental assessment of marine fuels: liquefied natural gas, liquefied biogas, methanol and bio-methanol. Journal of Cleaner Production, 74, 86-95.
BRYNOLF, S., MAGNUSSON, M., FRIDELL, E. & ANDERSSON, K. 2014b. Compliance possibilities for the future ECA regulations through the use of abatement technologies or change of fuels. Transportation Research Part D: Transport and Environment, 28, 6-18.
BUHAUG, Ø., CORBETT, J. J., ENDRESEN, Ø., EYRING, V., FABER, J., HANAYAMA, S., LEE, D. S., LEE, D., LINDSTAD, H., MARKOWSKA, A. Z., MJELDE, A., NELISSEN, D., NILSEN, J., PÅLSSON, C., WINEBRAKE, J. J. & WU, W., YOSHIDA, K. 2009. Second IMO GHG Study 2009. London: International Maritime Organization.
CALZADO CATALÁ, F., FUENTE, R. F. D. L., GARDZINSKI, W., KAWULA, J., HILLE, A., LOPEZ, A. I., LAMBERT, G., LEVEQUE, F., LYDE, C., MACKENZIE, A. R. D., MIRABELLA, W., NÚÑEZ, A. O., GONZALEZ, R. Q., REYES, M. S., SINNEN, H.-D., SINNEN, R., VUYST, K. D., REID, A., ROSE, K. D. & FREDRIKSSON, M. 2013. Oil refining in the EU in 2020, with perspectives to 2030. Brussels: Concawe.
CONCAWE 2009. Impacts of Marine Fuels Quality Legisaltion on EU Refineries at the 2020 Horizon, report No. 3/09.
DASTILLUNG, M., FLORES, R, GARDZINSKI, W, LAMBERT, G, MACKENZIE, A, NUNEZ, P REYES, MS, SINNEN, H-D, SINNEN, R, 2009. Impact of marine fuels quality legislation on EU renineries at the 2020 horizon. CONCAWE. Brussels.
DNV GL 2014. LNG as ship fuel. Hamburg: DNV GL. DONES, R., BAUER, C., BOLLIGER, R., BURGER, B., HECK, T., RÖDER, A., EMMENEGGER,
M. F., FRISCHKNECHT, R., JUNGBLUTH, N. & TUCHSCHMID, M. 2007. Life Cycle Inventories of Energy Systems: Results for Current Systems in Switzerland and other UCTE Countries. Villigen and Uster: Paul Scherrer Institut & ESU-services Ltd.
EINEMO, U. 2015. VPS sees big ECA impact on sample distribution. Sustainable shipping [Online], 2015-11-25.
38
EINEMO, U. 2016. Danish air quality measurements confirm positive ECA impact. Sustainable shipping [Online], 2016-02-16. Available:
http://www.sustainableshipping.com/news/140819?tag=45-198779-51616764-0-SS. ELCD CORE DATABASE VERSION II 2010a. Process data set: Heavy fuel oil; from crude oil;
consumption mix, at refinery. 12th of March 2010 ed.: European Commission - Joint Reaserch Centre - LCA Tools, Services and Data.
ELCD CORE DATABASE VERSION II 2010b. Process data set: Light fuel oil; from crude oil; consumption mix, at refinery; 2000 ppm sulphur. 12th of March 2010 ed.: European Commission - Joint Reaserch Centre - LCA Tools, Services and Data.
ENVIRONMENT CANADA. 2015. Marine Diesel Fuel Oil [Online]. Environment Canada,
Emeregencies Sciences and Technology Division. Available: http://www.etc-cte.ec.gc.ca/databases/Oilproperties/pdf/WEB_Marine_Diesel_Fuel_Oil.pdf [Accessed 2015-10-20.
EUROPEAN COMMISSION 2011. WHITE PAPER Roadmap to a Single European Transport Area – Towards a competitive and resource efficient transport system. Brussels.
EUROPEAN COMMISSION 2012. Directive 2012/33/EU of the European Parliament and of the Council of 21 November 2012 amending Council Directive 1999/32/EC as regards the sulphur content of marine fuels. Journal of the European Union.
FINNLINES. 2016. Environment and Safety [Online]. Available: http://www.finnlines.com/company/about_finnlines/environment_and_safety [Accessed 2016-05-24.
FINNVEDEN, G., HAUSCHILD, M. Z., EKVALL, T., GUINÉE, J., HEIJUNGS, R., HELLWEG, S., KOEHLER, A., PENNINGTON, D. & SUH, S. 2009. Recent developments in Life Cycle Assessment. Journal of Environmental Management, 91, 1-21.
FORGET, K. 2016. A Look at Marine Fuel Quality Trends - Present and Future. Sustainable shipping [Online], 2016-01-12.
GULLBERG, M. & GAHNSTRÖM, J. 2011. North European LNG Infrastructure Project - A feasibility study for an LNG filling station infrastructure and test of recommmendations - Baseline report. North European LNG Infrastructure Project - A feasibility study for an LNG filling station infrastructure and test of recommmendations. Gothenburg: ÅF Industry AB &
SSPA Sweden AB. HOCKING, M. B. 2005. Petroleum Refining. Handbook of Chemical Technology and Pollution
Control (Third Edition). San Diego: Academic Press. IMO 2013. MARPOL ANNEX VI AND NTC 2008 WITH GUIDELINES FOR IMPLEMENTATION,
London, CPI Group (UK) Ltd. IPCC 2013. The Physical Science Basis. Contribution of Working Group I to the Fourth
Assessment. Report of the Intergovernmental Panel on Climate Change. In: STOCKER, T. F., QIN, D., PLATTNER, G.-K., TIGNOR, M., ALLEN, S. K., BOSCHUNG, J., NAUELS, A., XIA, Y., BEX, V. & MIDGLEY, P. M. (eds.) Climate Change 2013. Cambridge University
Press, Cambridge, United Kingdom and New York, NY, USA. JALKANEN, J.-P. 2016. RE: Discussion about marine fuel use in the Baltic Sea, 3rd of May 2016,
with Jukka-Pekka Jalkanen, Senior Reseracher, Finnish Meteorological Institute. JOHANSSON, L. & JALKANEN, J.-P. 2015. Emissions from Baltic Sea shipping in 2014 [Online].
HELCOM. Available: http://helcom.fi/baltic-sea-trends/environment-fact-sheets/hazardous-substances/emissions-from-baltic-sea-shipping [Accessed 2015-12-15.
JOHNSEN, T. & MAGERHOLM-FET, A. 1998. Screening Life Cycle Assessment of M/V Color Festival.
JONSON, J. E., JALKANEN, J. P., JOHANSSON, L., GAUSS, M. & VAN DER GON, H. A. C. D. 2015. Model calculations of the effects of present and future emissions of air pollutants from shipping in the Baltic Sea and the North Sea. Atmospheric Chemistry and Physics, 15, 783-798.
LLOYDS REGISTER 2015a. European Union Regulation on Monitoring, Reporting and Verification of Carbon Dioxide from Ships - Lloyds Register Summary. versio 4.0 ed. Southampton: Environment & Sustainability, Lloyd’s Register EMEA, Lloyd’s Register Global Technology Centre.
LLOYDS REGISTER. 2015b. LR established design and construction standards for the use of lowflashpoint fuels (LFPF) with new notation [Online]. Available: http://www.lr.org/en/news/news/LR-establishes-design-and-construction-standards-for-the-use-of-low-flashpoint-fuels-with-new-notation.aspx?utm_source=pardot&utm_medium=email&utm_term=lrmarine&utm_content=news&utm_campaign=LFPF [Accessed 2016-06-01.
39
LLOYDS REGISTER MARINE 2014. Using hybrid fuels for ECA-SOx compliance. Operational guidance for shipowners and operators. Southampton: Fuel Oil Bunker Advisory Service (FOBAS), Lloyd’s Register EMEA, Lloyd’s Register Global Technology Centre.
MAN DIESEL & TURBO 2014. Guidelines for operation on fuels with less than 0.1 % sulphur Copenhagen: MAN Diesel & Turbo.
ODLAND, B. O. 2015. Hybrid ULSFO fuels presented at IBA New Fuels Forum. Veritas Petroleum Services (VSP).
PETTERSSON, P. 2016. RE: Discussion about the use of marine fuel in the Baltic Sea and North Sea ECA the 29th of April 2016 with Patrik Pettersson, Vice President Marketing and Sales, Stena Oil.
PIHL-KARLSSON, G. 2015. Minskad halt av svavel i luft efter skärpta regler för fartygsbränsle (Decreased conctentration of sulphur in the air following stricter regulation for marine fuel) [Online]. Stockholm: IVL Svenska Miljöinstitutet. Available: http://www.ivl.se/toppmeny/pressrum/pressmeddelanden/pressmeddelande---arkiv/2015-11-05-minskad-halt-av-svavel-i-luft-efter-skarpta-regler-for-fartygsbransle.html [Accessed 2015-11-05.
REID, A. 2016. RE: Discussion about the use of marine fuel in the Baltic Sea and North Sea ECA and how refineries have been affected by the marine sulphur regulation, the 29th of April 2016 with Alain Reid, Science Executive Refining Technology, CONCAWE.
SAURAMA, A., HOLMA, E, TAMMI, K, 2006. Baltic Port List 2006. Turku: Centre for Maritime Studies, University of Turku.
SMITH, T. W. P., JALKANEN, J. P., ANDERSON, B. A., CORBETT, J. J., FABER, J., HANAYAMA, S., O'KEEFFE, E., PARKER, S., JOHANSSON, L., ALDOUS, L., RAUCCI, C., TRAUT, M., ETTINGER, S., NELISSEN, D., LEE, D. S., NG, S., AGRAWAL, A., WINEBRAKE, J. J., HOEN, M., CHESWORTH, S. & PANDEY, A. 2014. Third IMO GHG Study 2014. London, UK: International Maritime Organization (IMO).
SOHLBERG, V. 2016. RE: Discussion about the sulphur in fuel recorded by the Swedish Chemicals Agency, the 16th of May 2016, with Vanja Sohlberg Inspector at the Swedish Chemicals Agency.
ST1 2014. Product data sheet, Distillate MDF WRD (DMC) 0.05% S. ST1 2015. Product data sheet, St1 Bunker (RMA) 0.1% S SWEDISH ENERGY AGENCY 2015. Transportsektorns energianvändning 2014. TAMM, E. 2016. RE: Discussion about the use of marine fuel in the Baltic Sea and North Sea ECA
and how refineries have been affected by the marine sulphur regulation, the 18th of April 2016 with Ebba Tamm, SPBI.
TILLMAN, A.-M. 2000. Significance of decision-making for LCA methodology. Environmental Impact Assessment Review, 20, 113-123.
ZETTERDAHL, M., MOLDANOVÁ, J., PEI, X., PATHAK, R. K. & DEMIRDJIAN, B. 2016. Impact of the 0.1% fuel sulfur content limit in SECA on particle and gaseous emissions – Case of low-sulfur residual marine fuel oil (manuscript in preparation). Gothenburg: Shipping and Marine Technology, Chalmers University of Technology.

40
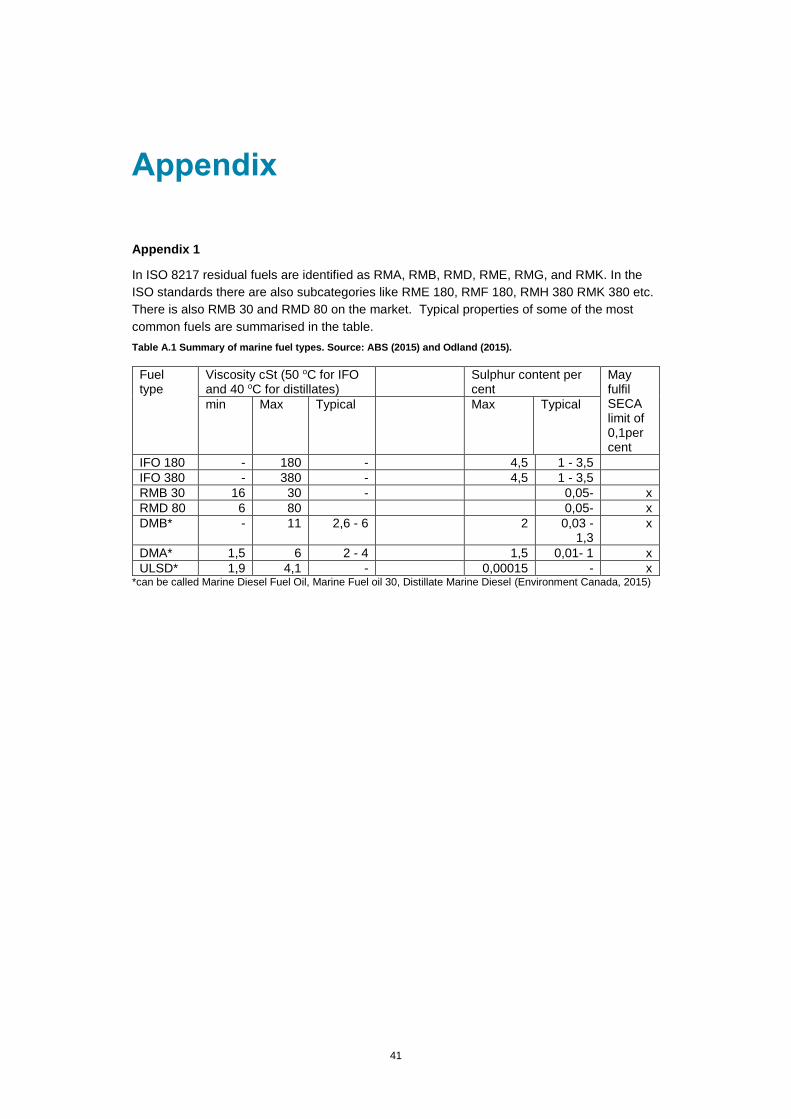
41
Appendix
Appendix 1
In ISO 8217 residual fuels are identified as RMA, RMB, RMD, RME, RMG, and RMK. In the
ISO standards there are also subcategories like RME 180, RMF 180, RMH 380 RMK 380 etc.
There is also RMB 30 and RMD 80 on the market. Typical properties of some of the most
common fuels are summarised in the table.
Table A.1 Summary of marine fuel types. Source: ABS (2015) and Odland (2015).
Fuel type
Viscosity cSt (50 oC for IFO and 40 oC for distillates)
Sulphur content per cent
May fulfil SECA limit of 0,1per cent
min Max Typical Max Typical
IFO 180 - 180 - 4,5 1 - 3,5
IFO 380 - 380 - 4,5 1 - 3,5
RMB 30 16 30 - 0,05- x
RMD 80 6 80 0,05- x
DMB* - 11 2,6 - 6 2 0,03 - 1,3
x
DMA* 1,5 6 2 - 4 1,5 0,01- 1 x
ULSD* 1,9 4,1 - 0,00015 - x *can be called Marine Diesel Fuel Oil, Marine Fuel oil 30, Distillate Marine Diesel (Environment Canada, 2015)
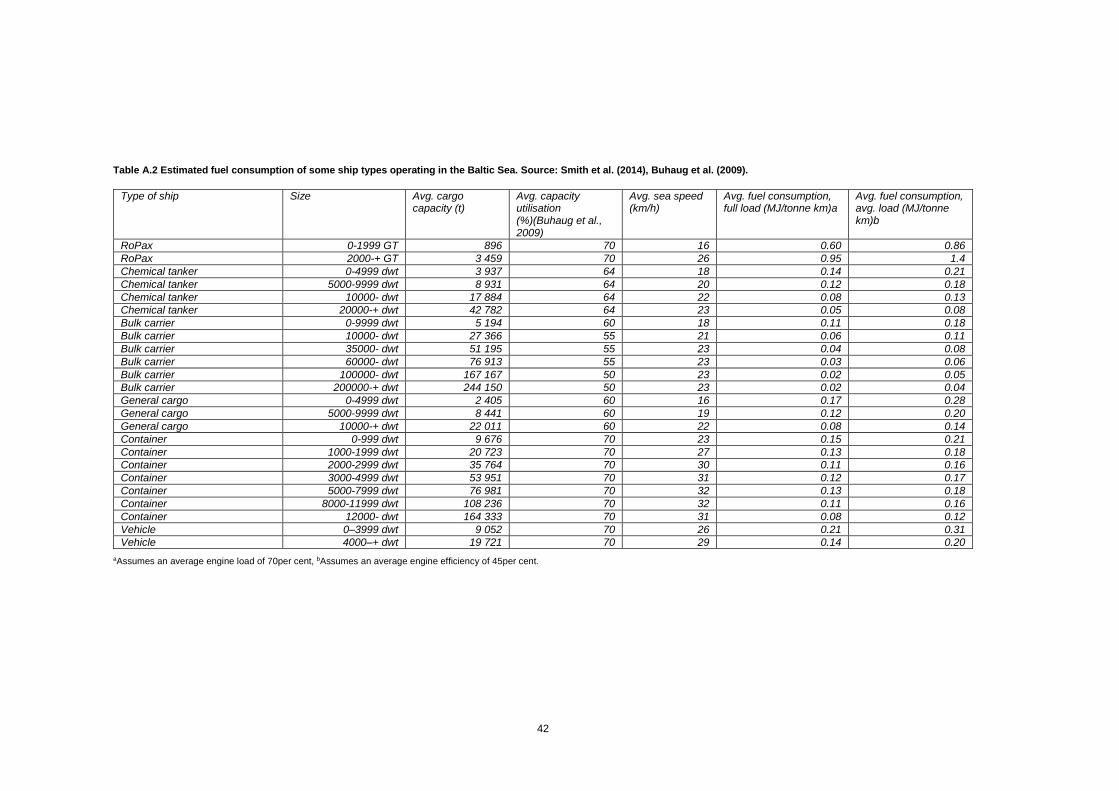
42
Table A.2 Estimated fuel consumption of some ship types operating in the Baltic Sea. Source: Smith et al. (2014), Buhaug et al. (2009).
Type of ship Size Avg. cargo capacity (t)
Avg. capacity utilisation (%)(Buhaug et al., 2009)
Avg. sea speed (km/h)
Avg. fuel consumption, full load (MJ/tonne km)a
Avg. fuel consumption, avg. load (MJ/tonne km)b
RoPax 0-1999 GT 896 70 16 0.60 0.86
RoPax 2000-+ GT 3 459 70 26 0.95 1.4
Chemical tanker 0-4999 dwt 3 937 64 18 0.14 0.21
Chemical tanker 5000-9999 dwt 8 931 64 20 0.12 0.18
Chemical tanker 10000- dwt 17 884 64 22 0.08 0.13
Chemical tanker 20000-+ dwt 42 782 64 23 0.05 0.08
Bulk carrier 0-9999 dwt 5 194 60 18 0.11 0.18
Bulk carrier 10000- dwt 27 366 55 21 0.06 0.11
Bulk carrier 35000- dwt 51 195 55 23 0.04 0.08
Bulk carrier 60000- dwt 76 913 55 23 0.03 0.06
Bulk carrier 100000- dwt 167 167 50 23 0.02 0.05
Bulk carrier 200000-+ dwt 244 150 50 23 0.02 0.04
General cargo 0-4999 dwt 2 405 60 16 0.17 0.28
General cargo 5000-9999 dwt 8 441 60 19 0.12 0.20
General cargo 10000-+ dwt 22 011 60 22 0.08 0.14
Container 0-999 dwt 9 676 70 23 0.15 0.21
Container 1000-1999 dwt 20 723 70 27 0.13 0.18
Container 2000-2999 dwt 35 764 70 30 0.11 0.16
Container 3000-4999 dwt 53 951 70 31 0.12 0.17
Container 5000-7999 dwt 76 981 70 32 0.13 0.18
Container 8000-11999 dwt 108 236 70 32 0.11 0.16
Container 12000- dwt 164 333 70 31 0.08 0.12
Vehicle 0–3999 dwt 9 052 70 26 0.21 0.31
Vehicle 4000–+ dwt 19 721 70 29 0.14 0.20
aAssumes an average engine load of 70per cent, bAssumes an average engine efficiency of 45per cent.

Trafikanalys är en kunskapsmyndighet för transportpolitiken. Vi analyserar och utvärderar föreslagna och genomförda åtgärder inom transportpolitiken. Vi ansvarar även för officiell statistik inom områdena transporter och kommunika-tioner. Trafikanalys bildades den 1 april 2010 och har huvudkontor i Stockholm samt kontor i Östersund.
TrafikanalysTorsgatan 30
113 21 Stockholm
Tel 010 414 42 00Fax 010 414 42 10 [email protected]